influence of shear rate on undrained vane shear …¬‚uence of shear rate on undrained vane shear...
TRANSCRIPT

Dow
nloa
ded
from
asc
elib
rary
.org
by
USP
- U
nive
rsid
ade
De
Sao
Paul
o on
06/
18/1
4. C
opyr
ight
ASC
E. F
or p
erso
nal u
se o
nly;
all
righ
ts r
eser
ved.
Influence of Shear Rate on Undrained Vane Shear Strengthof Organic Harbor Mud
Benjamin Friedrich Schlue, Ph.D.1; Tobias Moerz, Ph.D.2; and Stefan Kreiter, Ph.D.3
Abstract: Dredging operations in European harbors for maintenance of navigable water depth produce vast amounts of harbor mud.Between 2005 and 2007, the second largest harbor construction project in Germany was designed as a pilot study to use dredged harbormud as backfill material to avoid expensive disposal or ex situ treatment. During this project, a partial collapse of the backfill highlightedthe need for an improved assessment of undrained shear strength of naturally occurring liquid harbor mud. Using vane shear testing, thisstudy evaluates the effect of shear rate on the undrained shear strength of harbor mud. It is shown that measured values for both peak andresidual shear strength are significantly influenced by shear rate effects. Furthermore, the influence of shear rate on the peak shear strengthis found to be independent of water content while the influence of the shear rate on the residual shear strength strongly depends on watercontent. New shear rate dependent correction factors � are proposed using the test results and the observed time to failure in the harborbasin. The proposed correction leads to significant lower design undrained shear strengths than the classical Bjerrum correction and wouldhave predicted the failure during the construction.
DOI: 10.1061/�ASCE�GT.1943-5606.0000356
CE Database subject headings: Mud; Clays; Shear tests; Organic matter; Shear strength; Dredging; Harbors; Europe.
Author keywords: Dredged mud; Soft clay; Vane shear test; Time effects; Correction factor; Shear rate effects.
Introduction
The major North Sea tidal estuaries of the Ems, Weser, and ElbeRivers are characterized by vast accumulations of organic-richmud derived from marine and river suspension transport. Highrates of mud accumulation in these dynamic systems are drivenby a complex interaction of variable river discharge and tide andwind induced processes. Increased mud accumulation is promotedby tidal asymmetry and particle flocculation in the freshwater/saltwater mixing zone �Schrottke et al. 2006�. The highly engi-neered estuaries of the Ems, Weser, and Elbe Rivers belong to themost frequented waterways worldwide and host a number of im-portant ports. Deepening the navigation channel in these riverscauses an artificial rise in the tidal range and an increase in thesuspension load. The small-grained material is carried through thelocks into the basins of the harbors in northern Germany where itsettles as organic harbor mud. This mud must be regularlydredged out of the harbor basins in order to maintain the naviga-tional depth. To avoid costly disposal of this often contaminated
1Project Manager, ARCADIS Deutschland GmbH, Europaplatz 3,64293 Darmstadt, Germany �corresponding author�. E-mail: [email protected]
2Professor, Dept. of Marine Engineering Geology, MARUM-Centerfor Marine Environmental Sciences, Univ. of Bremen, Leobener Str.,MARUM-Building, 28359 Bremen, Germany.
3Postdoc, Dept. of Marine Engineering Geology, MARUM-Center forMarine Environmental Sciences, Univ. of Bremen, Leobener Str.,MARUM-Building, 28359 Bremen, Germany.
Note. This manuscript was submitted on February 28, 2008; approvedon March 17, 2010; published online on March 19, 2010. Discussionperiod open until March 1, 2011; separate discussions must be submittedfor individual papers. This paper is part of the Journal of Geotechnicaland Geoenvironmental Engineering, Vol. 136, No. 10, October 1, 2010.
©ASCE, ISSN 1090-0241/2010/10-1437–1447/$25.00.JOURNAL OF GEOTECHNICAL AND GEO
J. Geotech. Geoenviron. Eng.
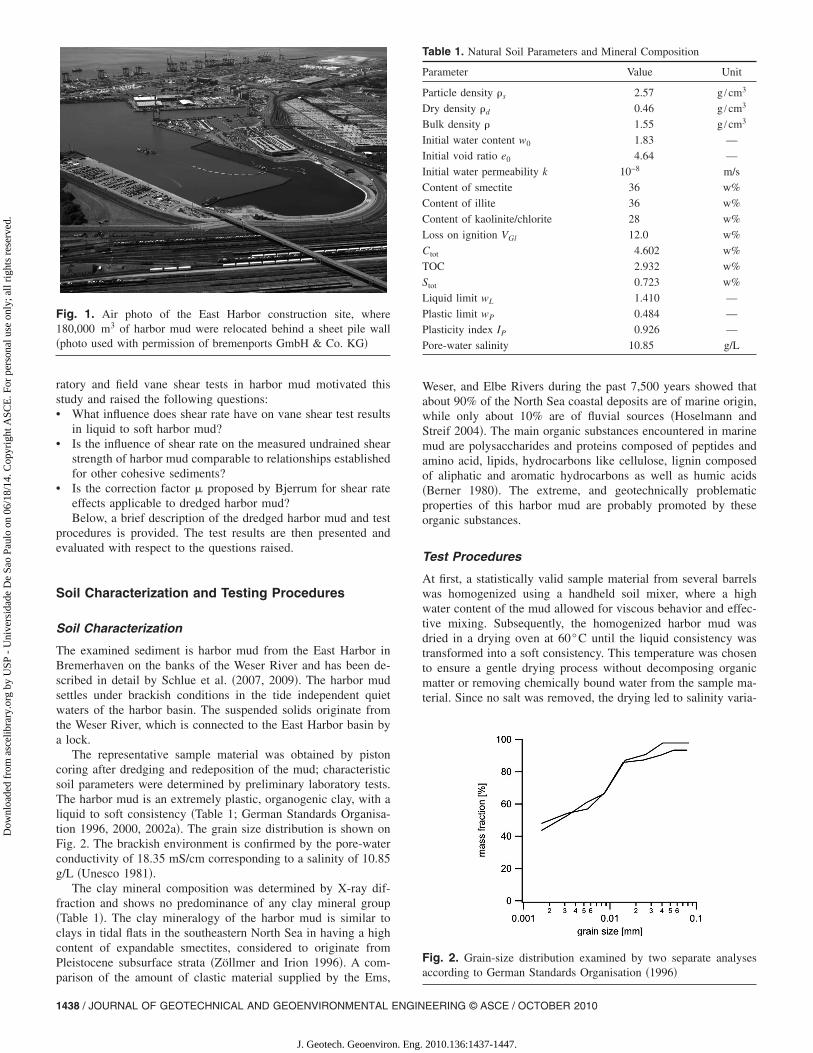
material, the dredged harbor mud is increasingly reused on-site asbackfill and construction material, a procedure used during thebackfilling of the harbor basin in the East Harbor of the interna-tional port area of the Free Hanseatic City of Bremen in Bremer-haven, Germany �Metzen et al. 2006�. During this excavation andconstruction project, a total of about 180,000 m3 of soft to liquidharbor mud was relocated and used as backfill behind a heavysheet pile structure that will serve as a new wharf �Fig. 1�, creat-ing 14 acres of new harbor area �Schlue et al. 2007, 2009�. Toaccelerate the consolidation of the mud, a layer of geotextile andseveral thin sand layers were placed on top of the mud backfill.During the placement of the sand layers, larger parts of the back-filling area underwent vertical displacements indicating a partialcollapse of the mud layer; nevertheless, the project was finishedsuccessfully in 2007. The described difficulties over the course ofthis project raised several questions regarding the determinationof the undrained shear strength in harbor mud, which this studywould like to address.
Vane shear testing played an important role during the plan-ning and construction phase of the East Harbor extension project.It is widely used for its simplicity, speed and relative cost, and itis the only method commonly used in both laboratory and fieldsettings in contrast to other soft soil test methods such as fall conepenetrometers or full-flow penetrometers �Zreik et al. 1995; Stew-art and Randolph 1994�. However, the results of vane shear testsare affected by many factors such as shear rate, strength aniso-tropy or rod friction effects �Aas 1965; Flaate 1966; Wiesel 1973;Menzies and Mailey 1976; Torstensson 1977; Biscontin andPestana 2001; Schlue et al. 2007�. Shear rate or peripheral veloc-ity is among the most important factors affecting vane shear testresults but there is currently no common international standard forperipheral velocity or rotation rate in vane shear tests �Leroueiland Marques 1996�.
The problems in deriving the actual soil resistance from labo-
ENVIRONMENTAL ENGINEERING © ASCE / OCTOBER 2010 / 1437
2010.136:1437-1447.
Dow
nloa
ded
from
asc
elib
rary
.org
by
USP
- U
nive
rsid
ade
De
Sao
Paul
o on
06/
18/1
4. C
opyr
ight
ASC
E. F
or p
erso
nal u
se o
nly;
all
righ
ts r
eser
ved.
ratory and field vane shear tests in harbor mud motivated thisstudy and raised the following questions:• What influence does shear rate have on vane shear test results
in liquid to soft harbor mud?• Is the influence of shear rate on the measured undrained shear
strength of harbor mud comparable to relationships establishedfor other cohesive sediments?
• Is the correction factor � proposed by Bjerrum for shear rateeffects applicable to dredged harbor mud?Below, a brief description of the dredged harbor mud and test
procedures is provided. The test results are then presented andevaluated with respect to the questions raised.
Soil Characterization and Testing Procedures
Soil Characterization
The examined sediment is harbor mud from the East Harbor inBremerhaven on the banks of the Weser River and has been de-scribed in detail by Schlue et al. �2007, 2009�. The harbor mudsettles under brackish conditions in the tide independent quietwaters of the harbor basin. The suspended solids originate fromthe Weser River, which is connected to the East Harbor basin bya lock.
The representative sample material was obtained by pistoncoring after dredging and redeposition of the mud; characteristicsoil parameters were determined by preliminary laboratory tests.The harbor mud is an extremely plastic, organogenic clay, with aliquid to soft consistency �Table 1; German Standards Organisa-tion 1996, 2000, 2002a�. The grain size distribution is shown onFig. 2. The brackish environment is confirmed by the pore-waterconductivity of 18.35 mS/cm corresponding to a salinity of 10.85g/L �Unesco 1981�.
The clay mineral composition was determined by X-ray dif-fraction and shows no predominance of any clay mineral group�Table 1�. The clay mineralogy of the harbor mud is similar toclays in tidal flats in the southeastern North Sea in having a highcontent of expandable smectites, considered to originate fromPleistocene subsurface strata �Zöllmer and Irion 1996�. A com-
Fig. 1. Air photo of the East Harbor construction site, where180,000 m3 of harbor mud were relocated behind a sheet pile wall�photo used with permission of bremenports GmbH & Co. KG�
parison of the amount of clastic material supplied by the Ems,
1438 / JOURNAL OF GEOTECHNICAL AND GEOENVIRONMENTAL ENGIN
J. Geotech. Geoenviron. Eng.
Weser, and Elbe Rivers during the past 7,500 years showed thatabout 90% of the North Sea coastal deposits are of marine origin,while only about 10% are of fluvial sources �Hoselmann andStreif 2004�. The main organic substances encountered in marinemud are polysaccharides and proteins composed of peptides andamino acid, lipids, hydrocarbons like cellulose, lignin composedof aliphatic and aromatic hydrocarbons as well as humic acids�Berner 1980�. The extreme, and geotechnically problematicproperties of this harbor mud are probably promoted by theseorganic substances.
Test Procedures
At first, a statistically valid sample material from several barrelswas homogenized using a handheld soil mixer, where a highwater content of the mud allowed for viscous behavior and effec-tive mixing. Subsequently, the homogenized harbor mud wasdried in a drying oven at 60°C until the liquid consistency wastransformed into a soft consistency. This temperature was chosento ensure a gentle drying process without decomposing organicmatter or removing chemically bound water from the sample ma-terial. Since no salt was removed, the drying led to salinity varia-
Table 1. Natural Soil Parameters and Mineral Composition
Parameter Value Unit
Particle density �s 2.57 g /cm3
Dry density �d 0.46 g /cm3
Bulk density � 1.55 g /cm3
Initial water content w0 1.83 —
Initial void ratio e0 4.64 —
Initial water permeability k 10−8 m/s
Content of smectite 36 w%
Content of illite 36 w%
Content of kaolinite/chlorite 28 w%
Loss on ignition VGl 12.0 w%
Ctot 4.602 w%
TOC 2.932 w%
Stot 0.723 w%
Liquid limit wL 1.410 —
Plastic limit wP 0.484 —
Plasticity index IP 0.926 —
Pore-water salinity 10.85 g/L
Fig. 2. Grain-size distribution examined by two separate analysesaccording to German Standards Organisation �1996�
EERING © ASCE / OCTOBER 2010
2010.136:1437-1447.
Dow
nloa
ded
from
asc
elib
rary
.org
by
USP
- U
nive
rsid
ade
De
Sao
Paul
o on
06/
18/1
4. C
opyr
ight
ASC
E. F
or p
erso
nal u
se o
nly;
all
righ
ts r
eser
ved.
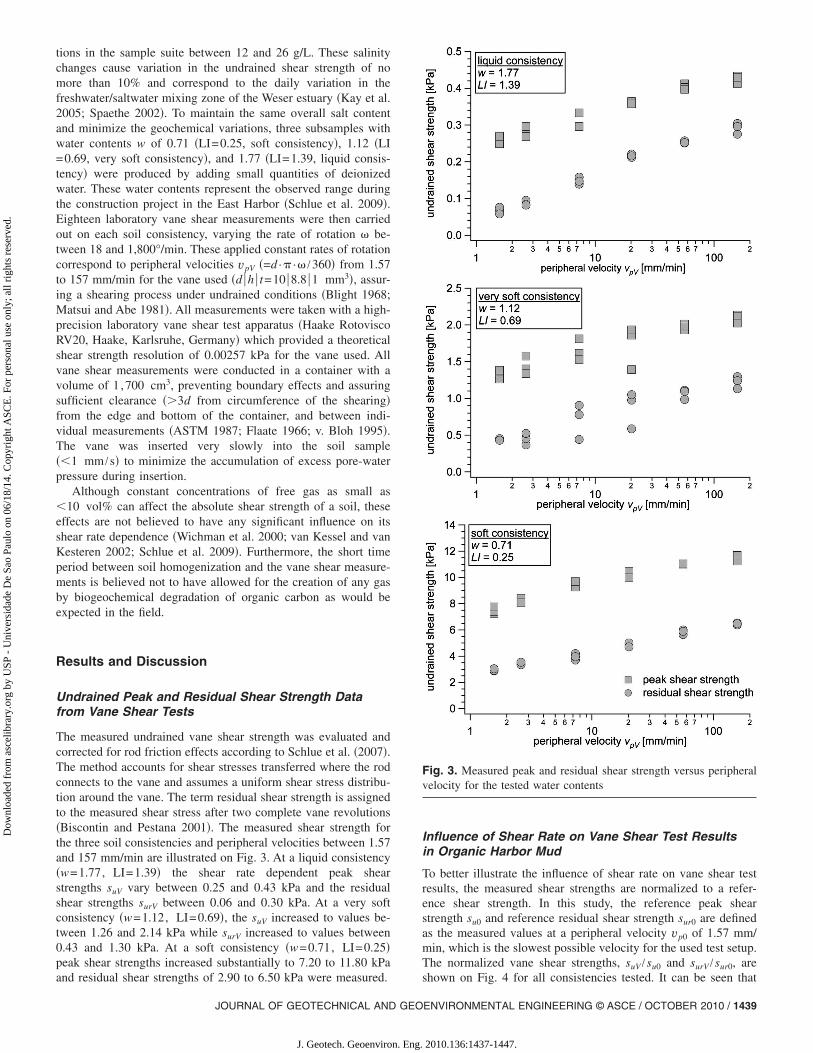
tions in the sample suite between 12 and 26 g/L. These salinitychanges cause variation in the undrained shear strength of nomore than 10% and correspond to the daily variation in thefreshwater/saltwater mixing zone of the Weser estuary �Kay et al.2005; Spaethe 2002�. To maintain the same overall salt contentand minimize the geochemical variations, three subsamples withwater contents w of 0.71 �LI=0.25, soft consistency�, 1.12 �LI=0.69, very soft consistency�, and 1.77 �LI=1.39, liquid consis-tency� were produced by adding small quantities of deionizedwater. These water contents represent the observed range duringthe construction project in the East Harbor �Schlue et al. 2009�.Eighteen laboratory vane shear measurements were then carriedout on each soil consistency, varying the rate of rotation � be-tween 18 and 1,800°/min. These applied constant rates of rotationcorrespond to peripheral velocities vpV �=d ·� ·� /360� from 1.57to 157 mm/min for the vane used �d �h � t=10 �8.8 �1 mm3�, assur-ing a shearing process under undrained conditions �Blight 1968;Matsui and Abe 1981�. All measurements were taken with a high-precision laboratory vane shear test apparatus �Haake RotoviscoRV20, Haake, Karlsruhe, Germany� which provided a theoreticalshear strength resolution of 0.00257 kPa for the vane used. Allvane shear measurements were conducted in a container with avolume of 1 ,700 cm3, preventing boundary effects and assuringsufficient clearance ��3d from circumference of the shearing�from the edge and bottom of the container, and between indi-vidual measurements �ASTM 1987; Flaate 1966; v. Bloh 1995�.The vane was inserted very slowly into the soil sample��1 mm /s� to minimize the accumulation of excess pore-waterpressure during insertion.
Although constant concentrations of free gas as small as�10 vol% can affect the absolute shear strength of a soil, theseeffects are not believed to have any significant influence on itsshear rate dependence �Wichman et al. 2000; van Kessel and vanKesteren 2002; Schlue et al. 2009�. Furthermore, the short timeperiod between soil homogenization and the vane shear measure-ments is believed not to have allowed for the creation of any gasby biogeochemical degradation of organic carbon as would beexpected in the field.
Results and Discussion
Undrained Peak and Residual Shear Strength Datafrom Vane Shear Tests
The measured undrained vane shear strength was evaluated andcorrected for rod friction effects according to Schlue et al. �2007�.The method accounts for shear stresses transferred where the rodconnects to the vane and assumes a uniform shear stress distribu-tion around the vane. The term residual shear strength is assignedto the measured shear stress after two complete vane revolutions�Biscontin and Pestana 2001�. The measured shear strength forthe three soil consistencies and peripheral velocities between 1.57and 157 mm/min are illustrated on Fig. 3. At a liquid consistency�w=1.77, LI=1.39� the shear rate dependent peak shearstrengths suV vary between 0.25 and 0.43 kPa and the residualshear strengths surV between 0.06 and 0.30 kPa. At a very softconsistency �w=1.12, LI=0.69�, the suV increased to values be-tween 1.26 and 2.14 kPa while surV increased to values between0.43 and 1.30 kPa. At a soft consistency �w=0.71, LI=0.25�peak shear strengths increased substantially to 7.20 to 11.80 kPa
and residual shear strengths of 2.90 to 6.50 kPa were measured.JOURNAL OF GEOTECHNICAL AND GEO
J. Geotech. Geoenviron. Eng.
Influence of Shear Rate on Vane Shear Test Resultsin Organic Harbor Mud
To better illustrate the influence of shear rate on vane shear testresults, the measured shear strengths are normalized to a refer-ence shear strength. In this study, the reference peak shearstrength su0 and reference residual shear strength sur0 are definedas the measured values at a peripheral velocity vp0 of 1.57 mm/min, which is the slowest possible velocity for the used test setup.The normalized vane shear strengths, suV /su0 and surV /sur0, are
Fig. 3. Measured peak and residual shear strength versus peripheralvelocity for the tested water contents
shown on Fig. 4 for all consistencies tested. It can be seen that
ENVIRONMENTAL ENGINEERING © ASCE / OCTOBER 2010 / 1439
2010.136:1437-1447.

Dow
nloa
ded
from
asc
elib
rary
.org
by
USP
- U
nive
rsid
ade
De
Sao
Paul
o on
06/
18/1
4. C
opyr
ight
ASC
E. F
or p
erso
nal u
se o
nly;
all
righ
ts r
eser
ved.
both the undrained peak and residual shear strength increase sig-nificantly with increasing peripheral velocity. The measured suV
for the highest peripheral velocity of 157 mm/min is 55 to 65%higher than that determined at the reference velocity vp0, which isconsistent for the three consistencies tested. In contrast, the in-crease in surV varies between 120% at a soft consistency and350% at a liquid consistency �Fig. 4� showing that for liquid tosoft consistencies, the residual shear strength is even more sensi-tive to changes in peripheral velocity than the peak shear strength.Our findings are consistent with those of other studies, e.g., Bis-contin and Pestana �2001�. However, Biscontin and Pestana�2001� did not observe any shear rate influence on the residual
Fig. 4. Normalized peak and residual shear strength versusperipheral velocity for the tested water contents; curve fits accordingto Eqs. �1� and �2�
shear strength of slightly cemented model soil consisting of ka-
1440 / JOURNAL OF GEOTECHNICAL AND GEOENVIRONMENTAL ENGIN
J. Geotech. Geoenviron. Eng.
olinite, bentonite, and fly ash. The influence of shear rate on theresidual shear strength of harbor mud observed in this study canbe explained by the increasingly fluid like soil behavior of de-creasing viscosity with rising water content. The harbor mud be-haves more and more like a sediment suspension followingrheological models rather than exhibiting a unique coefficient offriction in the residual state. It is known that transferable shearstresses within sediment suspensions as well as their viscosity arestrongly dependent on shear rate and water content �Verreet andBerlamont 1988; Coussot 1997; Whitehouse et al. 2000; Winter-werp and v. Kersteren 2004�.
The dependence between the shear rate and measured shearstrength has been traditionally interpreted according to a power orsemilogarithmic law
Power law su/su0 = �vp/vp0�� �1�
Semilogarithmic law su/su0 = 1 + � log�vp/vp0� �2�
where � , �=characteristic soil parameters.Fig. 4 shows both power-law and semilogarithmic curve fits
according to Eqs. �1� and �2� for the measured normalized shearstrengths. It can be observed that the undrained peak shearstrength can be accurately described by both curve fits though thesemilogarithmic fit is slightly better. Only at a liquid consistencyis the undrained residual shear strength significantly better de-scribed by the semi logarithmic curve fit.
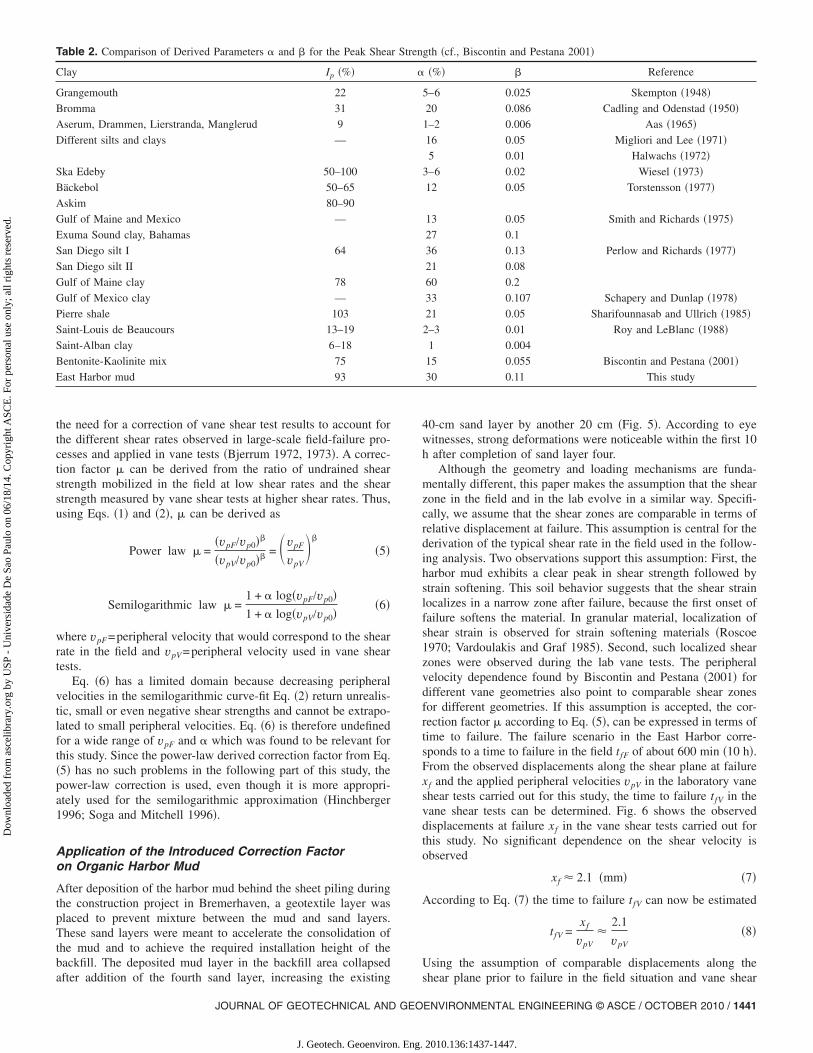
For peak shear strength, the evaluated parameter � from thesemi logarithmic curve fit varies between 0.28 and 0.33, whileunder the power-law curve fit, the evaluated parameter � variesbetween 0.10 and 0.12. These are comparatively high values andcorrespond to an increase in measured undrained peak shearstrength of approximately 30% per 10-fold increase in peripheralvelocity. The harbor mud soil parameters � and � are listed inTable 2 for comparison with those found in other studies. Fromthis it can be seen that the influence of shear rate on the peakshear strength of the tested harbor mud is comparable to that fromthe Gulf of Mexico clay studied by Schapery and Dunlap �1978�and to Exuma Sound clay from the Bahamas studied by Smithand Richards �1975�.
In contrast to the peak shear strength, the measured parameters� and � for residual shear strength are also dependent on consis-tency because of the above mentioned viscosity effects dominat-ing the behavior after mobilization of the peak shear strength athigher water contents and liquidity indices. Linear correlationsbetween liquidity index LI and the shear rate dependence of theresidual shear strength were tested for the dredged harbor mud,leading to the following equations:
� = 0.144LI + 0.14 �− � �3�
� = 1.04LI + 0.277 �− � �4�
For 0.25LI1.39 these equations yield values between0.53�1.72 and 0.18�0.34, corresponding to an increasein measured residual shear strength of 50 to 170% per 10-foldincrease in peripheral velocity. As can be seen from Fig. 4, withdecreasing w and LI, the parameters � and � approach the valuesfound for the peak shear strength.
Derivation of a Correction Factor to account for ShearRate Effects on Measured Vane Shear Strength
A significant shear rate dependence of undrained shear strength
has been demonstrated by this study. This dependence underlinesEERING © ASCE / OCTOBER 2010
2010.136:1437-1447.
Dow
nloa
ded
from
asc
elib
rary
.org
by
USP
- U
nive
rsid
ade
De
Sao
Paul
o on
06/
18/1
4. C
opyr
ight
ASC
E. F
or p
erso
nal u
se o
nly;
all
righ
ts r
eser
ved.
the need for a correction of vane shear test results to account forthe different shear rates observed in large-scale field-failure pro-cesses and applied in vane tests �Bjerrum 1972, 1973�. A correc-tion factor � can be derived from the ratio of undrained shearstrength mobilized in the field at low shear rates and the shearstrength measured by vane shear tests at higher shear rates. Thus,using Eqs. �1� and �2�, � can be derived as
Power law � =�vpF/vp0��
�vpV/vp0�� = �vpF
vpV��
�5�
Semilogarithmic law � =1 + � log�vpF/vp0�1 + � log�vpV/vp0�
�6�
where vpF=peripheral velocity that would correspond to the shearrate in the field and vpV=peripheral velocity used in vane sheartests.
Eq. �6� has a limited domain because decreasing peripheralvelocities in the semilogarithmic curve-fit Eq. �2� return unrealis-tic, small or even negative shear strengths and cannot be extrapo-lated to small peripheral velocities. Eq. �6� is therefore undefinedfor a wide range of vpF and � which was found to be relevant forthis study. Since the power-law derived correction factor from Eq.�5� has no such problems in the following part of this study, thepower-law correction is used, even though it is more appropri-ately used for the semilogarithmic approximation �Hinchberger1996; Soga and Mitchell 1996�.
Application of the Introduced Correction Factoron Organic Harbor Mud
After deposition of the harbor mud behind the sheet piling duringthe construction project in Bremerhaven, a geotextile layer wasplaced to prevent mixture between the mud and sand layers.These sand layers were meant to accelerate the consolidation ofthe mud and to achieve the required installation height of thebackfill. The deposited mud layer in the backfill area collapsed
Table 2. Comparison of Derived Parameters � and � for the Peak Shea
Clay Ip �%�
Grangemouth 22
Bromma 31
Aserum, Drammen, Lierstranda, Manglerud 9
Different silts and clays —
Ska Edeby 50–100
Bäckebol 50–65
Askim 80–90
Gulf of Maine and Mexico —
Exuma Sound clay, Bahamas
San Diego silt I 64
San Diego silt II
Gulf of Maine clay 78
Gulf of Mexico clay —
Pierre shale 103
Saint-Louis de Beaucours 13–19
Saint-Alban clay 6–18
Bentonite-Kaolinite mix 75
East Harbor mud 93
after addition of the fourth sand layer, increasing the existing
JOURNAL OF GEOTECHNICAL AND GEO
J. Geotech. Geoenviron. Eng.
40-cm sand layer by another 20 cm �Fig. 5�. According to eyewitnesses, strong deformations were noticeable within the first 10h after completion of sand layer four.
Although the geometry and loading mechanisms are funda-mentally different, this paper makes the assumption that the shearzone in the field and in the lab evolve in a similar way. Specifi-cally, we assume that the shear zones are comparable in terms ofrelative displacement at failure. This assumption is central for thederivation of the typical shear rate in the field used in the follow-ing analysis. Two observations support this assumption: First, theharbor mud exhibits a clear peak in shear strength followed bystrain softening. This soil behavior suggests that the shear strainlocalizes in a narrow zone after failure, because the first onset offailure softens the material. In granular material, localization ofshear strain is observed for strain softening materials �Roscoe1970; Vardoulakis and Graf 1985�. Second, such localized shearzones were observed during the lab vane tests. The peripheralvelocity dependence found by Biscontin and Pestana �2001� fordifferent vane geometries also point to comparable shear zonesfor different geometries. If this assumption is accepted, the cor-rection factor � according to Eq. �5�, can be expressed in terms oftime to failure. The failure scenario in the East Harbor corre-sponds to a time to failure in the field tfF of about 600 min �10 h�.From the observed displacements along the shear plane at failurexf and the applied peripheral velocities vpV in the laboratory vaneshear tests carried out for this study, the time to failure tfV in thevane shear tests can be determined. Fig. 6 shows the observeddisplacements at failure xf in the vane shear tests carried out forthis study. No significant dependence on the shear velocity isobserved
xf � 2.1 �mm� �7�
According to Eq. �7� the time to failure tfV can now be estimated
tfV =xf
vpV�
2.1
vpV�8�
Using the assumption of comparable displacements along the
gth �cf., Biscontin and Pestana 2001�
�%� � Reference
5–6 0.025 Skempton �1948�
20 0.086 Cadling and Odenstad �1950�
1–2 0.006 Aas �1965�
16 0.05 Migliori and Lee �1971�
5 0.01 Halwachs �1972�
3–6 0.02 Wiesel �1973�
12 0.05 Torstensson �1977�
13 0.05 Smith and Richards �1975�
27 0.1
36 0.13 Perlow and Richards �1977�
21 0.08
60 0.2
33 0.107 Schapery and Dunlap �1978�
21 0.05 Sharifounnasab and Ullrich �1985�
2–3 0.01 Roy and LeBlanc �1988�
1 0.004
15 0.055 Biscontin and Pestana �2001�
30 0.11 This study
r Stren
�
shear plane prior to failure in the field situation and vane shear
ENVIRONMENTAL ENGINEERING © ASCE / OCTOBER 2010 / 1441
2010.136:1437-1447.

1442 / JOURNAL OF GEOTECHNICAL AND GEOENVIRONMENTAL ENGIN
J. Geotech. Geoenviron. Eng.
Dow
nloa
ded
from
asc
elib
rary
.org
by
USP
- U
nive
rsid
ade
De
Sao
Paul
o on
06/
18/1
4. C
opyr
ight
ASC
E. F
or p
erso
nal u
se o
nly;
all
righ
ts r
eser
ved.
tests, the correction factor � according to Eq. �5� is only depen-dent on the ratio tfF / tfV and the equation for � can be simplifiedusing Eq. �8� and the observed tfF=600 min
� = �vpF
vpV��
� � tfV
tfF��
= �2.1/vpV
600��
� �300 · vpV�−� �9�
Eq. �9� is based on the observed time to failure in the field of600 min and is therefore based on the particular shear rate ob-served during the partial collapse of the extension area in the EastHarbor. Considering the measured specific parameter � and vpV,Eq. �9� yields
Peak shear strength � � �300 · vpV�−0.11 �10�
with �=0.11 for the peak shear strength.The results of Eq. �10� for the peak shear strength, which are
the main interest with regard to geotechnical design, are illus-trated on Fig. 7 versus peripheral velocities and additionally asrates of rotation using different vane sizes commonly recom-mended by international standards. For the rates of rotation be-tween 1 and 100°/min typically suggested by these international
th ground motion amplitudes of up to 2 m; �b� height of the geotextilestrong deformation that occurred between Days 5 and 7 after start ofB�.
ic harbor mud versus peripheral velocity vpV and rate of rotation �n international standards
Fig. 5. �a� Strongly deformed backfill area 20 days after sand installation wisurface before and during sand installation obtained by soundings. Note theinstallation with amplitudes of 3 m �inset: location of the sounding Profile
Fig. 6. Displacements along shear plane prior to failure versus pe-ripheral velocity in laboratory vane shear tests in harbor mud
Fig. 7. Correction factors � for the undrained peak shear strength of organusing exemplary vanes geometries d /h �mm/mm� recommended by commo
EERING © ASCE / OCTOBER 2010
2010.136:1437-1447.

Dow
nloa
ded
from
asc
elib
rary
.org
by
USP
- U
nive
rsid
ade
De
Sao
Paul
o on
06/
18/1
4. C
opyr
ight
ASC
E. F
or p
erso
nal u
se o
nly;
all
righ
ts r
eser
ved.
standards such as, ASTM �1987�, British Standards Institution�1990�, or German Standards Organisation �2002b�, the proposedcorrection factor � varies between 0.3 and 0.7 for the peak vaneshear strength suV.
In a field-failure situation the shear rate will accelerate aftermobilization of the peak shear strength �Fig. 5� and afterwarddecelerate until a stable state is reached because of the change ofdriving and resisting forces during and after failure. Therefore,Eq. �9� cannot be used to correct the residual shear strength ofEast Harbor mud. In the residual state of the collapse of the ex-tension area in the East Harbor, large deformations with fasterdeformation rates were observed, as illustrated on Fig. 5�b�. Fromthe deformation between Day 5 and Day 7, it can be seen that thedeformation rate was at least about 4 m within 2 days. This de-formation corresponds to a minimum velocity of 1.39 mm/min,which is, according to Cruden and Varnes �1996�, a moderateshear velocity often observed in natural landslides and groundfailures in clayey soils. Using this minimum shear velocity in theresidual state of 1.39 mm/min observed during the ground failurein the East Harbor, a conservative expression for a correctionfactor for the undrained residual shear strength of East Harbormud is derived as
Residual shear strength � = �vpF
vpV��
� �1.39
vpV��
� �0.72 · vpV�−0.144·LI−0.14
for 0.25 LI 1.39 �11�
with � according to Eq. �3� for the residual shear strength.The results of Eq. �11� for the residual shear strength are illus-
trated on Fig. 8 versus peripheral velocities, which can be calcu-lated for any given vane size and used at a rate of rotationaccording to vpV�d�� /360.
With the derived correction factors to account for the shearrate effects on vane shear test results in organic harbor mud, thecorrected undrained peak shear strength su and residual shearstrength sur can now be estimated as
su�r� = � · su�r�V �12�
The application of Eqs. �10�–�12� allows for the correction of
Fig. 8. Correction factors � for the undrained residual shear strengthof organic harbor mud versus peripheral velocity vpV for the threeconsistencies tested
laboratory and field vane test data taken at arbitrary rates of ro-
JOURNAL OF GEOTECHNICAL AND GEO
J. Geotech. Geoenviron. Eng.
tation in harbor mud or other soft, extremely plastic, organogenicclays.
Comparison of the Derived Correction Factor withThose Proposed by Other Studies and InternationalStandards for the Peak Vane Shear Strength
Based on numerous case studies on Scandinavian clays, Bjerrumproposed a correction factor � for the undrained shear strengthmeasured by vane shear tests to account for the longer time tofailure in the field tfF, which has typically been assumed to beseveral weeks or months �Bjerrum 1972, 1973�. The short time tofailure tfF of about 600 min observed in the East Harbor is as-sumed to be due to the liquid to soft consistency of the harbormud, so tfF is assumed to be dependent on the plasticity andconsistency of the soil. For clays with lower water contents, thetime to failure may be longer, as observed by Bjerrum. Differ-ences in tfF may have a serious influence on the introduced cor-rection factor � compared to those recommended by Bjerrum andother writers.
Bjerrum proposes a correction factor � to account for time andanisotropy effects in relation to the index of plasticity Ip based ona rate of rotation of 6°/min. For the organic harbor mud tested inthis study with Ip=0.926, the correction factor � would be 0.63,independent of the actual used rate of rotation in vane shear testsand the specific time to failure of the sediment �Bjerrum 1973�.This factor has been confirmed by a number of other studies�Azzouz et al. 1983; Larsson et al. 1984� and is also recom-mended by the German Standards Organisation �2002b� for softsediments. Since there is no internationally accepted standardfor the rate of rotation in vane shear tests, the recommended �
varies between 6 to 12°/min �British Standards Institution 1990�,30°/min �German Standards Organisation 2002b; for soft sedi-ments� and 60 to 90°/min �ASTM 1987�. In reality, measurementsfor large field monitoring campaigns are often carried out athigher rates of rotation in order to save time or to be able to domore single measurements. The results of Eq. �10� for the peakshear strength for these proposed rates of rotation are listed inTable 3 for common vane geometries represented by the ratiod /h, where � is the relative difference to �=0.63 as proposedby Bjerrum. Table 3 shows that for rates of rotation proposed bycommon international standards, the introduced shear rate depen-dent correction factor � differs significantly from that found byBjerrum. The larger the used vane at a given rate of rotation, themore important the correction of shear rate effects and therefore,the smaller the necessary correction factor �. This is due to thelarger peripheral velocities at a given rate of rotation for largervanes. It can be seen on Fig. 7 that, for the vane used, the cor-rection factor for the peak shear strength proposed in this studywould be 0.63 for a rate of rotation of less than 3°/min. Conse-quently, the application of the correction factor proposed by Bjer-rum in combination with the rates of rotation recommended afterthe standards British Standards Institution �1990�, German Stan-dards Organisation �2002b�, and ASTM �1987� overestimates theundrained shear strength between 11 and 85%. This underlinesthe importance of applying a correction factor that takes into ac-count the peripheral velocity of the vane of the actual measure-ments and soil specific shear rates during field-failure processes.
This study presents a complete set of correction factors.ENVIRONMENTAL ENGINEERING © ASCE / OCTOBER 2010 / 1443
2010.136:1437-1447.

Dow
nloa
ded
from
asc
elib
rary
.org
by
USP
- U
nive
rsid
ade
De
Sao
Paul
o on
06/
18/1
4. C
opyr
ight
ASC
E. F
or p
erso
nal u
se o
nly;
all
righ
ts r
eser
ved.
Back-Analysis of the Ground Failure in the EastHarbor and Validation of the Introduced CorrectionFactor
To check if the introduced new shear rate dependent correctionfactor would have predicted the ground failure during the EastHarbor extension project, a simplified back-analysis was con-ducted. The sand layers that caused the failure were installed byspraying and settling the sand through the water column from afloating platform in 10-m wide strips. The sand layer that led tothe ground failure has a thickness of about 20 cm, correspondingto a total stress increment of 2 kPa. Assuming a classic groundfailure approach for flexible footing on cohesive soil, the mini-mum necessary undrained shear strength to avoid failure and thefactor of safety for the geostatic system can be assessed followingPrandtl �1920� and German Standards Organisation �2005�. Fig. 9shows the geostatic system and a hypothetic failure plane, whichis the basis for the back-analysis. This system setup is simplistic,but reflects the observed failure geometries in the East Harborwith multiple ground failure events covering most of the backfillarea with common diameters between 5 and 20 m �Fig. 5�.
According to Prandtl �1920� and German Standards Organisa-tion �2005�, the critical undrained shear strength is
Table 3. Comparison of Correction Factors � Determined according toInternational Standards; � Is the Relative Differences to �=0.63 Propo
StandardProposed �
�degrees/min�
BS 1377-9�British Standards Institution 1990�
6–12
DIN 4094-4�German Standards Organisation 2002b�
30
ASTM D4648 �ASTM 1987� 60–90
Fig. 9. Geostatic system and hypothetic failure plain for the simpli-fied back-analysis according to Prandtl 1920 and DIN 1054
1444 / JOURNAL OF GEOTECHNICAL AND GEOENVIRONMENTAL ENGIN
J. Geotech. Geoenviron. Eng.
su,min =p
2 + ��13�
where p=applied vertical stress.To avoid ground failure under the assumed conditions,
Eq. �13� indicates that a minimum undrained peak shear strengthsu,min of 0.39 kPa is necessary to avoid failure. Shortly after theobserved surface deformations Metzen �2006� carried out labora-tory measurements on East Harbor mud sediment cores obtainedby piston coring. Fig. 10 shows the measured water contents andbulk densities as well as raw data of the undrained peak vaneshear strength of one representative sediment core. The short timebetween redeposition of the East Harbor mud behind the sheetpiling and the occurred failure of the backfill in connection withvery unfavorable drainage and consolidation properties of the har-bor mud �Schlue et al. 2009� did not allow for significant changesin water content, density or undrained shear strength with depthas a consequence of soil consolidation. Therefore, the effectivestress within the relocated harbor mud is assumed to be constantand the soil body more or less homogeneous. This supports theapplicability of the very simple, homogeneity assuming groundfailure approach of Prandtl �1920� and German Standards Organi-sation �2005� for the presented back-analysis.
For the laboratory vane �d /h=10 /20 mm /mm� used byMetzen �2006� and the used rate of rotation of 30°/min �GermanStandards Organisation 2002b� the determined uncorrected meanundrained peak vane shear strength was 0.75 kPa at that time�Fig. 10�. The mean value is used because the failure planes hadto pass through the whole harbor mud layer. In contrast to the �of 0.63 derived by Bjerrum, the correction factor according toEq. �10� is 0.47 for �=30° /min. Table 4 shows the uncorrectedas well as corrected shear strength after Bjerrum �0.47 kPa� andafter Eq. �10� proposed in this study �0.35 kPa�. Furthermore, thecalculated factor of safety for the geostatic system is listed assum-ing the different corrected shear strengths and su,min=0.39 kPa.The correction according to Bjerrum predicts no ground failureand results in a factor of safety of 1.21. Applying the correctionfactor proposed by this study, the system cannot be verified, lead-
10� for Rates of Rotation and Vane Geometries Proposed by CommonBjerrum
Vane geometry d /h�mm/mm�
� accordingto Eq. �10�
�-���%�
10/20 0.57–0.52 11–21
16/32 0.50–0.54 17–26
25/50 0.47–0.51 24–34
50/100 0.44–0.47 34–43
75/150 0.42–0.45 40–50
10/20 0.47 34
16/32 0.45 40
25/50 0.43 47
50/100 0.40 58
75/150 0.38 66
10/20 0.44–0.42 43–50
16/32 0.40–0.42 50–58
25/50 0.38–0.40 58–66
50/100 0.35–0.37 70–80
75/150 0.34–0.35 80–85
Eq. �sed by
ing to a factor of safety of 0.90.
EERING © ASCE / OCTOBER 2010
2010.136:1437-1447.

Dow
nloa
ded
from
asc
elib
rary
.org
by
USP
- U
nive
rsid
ade
De
Sao
Paul
o on
06/
18/1
4. C
opyr
ight
ASC
E. F
or p
erso
nal u
se o
nly;
all
righ
ts r
eser
ved.
This back-analysis indicates that the correction according toBjerrum is not leading to a prediction of the observed failureduring the East Harbor extension project. In the future, groundfailures in similar liquid to soft harbor mud might be better pre-dicted and avoided using the proposed shear rate dependent cor-rection factors.
Conclusions
Extremely plastic, organogenic clay, with a liquid to soft consis-tency like harbor mud is an extremely difficult foundation soiland in addition to the known unfavorable properties, the low un-drained shear strength of such a material is more rate dependentthan previously known.
The shear rate has a significant influence on both undrainedpeak and residual shear strength of organic harbor mud as increas-ing shear strength can be measured with increasing shear rate. Inthis study, the measured undrained peak shear strength variedbetween 55 and 65% with peripheral velocities between 1.57 and157 mm/min. The undrained peak shear strength of harbor mudincreases on the order of 30% per 10-fold increase in peripheralvelocity; a relationship nearly constant for all harbor mud consis-tencies tested. In contrast, the increase in residual shear strengthvaries between 120% at a soft consistency and 350% at a liquid
Table 4. Corrected Undrained Shear Strength according to Bjerrum andEq. �10� and Resulting Factors of Safety for the Assumed Geostatic Sys-tem
Correction factor su �kPa� Factor of safety
No correction 0.75 1.92
According to Bjerrum 0.47 1.21
According to this study 0.35 0.90
Note: Boldface font represents the safety factor according to the study is
Fig. 10. Water contents, bulk densities, and vane shear strengths gat2006�
below one.
JOURNAL OF GEOTECHNICAL AND GEO
J. Geotech. Geoenviron. Eng.
consistency, resulting in a 50 to 170% increase in the measuredresidual shear strength per 10-fold increase in peripheral velocity.
The relationship between peripheral velocity in vane sheartests and measured shear strength of harbor mud can be describedby both a semilogarithmic law and a power law. Since the semi-logarithmic expression cannot be extrapolated to small peripheralvelocities, the more robust power-law description was used todevelop shear rate dependent correction factors. The derived cor-rection factors are solely dependent on the ratio between the shearrate observed in large-scale field-failure processes and the shearrate actually used in the vane shear tests. The typical shear rate inthe field for the following analyses was taken from the East Har-bor project using the time from loading until the first strong de-formations were observed in the field. Furthermore, it wasassumed that the localized shear zone in harbor mud during labo-ratory vane tests and in field failures are comparable in terms ofrelative displacements. The effect of varying water contents on �for peak shear strength is negligible. In contrast, a change inwater content has a significant influence on � for the residualshear strength.
The correction factor for rate effects proposed by Bjerrum isshown to overestimate the undrained shear strength of organicharbor mud. For � between 6 and 90°/min as recommended bythe common international standards British Standards Institution�1990�, German Standards Organisation �2002b�, and ASTM�1987� this overestimation is in the range of 11 to 85% dependenton the used vane geometry with vane diameters between 10 and75 mm. This underlines the importance of the shear rate depen-dent correction method proposed in this study. Generally, thelarger the used peripheral velocity in a vane shear test, the moreimportant the correction of vane shear test results for shear rateeffects and the smaller the necessary correction factor �. There-fore, this correction becomes even more important when largerfield vanes are used rather than miniature vanes.
We show that, among many other factors that might have ledto the observed deformations during the East Harbor extension
from piston cores shortly after failure of the extension area �Metzen
heredproject, the shear rate dependent soil strength behavior plays an
ENVIRONMENTAL ENGINEERING © ASCE / OCTOBER 2010 / 1445
2010.136:1437-1447.

Dow
nloa
ded
from
asc
elib
rary
.org
by
USP
- U
nive
rsid
ade
De
Sao
Paul
o on
06/
18/1
4. C
opyr
ight
ASC
E. F
or p
erso
nal u
se o
nly;
all
righ
ts r
eser
ved.
important role and needs to be addressed in future projects usingsimilar backfill material and rapid loading. A simplified back-analysis indicates that the correction according Bjerrum does notpredict the observed failure during the East Harbor project. In thefuture, ground failures in liquid or soft harbor mud might bebetter predicted and therefore avoided using the shear rate depen-dent correction factor proposed in this study.
Acknowledgments
This study was funded by the German Research Foundation�DFG� as a part of the DFG-Research Center MARUM at theUniversity of Bremen. We express our sincere thanks to BerndGrupe from the Technical University of Berlin who provided thevane shear test apparatus and Richard G. Ellis from Brown Uni-versity for proofreading. Our special thanks go to our industrycooperating partners Christoph Tarras from bremenports GmbHand Co. KG, Bremerhaven as well as Dirk Lesemann, Kai Petereitand Michael Lux from PHW Hamburg for providing the samplematerial and field data as well as their general support and access.
Notation
The following symbols are used in this paper:Ctot � total carbon content;Cv � coefficient of consolidation;
d � vane diameter;e0 � initial void ratio;h � vane height;Ip � index of plasticity;k � water permeability;
LI � liquidity index;p � applied vertical stress;
R2 � coefficient of correlation;Stot � total sulfur content;su � undrained peak shear strength;
sur � undrained residual shear strength;surV � undrained residual vane shear strength;sur0 � reference undrained residual shear strength;suV � undrained peak vane shear strength;su0 � reference undrained peak shear strength;
TOC � total organic carbon;t � vane blade thickness;
tfF � time to failure in the field;tfV � time to failure in vane shear test;
VGl � loss on ignition;vp � peripheral velocity;
vpF � peripheral velocity corresponding to fieldshear rate;
vpV � peripheral velocity in vane shear tests;vp0 � reference peripheral velocity;
w � water content;w0 � initial water content;wL � liquid limit;wP � plastic limit;xf � displacement along shear plane at failure;� � semilogarithmic law parameter;� � power-law parameter;� � correction factor for shear rate effects;� � bulk density;
�d � dry density;
1446 / JOURNAL OF GEOTECHNICAL AND GEOENVIRONMENTAL ENGIN
J. Geotech. Geoenviron. Eng.
�s � particle density; and� � rate of rotation in vane shear tests.
References
Aas, G. �1965�. “Study of the effect of vane shape and rate of strain onmeasured values of in situ shear strength of clays.” Proc., 6th Int.Conf. Soil Mech. Found. Eng., Vol. 1, Univ. of Toronto Press, Toronto,Canada, 141–145.
ASTM. �1987�. “Standard test method for laboratory miniature vaneshear test for saturated fine-grained clayey soil.” D4648, West Con-shohocken, Pa.
Azzouz, A. S., Baligh, M. M., and Ladd, C. C. �1983�. “Corrected fieldvane strength for embankment design.” J. Geotech. Eng., 109�5�,730–734.
Berner, R. A. �1980�. Early diagenesis: A theoretical approach, PrincetonUniversity Press, Princeton, NJ.
Biscontin, G., and Pestana, J. M. �2001�. “Influence of peripheral velocityon vane shear strength of an artificial clay.” Geotech. Test. J., 24�4�,423–429.
Bjerrum, L. �1972�. “Embankments on soft ground.” Proc., SpecialtyConf. of Earth and Earth Supported Structures, Vol. 2, ASCE, NewYork, 1–54.
Bjerrum, L. �1973�. “Problems of soil mechanics and construction on softclays and structurally unstable soils.” Proc., 8th Int. Conf. Soil Mech.Found. Eng., Springer, New York, 111–159.
Blight, G. E. �1968�. “A note on field vane testing of silty soils.” Can.Geotech. J., 5�3�, 142–149.
British Standards Institution. �1990�. “Methods of test for soils for civilengineering purposes.” British Standard 1377, London.
Cadling, L., and Odenstad, S. �1950�. “The vane borer: An apparatus fordetermining the shear strength of clay soils directly in the ground.”Proc., Royal Swedish Geotechnical Institute, Vol. 2, Royal SwedishGeotechnical Institute, Stockholm, Sweden, 1–87.
Coussot, P. �1997�. “Mudflow rheology and dynamics.” IAHR monographseries, Balkema, Rotterdam, The Netherlands.
Cruden, D. M., and Varnes, D. J. �1996�. “Landslides types and pro-cesses.” Landslides: Investigation and mitigation, A. K. Turner and R.L. Schuster, eds., Transportation Research Board, National Academyof Sciences, Washington, D.C., 36–75.
Flaate, K. �1966�. “Factor influencing the results of vane tests.” Can.Geotech. J., 3�1�, 18–31.
German Standards Organisation. �1996�. “Soil-investigation and testing-determination of grain-size distribution.” DIN 18123, Berlin.
German Standards Organisation. �2000�. “Soil-investigation and testing-consistency limits—Part 1: Determination of liquid and plastic limit.”DIN 18122-1, Berlin.
German Standards Organisation. �2002a�. “Soil-investigation and testing-determination of ignition loss.” DIN 18128, Berlin.
German Standards Organisation. �2002b�. “Subsoil-field testing—Part 4:Field vane test.” DIN 4094-4, Berlin.
German Standards Organisation. �2005�. “Ground-verification of thesafety of earthworks and foundations.” DIN 1054, Berlin.
Halwachs, J. E. �1972�. “Analysis of sediment shear strength at varyingrates of shear.” Trident Scholar Project Rep. No. TSPR 28, U.S. NavalAcademy, Annapolis, MD.
Hinchberger, S. D. �1996�. “The behaviour of reinforced and unrein-forced embankments on rate sensitive clayey foundations.” Ph.D. the-sis, Faculty of Graduate Studies, Univ. of Western Ontario, London,Canada.
Hoselmann, C., and Streif, H. �2004�. “Holocene sea-level rise and itseffect on the mass balance of coastal deposits.” Quaternary Int.,112�1�, 89–103.
Kay, S., Goedemoed, S. S., and Vermeijden, C. A. �2005�. “Influence ofsalinity on soil properties.” Proc., Frontiers in Offshore Geotechnics:
ISFOG 2005, S. Gourvenec and M. Cassidy, eds., Taylor and Francis,EERING © ASCE / OCTOBER 2010
2010.136:1437-1447.

Dow
nloa
ded
from
asc
elib
rary
.org
by
USP
- U
nive
rsid
ade
De
Sao
Paul
o on
06/
18/1
4. C
opyr
ight
ASC
E. F
or p
erso
nal u
se o
nly;
all
righ
ts r
eser
ved.
London, 1087–1093.Larsson, R., Bergdahl, U., and Eriksson, L. �1984�. “Evolution of strength
in cohesive soils with special reference to Swedish practice and ex-perience.” Information, Vol. 3, Swedish Geotechnical Institute �SGI�,Linköping, Sweden.
Leroueil, S., and Marques, M. E. S. �1996�. “Importance of strain rate andtemperature effects in geotechnical engineering.” Measuring andmodeling time dependent soil behavior, ASCE GSP 61, T. C. Sheahanand V. N. Kaliakin, eds., ASCE, New York, 1–60.
Matsui, T., and Abe, N. �1981�. “Shear mechanisms of vane test in softclays.” Soils Found., 21�4�, 69–80.
Menzies, B. K., and Mailey, L. K. �1976�. “Some measurements ofstrength anisotropy in soft clays using a diamond shaped shear vane.”Geotechnique, 26�3�, 535–538.
Metzen, J. F. �2006�. “Finite Elemente Modellierung zum Konsoli-dierungsverhalten von frisch umgelagertem Schlick des Osthafen,Bremerhaven �Finite element modeling of the consolidation behaviorof fresh re-deposited harbor mud of the East Harbor �Osthafen�,Bremerhaven�.” Bachelor thesis, Univ. of Bremen, Bremen, Germany.
Metzen, J. F., et al. �2006�. “Specific problems in using organic harbormud as construction material.” Proc., 4th Int. Conf. on Remediation ofContaminated Sediments, Battelle, Columbus, OH.
Migliori, H. J., and Lee, H. J. �1971�. “Seafloor penetration tests: Presen-tation and analysis of results.” Tech. Note N-1178, U.S. Naval CivilEng. Labor., Port Hueneme, CA.
Perlow, M., and Richards, A. F. �1977�. “Influence of shear velocity onthe vane shear strength.” J. Geotech. Engrg. Div., 103�GT1�, 19–32.
Prandtl, L. �1920�. “Über die Härte plastischer Körper �About the hard-ness of plastic bodies�.” Nachrichten von der Gesellschaft der Wis-senschaften zu Göttingen, mathematisch-physikalische Klasse [Newsof the scientific society of Göttingen, mathematical-physical section],Göttingen, Germany, 74.
Roscoe, K. H. �1970�. “Influence of strains in soil mechanics.” Geotech-nique, 20�2�, 129–170.
Roy, M., and LeBlanc, A. �1988�. “The in-situ measurement of the un-drained shear strength of clays using the field vane.” Vane shearstrength testing in soils: Field and laboratory studies, ASTM STP1014, A. F. Richards, ed., ASTM, Philadelphia, 193–208.
Schapery, R. A., and Dunlap, W. A. �1978�. “Prediction of storm-inducedsea bottom movement and platform forces.” Proc., 10th OffshoreTech. Conf., Offshore Technology Conf., Houston.
Schlue, B. F., Kreiter, S., and Moerz, T. �2009�. “Time-dependent defor-mation of dredged harbor mud used as backfilling material.” J. Wa-terway, Port, Coastal, Ocean Eng., 135�4�, 154–163.
Schlue, B. F., Moerz, T., and Kreiter, S. �2007�. “Effect of rod friction onvane shear tests in very soft organic harbour mud.” Acta Geotech.,2�4�, 281–289.
Schrottke, K., Becker, M., Bartholomä, A., Flemming, B. W., and Heb-beln, D. �2006�. “Fluid mud dynamics in the Weser estuary turbidityzone tracked by high-resolution side-scan sonar and parametric sub-bottom profiler.” Geo-Mar. Lett., 26, 185–198.
Sharifounnasab, M., and Ullrich, R. C. �1985�. “Rate of shear effect onvane shear strength.” J. Geotech. Eng., 111�1�, 135–139.
Skempton, A. W. �1948�. “Vane tests in alluvial plain of the River Forthnear Grangemouth.” Geotechnique, 1�2�, 111–124.
Smith, A. D., and Richards, A. F. �1975�. “Vane shear strength at two
JOURNAL OF GEOTECHNICAL AND GEO
J. Geotech. Geoenviron. Eng.
high rotation rates.” Proc., Civil Engineering in the Oceans III, Vol. 1,ASCE, New York, 421–433.
Soga, K., and Mitchell, J. K. �1996�. “Rate-dependent undrained shearbehaviour of structured natural clays.” Proc., 1996 ASCE NationalConvention, ASCE, New York, 243–257.
Spaethe, A. �2002�. “Einfluss des Kationenmilieus auf Oberflächenladungund die hydraulischen und mechanischen Eigenschaften von Tonen�Influence of the cation concentration and composition on the surfacecharge and the mechanical and hydraulic properties of clays�.” Ph.D.thesis, Institut für Bodenkunde, Universität Hannover, Hannover, Ger-many.
Stewart, D. P., and Randolph, M. F. �1994�. “T-bar penetration testing insoft clay.” J. Geotech. Engrg. Div., 120�12�, 2230–2235.
Torstensson, B. A. �1977�. “Time-dependent effects in the field vanetest.” Proc., Int. Symp. on Soft Clay, Asian Institute of Technology,Bangkok, 387–397.
Unesco. �1981�. “The practical salinity scale 1978 and the internationalequation of state of seawater 1980.” Proc., 11th Rep. of the JointPanel on Oceanographic Tables and Standards, Unesco TechnicalPapers in Marine Science, Vol. 36, Sidney, B.C., Canada.
v. Bloh, G. �1995�. “Verfahren zur Ermittlung des Scherverhaltens vonBagger-und Klärschlamm mit der Flügelsonde �Procedure for the de-termination of the shear behavior of dredged mud and sewage sludgeusing the shear vane�.” Ph.D. thesis, Univ. of Hanover, Hannover,Germany.
van Kessel, T., and van Kesteren, W. G. M. �2002�. “Gas production andtransport in artificial sludge deposits.” Waste Manage., 22�1�, 19–28.
Vardoulakis, I., and Graf, B. �1985�. “Calibration of constitutive modelsfor granular-materials using data from biaxial experiments.” Geotech-nique, 35�3�, 299–317.
Verreet, G., and Berlamont, J. �1988�. “Rheology and non-Newtonianbehavior of sea and estuarine mud.” Encyclopedia of fluid mechanics,vol. VII, rheology and non-Newtonian flows, N. P. Cheremisinoff, ed.,Gulf Publishing Company, Houston.
Whitehouse, R., Soulsby, R., Roberts, W., and Mitchener, H. �2000�.Dynamics of estuarine muds, Thomas Telford, London.
Wichman, B. G. H. M., Sills, G. C., and Gonzales, R. �2000�. “Experi-mental validation of a finite strain theory for gassy mud.” Can. Geo-tech. J., 37�6�, 1227–1240.
Wiesel, C. E. �1973�. “Some factors influencing in-situ vane tests results.”Proc., 8th Int. Conf. Soil Mech. Found. Eng., Springer, New York,475–479.
Winterwerp, J. G., and v. Kersteren, W. G. M. �2004�. “Introduction to thephysics of cohesive sediment in the marine environment.” Develop-ment in sedimentology, T. v. Loon, ed., Elsevier, Amsterdam, TheNetherlands.
Zöllmer, V., and Irion, G. �1996�. Tonminerale des Nordseeraumes, ihrVerteilungsmuster in kreidezeitlichen bis pleistozänen Sedimentab-folge und in den Oberflächensedimenten der heutigen Nordsee �Clayminerals of the North Sea region, their distribution in cretaceous topleistocene sediments and in surface sediments of the modern NorthSea.�, Vol. 190, Courier Forschungsinstitut Senckenberg, E. Schweiz-erbart Science Publishers, Stuttgart, Germany.
Zreik, D. A., Ladd, C. C., and Germaine, J. T. �1995�. “A new fall conedevice for measuring the undrained strength of very weak cohesivesoils.” Geotech. Test. J., 18�4�, 472–482.
ENVIRONMENTAL ENGINEERING © ASCE / OCTOBER 2010 / 1447
2010.136:1437-1447.