aalborg universitet undrained shear strength...
TRANSCRIPT

Aalborg Universitet
Undrained shear strength determination and correlations on Søvind Marl
Grønbech, Gitte Lyng; Nielsen, Benjaminn Nordahl
Published in:NGM 2016 Proceedings
Publication date:2016
Document VersionPublisher's PDF, also known as Version of record
Link to publication from Aalborg University
Citation for published version (APA):Grønbech, G. L., & Nielsen, B. N. (2016). Undrained shear strength determination and correlations on SøvindMarl. In NGM 2016 Proceedings : Proceedings of the 17th Nordic Geotechnical Meeting, Reykjavík (pp. 431-440). Reykjavík: The Icelandic Geotechnical Society.
General rightsCopyright and moral rights for the publications made accessible in the public portal are retained by the authors and/or other copyright ownersand it is a condition of accessing publications that users recognise and abide by the legal requirements associated with these rights.
? Users may download and print one copy of any publication from the public portal for the purpose of private study or research. ? You may not further distribute the material or use it for any profit-making activity or commercial gain ? You may freely distribute the URL identifying the publication in the public portal ?
Take down policyIf you believe that this document breaches copyright please contact us at [email protected] providing details, and we will remove access tothe work immediately and investigate your claim.
Downloaded from vbn.aau.dk on: juli 13, 2018

NGM 2016 Reykjavik Proceedings of the 17th Nordic Geotechnical Meeting Challenges in Nordic Geotechnic 25th – 28th of May
IGS 431 NGM 2016 Proceedings
Undrained shear strength determination and correlations on Søvind Marl Gitte Lyng Grønbech Aalborg University, Denmark, [email protected]
Benjaminn Nordahl Nielsen Aalborg University, Denmark ABSTRACT Undrained shear strength on Søvind Marl is found through undrained, volume constant, triaxial testing and is compared to field vane shear strength. Søvind Marl is extremely plastic and highly fissured Eocene clay found throughout Denmark. The fissured structure of Søvind Marl has an influence on both the preconsolidation and the undrained shear strength. Two apparent values of the preconsolidation stresses can be determined due to the fissured structure (Grønbech et al. 2015a) which also considerably decreases the undrained shear strength. Determination of shear strength of fissured clay is done through field testing or triaxial testing. Christensen and Hansen (1959) tested fissured Danish Oligocene clay and found the undrained shear strength, Su, be approximately 1/3 of the measured field vane shear strength, cfv. This correlation has since been used in Danish geotechnical practice with little to no further validation through modern triaxial test. The measured undrained shear strength is normalized using SHANSEP. The strengths are compared to the measured field vane shear strength in order to determine μ (μ=Su⁄cfv ). The undrained shear strength is found to be increasing with increasing stresses up to a strength of approximately 450 kPa at a stress level corresponding to the lower limit of the preconsolidation stresses. The field vane shear strength is found to reach values of more than 1000 kPa. The ratio between the undrained shear strength and field vane shear strength was confirmed to be approximately 0.3 on Søvind Marl regardless of the stress level. Keywords: Undrained shear strength, Fissured Clay, SHANSEP, Plastic Clay, Field vane shear strength 1 INTRODUCTION
This article examine the strength parameters, specifically undrained shear strength, Su (kPa), of a highly fissured overconsolidated Eocene clay called Søvind Marl. Seven samples are tested; with additional data from further four tests. All samples originate from the Søvind Marl formation at Aarhus, Denmark, which in deposit history, structure and characteristic resembles London Clay. The undrained shear strengths are normalised using SHANSEP (Ladd et al. 1977) and compared to measured field vane shear strength, cfv (kPa), to determine the influence of the fissured structure.
1.1 Influence of structure on strength The general presence of a structure in clay, either soft or stiff, has an increasing influence on the strength. Leroueil and Vaughan (1990) and Burland et al. (1996) found that a general post sedimentation structure enlarges the boundary surface of a soil in the in situ stress range. The was also found at very high stress levels on stiff clay by Jovičić et al. (2006) and on London Clay by Gasparre et al. (2008). Both situations result in increasing peak strengths due to the presence of a general post sedimentation structure. The presence of a fissured structure also has a great influence on the strength of clay. Gasparre et al. (2008) and Vitone et al.
Investigation, testing and monitoring
NGM 2016 Proceedings 432 IGS
(2013) found that the peak strength of fissured London Clay and fissured bentonite clay, respectively, were significantly lower than the peak strength of similar, yet unfissured, samples. Christensen and Hansen (1959) determined that only one third of the field vane shear strength could be used as the undrained shear strength in regards to the bearing capacity of Skive Septarian Clay, a fissured Oligocene clay. The use and determination of the factor between the two strengths, μ (-), is frequently discussed in the Danish geotechnical community. The value if 1/3 by Christensen and Hansen (1959) is widely used in Danish geotechnical practice, even though the used test methods differ from modern triaxial tests. Since then the relation has not been further confirmed using modern undrained triaxial tests on the extremely plastic fissured clays, like Søvind Marl.
2 SØVIND MARL
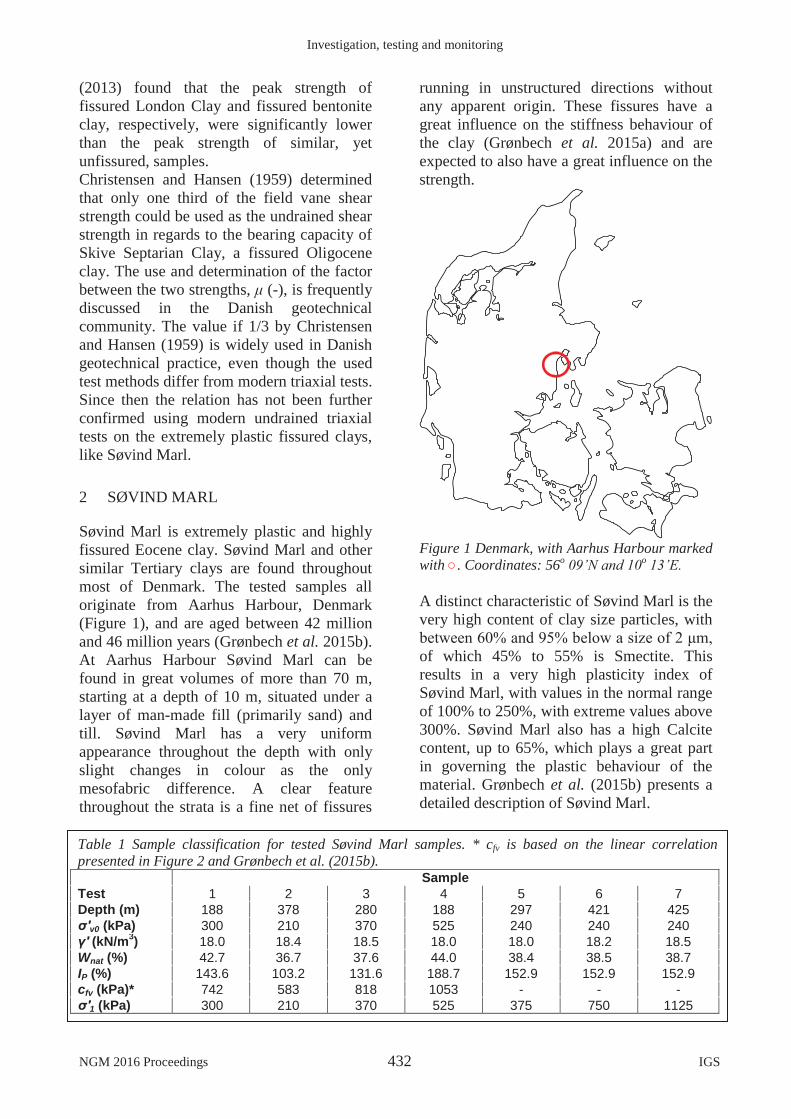
Søvind Marl is extremely plastic and highly fissured Eocene clay. Søvind Marl and other similar Tertiary clays are found throughout most of Denmark. The tested samples all originate from Aarhus Harbour, Denmark (Figure 1), and are aged between 42 million and 46 million years (Grønbech et al. 2015b). At Aarhus Harbour Søvind Marl can be found in great volumes of more than 70 m, starting at a depth of 10 m, situated under a layer of man-made fill (primarily sand) and till. Søvind Marl has a very uniform appearance throughout the depth with only slight changes in colour as the only mesofabric difference. A clear feature throughout the strata is a fine net of fissures
running in unstructured directions without any apparent origin. These fissures have a great influence on the stiffness behaviour of the clay (Grønbech et al. 2015a) and are expected to also have a great influence on the strength.
Figure 1 Denmark, with Aarhus Harbour marked with ○. Coordinates: 56o 09’N and 10o 13’E. A distinct characteristic of Søvind Marl is the very high content of clay size particles, with between 60% and 95% below a size of 2 μm, of which 45% to 55% is Smectite. This results in a very high plasticity index of Søvind Marl, with values in the normal range of 100% to 250%, with extreme values above 300%. Søvind Marl also has a high Calcite content, up to 65%, which plays a great part in governing the plastic behaviour of the material. Grønbech et al. (2015b) presents a detailed description of Søvind Marl.
Table 1 Sample classification for tested Søvind Marl samples. * cfv is based on the linear correlation presented in Figure 2 and Grønbech et al. (2015b). Sample Test 1 2 3 4 5 6 7 Depth (m) 188 378 280 188 297 421 425 σ'v0 (kPa) 300 210 370 525 240 240 240 γ' (kN/m3) 18.0 18.4 18.5 18.0 18.0 18.2 18.5 Wnat (%) 42.7 36.7 37.6 44.0 38.4 38.5 38.7 IP (%) 143.6 103.2 131.6 188.7 152.9 152.9 152.9 cfv (kPa)* 742 583 818 1053 - - - σ'1 (kPa) 300 210 370 525 375 750 1125

Undrained shear strength determination and correlations on Søvind Marl
IGS 433 NGM 2016 Proceedings
Table 1 lists significant classification parameters of the presented. Test numbers in correspond to legends in the following figures and tables. σ'1 (kPa) is the vertical stresses from where the shearing process took place.
2.1 Field Vane Shear Strength Figure 2 presents the field vane shear strength of 5 boreholes in Søvind Marl at Aarhus Harbour. Samples used in the undrained triaxial tests presented in this study all originate from borehole 10 or 11 (described in Grønbech et al. (2015b)). Both the intact field vane shear strength, cfv (kPa), and the remoulded field vane shear strength, crfv (kPa), show very uniform behaviour independent of the borehole. The strengths increase in a linear behaviour through the strata. The intact field vane shear strength reaches a mean strength of 800 kPa at a depth of 42 m. The high strength is an indication of the extensive geological history of the material. 42 m is the maximum depth in which the field vane shear strength is measured. The mean linear development of the strength is assumed the most accurate description of the strength, and consequently, used as the field vane shear strength of the samples. Due to the uniform behaviour and development of the strength through the strata, the linear development of the strength is assumed continued in lower strata, enabling correlations to be made for samples located at lower depths.
2.2 Preconsolidation Both the mesofabric and microfabric structures of clay has an influence on the stiffness. Gasparre and Coop (2008) found the determination of the preconsolidation stresses of London Clay was influenced by the fissured structure. Both Gasparre and Coop (2008) and Grønbech et al. (2015a) found a lower and upper bound of the preconsolidation stresses of London Clay and Søvind Marl, respectively. Krogsbøl et al. (2012) described the loss of stress memory in highly plastic fissured Palaeogene clays and contributed the loss to the high plasticity.
These tests were conducted to stress levels up to 4000 kPa and did not reach the upper bounds of the preconsolidation found on similar clays.
Figure 2 Field vane shear strength of Søvind Marl at Arhus Harbour. After Grønbech et al. (2015b). Due to the long and extensive geological history of Søvind Marl, high degrees of preconsolidation are to be expected. Grønbech et al. (2015a) showed that a lower bound of the preconsolidation stresses can be found between 500 kPa and 800 kPa, which are only two to three times the in situ stresses. By continuing the tests, an upper bound of the preconsolidation stresses were found at approximately 5000 kPa to 9000 kPa (Grønbech et al. 2015a). This is more in concordance to the known geological history of the clay. The upper bound of the preconsolidation is related to the geological preconsolidation, while the lower bound is related to the structure. The lower bound is geotechnical speaking to be regarded as the preconsolidation stresses in the tests presented in this study with an approximately value of 750 kPa.

Investigation, testing and monitoring
NGM 2016 Proceedings 434 IGS
3 TEST METHODS
The undrained shear strength is found using the triaxial apparatus at Aalborg University. Figure 3 shows a sketch of the apparatus. A more detailed description can be found in Grønbech (2015). Samples are 70 mm in initial diameter and height. Stresses in the sample are applied via a load piston (deviatoric forces) and surrounding cell pressure (horizontal stresses). Axial deformation is measured by two displacement transducers, while volumetric deformation is measured by the backpressure system (not illustrated in Figure 3). Samples are saturated with a saline solution resembling the natural pore water in the samples (cl- of 0.6 and pH of 9.2, cf. Grønbech et al. (2015b)). Pore pressure in the sample is measured in the centre of the lower pressure head. During testing, a back pressure of 200 kPa is applied to the sample to better enable saturation and drainage of the sample. Four felt drains run across the sample at a 45○ angle to ensure even drainage of the entire sample without influencing the measured results. After initial saturation the samples were re-consolidated to a vertical stress level resembling the lower bound of the preconsolidation stresses (750 kPa). The stress level in the samples is hereafter set at the stresses from which shearing takes place (σ'1 in Table 1). Tests are all carried out as volume constant undrained triaxial tests. Axial deformation rate is set at 0.5 %/h and adjustable cell pressure is used to ensure a constant volume.
4 STRENGTH PARAMETERS
The tests are performed with the main focus to determine the undrained shear strength.
4.1 Undrained shear strength The undrained shear strength is the sole strength parameter of an undrained soil, τ = Su. The undrained shear strength is given by the radius of Mohr’s Circle at failure, also
expressed as the half of the maximum deviatoric stresses, qmax (kPa), Eq.1:
max31 5.0''5.0 qSu (1)
Figure 3 Sketch of the triaxial apparatus at Aalborg University. Figure is not to scale. After Grønbech (2015) The deviatoric forces are measured directly by the piston in the triaxial setup, and divide on the actual area of the sample. The stress-strain curve for each test presented in Figure 5 is used to determine the maximum deviatoric stresses. The resulting undrained shear stresses using Ep. 1 are listed in Table 2. All tests depict a “softening” effect just after failure. This is a result of the fissures failing, resulting in a substantial loss of strength as described by Gasparre et al. (2008), and not softening in the traditional sense. Table 2 Undrained shear strength of the tested Søvind Marl samples. Sample data is listed in Table 1. Sample Test 1 2 3 4 5 6 7 Su (kPa) 188 378 280 188 297 421 425

Undrained shear strength determination and correlations on Søvind Marl
IGS 435 NGM 2016 Proceedings
Table 3 Data from additional undrained shear tests on Søvind Marl by Madsen et al. (2008). * cfv is based on the linear correlation presented in Figure 2 and Grønbech et al. (2015b). Sample Test 8 9 10 11 Depth (m) 17 31 59 67 σ'v0 (kPa) 158 270 494 558 cfv (kPa)* 427 677 1006 1100 Su (kPa) 105 213 239 413 The undrained shear strength is dependent of the shearing stresses. Figure 6 shows the comparison between these.
The undrained shear strength is seen to increase with increasing vertical effective stresses, as expected. The increase in strength is almost linear until the lower bounds of the preconsolidation stresses. The undrained shear strength seems to reach a maximum strength level at vertical effective stresses equal to the lower bounds of the preconsolidation stresses, at a strength level of approximately 420 kPa. This effect could, however, be accidental due to the limited data above the lower bound of the preconsolidation stresses. More tests are needed to confirm or dismiss this effect.
Figure 5 Stress-strain curves for the seven tested Søvind Marl samples. After Grønbech (2015)
Figure 4 Three of the Søvind Marl samples after testing.

Investigation, testing and monitoring
NGM 2016 Proceedings 436 IGS
Figure 6 Undrained shear strength compared to the shearing stresses. Prior tests are by Madsen et al. (2008). Two samples deviate from this, Tests 2 and 4. Figure 4 presents photos of the samples after testing, where Test 5 shows the typical failure pattern for the fissured remaining samples. Test 2 failed in a manner resembling unfissured clay, given a relative high strength. Test 4 seemed to have failed along a pre-existent fissure, yielding a much too low strength, likely a residual strength in the fissures. This is substantiated by the increase in deviatoric stresses at an axial strain of approximately 6% implying additional remaining strength in the sample after initial failure. These tests have been eliminated from further correlations; however, they are marked on following graphs to validate the exclusion of the results.
4.2 SHANSEP By applying the SHANSEP method (Ladd et al. 1977) to the measured undrained shear strength, the undrained shear strengths are normalized to the in situ stresses in relation to the degree of overconsolidation. This enables estimations of the strength parameters using Eq. 2:
m
v
u OCRSS
0' (2)
where S (-) and m (-) are SHANSEP parameters and OCR (-) is the degree of overconsolidation. Figure 7 shows the optimized fit of SHANSEP to the measured undrained shear strengths. The re-consolidation stresses (equals σ’pc) are used in OCR, and the stresses from which the shearing is preformed are used as the in situ stresses (σ’v0 = σ’1). The SHANSEP fit is made both with and without Test 7, which is sheared from stresses above the lower bound of the preconsolidation stresses. This is done based on the almost linear development of the strength and apparent maximum of the strength. Table 4 lists the resulting SHANSEP parameters and the associated coefficient of determination. Table 4 SHANSEP parameters and the coefficient of determination for the measured strengths. W/ 1.5σ’pc W/O 1.5σ’pc S (-) 0.51 0.58 m (-) 0.44 0.22 R2 (-) 0.78 0.82 Ladd et al. (1977), Mayne (1988) and Augustesen et al. (2005) describe the SHANSEP parameters S and m for less consolidated unfissured clay to be in the following interval:
0.25 ≤ S ≤ 0.55 0.7 ≤ m ≤ 0.8

Undrained shear strength determination and correlations on Søvind Marl
IGS 437 NGM 2016 Proceedings
However, this interval has not been proven nor evaluated on highly overconsolidated fissured clays, like Søvind Marl.
Figure 7 SHANSEP fit the measured undrained shear strength. The m-values listed in Table 4 fall well below the normal interval. This is due to the almost linear development of the undrained shear strength. This indicates the normal development of the strength is influenced by the fissures. This is also shown by the low coefficient of determination (R2) of SHANSEP to the dataset including Test 7 (σ’1= 1.5∙σ’pc). The SHANSEP parameters should, therefore, not be used for stresses above the lower bound of the preconsolidation stresses.
4.3 Effective parameters The main focus of the tests is to determine the undrained shear strength. However, it is also attempted to determine the effective friction angle, φ’ (○), and effective cohesion, c’ (kPa), through the stress paths from the tests. Figure 8 shows the measured stress path for each test.
Figure 8 Measured stress path for the seven Søvind Marl samples. See Figure 5 for additional legends. It is clear that Tests 2 and 4 again, as well Test 7, stand out from the rest. These tests are not included in the estimation of effective parameters. The mean effective stresses, p’ (kPa), in Test 2 reached a negative state, indicating the pore pressure is larger than the horizontal stresses acting on the sample (cell pressure). This is an indication of the fact that the deformation rate was too high during the shearing process, not allowing the pore water to drain due to the very low permeability of the sample. Thus not allowing the effective parameters to be determined. A common tangent of the failure stresses for the remaining tests is attempted in Figure 8. The fit of the tangent to the measured stress curves is rather poor, resulting in a poor estimation of the effective parameters. The friction angle can be found using Eq. 3:
')'sin(3)'sin(6 pq (3)
Table 5 lists the resulting friction angle and effective cohesion. Table 5 Estimated effective parameters. Pore pressure Back pressure φ' 25.4 26.0 c' 193.5 99.1
Investigation, testing and monitoring
NGM 2016 Proceedings 438 IGS
The resulting friction angle is very high considering the material. Thøgersen (2001) determined the friction angle of Little Belt Clay (Danish Eocene clay similar to Søvind Marl) to be in the range of 14○ to 19○, using a strain rate of 0.1 %/h. Also the effective cohesion is considered to be much too high, as it is almost half of the maximum measured undrained shear strength in any of the tests. As listed in Table 5, it was also attempted to determine the effective parameters using the back pressure to determine the effective stresses as oppose to the pore pressure. However, this does not improve the accuracy of the effective parameters, as both parameters are considered much too high. This leaves the effective parameters undeterminable based on the presented tests. In order to estimate the effective parameter, a strain rate much lower than the applied 0.5 %/h should be used, like the 0.1 %/h used by Thøgersen (2001). This will be at the expense of a much longer testing time.
5 CORRELATION TO FIELD VANE SHEAR STRENGTH
The undrained shear strength is often assed using the field vane shear strength, cfv (kPa) using Eq. 4.
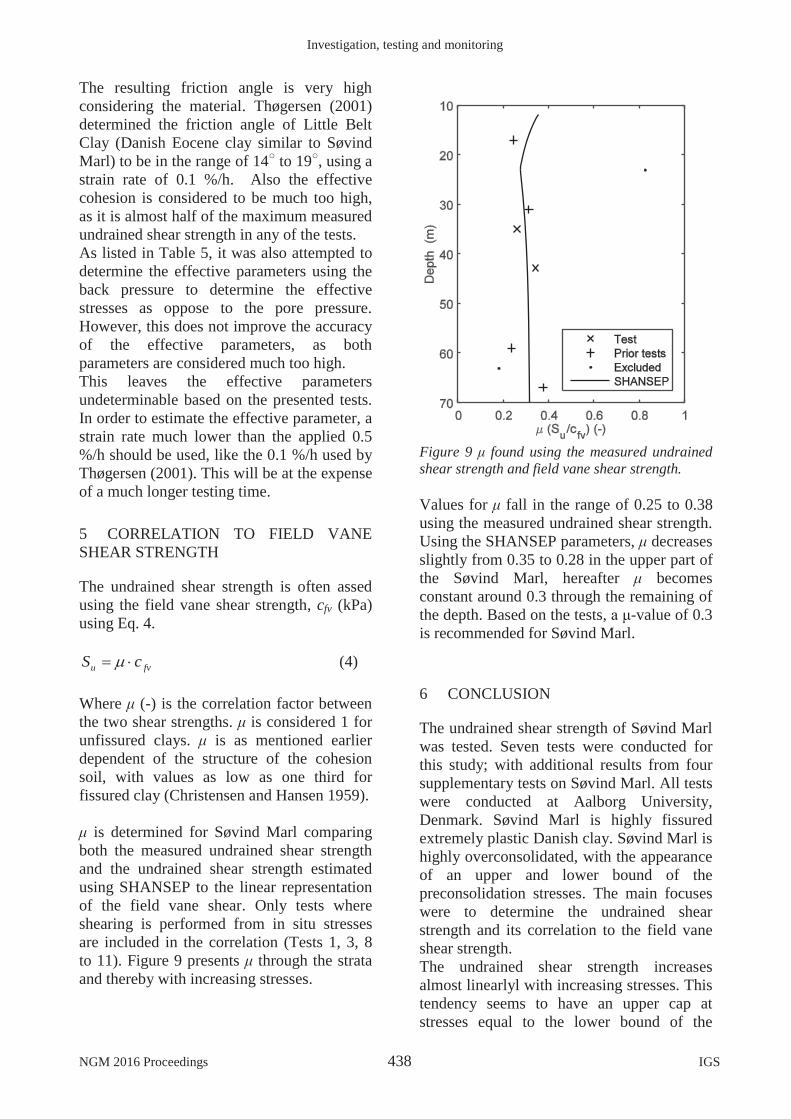
fvu cS (4) Where μ (-) is the correlation factor between the two shear strengths. μ is considered 1 for unfissured clays. μ is as mentioned earlier dependent of the structure of the cohesion soil, with values as low as one third for fissured clay (Christensen and Hansen 1959). μ is determined for Søvind Marl comparing both the measured undrained shear strength and the undrained shear strength estimated using SHANSEP to the linear representation of the field vane shear. Only tests where shearing is performed from in situ stresses are included in the correlation (Tests 1, 3, 8 to 11). Figure 9 presents μ through the strata and thereby with increasing stresses.
Figure 9 μ found using the measured undrained shear strength and field vane shear strength. Values for μ fall in the range of 0.25 to 0.38 using the measured undrained shear strength. Using the SHANSEP parameters, μ decreases slightly from 0.35 to 0.28 in the upper part of the Søvind Marl, hereafter μ becomes constant around 0.3 through the remaining of the depth. Based on the tests, a μ-value of 0.3 is recommended for Søvind Marl.
6 CONCLUSION
The undrained shear strength of Søvind Marl was tested. Seven tests were conducted for this study; with additional results from four supplementary tests on Søvind Marl. All tests were conducted at Aalborg University, Denmark. Søvind Marl is highly fissured extremely plastic Danish clay. Søvind Marl is highly overconsolidated, with the appearance of an upper and lower bound of the preconsolidation stresses. The main focuses were to determine the undrained shear strength and its correlation to the field vane shear strength. The undrained shear strength increases almost linearlyl with increasing stresses. This tendency seems to have an upper cap at stresses equal to the lower bound of the

Undrained shear strength determination and correlations on Søvind Marl
IGS 439 NGM 2016 Proceedings
preconsolidation stresses, with maximum undrained shear strength of approximately 420 kPa. No final conclusion can be made due to very limited data in this stress range. Additional tests are recommended to further investigate this claim. The stresses are normalised using SHANSEP in order to determine the development of the strength through the depth. The SHANSEP parameters S and m were 0.58 and 0.22, respectively. Especially the m-value is affected by the fissured structure with a very low value, giving the strength found using SHANSEP an almost linear development. The SHANSEP parameters are only valid for stresses below the lower bound of the preconsolidation stresses. The undrained shear strength was finally compared to previously measured field vane shear strength to evaluate the influence of the fissured structure on the undrained shear strength in regards to the bearing capacity. Both the measured undrained shear strength and the strength estimated using SHANSEP was used. The relation between the shear strengths, μ (-), was between 0.25 and 0.38, with a mean value just above 0.3, confirming the findings of Christensen and Hansen (1959) with μ around 1/3. Based on the presented tests, a recommended value for μ is 0.3 for Søvind Marl. Figure 10 presents the undrained shear strength throughout the depth using the measured and evaluated strengths with μ=0.3. There is a good agreement with all the measured and evaluated strengths, validating the findings presented in this paper.
Figure 10 Estimated and measured undrained shear strength through the depth.
7 REFERENCES
Augustesen, A., Andersen, L., and Sørensen, C. S. (2005). Time Function for Driven Piles in Clay. Department of Civil Engineering, Aalborg University. ISBN:1398-6465.
Burland, J.B., Rampello, S., Georgiannou, V.N., and Calabresi, G. (1996). A laboratory study of the strength of four stiff clays. Geótechnique 46(3), 491–514.
Christensen, N.H. and Hansen, B. (1959). Shear strength properties of Skive Septarian clay. Bulletin No. 7. The Danish Geotechnical Institute.
Gasparre, A. and Coop, M.R. (2008). Quantification of the effects of structure on the compression of a stiff clay. Canadian Geotechnical Journal, 45: 1324–1334
Gasparre, A., Nishimura, S., Coop, M.R., and Jardine, R.J. (2008). The influence of structure on the behaviour of London Clay. Geótechnique 57(1), 19–31.
Grønbech, G.L (2015). Søvind Marl – Behaviour of a plastic fissured Eocene Clay. Aalborg University Press. ISBN: 978-87-7112-227-5. PhD-thesis
Grønbech, G.L., Ibsen, L.B. and Nielsen, B.N. (2015a). Preconsolidation of Søvind Marl—A Highly Fissured Eocene Clay. Geotechnical Testing Journal. Vol 38 (4). Pp. 501-510
Grønbech, G.L., Nielsen, B.N., Ibsen, L.B., and Stockmarr, P. (2015b). Geotechnical properties of Søvind Marl - a plastic Eocene clay. Canadian Geotechnical Journal. 52. Pp. 469-478

Investigation, testing and monitoring
NGM 2016 Proceedings 440 IGS
Jovičić, V., Coop, M., and Simpson, B. (2006). Interpretation and modelling of deformation characteristics of a stiff north sea clay. Canadian Geotechnical Journal 43, 341–354.
Krogsbøl, A., Hededal, O. and Foged, N.. 2012. Deformation properties of highly plastic fissured Palaeogene clay – Lack of stress memory?. In proceedings of NGM 2012, Nordisk Geoteknikermøde Vol. 1/2. 9th-12th of May 2012. Copenhagen, Denmark. 133-140
Ladd, C.C., Foott, R., Ishihara, K., Schlosser, F., and Poulos, H. G. (1977). Stress-deformation and strength characteristics. Proceedings of: International Conference on Soil Mechanics and Foundation Engineering, 9th, 1977, Tokyo, Japan.
Leroueil, S. and Vaughan, P.R. (1990). The general and congruent effects of structure in natural soils and weak rocks. Geótechnique 40(3), 467–488.
Madsen, J.V., Johannesen, C.L., and Vestergaard, K.T. (2008). Geotekniske egenskaber for tertiært ler ved Light*House (In dansih). Department of Civil Engineering, Aalborg University, Denmark. Master Thesis.
Mayne, P.W. (1988). Determining OCR in clays from laboratory strength. J. Geotech. Engng. Div. Am. Soc. Civ. Engrs. 108, GT6, Pp.75–92.
Thøgersen, L. (2001). Effects of experimental techniques and osmotic pressure on the measured behaviour of tertiary expansive clay, Volume 1. Soil Mechanics Laboratory, Aalborg University, Denmark. Ph.D. Thesis, ISSN: 1398-6465 R 2016.
Vitone, C., Cotecchia, F., Viggiani, G., and Hall, S.A. (2013). Strain fields and mechanical response of a highly to medium fissured bentonite clay. International Journal for Numerical and Analytical Methods in Geomechanics 37, 1510–1534.