influence of service and product quality on customer retention
TRANSCRIPT

Academy of Education and Economic Studies
Department of Business and Economic Studies
Influence of Service and Product Quality on
Customer Retention A Swedish grocery store
Authors
Mushtaq Hussain
Pratibha Ranabhat
April 2013
Second Cycle
Supervisor:
Prof. Maria Fregidou-Malama

Abstract
Title: Influence of service and product quality on customer retention, case of Swedish
grocery store.
Level: Master thesis of Master in Business Administration (60hp)
Authors: Mushtaq Hussain & Pratibha Ranabhat
Supervisor: Maria Fregidou-Malama
Aim: The aim of this study is to examine and compare the importance of services and
products in grocery store and to study the effects of services and products on customer
retention.
Method: This study is quantitative and data is collected by conducting a survey. Primary
data is collected through questionnaires by visiting the stores in two cities of Sweden, namely
Bollnäs and Gävle. In order to study the importance of service and products, importance scale
is used in the questionnaire. Comparative analysis is used to analyze the data.
Results & Conclusions: The results show that customers are more concerned about the
quality of products rather than quality of services. Further, it is found that among all service
elements, personal interaction is considered more important whereas, among products
elements, quality of products has most influence on customer decisions. After the comparison
of services and products, we found out that product quality influences customer retention to a
greater extent.
Suggestions for future research: Research always continues and could be followed up
with more perception dimensions either from customers’ perspectives or from managerial
perspectives. Future research can be conducted to study managerial perception of service and
product quality. Furthermore, future research can be conducted to find out other factors that
determine customer retention. Customers from multiple stores and larger cities can also be the
theme for future researches.
Contribution of the study: This study helps retail business to build strong customer base
by focusing first on quality of products and then services. Further this helps firms to know
how customer’s decision making is affected. Firms with limited resources can first focus on
product improvement then on services.
Key words: Customer retention, Product quality, Service quality, Retail service quality
scale, Products dimension, repurchases intention.

Acknowledgement
Contributions from many people have made this study successful and happen to give a final
look. We are very thankful to COOP family from Bollnäs and Gävle including Human
Resource Manager Susanne Lindqvist, who extended their great support and co-operation in
completing our survey. The main focal strength of every research paper is “respondent”,
therefore, we want to convey a heartily thanking to all our respondents.
Moreover, our sincere gratitude goes to our supervisor Prof. Maria Fregidou-Malama, whose
creativity, knowledge and experience acted as a pivotal support for us.
Nevertheless, we are very grateful to our family and friends for their kind support and
understanding during our writing phase.
All in all, we want to thank our almighty lord for giving us strength and power to carry out all
our knowledge in words.
Mushtaq Hussain
Pratibha Ranabhat
University of Gävle

Table of Contents Chapter 1: INTRODUCTION............................................................................................................. 1
1.1 Background ................................................................................................................................... 1
1.1.1 Measurement of service and product quality .......................................................................... 2
1.1.2 Importance of service and product quality in grocery stores .................................................. 3
1.2 Need for the study ......................................................................................................................... 4
1.3 Research Purpose .......................................................................................................................... 5
1.4 Research Questions ....................................................................................................................... 5
1.5 Delimitation of the study ............................................................................................................... 6
1.6 Disposition of the work ................................................................................................................. 6
Chapter 2: LITERATURE REVIEW AND THEORETICAL FRAMEWORK ........................... 8
2.1 Service Quality .............................................................................................................................. 8
2.2 Retail Service Quality Scale ........................................................................................................ 10
2.3 Product quality ............................................................................................................................ 12
2.3.1 Product quality dimensions .................................................................................................. 13
2.4 Customer retention: ..................................................................................................................... 15
2.4.1 Relationship commitment and Customer retention .............................................................. 16
2.5 Service quality, product quality and customer retention ............................................................. 17
Chapter 3: METHODOLOGY ......................................................................................................... 19
3.1 Choice of the study ...................................................................................................................... 19
3.2 Research philosophy .................................................................................................................... 19
3.2.1 Ontology ............................................................................................................................... 20
3.2.2 Epistemology ........................................................................................................................ 20
3.3 Research approach ....................................................................................................................... 21
3.4 Research strategy ......................................................................................................................... 21
3.5 Research Design .......................................................................................................................... 22
3.6 Research sampling and data collection ........................................................................................ 22
3.6.1 Data collection: ..................................................................................................................... 23
3.6.2 Data analysis and presentation: ............................................................................................ 24
3.7 Reliability, validity and generalizability ..................................................................................... 24
Chapter 4: EMPIRICAL FINDINGS ............................................................................................... 26
4.1 COOP .......................................................................................................................................... 26
4.1.2 COOP in Gävleborg ............................................................................................................. 26
4.1.3 COOPs membership benefits ............................................................................................... 27
4.2 Descriptive statistics .................................................................................................................... 29

4.2.1 Demographics ....................................................................................................................... 29
4.3 Descriptive statistics for service and products elements ............................................................. 30
4.3.1 Importance of Product elements ........................................................................................... 31
4.3.2 Importance of service elements: ........................................................................................... 36
4.3.3 Product and service elements comparison: ........................................................................... 39
Chapter 5: DISCUSSION AND ANALYSIS ................................................................................... 42
5.1 Service Quality and Customer Perception ................................................................................... 42
5.1.1 Service elements comparison ............................................................................................... 43
5.2 Perceived product quality ............................................................................................................ 44
5.2.1 Product elements comparison ............................................................................................... 45
5.3 Effects on customer retention ...................................................................................................... 46
Chapter 6: CONCLUSION ............................................................................................................... 50
6.1 Findings and comments ............................................................................................................... 50
6.2 Implications ................................................................................................................................. 51
6.2.1. Managerial implications ...................................................................................................... 52
6.2.2. Social implications .............................................................................................................. 52
6.2.3. Theoretical implication ........................................................................................................ 53
6.3 Reflections and suggestions for future research .......................................................................... 53
REFERENCES .................................................................................................................................... 55
Literatures .......................................................................................................................................... 55
Internet sources.................................................................................................................................. 62
Appendix A ........................................................................................................................................ 64
Questionnaire..................................................................................................................................... 64
Appendix B ........................................................................................................................................... 66
Summary of item (P1-P28) of Retail Service Quality Scale ............................................................. 66
Appendix C .......................................................................................................................................... 68
Tabular presentation of the data ........................................................................................................ 68

List of figures
Figure 1: Retail Service Quality Model…………………………………………... .. 11
Figure 2: Conceptual Framework…………………………………………………... 17
Figure 3: COOP’s new dividend scheme…………………………………………… 28
Figure 4: Gender Percentage of sample…………………………………………….. 29
Figure 5: Different age group of sample……………………………………………. 29
Figure 6: Ratio of members and non-members of COOP store…………………….. 30
Figure 7: Frequency of purchase of customers……………………………………... 30
Figure 8: Importance of products quality………………………………………….. 31
Figure 9: Importance of products durability……………………………………….. 32
Figure 10: Importance of products performance…………………………………… 32
Figure 11: Importance of product’s ingredients……………………………………. 33
Figure 12: Importance of physical look of products……………………………….. 34
Figure 13: Importance of all elements of products shown combine……………….. 35
Figure 14: Importance of store appearance and layout……………………………... 36
Figure 15: Importance of personal interaction……………………………………… 37
Figure 16: Importance of problem and complaints handling……………………….. 37
Figure 17: Importance of parking place and operating hours………………………. 38
Figure 18: Importance of all service elements shown combine……………………. 38
Figure 19: Product and service quality comparison………………………………... 39
Figure 20: Product and service quality comparison………………………………... 40
List of Tables
Table 1: Garvin’s Eight Product Quality Dimensions…………………………….. 14

Hussain M. & Ranabhat P. University of Gävle 1
Chapter 1
INTRODUCTION
In this chapter, the concepts of service quality and product quality are presented. The relation
between service and product quality and customer retention are also discussed in the
perspective of retail stores. Then measurement and importance of service and product quality
are explained. Furthermore, the reason behind conducting such a study is discussed. Finally,
the research purpose and research questions are presented.
1.1 Background
Organizations continuously strive to increase their customer base. They provide products and
services to fulfill different needs of the customers. The focus is now moving from short-term
satisfaction to long-term relationship between the firm and its customers (Grönroos, 2000).
Finding new customers is important for a business, but equally important is keeping the old
customers since many researchers found that focus on customer retention has resulted in
economic benefits (Buttle, 2004; Dawkins and Reichheld, 1990).
With the change of time and situation, the scenario of business world is increasingly being
competitive. On contrary, due to globalization and internationalization the competitiveness of
business environment, either from national or international market, strongly motivates or
develops the awareness about the consumer right along with their expectations and demands
(Smith, 1989; Sellers, 1990). According to Berry (1986), it would be beneficial to categorize
this concept into two identical terms as ``goods'' or ``services''; however, in real life goods
retailers still offer for some form of service in order to motivate and facilitate higher level of
sale of goods leading to have the relative influence in customer retention.
Customer retention is considered to be the primary goal for organizations that practice
relationship marketing (Coviello et al., 2002). Once a customer is retained it means that the
amount of purchase grows which in turn reduces the customer replacement costs. Retained
customers may pay higher prices and purchase regularly without any discount offers which is
the tool used to acquire new customers (Ang & Butle, 2006). Interesting findings by
Lindgreen, et al. (2000, p.295) state that “it can be up to ten times more expensive to gain new
customer than to retain a customer and the cost of bringing new customer to the same level of

Hussain M. & Ranabhat P. University of Gävle 2
profitability as the lost one is up to 16 times more”. This emphasizes on the significance of
customer retention and its desirable outcomes for organizations.
Customer retention and service quality have been studied by many researchers in various
industries (Venetis and Ghauri, 2004; Ranaweera and Neely, 2003) and their results have
shown positive relation between service quality and customer retention. It has been found that
service quality boosts customer’s inclination to buy again, to become fewer prices sensitive,
and to share with others their positive experiences (Bolton et al., 2000). Similarly, these
findings can be applied in retail setting where in today’s competitive retail sector, retailers no
longer will afford to dissatisfy their customers on services side. Moreover, the significance of
product quality in retail sector should also not be overlooked because the higher the quality in
relation to price, the higher the value for customer. Quality of product can be assessed from
Garvin’s (1987) eight product quality dimensions i.e. performance of products, features of
products, reliability and conformance of products, durability, serviceability, aesthetics, and
perceived quality of products.
Both quality of services and products in retail sector are considered to be vital for survival and
success of the firm. Highly intensified and competitive retail industry has compelled firms to
pursue strategies which could yield higher value for customers. Many small retailers could not
survive in market because large retailers provide greater value both from service quality and
product quality perspectives (Clarke, 2000).
1.1.1 Measurement of service and product quality Measurement of service quality and product quality are completely different because product has
concrete characteristics as mentioned earlier the Garvin’s (1987) product quality dimensions such
durability and performance. According to Helkkula A. (2011), service is considered as an
experience which can be understood as a “hedonic impression” or as a “practical contact”.
Here, he assumes “hedonic impression” as an imaginary world and “practical contact” for
instance contains of observable facts or events. In other word, it is an intangible activity
which is results at the point of sale and also when required by the consumer.
In general sense, product is a solid substance which is manufactured for sale. Marketing
defines product as a thing that is offered to a market leading to satisfy a need and wants of a
consumer. In retailing , products are termed as merchandise. A good or service that most

Hussain M. & Ranabhat P. University of Gävle 3
closely meets the requirements of a particular market and yields enough profit to justify its
continued existence. (Business dictionary)
However, due to intangible feature of services it is difficult to measure as it is totally
dependent on how one perceives certain service encounter. According to Douglas and Connor
(2003), the intangible characteristics of services such heterogeneity, inseparability,
perishability are critical in determining the quality of services from customer perspectives.
The intangibility of services means there is no any physical product to see, to taste or smell.
For example services provided by a telecommunication company whereas, in a retail store this
characteristic is hard to notice as they are mainly focused on products. The second element of
service is heterogeneity which means during the delivery of services it differs from one
situation to another due to differences in human behavior. This element is quiet noticeable in
retail setting, e.g. the salesperson in counter cannot have the same level of interaction with
everyone or cannot offer 100% the same thing to all the customers because of the differences
in human behavior (Beamish & Ashford, 2007). These elements of services make it difficult
to measure service unlike products quality which is more objective like the number of defects
etc. (Parasuraman et al., 1988).
1.1.2 Importance of service and product quality in grocery stores
Product and services were considered to be two different identical terms in past decades,
however, the evolutionary chain of business world has made these two terms complementary
to each other for any business house. Especially, in the emerging market for grocery chains or
departmental stores the concept of providing service quality is significantly important together
with the product quality. These two factors are very importantly viewed as a success factor for
customer retention. Similarly, referring to the current situation, quality of the product
perceived by the customers may be a complete combination of the actual quality of the
product that customers purchase, and customers’ viewpoint of the overall quality of that firm
where they purchase (Waller & Ahire, 1996). Therefore, based upon the nature of customer
viewpoints and behaviors, quality of service is measured by the customer in terms of the
“products” the customer purchase. Thus it is important for every organization, to determine
what customers expect and then develop service products that meet or exceed those
expectations and enables to have higher retention rate in future. Focusing on our case
company, which is a rapidly growing grocery chain we consider that the degree of service and
product quality is very high in terms of gaining the long term commitment from customer side

Hussain M. & Ranabhat P. University of Gävle 4
and helps the firm to maintain stronger relationship between company and customer. The
development of the mutual understanding and creation of long term buyer-seller relationships
(Wilson, 1995) is the key factor for maximizing customer loyalty.
Generally, grocery stores are designed with the self service facilities where customers are
motivated to find the product that want to purchase. However, the prospective are changing
and the customers are more or less influenced by the service along with the product quality.
According to Kotler (1973), the buying environment is more specifically determined by the
customers to make the purchase decision. He further states that the buying environment
considers the service the store provides. The better understanding and the knowledge of
maintaining service and product quality is always motivational for customer oriented firms
like grocery store, supermarkets etc. in order to retain the number of loyal and new customers.
According to Szymanski and Henard (2001), for any customer oriented firms, customer
satisfaction is a key strategy for business success. Thus, we can find that there has also been
several attempt to better understand and know the dynamics of the relationship between
customer satisfaction and service quality on the impact of customer purchase intentions which
has positive inclination towards gaining the higher number of retention rate (Cronin et al.
2000 ; Taylor, 1992; and Taylor and Baker, 1994).
1.2 Need for the study
The delivery of high quality services is considered to be profitable strategy for success in
today’s highly competitive market so is the case for retail industry (Reichheld and Sasser,
1990). Its significance in the success of business can be assessed by the shift occurred in
contemporary businesses concentration. Previously, businesses were focused only on product,
however, today their focus is both on the quality of products and services (Gummesson,
1994). Retail stores main focus is on the quality of products but the way these products are
delivered to the customers, the retail stores and its staff interact and communicate with the
customers, these and many other features are included in the service category of retail stores.
Many studies have shown the importance of high quality services and high quality products to
the success of business and the measurement of service quality in different models like
SERVQUAL, SERVPERF and RSQS (retail service quality scale). It is also argued that those
customers satisfied with service quality of the store are more likely to remain loyal to the
store ( Wong and Sohal, 2003). The higher the numbers of loyal customers the greater the

Hussain M. & Ranabhat P. University of Gävle 5
customer retention for a firm, thus prevailing studies have some supporting points for the
positive relation between customer retention and store service quality.
Swedish food retailing industry has shown significant growth since 1991 (Statistics Sweden,
2011). It was composed of small and medium sized stores in the early days but now it is
totally dominated by stores as COOP, and ICA. Grocery stores are facing intense competition
therefore, it is crucial for them to gain better understanding of their customers so that they are
attracted as well as maintained for long period (Carpenter & Moore, 2006). This competition
has forced food retailers to think of ways to generate profit by differentiating their products
and/or services from their competitors so that customers are retained to a greater level.
We consider the need to conduct such a study where we could compare the importance of
service quality with that of product quality grocery stores from customer perspectives and to
examine which of them has higher influence on customer purchase and repurchase decision.
Various researches (Douglas and Connor, 2003; Carpenter and Moore, 2006; Wong and
Sohal, 2003; Parasuraman et al. 1988) have focused only service quality and customer
retention and service quality measurement tools but our focus is on service and product
quality and their relative influence on customer retention.
1.3 Research Purpose
In our study, we aim to examine the extent to which product and service quality influence
customer retention in food retailing. Service quality has been found having profound effects
on long-term customer retention (Venetis & Ghauri, 2004). However, we are interested in
finding whether it is service quality or product quality in food retailing that has greater effect
on customer retention and influences customer to repurchase and keep them attached to a
single brand/store.
The aim of the study is
“To examine and compare the importance of product quality and service quality in food
retailing and their effect on customer retention”
1.4 Research Questions
What is the importance of service quality for customers?

Hussain M. & Ranabhat P. University of Gävle 6
Which product quality dimensions have greater influence on customer purchase
decision?
What are the effects of service quality and product quality on customer retention?
1.5 Delimitation of the study
This is a quantitative study limited to survey where data is collected through questionnaires.
This study focuses on specific business sector which is retailing industry and in specific
location, Sweden. A Swedish retail chain which is called COOP is selected as the case of our
study. Further we assume that the branches of COOP allover Sweden provide the same
products and services, therefore, our findings may be applicable for the customers of COOP.
Our study is limited to only two cities of Sweden, namely Bollnäs and Gävle and may not be
generalized for the rest of Swedish retail stores or those out of Sweden.
1.6 Disposition of the work
Chapter 1: Introduction
This chapter includes the concepts of service quality and product quality are presented. The
relation between service and product quality and customer retention are also discussed in the
perspective of retail stores. Then measurement and importance of service and product quality
are explained. Furthermore, the reason behind conducting such a study is mentioned. Finally,
aim of study and research questions is presented.
Chapter 2: Theoretical Framework
In this chapter we shed light on literature and concepts related to our topic. This discussion
includes concepts like quality, and service and product quality. To make easily
understandable various theories, we have put some figures which were developed by
respective authors. The second important part is mentioning quality and its importance from
product perspective and related literature on product quality. Finally we put together theories
on customer retention and their relation with service quality and product quality.
Chapter 3: Research Methodology
Research philosophy, research strategy, sampling and data collection method are discussed in
this chapter. Moreover, research philosophy is further described with its two different
positions called ontology and epistemology. They are followed by research design and finally
reliability, validity and generalizability of study is discussed.

Hussain M. & Ranabhat P. University of Gävle 7
Chapter 4: Empirical Findings
The fourth section starts by a brief introduction of the company whose customers are
investigated. Then all the empirical findings are presented by the sequence of questions in the
questionnaire. Empirical data is presented in the form of figures plus explanation.
Chapter 5: Analysis & Discussion
As its name implies this chapter contains the analysis of empirical data and other theories. It
begins with the analysis of service quality where all its components are discussed and
followed by discussion of product and its components. At the end, the importance of service
quality and product quality and their respective influence on customer retention is analyzed.
Chapter 6: Conclusion
In the conclusion, we present the results of our findings and answer the research questions.
Furthermore, the managerial, theoretical and social implications are discussed. Finally,
suggestions for future research and reflections of author are mentioned.

Hussain M. & Ranabhat P. University of Gävle 8
Chapter 2
LITERATURE REVIEW AND THEORETICAL FRAMEWORK
In this chapter we shed light on literature and concepts related to our topic. This discussion
includes concepts like quality, and service and product quality. To make easily
understandable various theories, we have put some figures which were developed by
respective authors. The second important part is mentioning quality and its importance from
product perspective and related literature on product quality. Finally we put together theories
on customer retention and their relation with service quality and product quality.
2.1 Service Quality
Quality is defined in different perspectives, as Garvin (1987) explains quality from product
perspective. The attribute possessed by the ingredients of a product defines its quality.
Another widely recognized perspective is user perception of quality which is used in
marketing. This approach is based on customer expectations from a product or service where
it emphasizes more on user (Juran, 1974). Moreover, quality has been defined in a value
creation approach which emphasizes on product or service performance in comparison with
price (Feigenbaum, 1951). The same product with different prices in different locations may
be perceived differently on quality basis because a lower price will yield lesser expectations
from product thus resulting in an acceptable level of quality and vice versa.
Service quality is defined as “the global evaluation or attitude of overall excellence of
services” (Parasuraman et al. 1985). Service quality is the difference between customer
perceptions of how well the service meets customer expectations. As Nitecki and Hernon
(2000), define service quality in terms of “meeting or exceeding customer expectations”.
Unlike products quality, the quality of services cannot be measured objectively rather it is
more a subjective term. Similar services with similar quality are perceived differently because
it is totally dependent on personal perception of the service encounter. In order to understand
well the quality of services, their determinants should be identified which could determine
what the quality of service is for a customer (Parasuraman et al. 1985).
According to Grönroos (1984), quality of service as perceived by customer has three
dimensions: functional (service delivery process), technical (the outcomes which are produced
for the customer) and image (image of the company in the minds of customer). If we consider
these perspectives in a retail setting, the functional dimension can be an example of how the

Hussain M. & Ranabhat P. University of Gävle 9
personnel of a retail store interact with the customer during their visit to the store. The
technical side of services is the example of how well customer’s problems are solved or how
well the complaints are handled.
It seems like European perspective has more dominant and influent role in the field of service
quality management and measurement. Lehtinen and Lehtinen (1982) define service quality in
three different aspects i.e. physical quality, interactive quality and corporate image quality. As
its name implies physical quality relates to the tangible aspects of service whereas, interactive
quality relates to the nature of interaction of services and focuses on the two way flow
between service provider and the customer. The third characteristic is about the overall image
of service provider in the mind of current and potential customers. As compared with the first
two quality aspects, the last is more stable in the long term.
Another widely used service quality model is proposed by Parasuraman et al. (1985) which is
named as SERVQUAL model for measuring service quality. He studied five different types of
service as banking industry, credit card companies, motor repair and long-distance
telecommunication. The five dimensions are reliability, responsiveness, assurance, empathy
and tangible.
This model has been widely used in different industries for measuring service quality but also
came under criticism by many writers because it neglected the technical side of services. The
criticism is on that SERVQUAL model only focuses on service delivery process which is
called as functional dimension of service quality, but it excluded the service encounter
outcomes (technical dimension). The technical dimension or outcome means the core service
provided by a service provider and also is the main motivating element e.g. haircut (Pollack,
2008).
The importance of corporate image has also been emphasized because customer comes with
their earlier experiences and perception of the firm in any service encounter (Grönroos, 2001).
Corporate image works with functional dimension to develop the overall service experience.
A combine and comprehensive model was proposed by mixing functional dimensions of
Parasuraman et al. (1985) and technical and corporate image of Grönroos (1984) and Lehtinen
and Lehtinen (1982) to form more complete model of service quality (Kang & James, 2004).

Hussain M. & Ranabhat P. University of Gävle 10
However, service model developed by Kang and James (2004) were applied in
telecommunication industry and there is no evidence if this model fits the service environment
of retail. This model is suitable for purely service firms whereas, retail industry provides both
services and products to their customers at the same time. Another study conducted by Finn
and Lamb (1991) in order to test SERVQUAL model in retail stores. They concluded in order
to study services of a retail store, SERVQUAL model is not a good fit. In addition, this cannot
be applied for retail setting without modification. Therefore, the need to develop a specific
service quality measurement tool resulted into development of Retail Service Quality Scale
(RSQS) by Dabholkar et al. (1996).
2.2 Retail Service Quality Scale
Dabholkar et al. (1996) state that measures which are developed to study service quality of a
purely service environment such SERVQUAL does not work when it comes to service quality
for retail stores. Therefore, he came out with his model called the Retail Service Quality Scale
(RSQS). This scale is capable of measuring five different dimensions of store service quality
which is developed considering 28 items, 11 are taken from SERQUAL and remaining 11
items are discovered by qualitative research. The dimensions are namely as:
1. Physical aspects
2. Reliability
3. Personal interaction
4. Problem solving
5. Policy
According to Dabholkar et al. (1996), the above service characteristics of retail store are
structured hierarchically, where every element is further divided into more understandable
features as shown in figure 1.

Hussain M. & Ranabhat P. University of Gävle 11
Figure 1: Retail Service Quality Model
Source: (Dabholkar et al., 1996, pp.6)
(Consult appendix B for the explanation of the items from P1 to P28)
These dimensions are explained as following:
1. Physical aspects – Layout, comfort, aesthetics elements and style of the store are part
of this dimension.
2. Reliability – fulfilling promises and service performance.
3. Personal interaction – the behavior of service personnel such being courteous,
helpful, confidence and trust in customers.
4. Problem solving – helping customers in case of returns, exchanges and complaints.
5. Policy – rules and principles that guide organizations to operate such as convenient
operating hours, availability of parking spaces and payment options.
For a retail store the physical features among others include equipment of store, materials
associated with services of stores, convenience of store’s physical layouts. Physical features
have been depicted as “servicescape” which is combination of service and landscape. This

Hussain M. & Ranabhat P. University of Gävle 12
includes features like noise, temperature, air quality, furnishing, signs, and symbols (Bitner,
1992). According to Kotler (1994), environment of store is important part of shopping
experience which even can influence the customer decision whether to visit again.
Reliability of services in retail means keeping promises, provision of right services and
availability of merchandise. Personal interaction dimension dictates the knowledge of
employees, confidence, and providing prompt service, willing to help customers and handle
customers on individual basis (Zeithaml, 1988). Personal interaction is of utmost important
for retailer to maintain high quality of services and maintaining the customers satisfied. This
will result in sense of personal attachment and personal feeling to the brand. Thus, an
important factor for retail loyalty and customer retention is personal interaction and
relationship between the retailer and its customers, between the salesperson and the customers
(Macintosh, 1997).
Problem solving means the handling of complaints, returns and exchanges. Retailer’s
willingness to act promptly at any service encounter and resolve customer’s problems
sincerely are included under this feature (Mehrabian, 1974).
General policy it addresses the policy of retailers regarding the quality of merchandize,
convenient operating hours and parking place in addition methods provided by retailers to
make easier payment process. This can be done through supporting major credit cards. It also
reflects norms and values of retailer, and its code of conduct. (Das et al. 2010).
RSQS has been used by researchers in different types of retailing stores. And this model has
been validated in a retail store environment. In our study, we investigate and study services in
retail store based on dimensions mentioned in RSQS because they are specifically developed
for retail settings. As our study focuses both service and product quality so below we shed
light on important concepts related to the quality of products and related theories.
2.3 Product quality
Product quality can also be defined as an extent to which a product succeeds to meet the needs
of the customer (Lemmink & Kasper , 1994). According to product based approach, the
quality is the root of economics and the variation in quality of product are the reflection for
differentiation in quality (Garvin, 1984). Product quality is one of the important tools to
maintain the competitive advantage in market which is designed to undergo the product

Hussain M. & Ranabhat P. University of Gävle 13
development process to achieve the consumer satisfaction and upgrade the quality in
performance (Benson et al., 1991; Flynn et al., 1994). To be more specific and precise, further
study from different researcher shows that along with the competitive advantage the product
quality is also a basis for strategic advantage, which implies that an enhanced performance
can be determined when a product quality is improved (Daniel and Reitsperger, 1991 and
Terziovski et al. 1999). Ultimately, this suggests that a real product quality is/should be
visible in an improved quality performance (Dunk, 2002).
The study of a product quality and its extrinsic influential characteristic with reference to
customer retention, the image of product itself is more essential than the physical quality of
product (Shasharudin et al. , 2010). Moreover, they note in their findings that a better and a
good customer relationship is stronger when there is a product awareness and these both
factors are critically important for shaping the customer perception. According to Zeithaml
(1981), search properties include such traits like color, style, price, fit, and smell. Here, search
properties those characteristics of product and service attributes which can be easily compared
and observed by the customers before they make the purchase of product or services.
Moreover, he finds that products (e.g. goods) have more search qualities than services, with
more experience and credence qualities. Here, credence properties are those characteristics of
product and service attributes that cannot be differentiated even after the product, or service,
has been purchased and consumed. Similarly, experience properties are those characteristics
of product and service attributes, which can only be evaluated after purchase and use of the
product, or the actual consumption of the service is done (Kenyon, Sen, 2012).
2.3.1 Product quality dimensions
There are eight different dimensions such as 1) performance 2) features 3) reliability 4)
conformance 5) durability 6) serviceability 7) aesthetics and 8) perceived quality (Garvin,
1984, 1987). The brief illustration of each dimension is given in table 1:

Hussain M. & Ranabhat P. University of Gävle 14
Table 1: Garvin’s Eight Product Quality Dimensions
Source: (Rose and Nabil, 2002, pp.445)
According to Garvin (1987); quality is primarily stated as strategic question which governs or
helps to control the development of product design together with its features or options. Every
firm is objected towards achieving a world class performance, and for that they adopt a
method and set the strategic objectives in order to improve the product, process and service
quality (Adam, 1992). In addition, Hill (1994) states that product quality is significant factor
for firm’s development and for gaining sustainable competitive advantage.
Moreover, Garvin forwards his view that the past experience with a firm and its product plays
a vital role in maintaining the customer impressions about its products. He states that “high
quality means pleasing consumers, not just protecting them from annoyances” (p. 104). He
suggests that with respect to quality management and the related design of products or
services, management needs to think strategically about quality, and focus on those

Hussain M. & Ranabhat P. University of Gävle 15
dimensions that support their strategic objectives and are interrelated to each other and
influencing customers for its product and services. When an individual make a purchase
decision, the primary objective begins with the motive of having a satisfaction from the
product they purchase. This is also related to the character of “performance” proposed by
Garvin from customer perspectives. Supporting to the given dimensions by Garvin, other
several researchers have made the empirical investigations on it. For example; Stone-
Romero et al. (1997) studies provide support to the multi-dimensional nature of product
quality; Paulson-Gjerde and Slotnick (1997) also forwarded a multidimensional approach to
study manufacturing quality; Ahire and Dreyfus (2000) find that the management of product
design is equally important as the management of process quality; Sousa and Voss (2002)
point out that future research should focus upon the fundamental nature of an organization’s
products and use measures that capture the relevant dimensions for those products. Thus, we
can assume that the Garvin’s proposed dimensions are a knowledgeable kit for studying a
product quality.
Furthermore, in addition to the characteristics of product defined by Garvin (1987) and Han et
al. (2000) link two new dimensions “form” and “function” to product usability. Therefore,
product form can be defined as the customer’s image and impression of the product. Here,
product functions are relevant to the product’s performance. However, these both dimensions
are essential in creation of value and maintaining customer satisfaction (Roozenburg and
Eckels, 1995).
2.4 Customer retention:
Defining in own words, customer retention can be mentioned as the process of buying
products and services within certain time span in a repetitive nature (Sirdeshmuk et al., 2002).
Along with this, in general, when there is higher cost of customer acquisition in comparison
with the lower cost of serving, it tends to make the repetition of customers and consequently
lead to increase in profitability. Hence, in this circumstance firms are advised to increase the
customer retention level (Edward and Sahadev - 2011). Customer retention has been
traditionally associated with perceived service quality, perceived value and customer
satisfaction (Bloemer et al., 1999). However, many practitioners have found different
conceptualization of customer retention in their research work.
Hussain M. & Ranabhat P. University of Gävle 16
According to Bowen and Chen – (2001), there are three approaches in measuring retention 1)
behavioral measures, 2) attitudinal measures and 3) Composite measures. On the basis of
service quality, the retention is treated as an observed behavior (Liljander and Strandvik,
1994). However, the behavioral measures of retention criticized by different researchers as
only on the basis of reoccurring purchasing nature of the customer, it lacks the
conceptualization on its measures which does not even differentiate loyal customers or their
attachment to a particular product or brand (Day, 1996; Dick and Basu, 1994). Similarly,
another measure attitudinal approach focuses on the emotional and psychological aspects of
customer attachment co-relating to the retention (Bowen and Chen, 2001). And, the last
approach is the combinational form of both approaches named as a composite measure which
studies both behavior and the cognitive nature of customer (Bloemer et al., 1998). According
to Oliver, 1999, the most important aspects in obtaining an absolute retention are the
composition of psychological and attitudinal measures with the nature of repeat purchase.
Conclusively, we can visualize in this research that customer retention is the frequency of
repeat purchasing nature of customer with the combination of attitudinal and cognitive
measures. Customer retention also signifies a long-term commitment between customer and
the firm to maintain a certain relationship by developing a form of the mutual commitment
and leading to create long term buyer-seller relationships (Wilson, 1995).
2.4.1 Relationship commitment and Customer retention
Commitment is one of the important tools for any business house. With the nature of our
research objective, discuss about the relationship commitment which is also one of dynamic
concept in business world. Commitment is significant variable in business relationships that
provides the strength, stability, durability, and even profitability of a relationship (Dwyer et
al., 1987; Morgan and Hund, 1994). Actually, most of the findings illustrate the relationship
as a perceived value for future perspectives. We can find two different dimensions studied
under the relationship commitment: 1) affective commitment and 2) calculative commitment
(Kumar et al., 1994; Geyskens et al., 1996). They state that affective commitment is
willingness to have a continuation of the relationship for own excluding any instrumental
values. Whereas, further they state that calculative commitment is highly defined on the basis
of instrumental commitment nature for instance it includes costs, investments, benefits and
any other related investment types.

Hussain M. & Ranabhat P. University of Gävle 17
2.5 Service quality, product quality and customer retention
Service quality is defined as customer’s valuation of product’s distinct quality (Zeithaml,
1988). It is conceptualized view about the customer’s evaluation with respect to their
expectation and perceived performance (Parasuraman et al., 1988; Bolton and Drew, 1991). In
this research study, we focus on service and product quality from the customer perspectives
relating to the consumptions of goods and services in a grocery chain market. We draw a
conclusive framework relating to theoretical discussions of our study and illustrate in
diagrammatical form in figure 2.
Figure 2: Relationship between service quality, product quality and customer retention
(Source: Own construction)
The above Figure 2 represents the theoretical framework of this study. The theoretical
framework of our study consider Retail Service quality scale (RSQS) of Dabholkar et al.
(1996), and product quality dimensions of Garvins (1987), and their effect on customer
retention. RSQS is a tool used to measure store service quality in four different dimensions
which are as physical aspects, personal interaction, problem solving and policy. Physical

Hussain M. & Ranabhat P. University of Gävle 18
aspect is very important for making a re-purchase decision. When customers visit any store,
they always desire to have a physical comfort for instance; physical layout, signs and
symbols, available equipments in store (Bitner, 1992). Retention rate is also highly influenced
on how the service personnel interact with customer and be able to develop a trust and
confidence. Similarly, the factors like problem handing of the customer and the policies set by
the firm also dedicate a positive influence in customer retention.
Moreover, the framework representing the product quality dimensions developed by Garvin
(1987) includes dimensions like performance, perceived quality, durability, ingredients and
physical look. Product quality is the overall utility of product by customers based upon the
perceived value between what is received and what is given (Zeithaml, 1988). And, customer
retention is indicated as customer’s intentions to make the repetitive purchase of a product
and service. In this study, the importance of service quality dimensions and product quality
dimensions are examined in relation to customer retention. Thus, according to this conceptual
framework, the factors from Retail service quality scale and Product quality dimensions are
significant for any retail form which has direct influence on the repurchase decision of the
customer. Therefore, our study suggests that the consideration of these factors in positive way
can yield a higher retention rate of customer with an optimal profit.

Hussain M. & Ranabhat P. University of Gävle 19
Chapter 3
METHODOLOGY
In this chapter the reason to conduct this specific study is explained. Moreover, research
philosophy, research strategy, sampling and data collection method is discussed. Research
philosophy is further described with its two different positions called ontology and
epistemology. They are followed by research design and finally reliability, validity and
generalizability of study is discussed.
3.1 Choice of the study
Retail stores are the real point of interaction between customers and organizations. Their
importance in today’s society cannot be overlooked, especially the significance of grocery
stores. Product characteristics are no doubt the crucial factors that influence customer
purchase decision and repurchase decision. But due to similar products almost in competing
stores have compelled firms to differentiate them from their competitors where they provide
various types of services in order to gain a competitive advantage over their competitors.
Services at a grocery store may include fast and flexible payment options where customers do
not have to wait in queues, easy handling of customer’s problems and complaints, convenient
working hours, place for children to play etc.
Considering the importance of these two factors i.e. product quality and service quality, we
consider the need to conduct such a study where we could examine their relative importance
and influence on customer purchase decision and customer retention. Most importantly, their
impact on customer retention is our major interest because this will indicate their long-term
effect on overall organization sales pattern.
Secondly, we chose to study service and product quality and their impact on customer
retention because we want to find out whether an organization should focus only on product
quality or service quality or both of them and if both of them, to what extent should they give
importance to services and to what extent to products, in order to retain their current
customers and attract new customers.
3.2 Research philosophy
The choice to whether conduct a qualitative or quantitative method depends upon the
assumption of nature of knowledge and reality, how the knowledge and reality are perceived.

Hussain M. & Ranabhat P. University of Gävle 20
Concerning the nature of knowledge and reality, different assumptions can be formed
enabling the researcher to choose a particular research approach. These assumptions help
formulate research process ranging from methodology to type of questions applied
(Hathaway, 1995). There are two different research philosophies which are ontology and
epistemology.
3.2.1 Ontology
Ontology means the nature of social reality, where it states whether reality is objective and
external or is subjective and constructed cognitively on individual basis (Long et al., 2000).
Objectivism is an ontological position which means that social phenomena is an external fact
that is not influenced by individuals, whereas, constructivism is another ontological position
which states that social phenomena is not external and objective rather they are constructed by
different actors (Bryman & Bell, 2007).
We believe that reality exists which can be perceived; service quality, product quality,
customer satisfaction and customer retention exists out there which are external to customers.
Organizations can improve service and product quality in order to maintain a desirable
customer retention rate. It is an acceptable fact that higher customer retention is one of the
effects of either good service quality or product quality. Customer retention, service quality
and product quality are variables that have the characteristics of object in an organization,
thus objective reality. These realities can be found out by comparing service quality and
product quality and how they are perceived by customers. Thus a structured questionnaire is
developed in order to find out customer’s perception of service and product quality and their
relative importance.
3.2.2 Epistemology
The second research philosophy is epistemology which deals with creation of knowledge.
Knowledge can be perceived as objective and theoretically accessible to all, or subjective and
dependent on individual experience (Long et al., 2000). The conflict whether to study social
phenomena under the same principles and procedures as one does for natural sciences still
exists for epistemology (Bryman & Bell, 2007).
Positivism is one position on epistemology which states that knowledge can be only obtained
through scientific methods of testing hypothesis (Saunders et al., 2009). On the other hand,
interpretivism is another epistemological position which contrasts positivism. Interpretivism
means that subject matter of social sciences is different from that of natural sciences (Bryman

Hussain M. & Ranabhat P. University of Gävle 21
& Bell, 2007). This means that social world needs a different approach which differentiates
humans and their perception against natural order. Quality is a term which is perceived
differently by different people therefore, interpretivism suits the nature of this research. What
is a good service quality or product quality might not be the same for someone else. This
matter is linked with human perception of the subject.
3.3 Research approach
In this research, we followed up with deductive approach where this approach follow the
pattern for deciding a general theory, and building a theoretical framework; moving to
specific outcomes (Trochim, 2006). Research approaches are mainly focused on the
relationship between theory and data; together with the resultant assumptions which must be
subjected to empirical findings (Bryman and Bell, 2007). Concerning the nature and aim of
our research study, we followed the deduction process or deductive approach between service
quality, product quality and customer retention. We are able to collect data from the customer
perspective which provides us the output on relative influence on retention rate of customers
either under service or product quality.
The theories and models such as Retail Service Quality model proposed, SERVQUAL Model,
Combined service model, and study on service and product quality dimensions made us to go
through the relationship study between service, product and customer retention formulating a
conceptual framework. This framework shows the relationship of service and product quality
with the customer retention. Eventually, the data collected are analyzed and were followed up
with the theories used and examined either they were accepted or not for our study.
3.4 Research strategy
As per the nature of our research, quantitative data is collected following the quantitative
method. The main aim of our study is to acquire adequate number of data for giving the
validity to our writing and answering all the research questions. Therefore, concerning the
overall nature of our research and going through the suggestions from theories used, we
decided to conduct a quality awareness short survey following the quantitative data collection
technique. This strategy is all about recording, analyzing and attempting to disclose the deeper
meaning and significance of human behavior and experience, including beliefs, behaviors and
emotions. All these stratification help us in our research finding as according to the nature of
our research questions.

Hussain M. & Ranabhat P. University of Gävle 22
There are different ways to choose research strategy tools and techniques. When a research
strategy is chosen using a single data collection technique with corresponding analysis
procedure, it is known as mono method (Saunders et. Al., 2009). Similarly, when there are
more than one data collection technique and analysis technique it is known as multiple
methods (Saunders et al, 2009). That’s why following the research strategy technique we
used the mono method for data collection because we use the questionnaire and quantitative
data for analysis and findings.
3.5 Research Design
Research design is the framework of the research paper. There are five different types of
research designs: 1) experimental design; 2) cross-sectional or social survey design; 3)
longitudinal design; 4) case study design; and 5) comparative design (Bryman & Bell, 2007).
According to the need of our study, we decided to use the cross-sectional or social survey
design. The reason behind is that we were able to find out the many already available sources
for the topic that we have chosen to write on. However, despite of availability of many other
sources and work done on same topic, we prefer to make our findings more fruitful and
approaching the customers to find out their perception on service and product quality. In
business research, it is almost not possible to control a variable which is a good reasoning for
social survey. The variables like gender, age, and social background are given and cannot be
changed (Bryman & Bell, 2007). This makes it totally not viable to use the experimental
design and we followed up to the social survey. We are objected to find out the customer
perceived value either on service or product quality which could be either of their experience
or any other assumptions like expectations or perception. Therefore, we formulated a set of
questionnaire with reference to SERVQUAL and Retail service quality model.
Hence, for our entire findings and analysis the sole consideration was made on the responses
from our target group and their perception on their own experience with COOP.
3.6 Research sampling and data collection
Based upon the quantitative method of our data collection, all the empirical data were
collected via survey with a questionnaire. The questions given in appendix A, are focused
under how and which questions; which were all motivated towards answering our research
questions. The numbers of respondents are 100 in number. It is a non-random selection;
therefore the only one location is selected- Gävleborg. From Gävleborg region, we selected
two different cities Bollnäs and Gävle.

Hussain M. & Ranabhat P. University of Gävle 23
However, from our data collection, many of the prospective customers were reduced as they
were not willing to give response showing time and situation as a reason for non-participation.
Hence, our sample group is 100 in final. We conducted this during the month of December
2012, 4 days per week, spending 3-4 hours in average.
The questionnaire is structured with five different how and which questions. The background
is with the age group, Gender and the member or nonmember of COOP. We formulated the
questions mainly focusing on the re-purchasing behavior of the customers and the view of the
service quality along with the perceived value from their entire experience with COOP. For
getting more precise responses and the convenience of the respondents we had made the
options/alternative choices for selection of the answers.
3.6.1 Data collection:
We started our survey for data collection among the customers of COOP, and visualizing their
brand and quality awareness about COOP’s product and service quality. Data is collected
either through primary or secondary data collection method. Primary data are new data
collected specifically for primary purpose; while secondary data are those collected data
which have already been collected for some other purpose (Saunders et al., 2009). The means
which is used to collect data for a research project is known as Data capture instrument (Kent,
2007). And, it includes the means like personal interview and questionnaire.
Similarly, here the data used are acquired through primary and secondary data collection
method. For primary data collection, we formulated questionnaires which is available in
appendix A. We conducted face to face short survey with the customers in the form of
questionnaire; we sent e-mail to the manager of COOP located in Gavel city too. We used the
hard-copy of the questionnaire and with the permission from the Human resource department;
we conducted our survey outside the COOP stores. The reason behind selection of this
method is that we wanted to have a quick access with our respondents. We formulated a set of
questionnaire with five different questions. Here, our target groups are the customers from
COOP. We have the selection of only customers from COOP as we wanted to make a non-
random selection of our respondents. Here, the respondents are independent of gender and age
groups as we wanted to have maximum number of responses. Along with this, we went
through different scientific articles and theories and literatures.

Hussain M. & Ranabhat P. University of Gävle 24
3.6.2 Data analysis and presentation:
Following the quantitative analysis method, we carry out our study with comparative and
descriptive analysis technique. The analysis is the capability to filter data and to clarify the
nature and the relationship between them (Saunders et al., 2009). We decided to use this
quantitative data analysis method because this method enables to explore, present, describe
and examine relationships within the quantitative data (Saunders et al., 2009). The most
important reasoning to follow this method is, we collected quantitative data and our research
objective is also “to examine and compare the importance of product quality and service
quality in food retailing and their effect on customer retention”. Therefore, to make the
analysis we used the comparative and descriptive analysis technique, for analyzing the
different service quality dimensions under Retail service quality scale and product quality
dimensions. Here, we make the comparison between the different dimensions.
The reason for using descriptive technique is that we wanted to summarize the data collected
in graphical presentation for better understanding to the reader as well as for us so that we
could easily examine and analyze the results (Agresti & Finlay, 2009). We used bar chart to
represent the data information. The reason behind selecting this presentation method is that
bar chart is the main graphical presentation tool which categorizes the data into different
groups that makes them easily understandable. Bar-charts allow the reader to perceive the
potential information without any confusion. Furthermore, it is easier and more reliable to
study and compare on a chart than to calculate them from the raw data. Also, we had multiple
categories to represent in our data presentation; so we made the grouped bar chart by pairing
the different categories and bar chart is the most appropriate one for making our presentation
real.
3.7 Reliability, validity and generalizability
Reliability of study shows that if the same study yield similar results if repeated (Wilson,
1995). This means the results should be consistent overtime by using a similar methodology.
For quantitative research usually reliability is measured on three factors, i.e. the extent to
which an instrument yield similar results repeated, results should be stable overtime and
results should be similar within a particular time span (Bryman & Bell, 2007).
There are three different ways to assess the reliability of a study which are test-retest
reliability, internal consistency reliability and alternative forms reliability (Malhotra, 2007).
The test-retest reliability is conducted twice, being that the condition provided should be
similar in both cases in order to give similar results. In alternative form reliability, the survey

Hussain M. & Ranabhat P. University of Gävle 25
is answered two times in two different forms while Internal consistency reliability
summarizes the survey items.
Validity of a study identifies the fact whether a study measures what is supposed to do
(Hernon & Schwartz, 2009). The agreement between instrument used and research objective
is focused. The instruments used for this research are developed based on the objective of the
paper. The items included in the questionnaire are taken from Garvin’s product dimensions
and retail service quality scale to measure importance of products and services for grocery
store.
Generalizability of the findings indicates extent to which survey gives the same results when
applied in other circumstances (Malhotra, 2007). This study only focuses on customers of a
single grocery chain but the findings might be generalizable to other grocery chains too.

Hussain M. & Ranabhat P. University of Gävle 26
Chapter 4
EMPIRICAL FINDINGS
This chapter starts by a brief introduction of the company whose customers are investigated.
Then the empirical findings are presented by the sequence of questions in the questionnaire.
Empirical data is presented in the form of figures plus explanation.
4.1 COOP
KF is the Swedish Cooperative Union, which was formed in 1899 by 41 consumer
cooperative societies. Consumer cooperative society is defined by International Cooperative
Alliance as “a co-operative is an autonomous association of persons united voluntarily to
meet their common economic, social, and cultural needs and aspirations through a jointly-
owned and democratically-controlled enterprise” (ICA, 2013). Thus the existence of a
common goal is basic need which a cooperative society should fulfill. Therefore, another
definition by Zeuli and Cropp (2004) states that consumer cooperative societies are developed
by a group who has similar needs and run by their members to fulfill special needs (Zeuli and
Cropp, 2004). Considering these two definitions of cooperative society, all the benefits go to
the member which is the motivating factor and the reason behind increasing interest in
cooperative societies.
Today KF is owned by 44 consumer societies where the number of members of these societies
has exceeded three million. These societies own the retail group KF where COOP is the core
business. Half of the country’s COOP stores are owned by KF group while the remaining
stores are owned by 39 consumer societies (COOP, 2013). COOP is functional under different
retail stores as COOP extra, COOP nära, COOP forum, COOP konsum, COOP bygg. These
stores provide special benefits to their members in the forms of bonuses and discounts. Coop
accounts for 21.5 percent of the entire Swedish grocery retail sector (COOP, 2013).
4.1.2 COOP in Gävleborg
COOP in the region of Gävleborg makes an important part of this whole cooperative society.
COOP has 25 stores in almost 11 cities of the Gävleborg region where the number of
members has reached 104 352 members. In 2012, COOP Gävleborg got 3578 new members.
Every member of society has the right to say and to accomplish this goal, the whole region is
distributed in 25 districts where people get information about the activities of COOP and also
give their point of view (COOP annual report, 2012).

Hussain M. & Ranabhat P. University of Gävle 27
4.1.2.1 Board of directors of COOP Gävleborg
The society’s board of directors consists of seven members which includes president and staff
representatives. This board is responsible for society’s governance, rule and regulation and
management of society. Board of directors also appoints the president of the current
management. The members of board of directors are elected during the annual meeting where
71 representatives at district level join this meeting (COOP annual report, 2012). Being a
cooperative society, COOP Gävleborg gives equal opportunity to every member to influence
society’s decisions.
4.1.3 COOPs membership benefits
In 2010 COOP introduced a new dividend scheme for its members. This scheme means that
members of COOP receive 1 to 5 percent bonuses depending on how much they purchase and
the bonuses are paid in cash. COOP with its new dividend scheme wants to attract more
people to join as a member of COOP because this scheme has a greater deal of economic
benefits for the members. This scheme makes more loyal customers, and more people
purchase at the COOP thus resulting in a more successful retail business.
COOP will achieve two important goals with the new dividend scheme as customers purchase
more they get back more bonuses and at the same time COOP will generate more profit. The
bonuses are counted on monthly basis for example if a member purchase for 1-1999 SEK per
month, will receive 1% discount, 2000-3000 SEK will receive 2% discount, 3000-4000 SEK
will receive 3% as shown by the green line in figure 3. Those members who do the payment
with special COOP MedMera payment card will receive up till 5% discount which is
indicated by the blue line in figure 3 (KF, 2010). COOP being a cooperative society entitles
its all members to these benefits.

Hussain M. & Ranabhat P. University of Gävle 28
Figure 3: COOP’s new dividend scheme
Source: (KF 2010, pp.7)

Hussain M. & Ranabhat P. University of Gävle 29
4.2 Descriptive statistics
4.2.1 Demographics
Gender:
Figure 4: Gender percentage of sample
We collected data from different COOPs stores from the city of Bollnäs and Gävle. Gender
wise, the overall sample represented a total of 61% female and 39% male which is presented
graphically in figure 4. The variation in this number shows the willingness of female
customers to cooperate and answer the questions. While lower number of male respondents
indicates the opposite.
Age:
Figure 5: Different age group of sample
0%
10%
20%
30%
40%
50%
60%
70%
Male Female
Gender
0%
5%
10%
15%
20%
25%
30%
35%
40%
16-20 20-30 30-40 40-50 50+
Age Group

Hussain M. & Ranabhat P. University of Gävle 30
Respondents belong to five different age groups. The age group 16-20 years makes only 9%
of overall sample and the next age group 20-30 years comprises 21 percent. Most of our
respondents fall into 30-40 age groups which makes 34 percent of all respondents. The second
largest age groups are 40-50 which are 23% and 50+ makes 13 percent. (See figure 5)
Membership:
Figure 6: Ratio of members and non-members of COOP store
COOP stores have customer cards called Medmera card through which customers join the
pool of more than 3 million members. Members have special offerings and benefits in the
form of discounts, bonuses and many more. Among our sample, 64% was member of COOP
and 36% was non-member as shown in figure 6.
4.3 Descriptive statistics for service and products elements
Frequency of purchase:
Figure 7: Frequency of purchase of customers
0%
10%
20%
30%
40%
50%
60%
70%
Member Non-Member
Membership
0%
5%
10%
15%
20%
25%
30%
35%
40%
45%
Always Often Sometimes Never
Frequency of purchase

Hussain M. & Ranabhat P. University of Gävle 31
The question which was included in the questionnaire was “How frequently do you purchase
from COOP?” in view to find out whether they are regular customers or not. 26% of
customers answered always, 34% answered often and 40% answered sometimes. Only 26% of
the customers purchase always from COOP. (see figure 7)
4.3.1 Importance of Product elements
“How important for you is the following elements of a product when you purchase at
COOP?” This question contains five different elements as Quality, durability, performance,
ingredients and physical look of product; where these were rated from ”1” as extremely
important, ”2” as very important, ”3” as somewhat important, ”4” as not very important and
”5” as not at all important.
Quality of Product:
Figure 8: Importance of products quality
According to the results from our survey, (figure 8) there is 59% of customer who thinks
product quality is extremely important, 38% of them think it is very important, 3% of them
think as somewhat important and there is no rating for two options. It shows that quality of
product is extremely important for the COOP customer when they make purchase.
0%
10%
20%
30%
40%
50%
60%
70%
ExtremelyImportant
Very important Somewhatimportant
Not veryimportant
Not at allimportant
Importance of Products Quality

Hussain M. & Ranabhat P. University of Gävle 32
Products Durability:
Figure 9: Importance of products durability
On the second elements of product element as durability of product, 43% of customers think it
as extremely important, 47% of them think it is very important, 10% of them think it is
somewhat important and there is no rating for other two options. It reflects that highest
percentage of customer think that it is very important to consider the durability of product
when they make purchase. (See figure 9)
Performance of product:
Figure 10: Importance of products performance
0%
5%
10%
15%
20%
25%
30%
35%
40%
45%
50%
ExtremelyImportant
Very important Somewhatimportant
Not veryimportant
Not at allimportant
Importance of Products Durability
0%
5%
10%
15%
20%
25%
30%
35%
40%
45%
50%
ExtremelyImportant
Very important Somewhatimportant
Not veryimportant
Not at allimportant
Importance of Products Performance

Hussain M. & Ranabhat P. University of Gävle 33
Here, 46% of customers think product performance as extremely important, 39% of them
think it is very important, 15% of them think it is somewhat important and there is no rating
for other two options. Therefore, here too we find that the highest percentage of customer of
COOP think that the performance of product is extremely important when they purchase from
COOP. (see figure 10)
Ingredients of product:
Figure 11: Importance of product’s ingredients
We received highest 53% of customer who thinks that the ingredient of products is extremely
important for them while they make purchase of a product. However, 31% of customer thinks
it is very important, 15% of them think it is somewhat important, 1% of them think it is not
very important and there is no rating in other option. It reflects that maximum number of
customer rely and concern about the ingredients of product. (See figure 11)
0%
10%
20%
30%
40%
50%
60%
ExtremelyImportant
Very important Somewhatimportant
Not veryimportant
Not at allimportant
Importance of Ingredients of Products

Hussain M. & Ranabhat P. University of Gävle 34
Physical look of product:
Figure 12: Importance of physical look of products
Comparing to the other elements, here we have lowest 6% of customer who thinks that the
physical look of products is extremely important. Consequently, 24% of customers think that
it is very important, 46% of customer think that it is somewhat important, 16% of them think
that it is not very important and 8% of them think that it is not important at all (figure 12). It
shows that the physical look of product is somewhat important for customers while the
purchase is made.
0%
5%
10%
15%
20%
25%
30%
35%
40%
45%
50%
ExtremelyImportant
Very important Somewhatimportant
Not veryimportant
Not at allimportant
Importance of Physical look of Products

Hussain M. & Ranabhat P. University of Gävle 35
Product‘s elements importance:
Figure 13: Importance of all elements of products shown combine
Therefore, here is in figure 13, the combinational form of respondent result where the
elements are differentiated with the colors and are combine presented under five different
rating options. Conclusively, we see that the highest percentage with 59% of customer think
that the quality of product is extremely important for them, 43% think the durability of
product is extremely important, 46% think the performance is extremely important, 53% think
ingredients is extremely important and 6% of them think physical look is extremely
important. It shows that on average the product quality (59%) and ingredients (53%) of
products are extremely important for customers.
Similarly, 38% of customers think that the quality of product is very important, 47% think
durability is very important, 39% think performance, 31% think ingredients and 24% think
physical look is very important. It shows that on average durability and performance of
product is very important for customers. And, 3% of customers think product quality is
somewhat important, 10% think durability, 15% think performance, 15% think ingredients
and 46% think physical look of product is somewhat important. However, here we have only
1% of customer who thinks that ingredients of product and 16% who think that physical look
is not very important. Only 8% of customers think that physical look is not important at all.
Thus, it is clear that the maximum number of customer prefer the quality of product rather
than other elements.
0%
10%
20%
30%
40%
50%
60%
70%
ExtremelyImportant
Veryimportant
Somewhatimportant
Not veryimportant
Not at allimportant
Product's Elements Importance (Combined)
Quality of products Durability of products Performance of products
Ingredients of products Physical look of products
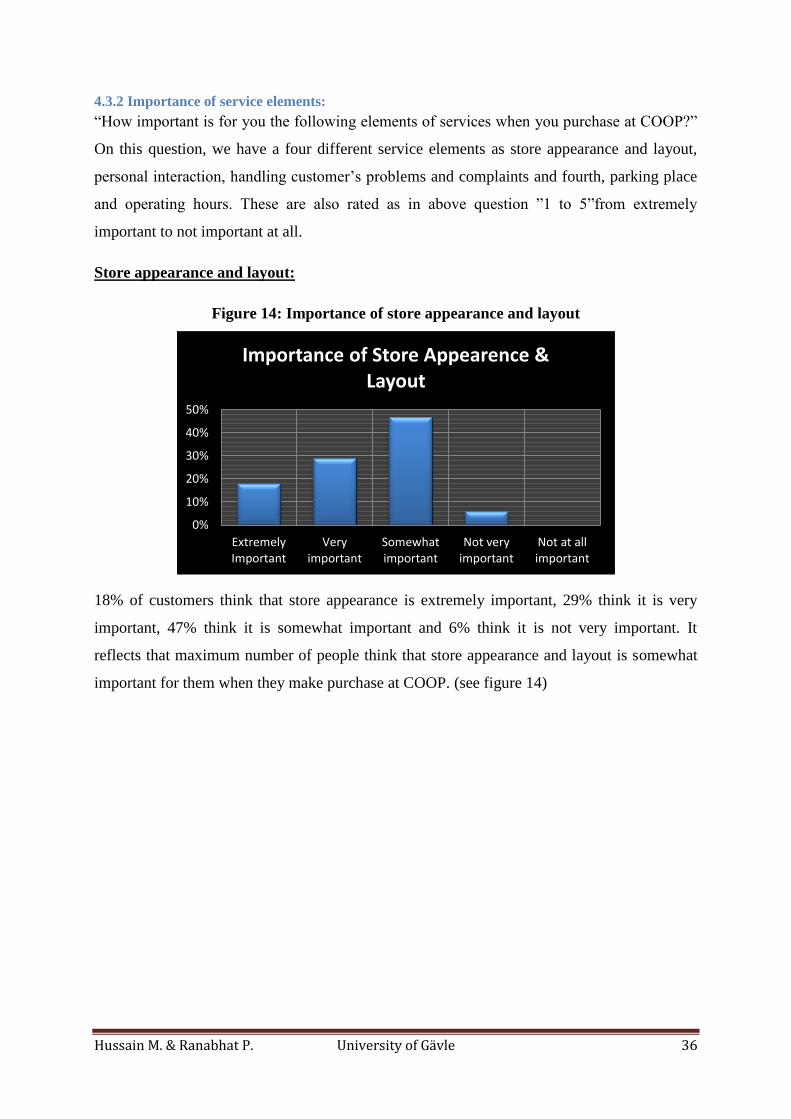
Hussain M. & Ranabhat P. University of Gävle 36
4.3.2 Importance of service elements:
“How important is for you the following elements of services when you purchase at COOP?”
On this question, we have a four different service elements as store appearance and layout,
personal interaction, handling customer’s problems and complaints and fourth, parking place
and operating hours. These are also rated as in above question ”1 to 5”from extremely
important to not important at all.
Store appearance and layout:
Figure 14: Importance of store appearance and layout
18% of customers think that store appearance is extremely important, 29% think it is very
important, 47% think it is somewhat important and 6% think it is not very important. It
reflects that maximum number of people think that store appearance and layout is somewhat
important for them when they make purchase at COOP. (see figure 14)
0%
10%
20%
30%
40%
50%
ExtremelyImportant
Veryimportant
Somewhatimportant
Not veryimportant
Not at allimportant
Importance of Store Appearence & Layout

Hussain M. & Ranabhat P. University of Gävle 37
Personal interaction:
Figure 15: Importance of personal interaction
Here, the highest 63% of customer think that the personal interaction is very important for
them when they make purchase. 14% of them think it is extremely important, 18% think it is
somewhat important and 5% think it is not very important. (See figure 15)
Problems and complaints handling:
Figure 16: Importance of problem and complaints handling
41% of customers think that problems and complaints handling is very important for them,
31% think it is somewhat important and 28% think it is extremely important. Therefore, it
0%
10%
20%
30%
40%
50%
60%
70%
ExtremelyImportant
Very important Somewhatimportant
Not veryimportant
Not at allimportant
Importance of Personal interaction
0%
5%
10%
15%
20%
25%
30%
35%
40%
45%
ExtremelyImportant
Very important Somewhatimportant
Not veryimportant
Not at allimportant
Importance of Problems and Complaints Handling

Hussain M. & Ranabhat P. University of Gävle 38
shows highest percentage of customer think that handling problems and complaints is very
important. (see figure 16)
Parking place and operating hours:
Figure 17: Importance of parking place and operating hours
The highest percentage is 43% who think that parking place and operating hours is very
important for them following with 33% who think it is somewhat important, 19% think it is
extremely important and to lowest 1% who think it is not important at all. It seems that
customer prefer to have an adequate parking place and flexible operating hours when they
desire to purchase in COOP. (see figure 17)
Combined form of importance of service elements:
Figure 18: Importance of all service elements shown combine
Following figure 18, the service elements are represented by different colors. Here, 28% of
customer think that handling customer’s problem and complaints is extremely important,
0%
10%
20%
30%
40%
50%
ExtremelyImportant
Veryimportant
Somewhatimportant
Not veryimportant
Not at allimportant
Importance of Parking place & Operating Hours
0%
20%
40%
60%
80%
ExtremelyImportant
Veryimportant
Somewhatimportant
Not veryimportant
Not at allimportant
Services Elements Importance (Combined)
Store appearance and layout
Personal interaction
Handling of customer’s problems and complaints
Parking place and operating hours

Hussain M. & Ranabhat P. University of Gävle 39
consecutively, 19% think parking place and operating hours, 18% think store appearance and
14% think personal interaction is extremely important. Similarly, highest of all 63% of
customer think that personal interaction is very important, 43% think parking place and
operating hours, 41% think handling problems and complaints and 29% think store
appearance and layout is very important.
47% of customer think store appearance and layout is somewhat important, 18% think
personal interaction, 31% think handling customer problem and complaints and 33% think
parking place and operating hours are somewhat important for them when they make purchase
in COOP. Further, it shows that 6% of customers think that store appearance and layout is not
very important, 5% think handling customer problem and complaint is not very important and
4% think parking place and operating hours are too not very important. Whereas, 1%
customer think that parking place and operating hours are not important at all. Thus, it reflects
that in average there is maximum number of customer who thinks that personal interaction is
very important for them.
4.3.3 Product and service elements comparison:
“From above stated product and service elements, which one of them play more important
role in your purchase decision from COOP?”
Figure 19: Product and service quality comparison
Here in figure 19, the product elements represent blue color and service element represent red
color. From the chart above, it reflects that 55% of customer prefers product quality and 35%
of them prefer service quality as extremely important for their purchase decision. 43% of
0%
10%
20%
30%
40%
50%
60%
ExtremelyImportant
Very important Somewhatimportant
Not veryimportant
Not at allimportant
Product & Service Element Comparison
Product elements Service elements

Hussain M. & Ranabhat P. University of Gävle 40
customer prefers product quality and 52% prefer service quality as very important. Similarly,
2% of customer prefers product quality as somewhat important whereas 13% prefer service
quality.
Hence, according to this result, we see that more than 50% of customer 55% customers prefer
product quality rather than service quality when they make purchase decision in COOP.
Product and service quality comparison (mostly prefer to make purchase):
Figure 20: Product and service quality comparison
“Which one of the following would you mostly attract you to purchase from COOP?” On this
question, we have four different alternative answers. As a result,(figure 20) highest 71% of
customer think they prefer quality and performance of product; 15% of them prefer
ingredients and durability of products; 11% of them prefer convenient operating hours and
payment options and lowest of all 3% prefer the way customer problems and complaints are
dealt with.
Thus, eventually to conclude the empirical findings show that majority of customers prefer to
be more concerned for the quality and performance of products rather than to the way how
they are dealt with during a purchase encounter as given in appendix C. Product elements and
product quality both are highly preferred by the customers holding more than 50% as highest
55% and 71% respectively. On contrary, under the service quality comparison, personal
0%
10%
20%
30%
40%
50%
60%
70%
80%
CustomerProblems &Complaints
Quality &Performance of
Products
ConvenientOperating Hours &Payment Options
Ingredients &Performance of
Products
Product & Service Quality Comparison

Hussain M. & Ranabhat P. University of Gävle 41
interaction holds highest rating as 63%. Eventually, we suggest here that perceived quality of
product and the personal interaction as a service element are highly preferred by the
customers to make their purchase decision.

Hussain M. & Ranabhat P. University of Gävle 42
Chapter 5
DISCUSSION AND ANALYSIS
This chapter contains the analysis of empirical research. It begins with the analysis of service
quality where all its components are discussed and is followed by discussion of product and
its components. At the end, the importance of service quality and product quality and their
respective influence on customer retention is discussed.
5.1 Service Quality and Customer Perception
In order to understand the quality of services, their determinants should be identified which
could determine what the quality of service is for a customer (Parasuraman et al. 1985).
According to Dabholkar et al. (1996), retail service quality can be assessed with five
determinants which are physical aspects, reliability, personal interaction, problem-solving,
and policy. In order to obtain customers perception of service quality, we have included these
determinants in the questions in the survey.
Physical aspects of services which encompass the store appearance and layout have
significantly lesser effect on customer purchase decisions, because most of the responses
indicate lower level of importance. Although, two out of ten customers think that physical
aspects of a retail store play significant role in their purchase decisions which is also
supported by Kotler (1994), who suggests environment of store is important part of shopping
experience and can influence the customer decision whether to visit again.
The second dimension on the scale of service quality adopted in the survey is personal
interaction. Personal interaction dimension indicates the knowledge of employees,
confidence, and providing prompt service, willing to help customers and handle customers on
individual basis (Zeithaml, 1988). According to Macintosh (1997), personal interaction,
relationship between the retailer and its customers, between the salesperson and the customers
are very important for customer retention.
According to empirical data 63% of the customers give high preference to personal
interaction. These findings indicate the value of personal treatment and personal touch given
to customers during their visit to the store. Our findings are consistent with the findings of
Zeithaml, (1988) and Macintosh (1997) in regard that personal interaction is of utmost

Hussain M. & Ranabhat P. University of Gävle 43
important for customer’s retailer’s long term relationship and commitment. This means that
support of store personnel during a purchase encounter is considered to be very effective to
create stronger tie between customers and the company. We mean that effective
communication between customers and staff and the readiness of the personnel to provide
prompt service helps organization to grow customer retention rate. Personal interaction is
ranked higher than other service elements, but there are still many other factors like the
characteristics of products, that play their role to develop a good customer base.
Retail service quality scale gives significance to after sales services which include problem
solving and complaints handling. This element focuses on the willingness shown by retailer to
accept return and exchanges and to sincerely resolve customer issues (Mehrabian, 1974). This
element in our survey has gain relatively higher significance as 41% of respondents think that
the way their problems are solved and their complaints are handled, plays important role in
their choice of purchase.
The last dimension of service quality on RSQS is policy which means the policy of retailer for
the quality of merchandize, convenient operating hours, parking place and payment options
(Dabholkar, 1996). Our findings show positive effects on customer purchase decision on this
dimension. Within the policy dimension such items are included that affects the time that each
customer spends in the store. Retailers can help customer to avoid waiting in long queue for
payment by providing flexible payment options or self-payment options (Das et al. 2010). We
argue that these policies should be built to support customers during their shopping
experience and reduce the level of frustration. For example a good parking place where
customers could easily find a parking place and better payment option is the one that reduce
the waiting time for customers. If policies were not favorable for customer, they might turn to
competitors who are more concerned for ease and pleasant shopping experience of their
customers.
5.1.1 Service elements comparison
In order to dig deep into the concept of service quality in retail store, comparison is drawn
among four dimensions of RSQS. Scale used to measure the importance of each dimension is
importance scale ranging from extremely important to not at all important. According to

Hussain M. & Ranabhat P. University of Gävle 44
empirical data personal interaction, problem solving and policy have high score on the scale
“very important”, whereas, physical aspect is with lowest score on this scale.
Among all, personal interaction seems to influence customer purchase and repurchase
decisions to a greater extent followed by problem solving and policy. The least effective in
this regard is physical layout of a store.
Personal interaction lays the foundation for long term relationship between customers and the retailers
(Macintosh, 1997). This relationship becomes stronger in long term which in turn results into more
loyal customers. The service dimensions of RSQS are developed by Dabholkar et al. (1996) to
measure the service quality of retail stores. In our study, this model is used to compare the effects of
these dimensions on customer retention.
We argue that services play dominant role in the success of retail stores. We think that service
is the medium between company and customers that if services are provided properly will
bring closer company and the customers. Our findings further indicate that retail stores should
be more concerned to treat customers in person and make them feel important for the
organization.
5.2 Perceived product quality
Perceived quality is defined by Zeithaml (1988) and Rowley (1998) as the consumers’
visualization about a product or service overall excellence or supremacy. The value of product
is created for a consumer when they get benefits from consumption of product which is
greater than the long-term costs expected by them (Slater and Narver, 2000). Following to
Garvin’s (1984; 1987) eight dimensions of product quality; we formulated a corresponding
questions for data collection. We use quality, durability, performance, ingredients and
physical look of a product to examine greater influence of customers towards their purchase
decision.
With respect to the empirical findings, it shows that the quality of product is rated as highest,
ingredients as second, performance as third, durability as fourth and physical look as a lowest.
In Shasharudin et al. (2010) study of a product’s quality and its attributes with respect to
customer retention, they find that the image of the product itself is more important than the
physical quality of the product itself. Further, they suggest that a good customer relationship
and the product awareness are critical for maintaining the customer perceptions. Similarly,

Hussain M. & Ranabhat P. University of Gävle 45
our findings shows that very less preference is given to the physical look of a product and
rather customers are highly focused on quality, durability, ingredients and performance of a
product. Muffatto & Panizzolo, (1995) suggest that quality is the extent to which a product
and/or service meets and/or exceeds customer’s expectation. Therefore, quality plays the key
role for influencing the higher retention rate of customer. It seems like customers are
becoming more conscious in determining the quality of product to make an ideal decision in
their purchase (Sebastianelli & Tamimi, 2002).
Extending to the another scale as “very important”, it shows that durability is rated as highest,
performance second , quality third , ingredients fourth and physical look is rated as lowest
one. It reflects that on average durability and performance of product are highly rated to be
very important. On the basis of product based approach, the differences in the quantity of
ingredients in product leads to the differentiation in quality (Garvin, 1984). This can also be
considered as a reason why customers are always motivated to study about the ingredients of
product they choose to determine the quality of that particular product.
Our study suggests that customers are more concerned about the quality of products. Quality
of products is the most dominant factor, but in the case of grocery stores, ingredients of
products also play its role. This fact is proved by the empirical data, where 51% of the
customers think that ingredient is the extremely important factor. Certain category of products
is for certain group of customers for example, the lactose free dairy and nondairy products for
those customers who are allergic with lactose. The whole segment of customers might turn to
a competitor if their need were not met.
5.2.1 Product elements comparison
Adam (1992) states in his findings that, many firms primarily focus on the strategic
objectives of improving product, process, and service quality as a method in order to achieve
a world-class performance. Moreover, Hill (1994) also stated that product quality is an
important factor for a firm development and gaining a sustainable competitive advantage.
Product factors of Garvin et al. (1987) are to define the overall quality of product, but in our
study we compare these factors to identify the most effective and important factor. The
elements as perceived quality, performance, durability, ingredients and physical look of
products are compared here based on the empirical data. Our study suggests that products

Hussain M. & Ranabhat P. University of Gävle 46
perceived quality comes in the first place in comparison with other factors. This does not
mean that a high quality product would have low performance or is not durable, rather,
customer perceive high quality as scoring high on all of these dimensions. Olshavsky (1985)
and Rowley (1998) state in their findings that quality is a form of an overall evaluation of a
product.
Thus we argue that from customer’s perception, high quality means having good performance
and durability. When the performance of any product exceeds or is adequately sufficient to
meet the expectations of a customer, the perceived value or quality perception of product is
also higher and the case is converse when the performance of product is lower or fails to meet
the customer needs (Kenyon and Sen, 2012).
Hence, overall the customers are more focused on product quality and are highly influenced to
make their purchase decision on the basis of quality they perceive. Further, the quality
concept is created in relationships which falls between customers and suppliers and where
both parties are active (Eriksson et al., 1999). They further suggest that always the perception
of the quality is the experience of a customer under the performance and features of goods
and services they consume.
Garvins’ dimensions of product show the multi characteristics of a product and the perceived
value by customers. Supporting this view, Stone-Romero et al. (1997) show in their empirical
evidence the multi-dimensional nature of product quality. Despite that fact that our empirical
findings show different scores for product dimensions, the variation is small, except for the
last dimension which is the physical look of products. So it can be concluded that a product
with good durability, good performance and good ingredients is called to have high quality.
We consider these factors are equally important for products of a grocery store.
5.3 Effects on customer retention
Customer retention is the frequency of repeat purchases over a span of time period (Wilson,
1995). Customer retention is one of the most important factors that firm’s success relies on.
Satisfied customers don’t always mean profitable customers if it is based on short term
transaction (Ang & Butle, 2006). This means that satisfied customers should be maintained
satisfied in longer run where reoccurrence of transactions take place between the firm and

Hussain M. & Ranabhat P. University of Gävle 47
customers. Once customers are maintained satisfied over long period of time they even pay
higher prices than new customers (Lindgreen et al., 2000).
According to our findings, customers are divided in three sections on the basis of their
frequency of visit to the store. If we combine two elements of this question (always and often)
we get total of 60% who mostly purchase from this particular grocery store. The second
question is included with same purpose to obtain a rough estimation of the customers that
purchase on regular basis. This is to know either a customer is member of the store or not.
Membership gives additional benefits to the customers in the form of bonuses and points and
motivates them to purchase more and more. Members make 64% of our respondents while the
remaining 36% are non-members.
In order to find out the more influential factor that motivates customers and keep them
attached to COOP, customers are asked to rank the importance of service quality and product
quality. Our findings show that for 55% of customers product quality is the most important
element whereas, only 35% of customers think that service quality is the most important
element when they make their purchase decision. This means that product elements are given
the first priority and service elements are given second priority during their purchase.
These results are supported further by another tool where customers had to choose only one
alternative from four alternatives. Two of them are about service quality and two about
products quality. Product quality and performance received the highest rank among all
alternatives which is followed by ingredients of product, convenient operating hours and
customer complaint handling.
It is important to understand the customer judgment and their repurchase intention. Here,
“repurchase intention” can be included in the cognitive behavior of a customer. Dwyer et al.
(1987) and Kim et al. (2004) state that the strong interpersonal relationships between service
personnel and customers reduce the mobility; which can be considered as a non-responsive
business activity. However, failing to support this view we came up with the conclusive result
that in comparison with service and product quality elements “personal interaction” received a
high response. It reveals that personal interaction with the customer play a significant role for
marinating the decision of purchase. For instance, the same view was demonstrated by Jones
et al. (2000) as strong interpersonal relationships positively influence the repurchase

Hussain M. & Ranabhat P. University of Gävle 48
intentions of unsatisfied customers. Also, Berry (1997) contended that the personal
interaction with customers in a business relationship can increase the customer’s dependence
with their service provider.
We argue that customer’s decision is determined by product quality to a greater extent.
Services are also important for customers but product quality is given first priority while a
customer decides on which store to purchase from. Thus it can be concluded from our
findings, customer retention is affected more by product quality than by service quality. This
means that customer of a retail store return to the same store because of the quality of
products. Their most repurchase decisions are based on products; however, services seemed to
have lesser effect.
To summarize, we discuss our finding in relation to literature. Considering the service
elements, our findings are in consent with Zeithaml, (1988) and Macintosh (1997) for
personal interaction dimension. Our study shows that personal interaction is most important
element among all other service elements of Dabholkar et al. (1996). The other service
elements are problem solving, policy and physical appearance. Further our study suggests that
physical appearance of store has less effect on customers purchase decisions which is contrary
to the findings of Kotler (1994). Kotler (1994) states that environment of store is very
important factor that influences customers whether to visit again or not, whereas in our
findings this element has received the least importance.
Focusing the quality of products, our findings are consistent with most of the research
conducted in the field quality. Findings by (Sebastianelli & Tamimi, 2002; Hill, 1994;
Kenyon and Sen, 2012) show product quality as useful tool for success of a firm. In case of
grocery stores, customer decisions are also influenced by ingredients of products. Despite
high quality, the ingredients of a product might make it unfavorable or despite low quality the
customers might purchase it because of its ingredients. Since now we have been studying
about the importance of quality, but when it comes to grocery stores, the importance of
ingredients and their effect on customer purchase decision is the new finding of this study.
Anderson and Weitz, (1992), state that when a customer develops a strong feeling or
attachment with the supplier, they feel like trapped and find difficult to switch to another
supplier. Therefore, it symbolizes that when there is a relationship commitment then the

Hussain M. & Ranabhat P. University of Gävle 49
repurchase intention is also higher from a satisfied or loyal customer and eventually leads to
higher retention rate.
To conclude, customers are more concerned about product quality. Product quality is the
factor that determines their choice of store in the first place and then followed by services.
Thus, by comparing their effect on customer retention, product quality is the factor that plays
more significant role.

Hussain M. & Ranabhat P. University of Gävle 50
Chapter 6
CONCLUSION
In the conclusion, we present the results of our findings and answer the research questions.
Furthermore, the managerial, theoretical and social implications are discussed. Finally,
suggestions for future research and reflections of author are mentioned.
6.1 Findings and comments
Organizations know that existing customers worth more than new prospects because they are
more responsive to offers and spend more than new customers (Smith, 1996). Significant part
of marketing expenses should be allocated to retaining the old customers and gaining new
customers. The most important goal of any organization is to deliver services or products that
fulfill needs and wants of their customers and make them satisfied. Customer satisfaction
increase customer retention and customer retention is dependent on nature of relationship
between the parties (Eriksson & Löfmarck, 2000).
Factors that are significant for customer satisfaction and customer retention are product
quality and service quality. Many authors have written about product quality and service
quality from different perspectives; however, this study is unique in its perspective. As long
as we study the comparison between these two elements and their effect on customer retention
makes this research different from others. Specially, in retail industry the importance of
product and service quality play a vital role or can be regarded as a backbone of business
success. Product and service quality is considered as a measure to increase the customer
satisfaction towards the retail store. When a customer receives a good service with a
perceived value of a product, there is a greater possibility of having a satisfied customer and
eventually this leads to repetition of purchase from a service provider.
Research question one is about the comparison and importance of service elements in retail
store. As a result conclusion drawn from out findings indicates that customers value personal
interaction more than any other element of services. The second priority is given to handling
of complaints and problems. Nyer (2000) has examined the effect of consumer complaints
and satisfaction. The author found that the more customers are encouraged to complain, the
more customers will be satisfied. A company is more likely to retain customers if they are
encouraged to complain and then these complaints are addressed properly and satisfied

Hussain M. & Ranabhat P. University of Gävle 51
customers are more like to return and repurchase than unsatisfied customers (Ovenden, 1995).
Answering the research question one, we argue that personal interaction is the most important
service element.
Product quality received the highest rank among all other product factors. Considering the
second research question, it can be concluded as a result of this study that despite the
emergence of services in every sector of business, product is still considered the most
significant factor in customer decision. Product quality is the primary element that affects
customer’s decision while services in retail are considered as secondary element. When it
comes to the choice of a grocery store, product quality plays active role to shape consumer’s
choice. Satisfied customers continue to return to the store and repurchase as long as they are
kept satisfied which increases the level of customer retention (Eriksson & Löfmarck, 2000).
In addition, the answer to second research question is also supported by another product
dimension in the case of grocery stores. Beside products perceived quality, products
ingredient is the dimension that affect customer decisions.
The answer to last research question is that product quality influences customer retention
more than services. The main reason, for a customer to purchase repeatedly from the same
store, lies in quality of products.
Our study suggests that grocery stores should be concerned about the quality of their products.
This will help firms to maintain a desirable customer base. However, they should also keep
improving their services. In spite of the importance of products quality, services also have
their effects on customer retention. Products quality comes in the first place, whereas, service
quality comes in the second place.
6.2 Implications
The term marketing means to find customers who need your products and services and can
purchase them. The more the number of customers, the higher the profit, thus terms like
customer satisfaction and customer retention are coined. The concept of customer retention is
studied under relationship marketing. Modern marketing literature is focused on developing
tools and techniques that can help organizations build long-term relationship with every
stakeholder.

Hussain M. & Ranabhat P. University of Gävle 52
6.2.1. Managerial implications Our study is objected towards finding the influence of service and product quality on
customer retention with respect to the product quality dimension and retail service quality
scale. Therefore, we aim that our present study will be a helpful hand in managerial prospect
to have a better understanding and knowledge about the mentioned dimensions for their
customers and for management itself. It can help grocery stores that are more concerned
about long term success. Not only grocery stores, rather any type of retail store, who want to
know the value of products and services for their customer, can use these findings. Because
today’s retail stores provide mix of products and services either its food retailing, apparels
store or any other kind of retail store. This study can be helpful for organizations that have
limited resources and that cannot invest simultaneously both for the improvement of products
and services. For such firms, product quality improvement is the first objective to achieve in
order to grow the number of customers and increase level of customer retention.
Therefore, the result of this research can be useful to managers in retail business world. It
helps to deal with customer’s need and how they make their repurchase decision; which will
ultimately aid the management to maintain their objective. It could also be useful to managers
for strategic planning and its proper implementation. The management team could examine
those other factors apart of service and product quality that the customers are influenced to
make a decision to purchase or not to purchase or either they are satisfied or dissatisfied.
Hence, in this situation, the managers can plan on those other factors in order to provide their
customers with the best value and service. Along with this, they can also focus on the
important dimension to position more important/necessary one in order to improve service
and product quality to get an output as higher level of customer retention.
6.2.2. Social implications
Companies, either business oriented or service should be more concerned for the healthiness
on what they product. High quality products mean also healthy products that have positive
consequences for society as a whole. Our findings show that customer, who is one of the
members of society, needs high quality of goods and in this regard companies should strive to
fulfill their needs. The knowledge and the buying behavior of customers change with the
change in time; therefore they are becoming more focused on quality and performance of a
product day by day. People are focused in their health and fitness; they prefer to have a

Hussain M. & Ranabhat P. University of Gävle 53
qualitative product rather than an attractive product. And, our study also reflects that quality is
the best mean to influence the customers buying decision.
Moreover, retail industries especially grocery stores are crucially linked to the environment or
ecological system of nature. In this concern, the major role of a retail industry for its society
and its people/customer is important to provide healthy products. Social bonds and
relationship is also a key factor to establish customer retention.
6.2.3. Theoretical implication
The retail service industry has been discussed as a distinguish characteristic and nature. This
study discusses service quality model of Dabholkar, Thorpe and Rentz (1996) named as the
retail service quality scale (RSQS) that measures service quality in the retail setup. Similarly,
Boshoff and Terblanche (1997), in reproduction of Dabholkar study found highly encouraging
results for the RSQS applicability in the context of department stores, super markets. This
gave also a light to our finding that service quality is important together with service
dimensions for having better understanding in customers need and wants.
Along with this, as we discussed following the Garvins’ dimensions on product quality, we
conclude that the perceived quality, performance, durability and ingredients of products are
important factors for increasing the repurchase intention of the customers. Researchers from
past and present have been studying on service quality and product quality and influence of
these two terms in customer retention. Therefore, our theoretical foundation for future
research is to study customer perception and expectation of service and product quality.
6.3 Reflections and suggestions for future research
In this study the authors examined the importance of services and products in grocery stores
and the effects of services and products on customer retention. Primary data is collected
through questionnaires by visiting the stores in two cities of Sweden, namely Bollnäs and
Gävle and the number of respondents is 100. It could have given more accurate results if this
study was conducted in large cities with more number of respondents. Furthermore, a
qualitative study to examine managerial side would also be better. During the analysis,
authors came to realize that if the two groups, members and non-members, are studied
separately; this might give different and new results. However, the findings of this study are
satisfactory. The findings are reliable that if the same study is repeated provided the same

Hussain M. & Ranabhat P. University of Gävle 54
situation which is called the test-retest reliability. This study has yield valid results because
the instruments used in the survey are in accordance with the objective of the study.
Prioritizing the future research study, we contend that a better understanding of the discussed
dimensions and scale measurement can make firms well positioned to use quality as a
competitive tool in the retail industry. Therefore, we suggest that though this concept is used
and researched by number of researchers, still further research can be done for studying and
analyzing about the relationship between customers and business focusing more on
“relationship commitment”. Research can be done on different aspects/effect of the service
quality as service quality is regarded to be a multidimensional and complex concept
(Parasuraman et al., 1985; Bolton and Drew, 1991).
Furthermore, our study is limited to a single case study; therefore, it seems that the study
could be fluctuated more if we could make the comparison of the views or data collection
with other similar grocery stores. There might be possibility of gaining more knowledge about
other influential factor for higher customer retention and also future research could seek to
provide more empirical support for the theoretical background presented in this paper.
Consumers judge the quality of products and services to purchase and continue to use in the
future (Nelson, 1974; Darby and Karni 1973).
Ingredients of products can be interesting area for future research. This could be studied from
environment perspective. The difference between ecological products and non-ecological
products and their respective ingredients, the point of extraction of those materials used in the
products and their effect on human life and environment can be an interesting and beneficial
study.
Summing up, our study would undoubtedly be of use to retailers in their better understanding
of 1) how their customers buying decisions are established and most importantly, 2) they
know how the repurchase intentions of customer are changed. Hence, both of these
contributions can act as a driver to the success of a firm. This will enable the firm to maintain
the high level of competitiveness in this competitive market.

Hussain M. & Ranabhat P. University of Gävle 55
REFERENCES
Literatures
Adam, E.E. (1992), “Quality improvement as an operations strategy”, Industrial Management
and Data Systems, Vol. 92 No. 4, pp. 3-12.
Adamson, I., Chan, K. and Handford, D. (2003), “Relationship marketing: customer
commitment and trust as a strategy for the smaller Hong Kong corporate banking sector”,
International Journal of Bank Marketing, Vol. 21 No. 7, pp. 347-58.
Agresti, A. and Finlay, B. (2009) - Statistical Methods for the Social Sciences, 4th edition,
New Jersey, Pearson Education, Inc.
Ahire, S.L. and Dreyfus, P. (2000), “The impact of design management and process
management on quality: an empirical investigation”, Journal of Operations Management,
Vol. 18, No. 5, pp. 549-575.
Anderson, E.W. and Fornell, C. (1994), “A customer satisfaction research prospectus”, in
Rust, R.T. and Oliver, R.L. (Eds), Service Quality: New Directions in Theory and Practice,
Sage Publications, Beverly Hills, CA, pp. 241-268.
Ang, L. and Buttle, F. (2006), “Customer retention management processes: A quantitative
study”, European Journal of Marketing, Vol. 40, No. 1, pp. 83-99.
Beamish, K. and Ashford, R. (2007/2008). Marketing Planning. 1st Edition. Oxford OX2
8DP, UK. Butterworth-Heinemann.
Berry, L.L. (1986), “Retail businesses are service businesses”, Journal of Retailing, Vol. 62,
No. 7, pp.3-6.
Benson, P.G., Seraph, J.V., and Schroeder, R.G. (1991), “ The effect of organizational context
on quality management: an empirical investigation”, Journal of management Sciences, Vol.
34, No.2, pp. 1107-24.

Hussain M. & Ranabhat P. University of Gävle 56
Bendapudi, N. and Berry, L.L. (1997), “Customers motivations for maintaining relationships
with service provider”, Journal of Retailing, Vol. 73, No. 1, pp. 15-37.
Boshoff, C. and Terblanche, N. (1997). “Measuring retail service quality: A replication
study,” South African Journal of Business Management, Vol. 18, No. 3, pp. 123-128.
Bitner, M.J. (1992), “Servicescapes: the impact of physical surroundings on customers and
employees”, Journal of Marketing, Vol. 56, No. 7, pp. 57-71.
Bolton, R.N., Kannan, P.K. and Bramlett, M.D. (2000), “Implications fo loyalty program
membership and services experiences for customer retention and value”, Journal of the
Academy of Marketing Science, Vol. 28, No. 4, pp. 95-108.
Bryman, A. and Bell, E. (2007), Business research method, 2nd
ed, Oxford University Press,
New York.
Buttle, F. (2004), Customer Relationship Management: Concepts and Tools, Elsevier, Oxford.
Carpenter J. M. and Moore, M. (2006), Consumer demographics, store attributes, and retail
format choice in the US grocery market, International Journal of Retail & Distribution
management, Vol. 34, No. 6, p.432-452.
Cronin, J., Michael, K. and Hult, G. T. (2000), “Assessing the Effects of Quality, Value, and
Customer Satisfaction on Consumer Behavioral Intentions in Service Environments”, Journal
of Retailing, Vol. 76 No. 2, pp. 193-208.
Clarke, I. (2000),"Retail power, competition and local consumer choice in the UK grocery
sector", European Journal of Marketing, Vol. 34, No. 8, pp. 975 – 1002
Coviello, N.E., Brodie, R.J., Danaher, P.J. and Johnston, W.J. (2002), “How firms relate to
their markets: an empirical examination of contemporary marketing practices”, Journal of
Marketing, Vol. 66 No. 3, pp. 33-46.

Hussain M. & Ranabhat P. University of Gävle 57
Daniel, S.J. and Reitsperger, W.D. (1991), “Linking quality strategy with management control
system: Empirical evidence from Japanese Industry”, Accounting, Organization and society,
Vol. 16 No. 7 pp. 601-18.
Darby, M. and Karni, E. (1973), “Free competition and the optimal amount of fraud”, Journal
of Law and Economics, Vol. 16 No. 1, pp. 67-86.
Dabholkar, P., Dayle, T. and Joseph, R. (1996), “A measure of service quality for retail stores:
scale development and validation”, Journal of the Academy of Marketing Sciences, Vol. 24,
No.1, pp. 3-16.
Dawkins, P.M. and Reichheld, F.F. (1990), “Customer retention as a competitive weapon”,
Directors and Board, Vol. 14, No.2, pp. 42-47.
Das, A., Kumar, V. and Saha, G.C. (2010), “Retail service quality in context of CIS
countries”, International Journal of Quality and Reliability Management, Vol. 27, No. 6, pp.
658-683.
Douglas, L. and Connor, R. (2003). Attitudes to service quality- the expectation gap,
Nutrition & Food Science, Vol. 33 No. 4, p.165-172.
Dunk, A. S. (2002), “Product quality, environmental accounting and quality performance”,
Accounting, Auditing and Accountability Journal, Vol. 15 No. 5, pp. 719-732.
Eriksson, K. and Löfmarck Vaghul, A. (2000), “Customer retention, purchasing behavior and
relationship substance in professional services”, Industrial Marketing Management, Vol. 29,
No. 4, pp. 363-372.
Eriksson, K., Majkgard, A. and Sharma, D.D. (1999), “Service quality by relationships in the
international market”, The Journal of Services Marketing, Vol. 13, No. 4, pp. 361-375.
Feigenbaum, A.V. (1951), “Total quality control”, McGraw-Hill, New York, NY.
Hussain M. & Ranabhat P. University of Gävle 58
Flynn, B.B., Schroeder, R.G. and Sakakibara, S. (1994), ”A framework for quality
management research and an associated measurement instrument”, Journal of Operations
Management”, Vol. 54, No. 8, pp. 339-366.
Grönroos, C. (1984), “A service quality model and its marketing implications”, European
Journal of Marketing, Vol. 18 No. 4, pp. 36-44.
Grönroos, C. (2000), Service Management and Marketing: A Customer Relationship
Management Approach, 2nd ed., John Wiley, Chichester.
Garvin, D.A. (1984), “What does product quality really mean?”, Sloan Management Review,
pp. 25-43.
Garvin, D.A. (1987), “Competing on eight dimensions of quality”, Harvard Business Review,
Vol. 65, No. 6, pp. 101-109.
Gummesson, E., (1994) Service Management: An Evaluation and the Future, International
Journal of service Industry management, Vol. 4, No. 1, p.77- 96.
Helkkula, A. (2011), “Characterising the concept of service experience “,Journal of Service
Management ,Vol. 22 No. 3, pp. 367-389
Hill, T. (1994), Manufacturing Strategy: Text and Cases, 2nd ed., Irwin, Burr-Ridge, IL.
Juran, J.M. (1974), “Quality Control Handbook”, 3rd
ed., McGraw-Hill, New York, NY.
Jones, M.A., Mothersbaugh, D.L. and Beatty, S.E. (2000), “Switching barriers and repurchase
intentions in services”, Journal of Retailing, Vol. 76, No. 2, pp. 259-274.
Kang, G.D. and James, J. (2004), “Service quality dimensions: an examination of Grönroos’s
service quality model”, Managing Service Quality, Vol. 14, No. 4, pp. 266-277.
Kenyon, G. and Sen, K. (2012),"A model for assessing consumer perceptions of quality",
International Journal of Quality and Service Sciences, Vol. 4 No. 2, pp. 175 – 188

Hussain M. & Ranabhat P. University of Gävle 59
Kotler, P. (1973) Atmospherics as a Marketing Tool. Journal of Retailing. Vol. 49 No.4, pp.
48-64.
Kotler, P. (1994), “Atmospherics as a marketing tool”, Journal of Retailing, Vol. 26, No. 6,
pp. 32-50
Lemmink, J. and Kasper, H. (1994),"Competitive Reactions to Product Quality Improvements
in IndustrialMarkets", European Journal of Marketing, Vol. 28 No. 12 pp. 50 – 68
Lawrence, A. and Francis, B. (2006), “Customer retention management processes: A
quantitative study”, European Journal of Marketing, Vol. 40 No. 1 pp. 83 - 99
Lindgreen, A., Davis, R., Brodie, R.J. and Buchanan-Oliver, M. (2000), “Pluralism in
contemporary marketing practices”, International Journal of Bank Marketing, Vol. 18 No. 6,
pp. 294-308.
Li, Y.N., Tan, K.C. and Xie, M. (2003),"Factor analysis of service quality dimension shifts in
the information age", Managerial Auditing Journal, Vol. 18 No. 4 pp. 297 – 302.
Long, R. G., White C. M., Friedman W. H. and Brazeal D.V. (2000). The ‘Qualitative’ versus
‘Quantitative’ research debate: A question of metaphorical assumptions, International
Journal of Value-based Management, Vol.13, No.7, p.189-197.
Malhotra. (2007). Marketing Research: An Applied Orientation, 5Th Ed. Prentice-Hall Of
India Pvt. Ltd.
Macintosh, G. and Lockshin, L. (1997). Retail relationships and store loyalty: A mutli-level
perspective. International Journal of Research in Marketing, Vol. 14, No.1, pp. 487-497.
Nitecki, D.A. and Hernon, P. (2000), Measuring service quality in Yale University’s libraries,
Journal of academic librarianship, Vol. 26, No. 4, pp. 259-273.

Hussain M. & Ranabhat P. University of Gävle 60
Nyer, P.U. (2000), “An investigation into whether complaining can cause increased customer
satisfaction”, Journal of Consumer Marketing, Vol. 17 No. 1, pp.9-19.
Nelson, P. (1974), “Advertising as information”, Journal of Political Economy, Vol. 81 No. 2,
pp. 729-54.
Ovenden, A. (1995), “Keep your customers happy and your competition will slowly fade
away”, The TQM magazine, Vol. 7 No. 1, pp.46-49
Parasuraman, A. (2004), “Assessing and improving service performance for maximum
impact: insights from a two decade long research journey”, Performance Measurement and
Metrics, Vol. 5, No. 2, pp. 45-52.
Pollack, B.L. (2008). The nature of the service quality and satisfactionrelationship, Empirical
evidence for the existence of satisfiers and dissatisfiers. Managing Service Quality Vol. 18
No. 6, pp. 537-558
Peterson, R.A., Balasubramanian, S. and Bronnenberg, B.J. (1997), ``Exploring the
implications of the Internet for consumer marketing'', Journal of the Academy of Marketing
Science, Vol. 25 No. 4, pp. 329-46.
Paulson-Gjerde, K.A. and Slotnick, S.A. (1997), “A multidimensional approach to
manufacturing quality”, Computers Industrial Engineering, Vol. 32 No. 4, pp. 879-89.
Rowley, J. (1998), “Quality measurement in the public sector: some perspectives from the
service quality literature”, Total Quality Management, Vol. 9 No. 2/3, pp. 321-35.
Ranaweera, C. and Neely, A. (2003),"Some moderating effects on the service quality-
customer retention link", International Journal of Operations & Production Management,
Vol. 23 No. 2 pp. 230 – 248
Reichheld, F.F. and Sasser, W.E.J. (1990), “Zero defections: quality comes to services”,
Harvard Business Review, Vol. 12, No. 2, pp. 105-11.

Hussain M. & Ranabhat P. University of Gävle 61
Sebastianelli, R. and Tamimi, N. (200), “How product quality dimensions relate to defining
quality”, International Journal of Quality & Reliability Management, Vol. 19, No. 4, pp. 442-
453.
Smith, T. (1989), ``Nurturing a customer service culture'', Journal of Retailing, Vol. 23, No.7,
pp. 15-18.
Smith, D. C., (1996), “Do it all’s loyalty programme – and its impact on customer retention”,
Managing Service Quality, Vol. 6, No. 5, pp. 33-37.
Sellers, P. (1990), ``What customers really want'', Fortune, Vol. 121 No. 13, pp. 58-68.
Szymanski, D. and Henard, D. (2001), “Customer satisfaction: A meta-analysis of the
empirical evidence, Journal of the Academy of Marketing Science, Vol. 29, No. 1, pp. 16-35.
Stone-Remero, E., Stone, D.L. and Grewal, D. (1997), “Development of a multi-dimensional
measure of perceived product quality”, Journal of Quality Management, Vol. 2 No. 1, pp. 87-
111.
Sousa, R. and Voss, C.A. (2002), “Quality management re-visited: a reflective review and
agenda for future research”, Journal of Operations Management, Vol. 20 No. 1, pp. 91-109.
Shasharudin, M.R., Hassan, A.A., Mansor, S.W., Elias, S.J., Harun, E.H. and Aziz, N.A.
(2010), “The relationship between extrinsic attributes of product quality with brand loyalty on
Malaysia national brand motorcycle/scooter”, Canadian Social Science, Vol. 6 No. 3, pp.
165-75.
Saunders, M., Lewis, P. and Thornhill, A. (2009), Research Methods for business students, 4th
ed, Pearson Educations Limited, England.
Taylor, S.A. and Baker, T.L. (1994), “An assessment of the relationship between service
quality and customer satisfaction in the formations for the consumer’s purchase intentions,
Journal of Retailing, Vol. 70, No. 2, pp.163-178.

Hussain M. & Ranabhat P. University of Gävle 62
Taylor, S.A. (1992), “Measuring Service Quality: A re-examinations and extension”, Journal
of Marketing, Vol. 56, No. 4, pp. 55-68.
Terziovski, M., Sohal, A. and Moss, S. (1999), “Longitudinal analysis of quality management
practices in Australian organizations”, Total Quality Management, Vol. 34, No. 5, pp. 915-
926.
Venetis, K.A. and Ghauri, P.N. (2004),"Service quality and customer retention: building long-
term relationships", European Journal of Marketing, Vol. 38 No. 11 pp. 1577 – 1598
Waller, M.A. and Ahire, S. (1996),"Management perception of the link between product
quality and customers' view of product quality", International Journal of Operations &
Production Management, Vol. 16 No. 9 pp. 23 – 33
Wison, E.J. (1995), “Research design effects on the reliability of rating scales in marketing:
an upadate on Churchill and Peter”, Advances in Consumer Research, Vol. 22, No. 2, pp. 360-
365.
Wilson, D.T. (1995), “An integrated model of buyer-seller relationship”, Journal of the
Academy of Marketing Science, Vol. 23, No. 3, pp. 335-345.
Wong, A. and Sohal, A. (2003), “Service quality and customer loyalty perspective on two
levels of retail relationships”, Journal of Services Marketing, Vol. 17, No. 5, pp. 495-513.
Zeithaml, V. (1988), “Consumer perceptions of price, quality and value: a means-end model
and synthesis of evidence”, Journal of Marketing, Vol. 52, No. 3, pp. 2-22.
Internet sources
Business Dictionary (2013) Product [WWW]. Available from:
http://www.businessdictionary.com/definition/product [Accessed 2013-04-14]

Hussain M. & Ranabhat P. University of Gävle 63
COOP (2013) About COOP [WWW]. Available from: http://www.coop.se/Globala-sidor/In-
english/About-Coop/ [Accessed 2013-01-15].
COOP Gävlebory (2012) annual report [WWW]. Available from:
https://www.coop.se/PageFiles/19429/VB_2012.pdf [Accessed 2013-06-13]
International Cooperative Alliance (ICA), (2013) Co-operative identity, values and principles
[WWW] http://ica.coop/en/what-co-op/co-operative-identity-values-principles [Accessed
2013-06-11].
Statistiska Centralbryan, Statistics Sweden (2011) Livsmedelsförsäljningsstatistik [WWW].
Available from:
http://www.scb.se/statistik/HA/HA0103/2011A01/HA0103_2011A01_SM_HA24SM1201.pd
f [Accessed 2012-12-15].
Zueli, A.K. and Cropp, R. (2004) Cooperatives: Principles and Practices in the 21st century.
[WWW]. Available from: http://www.community-wealth.org/_pdfs/articles-
publications/coops/report-zeuli.pdf [Accessed 2013-06-11].

Hussain M. & Ranabhat P. University of Gävle 64
Appendix A
Questionnaire
We are students of master in business administration (MBA) in the University of Gävle. We
are conducting a research to compare the importance of service and product quality and to
examine their effect on customer retention in retail store. For this reason we will only study
customers of COOP.
We and our supervisor Dr. Maria Malama would be grateful if you spare only few minutes out
of your precious time answering the following questions.
Gender: Male Female
Age group: 16 - 20 20-30 30-40 40-50 50+
Are you member of COOP?
Yes No
1. How frequently do you purchase from COOP?
Always Often Sometimes Never
2. How important for you is the following elements of a product when you purchase at
COOP? (Rate 1 for extremely important and 5 not at all important)
Product Elements Extremely
Important
Very
important
Somewhat
important
Not very
important
Not at all
important
Quality of products 1 2 3 4 5
Durability of products 1 2 3 4 5
Performance of products 1 2 3 4 5
Ingredients of products 1 2 3 4 5
Physical look of products 1 2 3 4 5
3. How important is for you the following elements of services when you purchase at
COOP? (Rate 1 for extremely important and 5 not at all important)
Service Elements Extremely
Important
Very
important
Somewhat
important
Not very
important
Not at all
important
Store appearance and
layout
1 2 3 4 5
Personal interaction 1 2 3 4 5
Handling of customer’s
problems and complaints
1 2 3 4 5
Parking place and
operating hours
1 2 3 4 5

Hussain M. & Ranabhat P. University of Gävle 65
4. From above stated product and service elements, which of them play more important
role in your purchase decision from COOP? (Rate their importance on the following
scale)
Extremely
Important
Very
important
Somewhat
important
Not very
important
Not at all
important
Product elements 1 2 3 4 5
Service elements 1 2 3 4 5
5. Which one of the following would mostly attract you to purchase from COOP?
a) The way customer problems and complaints are dealt with
b) Quality and performance of products
c) Convenient operating hours and payment options
d) Ingredients and durability of products
Thank you!
Contacts:
Dr. Maria Malama (Supervisor): Mob: 070-620 16 01 email: [email protected]
Mushtaq Hussain: Mob: 076-5871197 email: [email protected]
Pratibha Ranabhat: Mob: 072-0226042 email: [email protected]
University of Gävle
Department of Business and Economic studies

Hussain M. & Ranabhat P. University of Gävle 66
Appendix B
Summary of item (P1-P28) of Retail Service Quality Scale

Hussain M. & Ranabhat P. University of Gävle 67
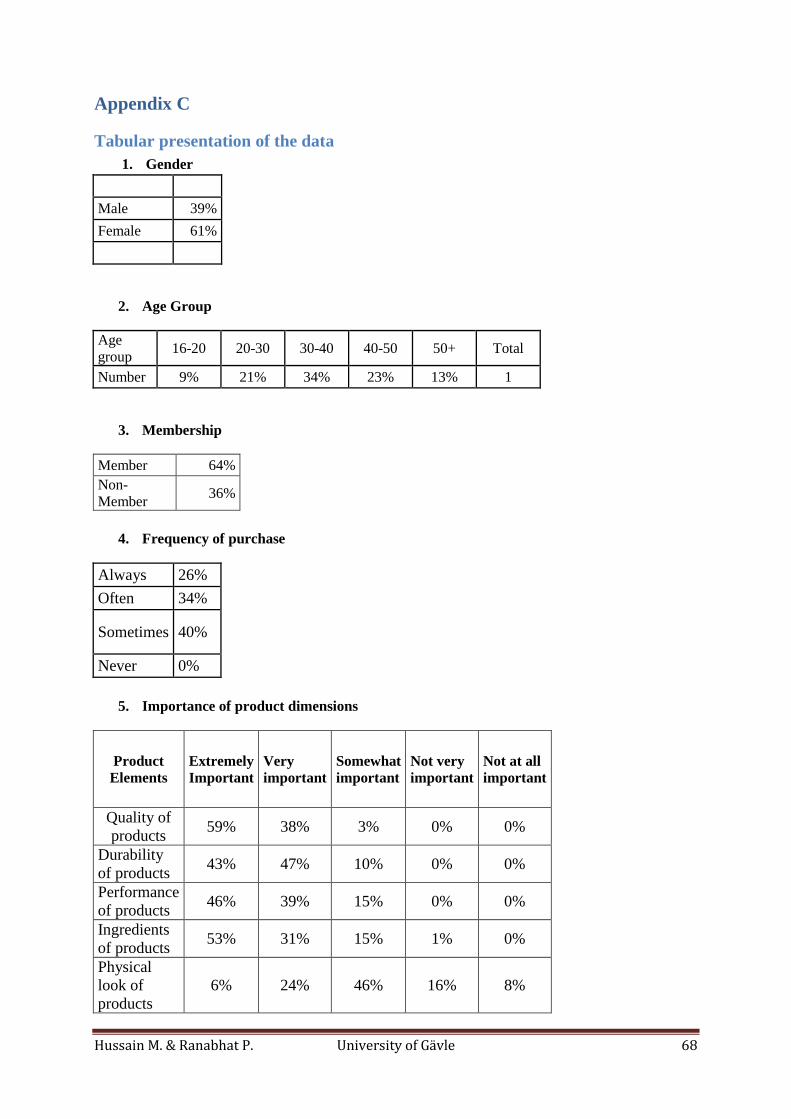
Hussain M. & Ranabhat P. University of Gävle 68
Appendix C
Tabular presentation of the data
1. Gender
Male 39%
Female 61%
2. Age Group
Age
group 16-20 20-30 30-40 40-50 50+ Total
Number 9% 21% 34% 23% 13% 1
3. Membership
Member 64%
Non-
Member 36%
4. Frequency of purchase
Always 26%
Often 34%
Sometimes 40%
Never 0%
5. Importance of product dimensions
Product
Elements
Extremely
Important
Very
important
Somewhat
important
Not very
important
Not at all
important
Quality of
products 59% 38% 3% 0% 0%
Durability
of products 43% 47% 10% 0% 0%
Performance
of products 46% 39% 15% 0% 0%
Ingredients
of products 53% 31% 15% 1% 0%
Physical
look of
products
6% 24% 46% 16% 8%

Hussain M. & Ranabhat P. University of Gävle 69
6. Importance of service elements
Service
Elements
Extremely
Important
Very
important
Somewhat
important
Not very
important
Not at all
important
Store
appearance
and layout
18% 29% 47% 6% 0%
Personal
interaction 14% 63% 18% 5% 0%
Handling
of
customer’s
problems
and
complaints
28% 41% 31% 0% 0%
Parking
place and
operating
hours
19% 43% 33% 4% 1%
7. Comparison of product dimensions and service elements
Extremely
Important
Very
important
Somewhat
important
Not very
important
Not at all
important
Product elements 55% 43% 2% 0% 0%
Service elements 35% 52% 13% 0% 0%
8. Major reason to purchase from COOP
Customer
Problems
&
Complaints
Quality &
Performance
of Products
Convenient
Operating
Hours &
Payment
Options
Ingredients
&
Performance
of Products
3% 71% 11% 15%