influence of pre-meal inulin consumption on energy intake
TRANSCRIPT

Influence of pre-meal Inulin consumption on Energy Intake in overweight and obese middle-
aged and Older Adults: a pilot study
Katarina Smiljanec
Thesis submitted to the faculty of the Virginia Polytechnic Institute and State University in
partial fulfillment of the requirements for the degree of
Master of Science
in
Human Nutrition, Foods and Exercise
Brenda M. Davy, Chair
Kevin P. Davy
Andrew P. Neilson
April 26, 2016
Blacksburg, VA
Keywords: Inulin, Energy Intake, Appetite, Weight Management, Older Adults

Influence of pre-meal Inulin consumption on Energy Intake in overweight and obese middle-
aged and Older Adults: a pilot study
Katarina Smiljanec
ABSTRACT
Seventy-six percent of men and 71% of women over the age of 55 in the United States are
considered overweight or obese, and the numbers are expected to rise especially since the
population is aging. Aside from various metabolic comorbidities, such as hypertension,
dyslipidemia, and coronary artery disease, overweight and obesity are also linked to decreased
mobility and increased rate of falls in elderly, all of which may lead to premature death.
Furthermore, adults over the age of 65 have 339% greater obesity-related medical expenses
compared to younger adults (18-30 years old), thus strategies to promote weight management are
needed. Belonging to the group of fiber, prebiotics are selectively fermented non-digestible food
ingredients that have a favorable impact on the composition and activity of the gut microbiota.
Specifically, inulin-type fructans (ITF) including inulin, oligosaccharides, and
fructooligosaccharides have been generating interest in the prebiotic area in the past two decades.
A lot of attention has been directed at weight management, since ITFs are known to stimulate the
excretion of anorectic gut hormones glucagon like peptide-1 and peptide YY upon fermentation in
the colon. Research done to date has included samples with wide age and BMI ranges, various
doses of inulin, as well as different study designs. More investigations are needed in specific
populations, such as older adults who might have age-related alterations in gastric emptying. This
pilot research study investigated the effects of short-term pre-meal inulin consumption (10 g,
mixed into 500 ml water) on energy intake (EI) and appetite sensations over a 24-hour period, in
overweight and obese middle-aged and older adults (n=7, 55-67 years old), in order to determine
the potential role of prebiotics in weight loss and weight management. A randomized crossover
design was used, with participants completing both pre-meal inulin and control (500 ml water
alone) conditions. There were no differences in EI, gram weight, nor energy density of foods
consumed between the inulin and control conditions. However, observed subgroup differences
suggest variances in response to the inulin preload related to gender, habitual fiber consumption,
cognitive dietary restraint, and BMI status.

Influence of pre-meal Inulin consumption on Energy Intake in overweight and obese middle-
aged and Older Adults: a pilot study
Katarina Smiljanec
GENERAL AUDIENCE ABSTRACT
The United States population is expected to grow older during next few decades. Three fourths of
adults in the United States over 60 years of age are considered overweight or obese, which is not
only associated with conditions, such as hypertension, dyslipidemia, and coronary artery disease,
but also with decreased mobility and increased rate of falls in elderly, all of which increase medical
costs and can lead to premature death. These statistics call for weight loss strategies applicable to
middle-aged and older adult population. Recently, prebiotics, and specifically inulin, have been
introduced as a potential aid in weight management. Inulin is found in foods such as bananas,
garlic, onions, wheat, oat, leek, and asparagus, and is usually extracted from chicory root or
Jerusalem artichokes for supplemental use. Upon ingestion, inulin passes undigested through
gastrointestinal tract and is fermented in the colon. Compounds resulting from fermentation may
stimulate the release of hormones glucagon like peptide-1 and peptide YY, which may influence
food consumption. Research on the role of inulin in eating behavior has been scarce and needs
more focus on specific populations, such as middle-aged and older adults, who may have altered
gastrointestinal processes due to aging. Hence, this research study investigated the influence of
short-term inulin consumption on food intake and appetite sensations over a 24-hour period, with
the goal of exploring a possible weight management strategy in overweight and obese middle-aged
and older adults. There were no differences observed in food intake between the inulin and the
control condition, however, mixed results among subgroups suggest differences in response to
inulin consumption related to gender, usual dietary fiber consumption, dietary restraint, and weight
status.
iv
ACKNOWLEDGEMENTS
Graduate education has been a unique experience. I would primarily like to thank my mentor Dr.
Brenda Davy for giving me an opportunity to be immersed into every aspect of graduate studies.
Her exceptional guidance allowed for this dynamic experience to be marked with independency,
patience, and positivity. Likewise, I would like to thank my committee members Dr. Kevin Davy
and Dr. Andrew Neilson for their support and remarkable suggestions in this process. I greatly
appreciate the advice and thoughtfulness Heather Cox diligently provided towards my professional
development.
I would like to thank my co-investigator Cassie Mitchell for the incredible support and
resourcefulness through the research process. A special thank you to all Davy Lab members for
the encouragement and fostering a warm work atmosphere, as well.
Lastly, I would like to thank my family and friends for their optimism, enthusiasm, and
understanding. They have made the obstacles on this journey seem trivial.
v
TABLE OF CONTENTS
CHAPTER 1: Introduction……………………………………………………………………...1
Table………………………………………………………………………………………5
References…………………………………………………………………………………8
CHAPTER 2: Influence of pre-meal inulin consumption on energy intake in overweight
and obese middle-aged and older adults: a pilot study............................................................10
Abstract………………………………………………………………………………..…10
Introduction……………………………………………………………………………....11
Methods…………………………………………………………………………………..12
Results……………………………………………………………………………………16
Discussion………………………………………………………………………………..19
Conclusion……………………………………………………………………………….22
Tables……………………………………………………………………………….……23
Figures……………………………………………………………………………………25
References………………………………………………………………………………..29
CHAPTER 3: Conclusions and Future Directions…………………………………………...32
References………………………………………………………………………………..34
APPENDIX A: Institutional Review Board Approval……………………………………….35
APPENDIX B: Questionnaires & Food Items at Ad Libitum Meals………………………...37

1
CHAPTER 1: Introduction
The population in the United States is predicted to grow older over the next few decades,
with almost 20% of the population being over 65 years of age by 2030.1 In the period 2007-2012,
the prevalence of overweight and obesity in men over the age of 55 was 41% and 35%,
respectively, whereas in women 32% and 39%, respectively.2 Unfortunately, the numbers are still
rising, not only in the US, but also worldwide.3 In addition to chronic diseases such as
hypertension, dyslipidemia, and coronary artery disease,4 overweight and obesity are associated
with decreased mobility5 and the rate of falls in the elderly,6 all of which may result in premature
death. Compared to adults 18-30 years old, adults older than 65 years have 339% higher obesity-
related medical expenses.7 Thus, strategies to prevent and treat obesity are needed, particularly
those which are effective in middle-aged and older adults.
Preload foods and beverages, such as soups8 and salads9 have been investigated as a simple
and effective strategy to influence appetite sensations and, hence, energy intake (EI) at a meal.
Water preloads were also proven to reduce EI at a meal in older adults.10,11 Recently, there has
been an interest in fiber, and specifically prebiotics, as a potential strategy for reducing appetite
and EI.
Prebiotics are defined as the selectively fermented non-digestible food ingredients that
have a beneficial influence on composition and/or activity of gastrointestinal microbota.12 Inulin-
type fructans (ITF) are a subcategory of prebiotics encompassing inulin, oligosaccharides, and
fructooligosaccharides (FOS),13 oligo- and polysaccharide chains primarily composed of β(21)
fructosyl-fructose glycosidic bonds. ITFs are used as functional food ingredients naturally found
in many plants. As there is no standardized way for naming ITFs and inconsistent nomenclature,
confusion is possible when reviewing the literature.13 Thus, the stated definitions will be used for

2
the purposes of this research. Inulin is a generic term for all linear fructans with β(21) fructosyl-
fructose glycosidic bonds, which degree of polymerization (DP) ranges from 2 to 60. It is most
commonly extracted from chicory root or Jerusalem artichokes.14 Native chicory root inulin has
an average degree of polymerization (DP) of 10 to 20.14 Long-chain (or high-molecular weight)
inulin is inulin with DP 10-60. Oligofructose is a hydrolyzed form of inulin (DP=2-9), often
described as a short-chain (low-molecular weight) inulin. Food sources of inulin are garlic, onions,
leek, bananas, wheat, oat, and soybeans. Average daily dietary intake of inulin in male hunter-
foragers was 135g,14 compared to 1-4g and 3-11g in Americans and Europeans, respectively.15
Inulin is fermented in the colon, producing short-chain fatty acids (SCFA) acetate, propionate, and
butyrate, among which propionate stimulates the secretion of anorectic gut hormones glucagon
like peptide-1 (GLP-1) and peptide YY (PYY), which influence food intake.16 Additionally, inulin
forms microcrystals undetectable by mouthfeel when combined with water that contribute to
creamy texture which may also affect appetite sensations.17 FOS are short-chain inulin-type
prebiotics synthesized from sucrose (DP=2-4), which in the literature is often used interchangeably
with oligofructose.
Prebiotic intake may reduce symptoms and inflammation associated with inflammatory
bowel disease, exhibit protective effects in preventing colon cancer, enhance bioavailability and
uptake of calcium, magnesium, and potentially iron, and lower risk factors for cardiovascular
disease.14 Studies have also investigated the influence of prebiotics on EI and satiety levels, which
results are presented in Table 1. In a study by Parnell and Reimer, overweight and obese subjects,
20-70 years old, consumed 7 g of oligofructose three times a day for 12 weeks.18 Self-reported EI
during oligofructose treatment was significantly lower (29%) compared to placebo (maltodextrin)
by week six. Weight loss was significantly higher, but there was no effect on satiety levels between

3
the first and final day of intervention in the oligofructose arm.18 Results of another long-term pilot
study suggested that an oligofructose intake of 8 g twice a day for two weeks significantly enhances
satiety after breakfast and dinner, and reduces hunger and food consumption after dinner in normal
and overweight young adults.19 In total, EI at test meals offered upon finishing the oligofructose
supplementation period was 5-10% lower than EI at meals for subjects on placebo treatment
(dextrin maltose).19 In contrast to the results of long-term studies, the results of short-term studies
suggest minimal or non-existent impact of prebiotics on energy intake and satiety. In the study by
Hess, et al., subjects (18-64 years old) were given either 0, 5, or 8 g FOS twice a day and results
suggested no increase in satiety and decrease in hunger at lunch and dinner meal within 24 hours
post ingestion.20 In another study done by Karalus, et al., consuming a chocolate bar with 10g
oligofructose for dinner and breakfast the following day did not reduce calorie intake in young
adults at an ad libitum lunch consisting of pizza, nor did effect hunger and satiety.21 Conflicting
results between these studies suggest the importance of dosage, time frame, and the type of given
prebiotic.
When it comes to inulin specifically, a weight loss study in overweight adults over 18 years
old with prediabetes who consumed 30 g/d of inulin for 18 weeks resulted in significant weight
loss in the inulin group compared to a placebo group (cellulose) during the nine weeks of weight
maintenance phase. Lower EI at an ad libitum meal in inulin group at week nine was also noted
(~270 kcal).22 In another long-term study, Chambers, et al. showed a trend that 10 g/d inulin
consumption over 24 weeks may increase the satiety and fullness, reduce hunger, desire to eat, and
EI at ad libitum lunch meal post inulin supplementation in middle-aged adults.16 Heap, et al.
reported lower desire to eat and prospective food consumption in young females at an ad libitum
meal after taking 6 g of inulin with yogurt every day for 8 days.23 On the other hand, Delavaud, et

4
al. investigated the impact of long-term inulin consumption on energy expenditure, but the effects
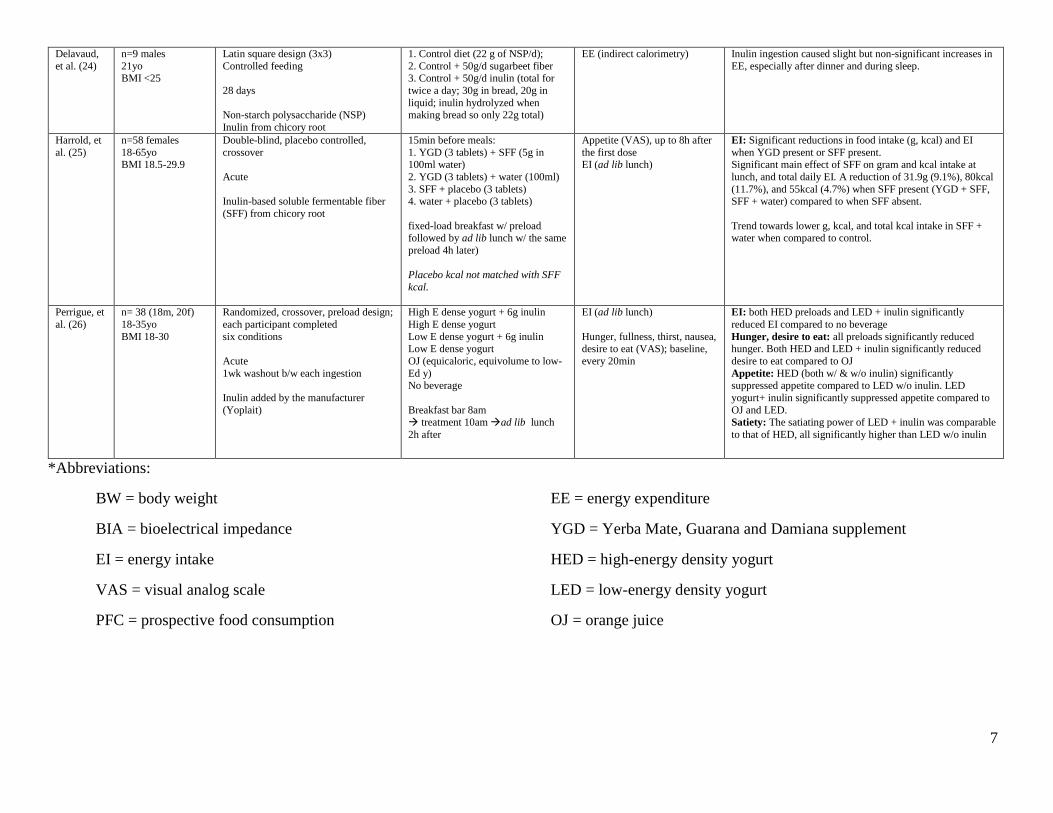
were uncertain.24 Short-term studies showed similar effects to Chambers, et al.21,25,26 Ingestion of
a 5 g inulin-based soluble fiber preload before both ad libitum breakfast and lunch meals reduced
total daily EI in adults 18-65 years old by 55 kcal when taken with either a Yerba-Mate supplement
or water, compared to placebo or only water.25 Perrigue, et al. showed that high-energy-dense and
low-energy-dense yogurts with a 6 g inulin consumed as a preload reduced hunger, suppressed
appetite, and significantly reduced EI at a test meal in young adults compared to the water
preload.26 Lastly, Karalus, et al. demonstrated that consuming a chocolate bar with 10 g inulin for
dinner and breakfast the following day reduced calorie intake in young adults by 21 kcal at an ad
libitum lunch consisting of pizza.21
Results from studies investigating the chronic and acute effect of ITFs on hunger and
satiety may be conflicting, depending on the source, dosage, the chain lengths, and time for
completing the fermentation process, as demonstrated in vitro.27 Short-chain ITFs are fermented
quicker,27,28 and therefore may have more impact on acute satiety, hunger, and EI.20 In
investigations involving inulin,21,25 fermentation was measured up to 6 hours post-ingestion which
does not provide sufficient information about its effect on EI due to incomplete fermentation,
which is the case in studies with other ITFs.20,21 In vitro studies have demonstrated that short-chain
fatty acid production progresses over time, with the highest levels formed at 8-12 hours for short-
chain inulin27 and 24 hours for long-chain inulin.29,30 Therefore, the effect of inulin ingestion on
satiety, hunger, and EI may be more pronounced after those periods of time. Studies in this area
have included populations with a wide age and BMI range, however, none have focused
specifically on older adults, who may have age-related alterations in gastrointestinal physiology
resulting in delayed gastric emptying.31 Thus, the specific aims of this study are to investigate:

5
1. The influence of an inulin preload (10 g, mixed into 500 ml water) on ad libitum EI at test
meals at 10 h and 24 h post ingestion, in overweight and obese middle aged and older
adults. We hypothesize that the inulin preload will decrease EI in this population at these
time points, when compared to a water-only preload (500 ml).
2. The influence of an inulin preload (10 g, mixed into 500 ml water) on hunger and fullness
sensations at 10 h and 24 h post ingestion in overweight and obese middle aged and older
adults. We hypothesize that the inulin preload will decrease hunger sensations and increase
fullness sensations at these time points, when compared to a water-only preload (500 ml).
If the study outcomes support our hypotheses, this strategy could be used to reduce food and energy
(i.e. kcal) consumption, and possibly reduce body weight over time, in overweight and obese
middle aged and older adults.

6
Table 1. Literature summary*
Authors Population Study type/design; Duration; Fiber type Dosage/Administration Measurements Results
Parnell, Reimer
(18)
n=21 experimental, 18 control
20-70 yo
BMI >25
Double-blind, randomized, placebo-controlled, parallel
12 weeks
Oligofructose
3x 7g oligofructose (21g/d, 31.5kcal/d)
Maltodextrin (31.5kcal/d) (control)
in 250 mL drink before meals
BW, every 3 wks Body composition (DEXA);
pre, post
EI (3d-food diary), every 3 wks Hunger, satiety (VAS); pre,
post
BW/composition: significant wt loss (body fat mass) in OFS group
EI: 29% less kcal intake by week 6 (significant)
VAS: no effect
Cani, et al.
(19)
n=10 (5m, 5f)
21-39 yo BMI 18.5-27.4
single-blind, randomized, placebo-
controlled, crossover
2 weeks w/ 2 weeks washout
Oligofructose (OFS)
2x 8g OFS (16g/d)
2x 8g dextrin maltose (DM)
w/ bfast and dinner; subjects
prepared their own meals
Food diary (daily)
Satiety, hunger, fullness, PFC (VAS) (at pre and post-test
meals)
EI: 5-10% significantly lower in OFS than DM at final test
meal VAS: significantly increased satiety after breakfast and
dinner in OFS. Reduced hunger, PFC after dinner.
Hess, et al.
(20)
n=20 (10m, 10f)
18-64yo BMI 18-27
double-blind, crossover
acute (24 hours)
short-chain FOS (scFOS)
2x 0 g, 5 g, or 8 g scFOS.
1st dose w/ hot cocoa beverage + fixed breakfast. Ad lib lunch 4h after
breakfast. 2nd dose 3 solid chews 2h
prior dinner.
Satiety, hunger (VAS), 0-
240min EI (24 h)
Fermentation (breath
hydrogen); 0, 240min
Satiety, hunger: no effect
EI: over the remainder of the day, 16g/d scFOS decreased food intake in f, but increased food intake in m
Fermentation: breath hydrogen increased in a dose-
dependent manner
Karalus, et
al. (21)
n=22
18-40 yo BMI 18-29
Randomized, crossover; each
participant completed five conditions
Acute
High- and low-molecular
weight inulin
10 g oligofructose,
10g inulin, 10g soluble corn fiber
10g resistant wheat starch
Control w/ chocolate crisp bars (consumed
for dinner and breakfast)
Ad lib lunch after 3h (pizza)
Hunger, fullness (VAS), at
lunch meal EI (ad lib lunch, 24h recall)
No differences in satiety, hunger, or energy intake
EI: reduced by 21kcal at lunch (inulin bar) (not significant)
Chambers,
et al. (16)
n=60
40-65yo
BMI 25-40
randomized, double-blind, placebo-
controlled, parallel
24 weeks
Inulin
1. 10g/d inulin (control)
2. 10g/d inulin-propionate ester
Mixed in food
EI (ad lib lunch)
Hunger, fullness, desire to eat
(VAS)
Body composition (MRS)
EI: 4% decrease at wk 24 in inulin-control group (from
678kcal to 645kcal at ad lib lunch) (non-significant)
VAS: Trend towards increased fullness, decreased hunger
and desire to eat in inulin-control group at wk 24 (non-significant)
Body composition: Significant decrease in subcutaneous
adipose tissue in inulin group
Guess, et
al. (22)
n=32
≥18 yo
BMI 25-35 prediabetic
Double-blind, randomized, placebo-
controlled, parallel
18 weeks
Inulin
3x10g inulin (30g/d)
3x10g cellulose (control) (30g/d)
EI (ad lib meal)
Body weight
Body composition and distribution (BIA, MRI)
Appetite (VAS)
Fermentation (breath
hydrogen)
EI: Lower EI in inulin group than control at wk 9 compared
to bsl (~270 kcal). No differences at week 18.
BW: both groups lost similar amount of wt during wt loss (wk 0-9); inulin group lost more wt in wt maintenance (wk 9-
18) (−2.3 ± 0.5% vs −0.6 ± 0.4%, p = 0.012; absolute
weight loss: −1.8 ± 0.4 kg vs −0.5 ± 0.3 kg) Body composition: greater fat loss in inulin group at wks 9
and 18
Appetite: lower PFC in inulin group at wk 18. No effect in hunger, desire to eat, and fullness.
Heap, et al.
(23)
n=19 females
20-35yo BMI 19-26
Randomized, crossover, preload design
chronic (8 days)
3-wk-washout b/w each preload
Chicory root inulin (DP=10)
8-day consumption:
Yogurt + 6g inulin Control yogurt
Lab visits: Yogurt preload 9am breakfast bar
right after ad lib lunch at noon
(pizza)
EI (ad lib lunch)
Hunger, fullness, PFC (VAS); baseline, every 30min for 3 hrs
(Days 1 and 8)
GI distress (bsl, day 2 and 7)
Desire to eat, PFC: * lower AUC at day 8 at yogurt + inulin
( inulin consumption associated w/ appetite reduction) EI: no sig. differences b/w conditions
GI: no sig. differences b/w conditions
7
Delavaud,
et al. (24)
n=9 males
21yo BMI <25
Latin square design (3x3)
Controlled feeding
28 days
Non-starch polysaccharide (NSP)
Inulin from chicory root
1. Control diet (22 g of NSP/d);
2. Control + 50g/d sugarbeet fiber 3. Control + 50g/d inulin (total for
twice a day; 30g in bread, 20g in
liquid; inulin hydrolyzed when making bread so only 22g total)
EE (indirect calorimetry) Inulin ingestion caused slight but non-significant increases in
EE, especially after dinner and during sleep.
Harrold, et
al. (25)
n=58 females
18-65yo BMI 18.5-29.9
Double-blind, placebo controlled,
crossover
Acute
Inulin-based soluble fermentable fiber
(SFF) from chicory root
15min before meals:
1. YGD (3 tablets) + SFF (5g in 100ml water)
2. YGD (3 tablets) + water (100ml)
3. SFF + placebo (3 tablets) 4. water + placebo (3 tablets)
fixed-load breakfast w/ preload followed by ad lib lunch w/ the same
preload 4h later)
Placebo kcal not matched with SFF
kcal.
Appetite (VAS), up to 8h after
the first dose EI (ad lib lunch)
EI: Significant reductions in food intake (g, kcal) and EI
when YGD present or SFF present. Significant main effect of SFF on gram and kcal intake at
lunch, and total daily EI. A reduction of 31.9g (9.1%), 80kcal
(11.7%), and 55kcal (4.7%) when SFF present (YGD + SFF, SFF + water) compared to when SFF absent.
Trend towards lower g, kcal, and total kcal intake in SFF + water when compared to control.
Perrigue, et
al. (26)
n= 38 (18m, 20f)
18-35yo
BMI 18-30
Randomized, crossover, preload design;
each participant completed
six conditions
Acute
1wk washout b/w each ingestion
Inulin added by the manufacturer
(Yoplait)
High E dense yogurt + 6g inulin
High E dense yogurt
Low E dense yogurt + 6g inulin Low E dense yogurt
OJ (equicaloric, equivolume to low-
Ed y) No beverage
Breakfast bar 8am
treatment 10am ad lib lunch
2h after
EI (ad lib lunch)
Hunger, fullness, thirst, nausea, desire to eat (VAS); baseline,
every 20min
EI: both HED preloads and LED + inulin significantly
reduced EI compared to no beverage
Hunger, desire to eat: all preloads significantly reduced hunger. Both HED and LED + inulin significantly reduced
desire to eat compared to OJ
Appetite: HED (both w/ & w/o inulin) significantly suppressed appetite compared to LED w/o inulin. LED
yogurt+ inulin significantly suppressed appetite compared to
OJ and LED.
Satiety: The satiating power of LED + inulin was comparable
to that of HED, all significantly higher than LED w/o inulin
*Abbreviations:
BW = body weight
BIA = bioelectrical impedance
EI = energy intake
VAS = visual analog scale
PFC = prospective food consumption
EE = energy expenditure
YGD = Yerba Mate, Guarana and Damiana supplement
HED = high-energy density yogurt
LED = low-energy density yogurt
OJ = orange juice

8
REFERENCES
1. Bourdel-Marchasson I, Vincent S, Germain C, et al. Delirium symptoms and low dietary
intake in older inpatients are independent predictors of institutionalization: a 1-year
prospective population-based study. J Gerontol A Biol Sci Med Sci. Apr 2004;59(4):350-
354.
2. Yang L, Colditz GA. Prevalence of Overweight and Obesity in the United States, 2007-
2012. JAMA Intern Med. Jun 22 2015.
3. NCD-RisC. Trends in adult body-mass index in 200 countries from 1975 to 2014: a pooled
analysis of 1698 population-based measurement studies with 19.2 million participants.
Lancet. 2016;387(10026):1377-1396.
4. Flegal KM, Graubard BI, Williamson DF, Gail MH. Excess deaths associated with
underweight, overweight, and obesity. Jama. Apr 20 2005;293(15):1861-1867.
5. Stenholm S, Sainio P, Rantanen T, et al. High body mass index and physical impairments
as predictors of walking limitation 22 years later in adult Finns. J Gerontol A Biol Sci Med
Sci. Aug 2007;62(8):859-865.
6. Manty M, Heinonen A, Viljanen A, et al. Outdoor and indoor falls as predictors of mobility
limitation in older women. Age Ageing. Nov 2009;38(6):757-761.
7. An R. Health care expenses in relation to obesity and smoking among U.S. adults by
gender, race/ethnicity, and age group: 1998-2011. Public Health. Jan 2015;129(1):29-36.
8. Rolls BJ, Fedoroff IC, Guthrie JF, Laster LJ. Foods with different satiating effects in
humans. Appetite. Oct 1990;15(2):115-126.
9. Rolls BJ, Roe LS, Meengs JS. Salad and satiety: energy density and portion size of a first-
course salad affect energy intake at lunch. J Am Diet Assoc. Oct 2004;104(10):1570-1576.
10. Van Walleghen EL, Orr JS, Gentile CL, Davy BM. Pre-meal water consumption reduces
meal energy intake in older but not younger subjects. Obesity. Jan 2007;15(1):93-99.
11. Davy BM, Dennis EA, Dengo AL, Wilson KL, Davy KP. Water consumption reduces
energy intake at a breakfast meal in obese older adults. J Am Diet Assoc. Jul
2008;108(7):1236-1239.
12. Gibson GR, Probert HM, Loo JV, Rastall RA, Roberfroid MB. Dietary modulation of the
human colonic microbiota: updating the concept of prebiotics. Nutr Res Rev. Dec
2004;17(2):259-275.
13. Kelly G. Inulin-type prebiotics--a review: part 1. Altern Med Rev. Dec 2008;13(4):315-
329.
14. Slavin J. Fiber and prebiotics: mechanisms and health benefits. Nutrients. Apr
2013;5(4):1417-1435.
15. van Loo J, Coussement P, de Leenheer L, Hoebregs H, Smits G. On the presence of inulin
and oligofructose as natural ingredients in the western diet. Crit Rev Food Sci Nutr. Nov
1995;35(6):525-552.
16. Chambers ES, Viardot A, Psichas A, et al. Effects of targeted delivery of propionate to the
human colon on appetite regulation, body weight maintenance and adiposity in overweight
adults. Gut. Dec 10 2014.
17. Kaur N, Gupta AK. Applications of inulin and oligofructose in health and nutrition. J
Biosci. Dec 2002;27(7):703-714.

9
18. Parnell JA, Reimer RA. Weight loss during oligofructose supplementation is associated
with decreased ghrelin and increased peptide YY in overweight and obese adults. Am J
Clinical Nutr. Jun 2009;89(6):1751-1759.
19. Cani PD, Joly E, Horsmans Y, Delzenne NM. Oligofructose promotes satiety in healthy
human: a pilot study. Eur J Clin Nutr. May 2006;60(5):567-572.
20. Hess JR, Birkett AM, Thomas W, Slavin JL. Effects of short-chain fructooligosaccharides
on satiety responses in healthy men and women. Appetite. Feb 2011;56(1):128-134.
21. Karalus M, Clark M, Greaves KA, et al. Fermentable fibers do not affect satiety or food
intake by women who do not practice restrained eating. J Acad Nutr Diet. Sep
2012;112(9):1356-1362.
22. Guess ND, Dornhorst A, Oliver N, Bell JD, Thomas EL, Frost GS. A randomized
controlled trial: the effect of inulin on weight management and ectopic fat in subjects with
prediabetes. Nutr Metab (Lond). 2015;12:36.
23. Heap S, Ingram J, Law M, Tucker AJ, Wright AJ. Eight-day consumption of inulin added
to a yogurt breakfast lowers postprandial appetite ratings but not energy intakes in young
healthy females: a randomised controlled trial. Br J Nutr. Jan 2016;115(2):262-270.
24. Castiglia-Delavaud C, Verdier E, Besle JM, et al. Net energy value of non-starch
polysaccharide isolates (sugarbeet fibre and commercial inulin) and their impact on
nutrient digestive utilization in healthy human subjects. Br J Nutr. Oct 1998;80(4):343-
352.
25. Harrold JA, Hughes GM, O'Shiel K, et al. Acute effects of a herb extract formulation and
inulin fibre on appetite, energy intake and food choice. Appetite. Mar 2013;62:84-90.
26. Perrigue MM, Monsivais P, Drewnowski A. Added soluble fiber enhances the satiating
power of low-energy-density liquid yogurts. J Am Diet Assoc. Nov 2009;109(11):1862-
1868.
27. Stewart ML, Timm DA, Slavin JL. Fructooligosaccharides exhibit more rapid fermentation
than long-chain inulin in an in vitro fermentation system. Nutr Res. May 2008;28(5):329-
334.
28. Bonnema AL, Kolberg LW, Thomas W, Slavin JL. Gastrointestinal tolerance of chicory
inulin products. J Am Diet Assoc. Jun 2010;110(6):865-868.
29. Gomez E, Tuohy KM, Gibson GR, Klinder A, Costabile A. In vitro evaluation of the
fermentation properties and potential prebiotic activity of Agave fructans. J Appl
Microbiol. Jun 2010;108(6):2114-2121.
30. Noack J, Timm D, Hospattankar A, Slavin J. Fermentation profiles of wheat dextrin, inulin
and partially hydrolyzed guar gum using an in vitro digestion pretreatment and in vitro
batch fermentation system model. Nutrients. May 2013;5(5):1500-1510.
31. Clarkston WK, Pantano MM, Morley JE, Horowitz M, Littlefield JM, Burton FR. Evidence
for the anorexia of aging: gastrointestinal transit and hunger in healthy elderly vs. young
adults. Am J Physiol. Jan 1997;272(1 Pt 2):R243-248.

10
CHAPTER 2: Influence of pre-meal inulin consumption on energy intake in overweight
and obese middle-aged and older adults: a pilot study
ABSTRACT
The prevalence of overweight and obesity among adults older than 55 years is 71-76%, putting
them at risk for premature death as a result of chronic diseases, decreased mobility, and increased
rate of falls. Strategies for obesity treatment and weight management are needed, especially those
effective in middle-aged and older adult populations. Research related to prebiotics, and
specifically inulin-type fructans (ITF) including inulin, oligosaccharides, and
fructooligosaccharides (FOS) shows potential benefits of ITF consumption for weight loss and
weight management. This randomized controlled pilot study investigated the acute effects of inulin
consumption on 24-hour energy intake (EI) and appetite sensations. Seven sedentary, overweight
or obese middle-aged and older adults (60.9 ± 4.4 years, BMI 32.9 ± 4.3 kg/m2) were recruited,
and each completed two test conditions in a randomly assigned order. Participants were given
either inulin (10 g, mixed into 500 ml water) or a water preload (500 ml) before breakfast the
morning of each period after which their ad libitum EI, appetite sensations, and gastrointestinal
side effects were monitored at each meal for the remainder of the day (lunch, dinner) and at
breakfast the following day. No differences in EI, gram weight of food eaten, or energy density
were noted between conditions (all p>0.05). However, differences were noted among subgroups
in the sample. Females, high habitual fiber consumers, and subjects with higher cognitive dietary
restraint had a greater absolute difference in EI between conditions with a lower EI noted in the
inulin condition (390 ± 124 kcal, 424 ± 245 kcal, and 424 ± 245 kcal mean difference among
subgroups, p<0.05, respectively). Greater relative EI difference was also noted in participants with
lower BMI in the inulin condition (-9 ± 14%; 21 ± 8% mean difference, p<0.05). These results
suggest there is a potential gender difference, as well as differences in individual response to inulin
consumption. Future research focusing on gender differences and differences among individuals
in cognitive restraint and gut microbiota is needed to investigate effects of various inulin doses on
EI as a possible weight management strategy.

11
IINTRODUCTION
Seventy-one to 76% of US adults over 55 years old are overweight or obese,1 and the
numbers continue to rise.2,3 Overweight and obesity are associated with a spectrum of
comorbidities,4 higher medical expenses,5 decreased mobility,6 and the rate of falls in the elderly,7
all of which can result in premature death. Therefore, strategies for the prevention and treatment
of overweight and obesity, particularly among older adults, are needed.
The prebiotic inulin, a member of inulin-type fructans (ITF), has beneficial properties on
metabolism8 and specifically gut microbiota9 with minimal gastrointestinal (GI) disturbances. For
these reasons, inulin has recently garnered attention in the area of weight management research.
Short-chain fatty acids (SCFA) produced upon the fermentation of inulin in the colon, stimulate
production of glucagon like peptide-1 (GLP-1) and peptide YY (PYY), anorectic gut hormones
that influence food intake.10 Inulin also increases the viscosity of the solution in which it is being
dissolved,11 potentially influencing EI, as well. Due to inconsistency in the ITF nomenclature, the
following definitions will be used for the purposes of this study: long-chain inulin is a linear fructan
with degree of polymerization (DP) 10-60, whereas short-chain inulin (oligofructose) has DP of
2-9.
Chronic oligofructose and inulin consumption may decrease body weight12,13 and
adiposity,11,13 and decrease12-14 or not change11,15 energy intake (EI). Acute trials also report
conflicting effects on EI.16-18 Findings related to appetite sensations (hunger, satiety, prospective
food consumption) have also varied across both chronic and acute studies. Mixed results of these
investigations may be attributed to varying inulin doses and different means of inulin
administration, as well as to wide age and BMI ranges in the samples studied. Research on inulin
and weight management is particularly scarce in specific populations such as middle-aged and

12
older adults, who may also have an age-related reduction in gastric emptying rate.19 In this pilot
study, we hypothesized that pre-meal inulin consumption would suppress appetite and decrease EI
in overweight and obese middle-aged and older adults, and therefore represent a potential weight
management strategy.
METHODS
Participants
The study was designed based upon our prior work in older adults.20,21 Overweight or obese
(BMI 25-40 kg/m²), sedentary or minimally active older adults (Godin Leisure-Time Exercise
Questionnaire,22 ≤120 min/wk of mild activity), 50-75 years of age were recruited. Subjects were
initially screened via online survey, and later via more extensive health history questionnaire.
Exclusion criteria included current history of unstable coronary heart disease (resting or exertional
chest pain or heart failure), thyroid disease, diabetes, inflammatory bowel diseases, food allergies
or restrained eating, as assessed via questionnaire (Three Factor Eating Questionnaire,23 cognitive
dietary restraint score >11) that would compromise the study or the health of the subject. To be
eligible, individuals could not currently be consuming fiber supplements. Participant’s habitual
dietary intake was assessed through a 24-hour food recall and a three-day food diary. All subjects
provided informed consent approved by Institutional Review Board at Virginia Tech prior to
enrollment, but they were not aware of the specific purpose of the study.
Procedures
Subjects were randomized, in a double-blind crossover design, to consume a preload of
either 10 g of short-chain chicory inulin (Frutafit IQ, DP 9-12) mixed into 500 ml water, or 500
ml plain water. Preload volumes were determined based upon the previous studies in older adults

13
done by this research group.20 The inulin dose was determined based upon the existing research
on inulin tolerability in adults.24 Preloads were given to participants 30 minutes before an ad
libitum breakfast (breakfast 1), followed by an ad libitum lunch (4 hours post ingestion) and an ad
libitum dinner (10 hours post ingestion) the same day. Another ad libitum breakfast (breakfast 2)
was provided 24 hours following the preload consumption. After a one week washout period, the
second 24-hour testing period followed the same procedures, except the participants went through
the other preload condition. Due to non-viscousness of inulin, the mixed drink appeared and tasted
identical to plain water, which served as the control. Meal testing times were 8 am for breakfast
meals and 6 pm for dinner in the Wallace Dining Laboratory, whereas lunch meals were provided
to participants in coolers to consume outside of the laboratory at noon. Subjects had 30 minutes at
each meal to consume as much or as little food as they wanted. (See Figure 1.)
Measurements
Height and weight were measured without shoes using a wall-mounted stadiometer (Seca
GmbH & Co. KG, 216) and a digital scale (Scale-Tronix, 5002, Wheaton, IL, to the nearest 0.1
kg), respectively. Body mass index was calculated as weight (kg) divided by height (m)². Body
weight was measured at the initial visit and before each breakfast test meal to insure weight
stability. Habitual fiber and overall dietary intake was determined over four days by using a self-
reported 24-hour-food recall and a 3-day-food diary. Energy, macronutrient, and fiber intake were
assessed using nutritional analysis software (NDS-R 2014, 2014, University of Minnesota,
Minneapolis). Habitual physical activity was recorded using Godin Leisure-Time Exercise
Questionnaire22 as minutes per week spent doing mild, moderate or vigorous physical activity.
Participants were also asked to wear an accelerometer (Actigraph GT3X+) for 24 hours during
each study period, to insure their physical activity levels were consistent on each testing day.

14
Participants were instructed to keep their physical activity at habitual levels the day prior each
study period for the same reason.
Participants were provided with all foods and beverages for each 24-hour testing period.
Food items offered at test meals were weighed (Sartorius Practum 5101-1S, Goettingen, Germany)
to the nearest 0.1 g before and after consumption (covertly) to calculate subjects’ gram weight of
food consumed, EI, and energy density (kcal/gram weight of food). Visual analog scales25 (VAS)
reflecting prospective consumption, hunger, fullness, and thirst, were completed at the ad libitum
breakfast and dinner meals. (See Appendix B). The VAS consists of questions such as “How hungry
are you?” and subjects were asked to mark a 100-mm line corresponding to the position between
“not at all hungry” and “extremely hungry” scale. The VAS were completed just prior to the
preload consumption before breakfast 1 (0 min), before the meal is served (30 min), after the meal
(60 min), and every 30 minutes thereafter up to 150 minutes. VAS at dinner and breakfast 2 started
prior to serving the meals (0 min), and continued after the meal consumption (30 min), following
the same 30-minute interval pattern up to 150 minutes.
Participants filled out Sensory Evaluation Form after the preload ingestion, asking to rate
the taste, smell, appearance, texture, and overall acceptability of the preload on a scale from 1
(“dislike extremely”) to 9 (“like extremely”) (See Appendix B). Subjects completed the GI side
effects questionnaire prior to breakfast and dinner meals to assess GI tolerance and any discomfort
associated with preload consumption (See Appendix B). They rated potentially occurring side
effects (bloating, flatulence, diarrhea, constipation, rumbling, nausea, and cramping) on a scale
from 0 (“none”) to 3 (“severe”). At their final visit, subjects filled out Debriefing Questionnaire to
determine if they were aware of which preload they were given on each occasion (See Appendix
B).

15
Ad libitum Test Meals
Test meals were evaluated for palatability prior to the beginning the study. The energy
content of the offered meals was 1876-1931 kcal (41-54% carbohydrates, 12-16% protein, 32-45%
fat). Meals consisted of food items typical for an American diet (See Appendix B). Breakfast items
included bagels, bread, sausage, cheese sticks, butter, cream cheese, peanut butter, jelly, cereal
bars, yogurt, bananas, sugar, cream, coffee or tea, milk, orange juice, and water. Lunch items were
prepared by research staff and provided in coolers for participants to bring with them and consume
at a designated time. These items included bread, deli meat, cheese, cheese sticks, potato chips,
cookies, cereal bar, pudding, applesauce, lettuce, carrots, mustard, mayo, ranch dressing, orange
juice, and water. Dinner meals consisted of two entrees (meat lasagna and spaghetti with meat
sauce), bread, cucumbers, carrots, cookies, pudding, fruit cups, ranch dressing, butter, milk, orange
juice, and water. At each meal, participants were asked to self-select offered items and consume
them over a 30-minute-period. They were able to consume water in ad libitum amounts throughout
the day. Meals were offered in the same manner, under the same temperature, at the same location
in every testing period. Foods were weighed (±0.1 g) before being served and again upon finishing
the meal (covertly) to determine the amount consumed. Meal energy and macronutrient intake was
calculated using nutritional analysis software (NDS-R 2014, 2014, University of Minnesota,
Minneapolis).
The inulin supplement in powder form (10 g) was mixed into cold tap water. Its solubility
in cold water was tested prior to the start of the study. Both plain water used as a control treatment,
and the inulin in water preload were served chilled (1-3˚C).
Statistical Analysis

16
Statistical analyses were performed using SPSS statistical analysis software (v23.0, IBM
SPSS, 2015, Chicago, IL). Descriptive statistics (mean ± standard deviation (SD) and frequencies)
were assessed for subject demographic characteristics and habitual mean fiber intake and total
habitual calorie intake. Paired sample t tests were assessed to compare EI, gram weight of food
consumed, and energy density (kcal/gram weight of food) at each meal of the two 24-hour periods,
over the course of the day (three meals), as well as over each 24-hour period overall. Independent
sample t tests were used to assess potential sex differences in absolute and relative change in meal
EI, as well as possible differences between fiber consumers and non-consumers (defined as those
with a habitual fiber intake above and below the mean grams of fiber consumed in the sample).
Repeated measures ANOVA were assessed to compare VAS and GI distress ratings between the
two preload conditions. Associations among variables were assessed by simple correlational
analyses (Pearson r). The α level was set a priori at P<0.05.
RESULTS
Participants
Out of twenty-one individuals that completed an online pre-screening survey, seven (five
female, two male; all Caucasians) were enrolled in the study after determination of eligibility.
Major reasons for exclusion were food allergies (two individuals), vegetarianism (one individual),
age (one individual), high physical activity levels (two individuals), high cognitive dietary restraint
(two individuals), unstable weight in the past six months (one individual), and personal reasons
(five individuals). Descriptive characteristics of eligible participants are reported in Table 2.
Body Weight

17
Body weight did not differ on days 1 and 2 of each condition (inulin: 90.0 ± 20.5 kg vs.
89.0 ± 18.8 kg, p=0.400, control: 89.4 ± 18.9 kg vs. 89.4 ± 18.9 kg, p=0.754), nor did it differ
across the two testing conditions (90.0 ± 20.5 kg vs. 89.4 ± 18.9 kg, p=0.607).
Physical Activity
Participants kept their physical activity at similar levels over both testing periods, with the
exception in the amount of light physical activity (21 min difference, p=0.011) (Table 3.)
Energy Intake at Test Meals
There were no differences in EI, gram weight of food, and energy density of food consumed
at each meal, over the course of the day, and over the course of 24 hours (entire condition) between
conditions (Table 4). However, differences between several subgroups were noted.
Gender and Weight Subgroup
Male participants (n=2) consumed significantly more weight of food during entire inulin
condition compared to the control condition (inulin: 5787 ± 1170 g, control: 5559 ± 1177 g,
p=0.013). Females (n=5) demonstrated lower EI over the course of the day than males following
the inulin preload compared to control (females: -97 ± 258 kcal, males: 293 ± 66 kcal, p=0.027).
Participants with lower BMI (<32 kg/m2, n=3) had a higher EI at lunch in the inulin condition
compared to control (inulin: 723 ± 68 kcal, control: 675 ± 72 kcal, p=0.007), and consumed less
gram weight of food at breakfast 2 (inulin: 697 ± 30 g, control: 1020 ± 151 g, p=0.049). The same
group of participants also demonstrated greater relative EI difference than participants in the higher
BMI category (>32 kg/m2, n=4) at the dinner meal in the inulin condition (-9 ± 14%; 21 ± 8%
mean difference, p=0.046).

18
Eating Behavior Subgroups
Lower-fiber consumers (<17 g/d, n=4) and subjects with lower cognitive restraint score (<
6, n=4) had a higher EI over the course of the day during the inulin condition than control (inulin:
3218 ± 1138 kcal, control: 3022 ± 1029 kcal, p=0.045), as well as a higher gram weight of food
consumed at the dinner meal (inulin: 1619 ± 319 g, control: 1447 ± 252 g, p=0.043). Higher fiber
consumers (>17 g/d, n=3) and participants with higher cognitive restraint scores (>6, n=3)
demonstrated a greater absolute EI difference over the course of the day compared to lower-fiber
consumers and participants with lower cognitive restraint scores, between inulin and control
condition (higher-fiber: -228 ± 262 kcal, lower-fiber: 196 ± 118 kcal; 424 ± 145 kcal mean
difference, p=0.032).
Appetite Sensations
A significant time effect was detected in hunger (all p<0.005) and fullness (all p<0.001)
sensations at each meal (Figure 2). As expected, hunger decreased upon finishing each meal,
whereas satiety increased. There was no significant difference in ratings of nausea at any meal,
nor in changes in hunger, fullness and nausea ratings between conditions.
GI Side Effects
A time effect in each condition was present in ratings for gas/bloating (p=0.005), flatulence
(p=0.009), and constipation (p=0.049) (Figure 3), as the symptoms progressively increased
throughout the day and peaking at dinner time (gas/bloating, flatulence) and at the breakfast 2 meal
(constipation). Diarrhea, nausea, and rumbling ratings showed no effect in changes over time.
None of the item ratings were significantly different between conditions, except increased
rumbling in the inulin condition (p=0.048).

19
Sensory Evaluation
There were no significant differences in appearance, taste, texture, smell, and overall
evaluation of the preloads between conditions. The means of each variable participants rated
ranged from 4.9 ± 0.4 (smell) to 6.4 ± 1.6 (texture), on a scale where 4 indicates “dislike slightly”,
5 “neither like nor dislike”, and 6 “like slightly”.
Debriefing Questionnaire
Four participants correctly assumed which preload they were given in each condition based
on gas and bloating (n=3), and hunger and fullness (n=2) cues. Three participants reported no
awareness of differences between given preloads in either condition.
DISCUSSION
Overall these findings do not suggest that pre-meal ingestion of inulin mixed into water
reduces EI, energy density, or weight of food consumed at any meal, over the course of the day,
nor over 24 hours. This study supports the results of Karalus, et al., in which participants’ EI was
monitored for 15 hours post inulin ingestion and finished with a self-reported EI over the next nine
hours to conclude a 24-hour testing period.16 However, subgroup differences were observed in the
present study. A greater absolute change in EI among females than men between the inulin and
control conditions implied there may be a gender difference in EI consumed between conditions,
as observed by Hess, et al.26 Greater EI and gram weight of food consumed observed in some
subgroups could be attributed to a tendency to consume higher amounts of food when a larger
energy content and volume of meals is provided,27 as it was with these buffet-style meals compared
to habitual daily meals. Obesity has been linked to dysbiosis in gut microbiome28 which can be
induced by diets higher in fat, such as Western diet,29 thus variations among subgroup responses

20
to inulin consumption could also be attributed to differences in GI microbiota. For example, greater
absolute EI difference over the course of the day between the two conditions was observed among
higher habitual fiber consumers compared to lower-fiber consumers. Similarly, participants with
a lower BMI consumed less gram weight of food at breakfast 2 in the inulin condition compared
to control, and have also demonstrated greater relative EI difference between conditions at the
dinner meals than participants with higher BMI. Additionally, participants with a higher cognitive
restraint score (i.e., the higher end of the normal range of cognitive restraint) may be more in tune
with their physiological responses to preload ingestion and food intake, and thus appetite
sensations, resulting in greater absolute EI difference over the course of the day compared to
participants with lower cognitive restraint scores. Strong positive correlations between the habitual
dietary fiber intake and dietary restraint score indicate it is difficult to determine the exact predictor
of the EI difference between the two conditions (r=0.755, p=0.05). Finally, it is possible that the
volume of the preload itself had an impact on EI in participants, and overshadowed any possible
difference with the addition of inulin, as the reduction in EI after the ingestion of 500 ml water
preload was noted in obese older adults in our previous study.20
Appetite sensations did not differ between conditions, suggesting that 24 hours is not
enough for inulin to elicit a reduction in perceived appetite. These outcomes support the results of
a systematic review by Wanders, et al., that in only 14% of cases less viscous fiber (e.g. inulin)
reduced appetite in preload-design studies (1.3% over 4 hours at a dose of 8.4 g).30 Acute studies
showing lower EI with inulin supplementation17,18 utilized Yerba Mate, Guarana and Damiana,
and yogurts as means of inulin administration, which itself can increase satiety and slow gastric
emptying.31,32 On the contrary, long-term ingestion of inulin or oligofructose seems to suppress
appetite,10,13,14 suggesting a cumulative effect of ITFs on appetite sensations. In addition, the effect

21
of acute inulin consumption on appetite suppression might have not been detected if slower rate
of gastric emptying is already present in the older adult population. GI side effects did not change
between conditions, with the exception of slightly increased rumbling noted in the inulin condition.
However, GI side effects are likely to subside with adaptation, as reported in long-term studies.12,14
In addition, participants reported being indifferent or slightly liking both preloads. These results
imply that a 10 g dose of inulin is palatable and well tolerated, supporting the results of Bonnema,
et al.,24 and further establishing tolerability in a middle-aged and older population.
Limitations
A small number of participants included in the study limits the statistical power. The
present study was powered to detect an 1802 kcal difference between the two conditions (n=7, SD
between the two conditions = 1000 kcal, 1-β=0.8, p=0.05). In order to detect 200 kcal difference
(1-β=0.8, p=0.05), 395 subjects would be needed. However, the obtained outcomes are consistent
with the results of other acute studies,16-18 questioning the need for a study with a larger sample
size. Additionally, due to the noninvasive nature of this study, increased gut hormone levels and
peaks of inulin fermentation are only assumed based on previous research.10,33-35 Even though
peaks of inulin fermentation were targeted by carefully timed meals (4, 10, 24 hours), it did not
allow us to specifically target a time point at which fermentation was the highest and food
consumption potentially the lowest. To control for the possible effect of solely water preload on
EI and appetite, a control condition in which participants would receive no preload could have
been included in the study design. Furthermore, it is also possible that food intake and activities
of daily living on the day prior to each test day impacted energy consumption during test meals,
however the randomized crossover design controls for these limitations. To our knowledge, this is

22
the first study investigating EI upon acute inulin consumption in overweight and obese middle-
aged and older adults.
CONCLUSION
Although these findings suggest no overall differences in energy intake following inulin
consumption, the subgroup findings imply that there may be differences in metabolic responses to
pre-meal inulin consumption on the individual level. As microbiota research is expanding, inulin
should continue to be evaluated from future investigations, due to other potential health benefits.
Future research should focus on investigating the effects of inulin supplementation on EI
administering a higher inulin dose and utilizing more invasive methods, such as hydrogen breath
test, blood samples, and stool samples.

23
TABLES
Table 2. Participant descriptive characteristics (n=7)
Mean±SD Range
Age (yrs) 60.9 ± 4.4 55 - 67
Height (cm) 163.5 ± 6.8 153 - 174
Weight (kg) 88.7 ± 18.0 65.5 – 112.3
BMI (kg/m2) 32.9 ± 4.3 26.2 - 38.3
Cognitive dietary restraint
(TFEQ)
6.3 ± 2.6 4 - 11
Physical activity (min/wk)a:
Mild
Moderate
36 ± 38
6 ± 8
0 – 105
0 - 15
Self-reported dietary intake:
Energy (kcal)
Energy density (g/kcal)
Carbohydrates (%)
Protein (%)
Fat (%)
Fiber (g)
Soluble (g)
Insoluble (g)
Water (mL), as beverage
1876 ± 479
0.733 ± 0.262
42 ± 6
16 ± 2
37 ± 8
18 ± 9
7 ± 3
11 ± 7
40 ± 43
1419 – 2741
0.409 – 1.193
33 – 50
14 – 20
28 – 47
10 – 34
4– 11
5 – 24
0 – 123 aAssessed using Godin Leisure Time Physical Activity Questionnaire.
Table 3. Physical activity during the two test conditionsb
Physical activity
(min)
Inulin + water
preload
Water preload p-value
Sedentary 902 ± 79 886 ± 90 0.775
Light 134 ± 31 155 ± 29 0.011
Moderate 25 ± 10 33 ± 18 0.391
Strenuous 0.3 ± 0.4 0.4 ± 0.3 0.302
Steps 5044 ± 1474 5532 ± 3393 0.716 bDetermined using accelerometry.

24
Table 4. Energy intake at test meals
Inulin + water
preload
Water preload p-value
Breakfast 1:
Energy (kcal)
Weight of food (g)
Energy density
803 ± 312
1149 ± 359
0.740 ± 0.316
750 ± 342
1016 ± 361
0.729 ± 0.140
0.358
0.469
0.929
Lunch:
Energy (kcal)
Weight of food (g)
Energy density
948 ± 377
1129 ± 291
0.853 ± 0.305
889 ± 317
1078 ± 283
0.847 ± 0.281
0.250
0.113
0.820
Dinner:
Energy (kcal)
Weight of food (g)
Energy density
1029 ± 365
1328 ± 472
0.788 ± 0.119
983 ± 271
1167 ± 394
0.872 ± 0.159
0.426
0.124
0.152
Day 1 total:
Energy (kcal)
Weight of food (g)
Energy density
2636 ± 1087
3606 ± 884
0.715 ± 0.148
2622 ± 885
3260 ± 944
0.811 ± 0.154
0.900
0.204
0.317
Breakfast 2:
Energy (kcal)
Weight of food (g)
Energy density
745 ± 339
857 ± 208
0.857 ± 0.241
706 ± 312
1006 ± 314
0.714 ± 0.248
0.532
0.163
0.262
Condition total:
Energy (kcal)
Weight of food (g)
Energy density
3524 ± 1327
4463 ± 1073
0.774 ± 0.126
3328 ± 1172
4267 ± 1216
0.779 ± 0.129
0.193
0.548
0.929

25
FIGURES
Figure 1. Study protocol
Crossover
1 week wash-out period
Double-Blind Randomization
Recruitment:
Print and email advertisements
Screening survey (online)
Session 1 (screening):
Informed Consent
Health History
Baseline screening: height, weight, BMI, 24-hour dietary recall, Godin LTEQ
Three Factor Eating Questionnaire
Food Diary (3 days)
Test Day 1:
500ml water preload
Sensory Evaluation Form
8am ad-lib breakfast test meal 1
VAS (0, 30, 60, 90, 120, 150 min)
GI tolerance scale
Provide accelerometer
12pm ad-lib lunch, packed in coolers
6pm ad-lib dinner, in lab
VAS (0, 30, 60, 90, 120, 150 min)
GI tolerance scale
Test Day 1:
500ml water + 10g inulin
Sensory Evaluation Form
8am ad-lib breakfast test meal 1
VAS (0, 30, 60, 90, 120, 150 min)
GI tolerance scale
Provide accelerometer 12pm ad-lib lunch, packed in coolers
6pm ad-lib dinner, in lab
VAS (0, 30, 60, 90, 120, 150 min)
GI tolerance scale
Test Day 3:
500ml water preload
Sensory Evaluation Form
8am ad-lib breakfast test meal 1
VAS (0, 30, 60, 90, 120, 150 min)
GI tolerance scale
Provide accelerometer
12pm ad-lib lunch, packed in coolers
6pm ad-lib dinner, in lab
VAS (0, 30, 60, 90, 120, 150 min)
GI tolerance scale
Test Day 3:
500ml water + 10g inulin
Sensory Evaluation Form
8am ad-lib breakfast test meal 1
VAS (0, 30, 60, 90, 120, 150 min)
GI tolerance scale
Provide accelerometer
12pm ad-lib lunch, packed in coolers
6pm ad-lib dinner, in lab
VAS (0, 30, 60, 90, 120, 150 min)
GI tolerance scale
Test Day 2:
8am ad-lib breakfast test meal 2
VAS (0, 30, 60, 90, 120, 150 min)
GI tolerance scale
Return accelerometer
Test Day 4:
8am ad-lib breakfast test meal 4
VAS (0, 30, 60, 90, 120, 150 min)
GI tolerance scale
Debriefing Questionnaire
Return accelerometer

26
a. b.
Figure 2. Gender subgroups: a. Gram weight of food consumed over 24 hours by males in 24h; b.
EI difference between the inulin and control conditions over three meals in females and males
a. b.
Figure 3. BMI status subgroups: a. Lower BMI group. (<32 kg/m2); b. %EI difference between
inulin and control conditions at the dinner meal in BMI subgroups
a. b.
Figure 4. Fiber and cognitive restraint subgroups: a. Lower fiber (<17 g/d); lower cognitive
restraint (TFEQ <6); b. EI difference between inulin and control conditions over three meals
0
1000
2000
3000
4000
5000
6000
7000
Inulin Control
Wei
ght
of
foo
d (
gra
ms)
p=0.013
-400
-300
-200
-100
0
100
200
300
400
Females Males
EI
dif
fere
nce
(kca
l)
p=0.027
0
200
400
600
800
1000
1200
Lunch (kcal) Breakfast 2 (g)
Fo
od
inta
ke
(kca
l/g)
Inulin Control
p=0.007
p=0.049
-25
-20
-15
-10
-5
0
5
10
15
20
BMI < 32 BMI > 32
%E
I d
iffe
rence
(kca
l)
p=0.046
0
500
1000
1500
2000
2500
3000
3500
4000
4500
Three Meals (kcal) Dinner (g)
Fo
od
inta
ke
(kca
l/g)
Inulin Control
p=0.043
p=0.045
-500
-400
-300
-200
-100
0
100
200
300
Fiber <17 g/d; TFEQ <6 Fiber >17 g/d; TFEQ >6
EI
dif
fern
ce (
kca
l)
p=0.032

27
0
20
40
60
80
100
0 30 60 90 120 150L
ine
Len
gth
(m
m)
Time (min)
Figure 5. Hunger at each meal (VAS) (mean ± SD)
Figure 6. Fullness at each test meal (VAS) (mean ± SD)
0
20
40
60
80
100
0 30 60 90 120 150
Lin
e L
ength
(m
m)
Time (min)
0
20
40
60
80
100
0 30 60 90 120 150
Lin
e L
ength
(m
m)
Time (min)
0
20
40
60
80
100
0 30 60 90 120 150
Lin
e L
ength
(m
m)
Time (min)
Inulin
Water
0102030405060708090
100
0 30 60 90 120 150
Lin
e L
ength
(m
m)
Time (min)
0
20
40
60
80
100
0 30 60 90 120 150
Lin
e L
ength
(m
m)
Time (min)
meal preload meal meal
Breakfast 1 (0 h) Dinner (10 h) Breakfast 2 (24 h)
meal
preload
meal meal
Breakfast 1 (0 h) Dinner (10 h) Breakfast 2 (24 h) preload

28
Figure 7. GI side effects ratings at test meals (breakfast 1, 0 h; dinner, 10 h; breakfast 2, 24 h)
(mean ± SD). *p<0.05
-0.5
0
0.5
1
1.5
2
2.5
3
0 10 20
Sca
le (
0-3
)
Time (h)
Gas / Bloating
-0.5
0
0.5
1
1.5
2
2.5
3
0 10 20
Sca
le (
0-3
)
Time (h)
Flatulence Inulin
Water
0
0.5
1
0 10 20
Sca
le (
0-3
)
Time (h)
Diarrhea
0
0.5
1
0 10 20
Sca
cle
(0-3
)
Time (h)
Constipation
-0.5
0
0.5
1
1.5
2
2.5
3
0 10 20
Sca
le (
0-3
)
Time (h)
Rumbling*
0
0.5
1
0 10 20
Sca
le (
0-3
)
Time (h)
Nausea

29
REFERENCES
1. Yang L, Colditz GA. Prevalence of Overweight and Obesity in the United States, 2007-
2012. JAMA Intern Med. Jun 22 2015.
2. Flegal KM, Carroll MD, Kit BK, Ogden CL. Prevalence of obesity and trends in the
distribution of body mass index among US adults, 1999-2010. Jama. Feb 1
2012;307(5):491-497.
3. NCD-RisC. Trends in adult body-mass index in 200 countries from 1975 to 2014: a pooled
analysis of 1698 population-based measurement studies with 19.2 million participants.
Lancet. 2016;387(10026):1377-1396.
4. Flegal KM, Graubard BI, Williamson DF, Gail MH. Excess deaths associated with
underweight, overweight, and obesity. Jama. Apr 20 2005;293(15):1861-1867.
5. An R. Health care expenses in relation to obesity and smoking among U.S. adults by
gender, race/ethnicity, and age group: 1998-2011. Public Health. Jan 2015;129(1):29-36.
6. Stenholm S, Sainio P, Rantanen T, et al. High body mass index and physical impairments
as predictors of walking limitation 22 years later in adult Finns. J Gerontol A Biol Sci Med
Sci. Aug 2007;62(8):859-865.
7. Manty M, Heinonen A, Viljanen A, et al. Outdoor and indoor falls as predictors of mobility
limitation in older women. Age Ageing. Nov 2009;38(6):757-761.
8. Slavin J. Fiber and prebiotics: mechanisms and health benefits. Nutrients. Apr
2013;5(4):1417-1435.
9. Gibson GR, Probert HM, Loo JV, Rastall RA, Roberfroid MB. Dietary modulation of the
human colonic microbiota: updating the concept of prebiotics. Nutr Res Rev. Dec
2004;17(2):259-275.
10. Chambers ES, Viardot A, Psichas A, et al. Effects of targeted delivery of propionate to the
human colon on appetite regulation, body weight maintenance and adiposity in overweight
adults. Gut. Dec 10 2014.
11. Kaur N, Gupta AK. Applications of inulin and oligofructose in health and nutrition. J
Biosci. Dec 2002;27(7):703-714.
12. Parnell JA, Reimer RA. Weight loss during oligofructose supplementation is associated
with decreased ghrelin and increased peptide YY in overweight and obese adults. Am J
Clin Nutr. Jun 2009;89(6):1751-1759.
13. Guess ND, Dornhorst A, Oliver N, Bell JD, Thomas EL, Frost GS. A randomized
controlled trial: the effect of inulin on weight management and ectopic fat in subjects with
prediabetes. Nutr Metab (Lond). 2015;12:36.
14. Cani PD, Joly E, Horsmans Y, Delzenne NM. Oligofructose promotes satiety in healthy
human: a pilot study. Eur J Clin Nutr. May 2006;60(5):567-572.
15. Heap S, Ingram J, Law M, Tucker AJ, Wright AJ. Eight-day consumption of inulin added
to a yogurt breakfast lowers postprandial appetite ratings but not energy intakes in young
healthy females: a randomised controlled trial. Br J Nutr. Jan 2016;115(2):262-270.
16. Karalus M, Clark M, Greaves KA, et al. Fermentable fibers do not affect satiety or food
intake by women who do not practice restrained eating. J Acad Nutr Diet. Sep
2012;112(9):1356-1362.

30
17. Harrold JA, Hughes GM, O'Shiel K, et al. Acute effects of a herb extract formulation and
inulin fibre on appetite, energy intake and food choice. Appetite. Mar 2013;62:84-90.
18. Perrigue MM, Monsivais P, Drewnowski A. Added soluble fiber enhances the satiating
power of low-energy-density liquid yogurts. J Am Diet Assoc. Nov 2009;109(11):1862-
1868.
19. Clarkston WK, Pantano MM, Morley JE, Horowitz M, Littlefield JM, Burton FR. Evidence
for the anorexia of aging: gastrointestinal transit and hunger in healthy elderly vs. young
adults. Am J Physiol. Jan 1997;272(1 Pt 2):R243-248.
20. Davy BM, Dennis EA, Dengo AL, Wilson KL, Davy KP. Water consumption reduces
energy intake at a breakfast meal in obese older adults. J Am Diet Assoc. Jul
2008;108(7):1236-1239.
21. Van Walleghen EL, Orr JS, Gentile CL, Davy BM. Pre-meal water consumption reduces
meal energy intake in older but not younger subjects. Obesity. Jan 2007;15(1):93-99.
22. Godin G, Shephard RJ. A simple method to assess exercise behavior in the community.
Can J Appl Sport Sci. Sep 1985;10(3):141-146.
23. Stunkard AJ, Messick S. The three-factor eating questionnaire to measure dietary restraint,
disinhibition and hunger. J Psychosom Res. 1985;29(1):71-83.
24. Bonnema AL, Kolberg LW, Thomas W, Slavin JL. Gastrointestinal tolerance of chicory
inulin products. J Am Diet Assoc. Jun 2010;110(6):865-868.
25. Flint A, Raben A, Blundell JE, Astrup A. Reproducibility, power and validity of visual
analogue scales in assessment of appetite sensations in single test meal studies. Int J Obes
Relat Metab Disord. Jan 2000;24(1):38-48.
26. Hess JR, Birkett AM, Thomas W, Slavin JL. Effects of short-chain fructooligosaccharides
on satiety responses in healthy men and women. Appetite. Feb 2011;56(1):128-134.
27. Ello-Martin JA, Ledikwe JH, Rolls BJ. The influence of food portion size and energy
density on energy intake: implications for weight management. Am J Clin Nutr. Jul
2005;82(1 Suppl):236S-241S.
28. Bell DS. Changes seen in gut bacteria content and distribution with obesity: causation or
association? Postgrad Med. 2015;127(8):863-868.
29. Pendyala S, Walker JM, Holt PR. A high-fat diet is associated with endotoxemia that
originates from the gut. Gastroenterology. May 2012;142(5):1100-1101 e1102.
30. Wanders AJ, van den Borne JJ, de Graaf C, et al. Effects of dietary fibre on subjective
appetite, energy intake and body weight: a systematic review of randomized controlled
trials. Obes Rev. Sep 2011;12(9):724-739.
31. Andersen T, Fogh J. Weight loss and delayed gastric emptying following a South American
herbal preparation in overweight patients. J Hum Nutr Diet. Jun 2001;14(3):243-250.
32. Marciani L, Gowland PA, Spiller RC, et al. Effect of meal viscosity and nutrients on satiety,
intragastric dilution, and emptying assessed by MRI. Am J Physiol
Gastrointest Liver Physiol. Jun 2001;280(6):G1227-1233.
33. Stewart ML, Timm DA, Slavin JL. Fructooligosaccharides exhibit more rapid fermentation
than long-chain inulin in an in vitro fermentation system. Nutr Res. May 2008;28(5):329-
334.
34. Gomez E, Tuohy KM, Gibson GR, Klinder A, Costabile A. In vitro evaluation of the
fermentation properties and potential prebiotic activity of Agave fructans. J Appl
Microbiol. Jun 2010;108(6):2114-2121.

31
35. Noack J, Timm D, Hospattankar A, Slavin J. Fermentation profiles of wheat dextrin, inulin
and partially hydrolyzed guar gum using an in vitro digestion pretreatment and in vitro
batch fermentation system model. Nutrients. May 2013;5(5):1500-1510.
32
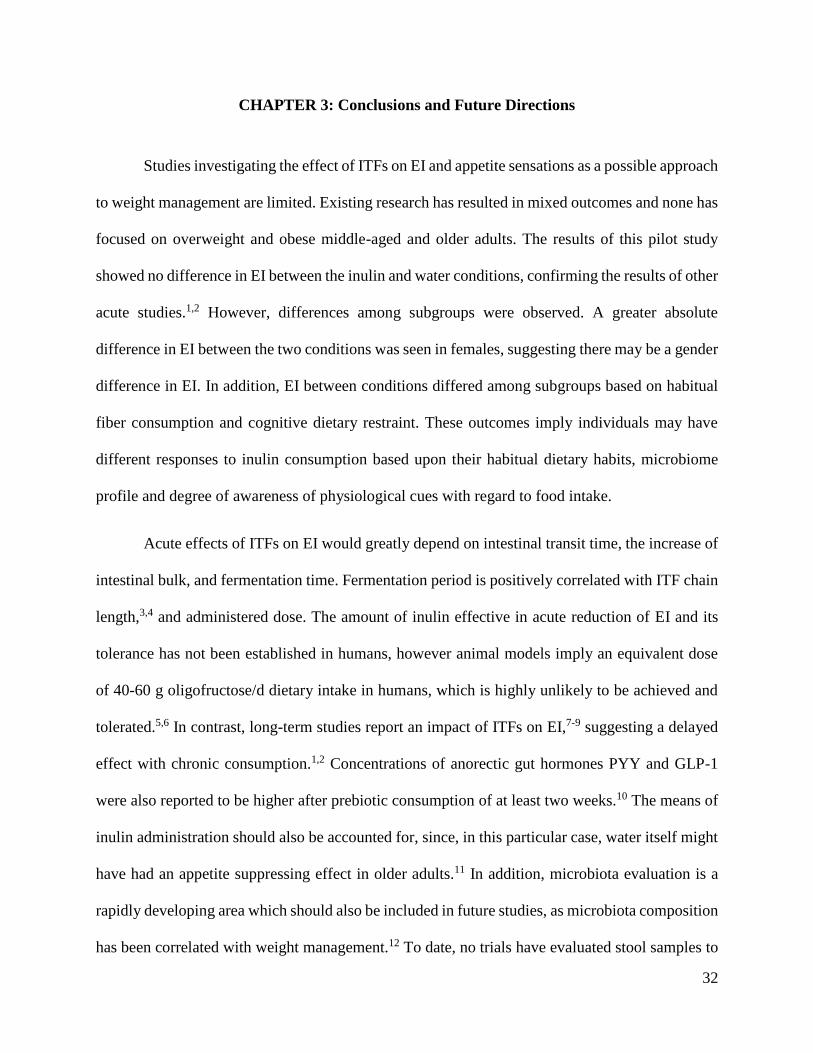
CHAPTER 3: Conclusions and Future Directions
Studies investigating the effect of ITFs on EI and appetite sensations as a possible approach
to weight management are limited. Existing research has resulted in mixed outcomes and none has
focused on overweight and obese middle-aged and older adults. The results of this pilot study
showed no difference in EI between the inulin and water conditions, confirming the results of other
acute studies.1,2 However, differences among subgroups were observed. A greater absolute
difference in EI between the two conditions was seen in females, suggesting there may be a gender
difference in EI. In addition, EI between conditions differed among subgroups based on habitual
fiber consumption and cognitive dietary restraint. These outcomes imply individuals may have
different responses to inulin consumption based upon their habitual dietary habits, microbiome
profile and degree of awareness of physiological cues with regard to food intake.
Acute effects of ITFs on EI would greatly depend on intestinal transit time, the increase of
intestinal bulk, and fermentation time. Fermentation period is positively correlated with ITF chain
length,3,4 and administered dose. The amount of inulin effective in acute reduction of EI and its
tolerance has not been established in humans, however animal models imply an equivalent dose
of 40-60 g oligofructose/d dietary intake in humans, which is highly unlikely to be achieved and
tolerated.5,6 In contrast, long-term studies report an impact of ITFs on EI,7-9 suggesting a delayed
effect with chronic consumption.1,2 Concentrations of anorectic gut hormones PYY and GLP-1
were also reported to be higher after prebiotic consumption of at least two weeks.10 The means of
inulin administration should also be accounted for, since, in this particular case, water itself might
have had an appetite suppressing effect in older adults.11 In addition, microbiota evaluation is a
rapidly developing area which should also be included in future studies, as microbiota composition
has been correlated with weight management.12 To date, no trials have evaluated stool samples to

33
associate EI and appetite sensations with potential changes in microbiota,10,12,13 which is certainly
an aspect that should be investigated.
In conclusion, the results of this pilot study largely supported existing research on the acute
effects of ITFs on EI. The role of ITFs in weight management is a growing field and their presence
is expected in future studies, which should account for variations in gender, cognitive dietary
restraint, microbiota profile, and weight status among individuals in all age groups.

34
REFERENCES
1. Karalus M, Clark M, Greaves KA, et al. Fermentable fibers do not affect satiety or food
intake by women who do not practice restrained eating. J Acad Nutr Diet. Sep
2012;112(9):1356-1362.
2. Hess JR, Birkett AM, Thomas W, Slavin JL. Effects of short-chain fructooligosaccharides
on satiety responses in healthy men and women. Appetite. Feb 2011;56(1):128-134.
3. Stewart ML, Timm DA, Slavin JL. Fructooligosaccharides exhibit more rapid fermentation
than long-chain inulin in an in vitro fermentation system. Nutr Res. May 2008;28(5):329-
334.
4. Bonnema AL, Kolberg LW, Thomas W, Slavin JL. Gastrointestinal tolerance of chicory
inulin products. J Am Diet Assoc. Jun 2010;110(6):865-868.
5. Cani PD, Dewever C, Delzenne NM. Inulin-type fructans modulate gastrointestinal
peptides involved in appetite regulation (glucagon-like peptide-1 and ghrelin) in rats. Br J
Nutr. Sep 2004;92(3):521-526.
6. Jenkins DJ, Kendall CW, Vuksan V. Inulin, oligofructose and intestinal function. J Nutr.
Jul 1999;129(7 Suppl):1431S-1433S.
7. Parnell JA, Reimer RA. Weight loss during oligofructose supplementation is associated
with decreased ghrelin and increased peptide YY in overweight and obese adults. Am J
Clin Nutr. Jun 2009;89(6):1751-1759.
8. Cani PD, Joly E, Horsmans Y, Delzenne NM. Oligofructose promotes satiety in healthy
human: a pilot study. Eur J Clin Nutr. May 2006;60(5):567-572.
9. Guess ND, Dornhorst A, Oliver N, Bell JD, Thomas EL, Frost GS. A randomized
controlled trial: the effect of inulin on weight management and ectopic fat in subjects with
prediabetes. Nutr Metab (Lond). 2015;12:36.
10. Kellow NJ, Coughlan MT, Reid CM. Metabolic benefits of dietary prebiotics in human
subjects: a systematic review of randomised controlled trials. Br J Nutr Apr 14
2014;111(7):1147-1161.
11. Davy BM, Dennis EA, Dengo AL, Wilson KL, Davy KP. Water consumption reduces
energy intake at a breakfast meal in obese older adults. J Am Diet Assoc. Jul
2008;108(7):1236-1239.
12. Bell DS. Changes seen in gut bacteria content and distribution with obesity: causation or
association? Postgrad Med. 2015;127(8):863-868.
13. Verhoef SP, Meyer D, Westerterp KR. Effects of oligofructose on appetite profile,
glucagon-like peptide 1 and peptide YY3-36 concentrations and energy intake. Br J Nutr.
Dec 2011;106(11):1757-1762.

35
APPENDIX A: Institutional Review Board Approval

36

37
APPENDIX B: Questionnaires & Food Items at Ad Libitum Meals
Sensory Evaluation Form
Directions: Check one rating (using an “x”) for each of the following: Appearance,
Taste/Flavor, Texture/Consistency, Aroma/Smell, and Overall Acceptability
Rating Scale Appearance Taste/Flavor Texture/
Consistency
Aroma/Smell Overall
Acceptability
9. Like Extremely
8. Like Very Much
7. Like Moderately
6. Like Slightly
5. Neither Like or Dislike
4. Dislike Slightly
3. Dislike Moderately
2. Dislike Very Much
1. Dislike Extremely

38
Visual Analog Scales
Directions: Place an “x” on the line to indicate your response:
1. How strong is your desire to eat right now?
Very strong Very weak
2. How hungry do you feel right now?
Not hungry at all Extremely hungry
3. How full do you feel right now?
Not at all full Extremely full
4. How much food do you think you could eat?
Nothing at all A large amount
5. How thirsty do you feel right now?
Not at all thirsty Extremely thirsty
6. How pleasant do you find the food right now?
Very pleasant Not at all pleasant
7. How nauseated do you feel right now?
Not At all Nauseated Very Nauseated

39
GI Tolerance Scale
The following items are intended to help monitor any symptoms you may be experiencing while
participating in this study. Please, rank the following items on a scale of 0-3 as honestly and
accurately as possible: 0=none 1=mild 2=moderate 3=severe
Gas/Bloating
0 1 2 3
Flatulence
0 1 2 3
Diarrhea
0 1 2 3
Constipation
0 1 2 3
GI Rumbling
0 1 2 3
Nausea
0 1 2 3
Cramping
0 1 2 3

40
Debriefing Questionnaire
The purpose of this questionnaire is to find out if participants were aware of which preload they
were given during the study.
1. Do you have an idea which preload you were given during the first 24-hour-study-period, i.e.
on Test Day 1? Please circle.
Inulin mixed into water
Plain water
2. What makes you believe you were given that preload?
3. Do you have an idea which preload you were given during the second 24-hour-study-period,
i.e. on Test Day 2? Please circle.
Inulin mixed into water
Plain water
4. What makes you believe you were given that preload?

41
Food Items at the Ad libitum Meals
Breakfast
Bread
Bagels
Turkey sausage
Cheese sticks
Yogurt
Cereal bar
Bananas
Butter, peanut butter, jelly,
cream cheese
Orange juice, coffee, tea,
milk (1%), water
Sugar, cream
Lunch
Bread
Deli meat
Cheese
Cheese stick
Potato chips
Cookies, Pudding,
Applesauce, Cereal bar
Lettuce, carrots
Mustard, mayo, ranch
Orange juice, water
Dinner
Bread
Meat lasagna
Spaghetti with meatballs
Animal crackers, Pudding,
Peach cups
Cucumbers, carrots
Butter, ranch
Orange juice, milk (1%),
water