influence of alkaline delignification on moisture uptake
TRANSCRIPT
AR T I C L E
Influence of alkaline delignification on moisture uptakebehavior and bonding enthalpies of hemp
Albert M. Manich1 | Manuel J. Lis2 | Sonia Perez-Rentero3 |
Ines Algaba4 | Meritxell Marti5 | Diana Cayuela2
1Institute for Advanced Chemistry ofCatalonia (IQAC-CSIC), Barcelona, Spain2Textile Research Institute of Terrassa(INTEXTER), Universitat Politècnica deCatalunya, Terrassa, Spain3“Josep Carilla” Thermal Analysis andCalorimetry Laboratory (IQAC-CSIC),Barcelona, Spain4Statistics and Operations ResearchDepartment, Universitat Politècnica deCatalunya, Terrassa, Spain5Cosmetic and Textile Innovations Group(IQAC-CSIC), Barcelona, Spain
CorrespondenceAlbert M. Manich, Institute for AdvancedChemistry of Catalonia (IQAC-CSIC),Jordi Girona 18-26, 08034 Barcelona,Spain.Email: [email protected]
Funding informationMinistry of Science and Innovation ofSpain, Grant/Award Number:MAT2016-79352-R
Abstract
Raw hemp fibers are alkaline delignified to evaluate the effect of lignin on the
moisture uptake behavior of hemp. Samples are subjected to moisture absorp-
tion/desorption isotherms from 5% to 95% relative humidity at three different
temperatures (15, 25, and 35�C). The sorption ratio between delignified and
untreated hemp is lowered by 25%. Hysteresis makes evident the greater influ-
ence of lignin on moisture binding at low relative humidity while at high
relative humidity, cellulose plays the most important role. The GAB,
Hailwood-Horrobin and Dent models are fitted to absorption/desorption
isotherms. Delignification and temperature decrease the size of the monolayer.
The energy constants of the monolayer differ according to the model used.
Lignin causes great differences between absorption and desorption. The greater
the temperature is, the lower the monolayer energy constant. The energy con-
stants of the multilayer are identical for the three models, showing a greater
range of variation in delignified samples than in the untreated samples. Based
on primary and secondary energy constants, bonding enthalpies are determined.
Estimations in desorption show higher correlation coefficients with the energy
constants, which enables to conclude that measures in desorption better explain
the effect of delignification on the water uptake behavior of hemp.
KEYWORD S
adsorption, biopolymers and renewable polymers, cellulose and other wood products
1 | INTRODUCTION
Hemp (Cannabis sativa L.), is a plant of the Cannabaceaefamily that has been grown and utilized in a varietyof environments and countries worldwide.1,2,3 Theability of hemp to root deeply makes it a low nitrogen-and irrigation-demanding crop, yielding significant
environmental benefits compared to other competingfiber-producing crops, such as cotton. Hemp is able togrow in areas contaminated with heavy metals, favoringbioremediation.4,5,6
Hemp fibers can be considered a network of ultrafinecellulose fibrils embedded in a matrix of hemicellulosesand lignin.7 Lignin in bast fibers makes them stiff and
Received: 20 January 2021 Revised: 13 April 2021 Accepted: 27 April 2021
DOI: 10.1002/app.50990
This is an open access article under the terms of the Creative Commons Attribution-NonCommercial-NoDerivs License, which permits use and distribution in any
medium, provided the original work is properly cited, the use is non-commercial and no modifications or adaptations are made.
© 2021 The Authors. Journal of Applied Polymer Science published by Wiley Periodicals LLC.
J Appl Polym Sci. 2021;e50990. wileyonlinelibrary.com/journal/app 1 of 15
https://doi.org/10.1002/app.50990
hinders their breakdown and spinnability.8 The mainobjective of delignification is to separate fiber bundles intoelementary fibers by removing lignin that holds bundlestogether, enabling the elementary ''cottonized'' fibers to bespun using the conventional cotton spinning process.
The composition and delignification process of hemphave been widely described.9 The comparison betweendifferent cottonization processes for a wide range of bastfibers, including hemp, has been studied, although manyworks have focused on flax.10
Cottonization of hemp, as that of the other bast fibers,has been approached from mechanical, chemical andenzymatic points of view in combination with wet vaporapplication processes. Cottonization modifies the fiberstructure, increasing the specific surface area and causingchanges in crystallinity, thermal stability, mechanicalproperties and moisture absorption and desorptionbehavior.11,12,13 The predominant task in preparing hempfibers for further processing is to remove the non-cellulosic components, improving sorption and otherfiber properties without damaging the cellulose of thefiber.14 Attempts to explain the individual roles of hemi-celluloses and lignin removal in the moisture uptakebehavior of chemically modified hemp fibers have beenmade.7 These modifications favor the application of bastfibers alone or in blends to the manufacture of substratesfocused on the production of clothing and home textiles.
Moisture sorption breaks secondary interactionsbetween macromolecules of cellulose by water moleculesabsorbing into the fibers by hydrogen bonds, causingswelling. Lignin may contribute to moisture sorption viaits carboxyl and both aliphatic and phenolic hydroxylgroups.15 The effect of lignin on sorption andhygroexpansion has been frequently discussed, and it isagreed that the more hydrophilic cellulose and hemicel-luloses in the cell wall being surrounded by the lesshydrophilic lignin is essential for the relationshipbetween water and cell wall components.
Lignin can be considered an easily accessiblemoisture-absorbing material, the removal of which cau-ses significant alterations to the fiber surface and accessi-bility.16 Delignification modifies the moisture behavior offibers because of changes caused in chemical composi-tion, crystallinity and pore structure.7
1.1 | Characterization of moistureuptake behavior during absorption anddesorption
The moisture uptake held within a cellulose fiber exerts aprofound influence on its rheological properties. Thewater uptake versus the bone-dry mass of a sample is
known as ''regain''. The relation between regain fromvery low to very high levels of relative humidity of thesurrounding air at constant temperature are measured togenerate the sorption isotherm.
Rheological tests are frequently performed under con-trolled conditions of relative humidity and temperature;consequently, it is useful to know the sorption isothermfor a particular material being investigated, as the varia-tion in the rheological property with moisture regainmay be calculated from its variation with humidity. Sim-ple relationships may be expected between moistureregain and rheological behavior since it is the amount ofwater within the fiber that governs its behavior.
1.1.1 | The sorption ratio
Meredith17 found that the regain of viscose comparedwith that of cotton at the same relative humidity from 5%to 85% RH results in an almost constant number that hecalled the ''sorption ratio''. By means of this number,he found that, provided the isotherms of cotton wereknown, it was possible to express the regain of anotherfiber with fair accuracy. This was based on the assump-tion that the nature of absorption in different cellulosicfibers was similar and differed only in quantity.
The sorption ratio enables us to determine the effectcaused by different treatments on fiber regain. To charac-terize fibers, Meredith uses the mean value of the sorp-tion ratio determined during absorption and desorptionwhen subjected to a wide range of relative humidity.
1.1.2 | Temperature and regain
Weigerink18 investigated the effect of temperature on theregain of cellulosic fibers at different relative humiditylevels. He found that in a wide range of temperaturesfrom 20 to 100�C, the regain X decreased linearly withthe increase in the reciprocal of the absolute temperatureT according to the following relationship: Log X = A–B�(1/T). He found that slope B differed between differentcellulosic fibers and was able to explain the effect of tem-perature on regain at different levels of relative humidity.
1.1.3 | Hysteresis
The desorption isotherm of a hygroscopic material suchas cellulosic fibers lies above the absorption isothermbecause the amount of water held at a given relativehumidity is greater in fibers coming from higher humid-ity than those from lower humidity.
2 of 15 MANICH ET AL.
Moisture in fibers, in addition to modifying the intrin-sic properties of fibers, causes anisotropic swelling thatalters the geometry of the fiber. In cellulosic fibers, themolecules show a preferred orientation in the directionof the fiber axis, and the crystallites are much longer thanthey are wide. The same thickness of the non-crystallinefiber-water phase surrounding a crystalline region willproduce greater swelling laterally than longitudinally.Changes in length and diameter with relative humidityshow hysteresis, similar to that of moisture regain.17
Hysteresis can be measured at different relative humid-ity levels by the growth in regain measured in desorptionXd versus that in absorption Xa as a percentage, accordingto the following relationship: H (%) = 100 (Xd-Xa)/Xa.19
1.2 | Modeling the absorption-desorptionisotherms
The classic Brunauer, Emmett and Teller (BET) absorptionmodel is based on the good correlation between the num-ber of water molecules linked to the first absorption layerand the number of polar groups of the absorbent. This pro-cess is known as ''primary absorption''. It is assumed thateach polar group links one water molecule, which, in turn,can capture other molecules diffusing to the interior of thematerial thanks to the increase in relative humidity of theenvironment, giving rise to ''secondary absorption''.
The BET equation is used to calculate the size of themonolayer of the most diverse materials and is recog-nized by the IUPAC for the calculation of the specific sur-face of absorption. In 1985, the Colloid and SurfaceChemistry Commission recommended the BET equationto estimate the size of the monolayer at relative humidityRH between 5% and 30%. The relative humidity RH (%)can also be identified as the water activity aw (RH/100),which corresponds to the molar fraction of moisture ver-sus the moisture concentration at saturation. If the rela-tive humidity ranges from 0% to 100%, aw will vary from0 to 1. Moisture uptake of sample X will be measured as''regain'' (bone-dry weight in %), and the models fit theevolution of regain as a function of water activity aw.
1.2.1 | GAB model
The Guggenheim, Anderson and de Boer (GAB)model estimates the size of the monolayer in a range ofaw from 0.05 to 0.8–0.9,20 which enables the estimation ofthe primary and secondary absorption. BET and GAB iso-therms are based on the same hypothesis and share thesize of the monolayer Xm and its energy constant C.Additionally, the GAB model estimates the multilayer
energy constant K, and both C and K describe the plotshape of the sample regain X versus water activity aw.
C defines the initial convexity at low water activities,proportional to the variation in ratio between absorptionand desorption rates, when the partial pressure of humid-ity for the monolayer is modified. K defines the concaveshape at greater water activities and depends on the ratiobetween the absorption and desorption rates of the watermolecules placed in the upper layers. The lower the K is,the less structured the multilayer sorbate is in relation tothe pure liquid state. K growths with the interactionbetween sorbate and sorbent.20
According to various authors,21 the level of wateractivity at which secondary absorption begins to over-come the primary absorption is determined by the mini-mum of the isotherm derivative, which corresponds to itsinflection point [aw(inf), X(inf)].
1.2.2 | Hailwood-Horrobin model
The Hailwood-Horrobin model22 splits the absorption iso-therm between primary absorption on the monolayer andsecondary absorption on the multilayers. Primary absorp-tion measures the hydrated polymer P H2O caused by thereaction between the free water dissolved into the polymerH2Osol and the dry polymer P forming a single solid phasewith the three components in equilibrium. K1, the equilib-rium constant between the hydrated polymer and its com-ponents (dry polymer and free water dissolved into thepolymer), is the monolayer constant. Secondary absorptiondepends on the equilibrium between the water vapor inthe surrounding atmosphere and water dissolved into thepolymer. The equilibrium constant K relates the concen-tration of moisture measured as the water activity from awand the water dissolved into the polymer H2Osol.
If the amount of water absorbed is referred to as themolecular weight of polymer M (g mol�1), moistureuptake can be split between moles of water dissolved intothe polymer and moles of water linked to the polymer.Consequently, the sample regain X (%) can be expressedas the sum of bound water in the monolayer (primarywater) Xp and free water in the multilayer (secondarywater) Xs. The whole regain X will result from the addi-tion of Xp = (1800 / M) [K1 K aw / (1 - K1 K aw)] andXs = (1800 / M) [K aw / (1 - K aw)].
The water activity at which the primary water tieswith the secondary water aw(p = s) and the regain at thispoint Xp = s can be determined. Primary and secondarywater determined by the Hailwood-Horrobin model areequivalent to those given by the GAB model.23
M is always greater than the molecular mass of a polargroup in the fiber. This can be justified by the presence of
MANICH ET AL. 3 of 15

crystalline areas inaccessible to water that are consideredthe molecular mass of the accessible polar group. It alsoestimates the mass of material inaccessible to water.
1.2.3 | The Dent model
The Dent model,24 as the Hailwood-Horrobin model,considers the evolution of primary Xp and secondary Xsabsorption as a function of water activity aw, where X isthe whole regain, and the addition of the two compo-nents results in X = Xm b0 aw / [(1- b aw) (1- b aw + b0aw)], where Xm is the size of the monolayer as that of theGAB model, b0 is the energy constant of the primaryabsorption, and b is the energy constant of the secondaryabsorption. The two components are split as follows:Xp = Xm b0 aw / [1 + (b0 - b) aw] and Xs = Xm b0 b aw
2 /[1 + (b0 - b) aw] / (1 - b aw). As in the Hailwood-Horrobinmodel, the water activity at which the primary absorptionequals the secondary absorption aw(p = s), and the regainat this point Xp = s can also be determined.
1.3 | Enthalpies of primary (monolayer)and secondary (multilayer) bonding
According to Kapsalis,25 the slope of the linear fittingbetween the logarithm of the primary and secondaryenergy constants given by the GAB model, as a functionof the inverse of the absolute temperature T, is related tothe variation in enthalpy caused by the primary andsecondary moisture uptake:
Primary absorption : log C¼ log γþðHm –HnÞ=ðR TÞð1Þ
Secondary absorption : log K ¼ log δþðHp –HnÞ=ðR TÞð2Þ
where γ and δ are entropic factors, Hm is the enthalpy ofwater molecules linked to the monolayer, Hn is that ofthe water linked to the multilayer, and Hp is the enthalpyof the free water. R is the gas constant 8.314 J K�1 mol�1
or 0.4619 J K�1 g�1 if water is measured in grams insteadof mols.
1.4 | Objectives
The objective of this work was to study the effect of thealkaline delignification of hemp on its moisture uptakethrough the evaluation of the sorption ratio, the effect of
temperature on regain during absorption and desorption,and the hysteresis of the isotherms; by fitting the differentmodels to the isotherms, estimations of the monolayer sizewere determined during both absorption and desorption,and the energy constants of primary and secondary sorp-tion, the moisture uptake at saturation, the levels of wateractivity and regain at which primary absorption equalssecondary absorption and, finally, the primary and second-ary bonding enthalpies were determined.
1.5 | Novelty and justification ofthe work
The work has been done under the project ''Preparation andfunctionalization of hemp for textile substrates'' to study oneof its objectives: the application of hemp replacing cotton inclothing, household textiles and medical devices, in order toreduce their fabrication on cotton import. The characteriza-tion of the moisture uptake behavior is very important toevaluate the adequacy of goods in contact with human bodyas occurs in clothing and medical devices.
The novelty of the paper lies on the application of threetools that easily characterize the moisture uptake behavior,that can be extended to other lignocellulosic fibers:
a. The sorption ratio defined by Meredith17 more than60 years ago, that helps to easily characterize thisbehavior.
b. The combination of hysteresis and sorption ration,that enables to identify the levels of humidity wherelignin or cellulose play the most influencing role onmoisture binding.
c. The calculation of the enthalpies of primary and sec-ondary bonding normally based on GAB model but, inthis work, extended to Hailwood-Horrobin and Dentmodels of sorption isotherm, that enable to characterizethe bonding energy of water to lignin and cellulose.
Additional novelties are based on the evaluation of the con-tribution of lignin on the size of the monolayer, its effect onthe different behavior between absorption and desorption ofmoisture, and to confirm that the desorption isotherm is themost adequate to characterize the effect of delignification onthe moisture uptake behavior of the fiber.
2 | MATERIALS
2.1 | Untreated hemp
Raw hemp fibers were supplied by CELESA, and afterbeing rinsed in distilled water at room temperature for
4 of 15 MANICH ET AL.

10 min to remove impurities, dust, and water-solublesalts, the hemp was used as untreated raw material.
2.2 | Delignified hemp
The untreated hemp fibers were subjected to an alkalinedelignification treatment under the following conditions:NaOH, 40 g L�1; surfactant Hostapal DTC, 1.5 g L�1;temperature, 110�C; time, 3 h; and water bath ratio, 1:20.The samples were then rinsed with distilled water at80�C and subjected to a neutralization treatment withacetic acid and two final rinses with distilled water. Afterdrying, delignified hemp was obtained.
3 | METHODS
3.1 | Lignin content
The lignin content was chemically determined followingthe TAPI T222 om-15 standard. The results were corre-lated with those obtained by thermogravimetric analysis(TGA), and the lignin content in % was determinedaccording to procedures described elsewhere.9
3.2 | Moisture absorption/desorptiontrials
Moisture absorption/desorption isotherms were per-formed at three temperatures (15, 25, and 35�C) on sam-ples of approximately 10 mg using the Q5000SA dynamicvapor sorption DVS analyzer (TA Instruments) accordingto the following procedure:
1. Initial drying was conducted at 60�C and 0% relativehumidity for 300 min.
2. Pre-stabilization was performed at 0% relative humid-ity at the isotherm temperature, and then a relativehumidity RH of 5% until stabilization.
3. Absorption process: Samples stabilized at 5% RH weresubjected to increasing absorption stages to stabiliza-tion from 15% to 25%, 35%, 45%, 55%, 65%, 75%, 85%,and 95% RH.
4. Desorption process: The samples stabilized at 95% RHwere subjected to decreasing desorption stages to 85%,75%, 65%, 55%, 45%, 35%, 25%, 15%, and 5% RH tocomplete a cycle of moisture absorption/desorption.
5. The maximum time that the samples remained ateach absorption/desorption stage was 500 min. Thetime could be shortened if quasi-stabilization condi-tions were reached (variation in sample mass lower
than 0.01% for 18 min). If this condition occurred, thesample proceed to the next stage.
3.3 | Sorption ratio
Using the experimental results of regain given by theabsorption/desorption trials, the sorption ratio between del-ignified and raw hemp at different water activities aw from0.05 to 0.85 was determined during absorption and desorp-tion at the three different temperatures according to theprocedure described in section 1.1.1. The effect of measur-ing conditions (absorption/desorption, water activity, andtemperature) on the sorption ratio between delignified anduntreated hemp was determined by analysis of variance.26
3.4 | Temperature and regain
Regain values at the same water activity level measuredon the isotherms at 15, 25, and 35�C enabled the determi-nation of the effect of temperature on moisture regain byfitting a linear regression between regain X and tempera-ture T, according to the model X = A – B � T, where A isthe initial constant that predicts regain at 0�C (%) and Bis the slope that can be considered as the ''thermal regainloss'', that is, the decrease in regain caused by theincrease of temperature in tens of degrees (%/10�C).
Values of A enabled plotting the predicted isothermsof both the untreated and delignified hemp samples at0�C. Linear regression was performed with the modifiedWeigerink model18 explained in section 1.1.2, disregardingthe logarithmic transformation of regain and considering alinear relationship with temperature in degrees centigradeinstead of the reciprocal of the absolute temperature.
3.5 | Hysteresis
As explained in section 1.1.3, hysteresis was measured atdifferent levels of water activity from 0.05 to 0.85 accordingto the relationship H (%) = 100 (Xd-Xa) / Xa, where Xd isthe regain of the sample measured in desorption and Xa isthe regain of the sample measured in sorption.
3.6 | Fitting the isotherms of moistureabsorption/desorption
The software of the DVS analyzer automatically gave theparameters of the GAB absorption isotherm,27 which wereused as initial estimators for obtaining the parameters ofthe absorption and desorption isotherms by the application
MANICH ET AL. 5 of 15
of an iterative non-linear regression procedure describedelsewhere.28 This procedure allowed for prediction of themoisture uptake X1 at saturation aw = 1, which was usedfor the estimation of the desorption isotherm together withregain values during desorption from aw = 0.85 toaw = 0.05. The application of the non-linear regression pro-cedure using the initial estimators given by the absorptionmodel enabled fitting the GAB model during desorption.
Initial estimators of the two other fitted isotherms dur-ing absorption were obtained following the proceduresdescribed for the Hailwood-Horrobin22 and Dent24 models.
The application of the same iterative non-linear regressionprocedure enabled fitting the models during absorptionthat, as was conducted for the GAB model, gave predictionof the maximum regain X1 at aw = 1, which together withthe results given by the desorption isotherm fromaw = 0.85 to aw = 0.05, allowed the calculation of theHailwood-Horrobin and Dent models during desorption.
The goodness of fit of all models during absorptionand desorption at different temperatures (15, 25, and35�C) were estimated by the determination coefficientR2
adj adjusted to the degrees of freedom.
3.7 | Enthalpies of primary andsecondary absorption
According to the equations of Kapsalis described in 1.3that use the energy constants given by the GAB model,the slopes (Hm–Hn)/R and (Hp–Hn)/R enable the deter-mination of the variation in enthalpy caused by the pri-mary absorption ΔHp (= Hm-Hn) when water moleculesmove from the multilayer to the monolayer and that cau-sed by the secondary absorption ΔHs (= Hp-Hn) whenfree water molecules join the multilayer.
Estimations of enthalpy were conducted with theabsorption and desorption isotherms, and the primary andsecondary energy constants given by the Hailwood-Horrobin and Dent models were also used, and the resultswere compared with those given by the GAB model.
Table 1 summarizes the different models of theabsorption/desorption isotherms, the meaning ofthe parameters and their relations with the enthalpies ofprimary and secondary absorption.
4 | RESULTS AND DISCUSSION
4.1 | Lignin content
The lignin contents were 6.2% for the untreated rawhemp and 2.9% for the alkaline delignified hemp, thetreatment process of which removed 53.2% of the lignin.
4.2 | Absorption/desorption isotherms
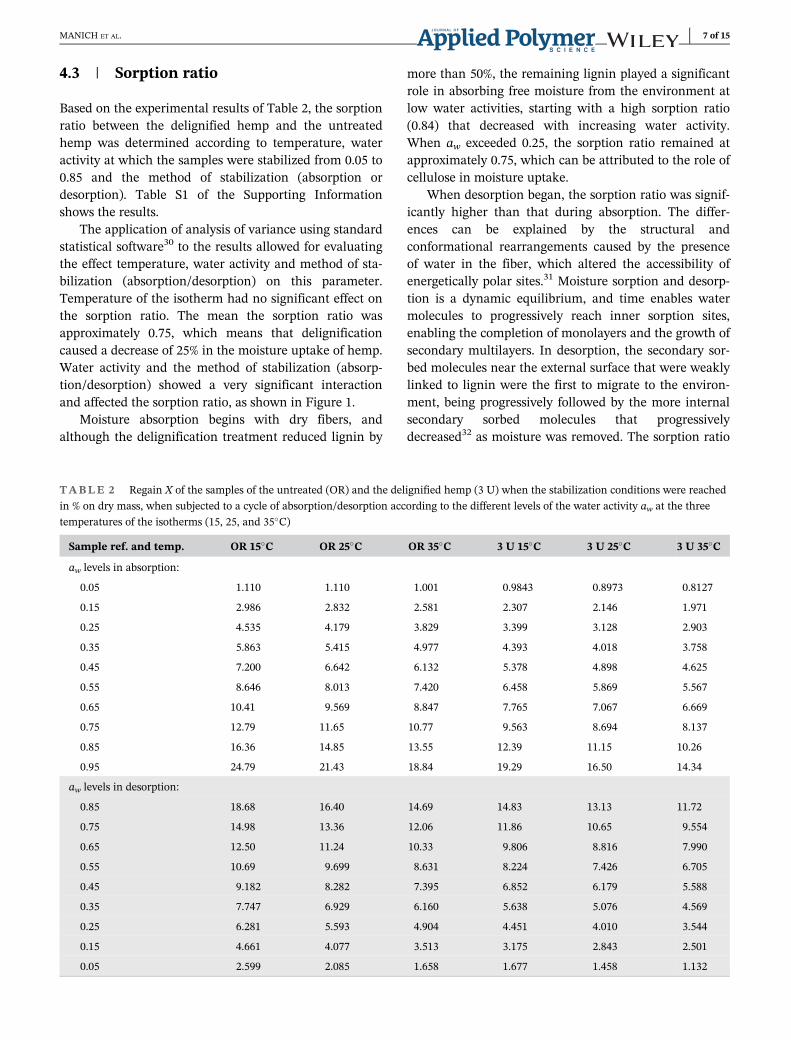
Table 2 shows the results of ''regain'' X (% in bone-dryweight) reached at the end of each stage of absorption from0.05 to 0.95 water activity and from 0.85 to 0.05 water activ-ity during desorption for the raw hemp (OR) and alkalinedelignified hemp (3 U), respectively, in the isotherms at thethree different temperatures (15, 25, and 35�C).
TABLE 1 Summary of BET, GAB, Dent, and Hailwood-
Horrobin isotherms of absorption/desorption and parameters
Model Mathematical equation
BET29
GAB27
Dent24
H-H22
X = Xm C aw/[(1-aw)(1-aw + C aw)]X = Xm C K aw/[(1- K aw)(1- K aw + C K aw)]X = Xm b0 aw/[(1- b aw) (1- b aw + b0 aw)]X = (1800/M) [K1 K aw/(1 - K1 K aw) + K aw/(1 - K aw)]
Parameter Definition
Variable :awResponse :XPrimaryabsorption:
Xm
MCb0K1
Secondaryabsorption:
Kb
Water activity expressed as relative moisturepressure or molar fraction.
Moisture uptake of the sample measured asregain (g of water / 100 g of bone-drysample).
Size of the monolayer as g of bonded water /100 g of dry sample.
Molecular mass of the monohydrated sample(g mol�1)
Monolayer energy constant of the GAB model(*).
Monolayer energy constant of the Dentmodel.
Monolayer energy constant of the Hailwood-Horrobin model.
These constants are related to the differencebetween the free enthalpy of water in theliquid state and in the monolayer. They areproportional to the relationship between therates of absorption and desorption of watermolecules at the monolayer.
(*) C = γ�exp[(Hm-Hn)/(R�T)] (Equation 1)Multilayer energy constant of GAB (**) andHailwood-Horrobin models.
Multilayer energy constant of the Dent model.The constants are related to the relationshipbetween the absorption and desorption ofwater molecules at the multilayer. Theseconstants coincide with the equilibriumconstant between the external water vapormolecules and those absorbed in themultilayer.
(**) K = δ�exp[(Hp-Hn)/(R�T)] (Equation 2)
6 of 15 MANICH ET AL.
4.3 | Sorption ratio
Based on the experimental results of Table 2, the sorptionratio between the delignified hemp and the untreatedhemp was determined according to temperature, wateractivity at which the samples were stabilized from 0.05 to0.85 and the method of stabilization (absorption ordesorption). Table S1 of the Supporting Informationshows the results.
The application of analysis of variance using standardstatistical software30 to the results allowed for evaluatingthe effect temperature, water activity and method of sta-bilization (absorption/desorption) on this parameter.Temperature of the isotherm had no significant effect onthe sorption ratio. The mean the sorption ratio wasapproximately 0.75, which means that delignificationcaused a decrease of 25% in the moisture uptake of hemp.Water activity and the method of stabilization (absorp-tion/desorption) showed a very significant interactionand affected the sorption ratio, as shown in Figure 1.
Moisture absorption begins with dry fibers, andalthough the delignification treatment reduced lignin by
more than 50%, the remaining lignin played a significantrole in absorbing free moisture from the environment atlow water activities, starting with a high sorption ratio(0.84) that decreased with increasing water activity.When aw exceeded 0.25, the sorption ratio remained atapproximately 0.75, which can be attributed to the role ofcellulose in moisture uptake.
When desorption began, the sorption ratio was signif-icantly higher than that during absorption. The differ-ences can be explained by the structural andconformational rearrangements caused by the presenceof water in the fiber, which altered the accessibility ofenergetically polar sites.31 Moisture sorption and desorp-tion is a dynamic equilibrium, and time enables watermolecules to progressively reach inner sorption sites,enabling the completion of monolayers and the growth ofsecondary multilayers. In desorption, the secondary sor-bed molecules near the external surface that were weaklylinked to lignin were the first to migrate to the environ-ment, being progressively followed by the more internalsecondary sorbed molecules that progressivelydecreased32 as moisture was removed. The sorption ratio
TABLE 2 Regain X of the samples of the untreated (OR) and the delignified hemp (3 U) when the stabilization conditions were reached
in % on dry mass, when subjected to a cycle of absorption/desorption according to the different levels of the water activity aw at the three
temperatures of the isotherms (15, 25, and 35�C)
Sample ref. and temp. OR 15�C OR 25�C OR 35�C 3 U 15�C 3 U 25�C 3 U 35�C
aw levels in absorption:
0.05 1.110 1.110 1.001 0.9843 0.8973 0.8127
0.15 2.986 2.832 2.581 2.307 2.146 1.971
0.25 4.535 4.179 3.829 3.399 3.128 2.903
0.35 5.863 5.415 4.977 4.393 4.018 3.758
0.45 7.200 6.642 6.132 5.378 4.898 4.625
0.55 8.646 8.013 7.420 6.458 5.869 5.567
0.65 10.41 9.569 8.847 7.765 7.067 6.669
0.75 12.79 11.65 10.77 9.563 8.694 8.137
0.85 16.36 14.85 13.55 12.39 11.15 10.26
0.95 24.79 21.43 18.84 19.29 16.50 14.34
aw levels in desorption:
0.85 18.68 16.40 14.69 14.83 13.13 11.72
0.75 14.98 13.36 12.06 11.86 10.65 9.554
0.65 12.50 11.24 10.33 9.806 8.816 7.990
0.55 10.69 9.699 8.631 8.224 7.426 6.705
0.45 9.182 8.282 7.395 6.852 6.179 5.588
0.35 7.747 6.929 6.160 5.638 5.076 4.569
0.25 6.281 5.593 4.904 4.451 4.010 3.544
0.15 4.661 4.077 3.513 3.175 2.843 2.501
0.05 2.599 2.085 1.658 1.677 1.458 1.132
MANICH ET AL. 7 of 15

during desorption progressively decreased with thereduction in water activity. Whole means showed thatdelignification decreased the sorption ratio of hemp by75.4% (76.1% in absorption and 74.6% in desorption).
4.4 | Temperature and regain
Using the results of Table 2, linear regressions betweenregain X and temperature T at different levels of wateractivity according to the method of stabilization (absorp-tion/desorption) for the raw and delignified hemp wereconstructed by fitting the model X = A – B � T, where Ais the initial constant that predicts the regain at 0�C in %and B is the slope that estimates the thermal regain lossin %/10�C. Table S2 and Figures S1 and S2 of theSupporting Information show the strong relationshipbetween the initial constant A and the slope B accordingto the sample and the method of stabilization (absorp-tion/desorption).
The effect of delignification on the influence of tem-perature on regain can be measured by the linear regres-sion between the results yielded by delignified hemp vsraw hemp for the parameters A, the estimated regain at0�C, and B, the thermal regain loss. The results plotted inFigure 2 are the following:
1. Estimated regain at 0�C:Adelig. = �0.4094 + 0.7965 �Arawr = 0.999
2. Thermal regain loss:Bdelig. = �0.0733 + 0.8317 �Brawr = 0.996
The slopes of the linear regressions show that the 44%reduction in the lignin content decreased both the
estimated regain at 0�C and the thermal regain loss byapproximately 20% and 17%, respectively. Delignificationdecreased the influence of temperature on the moistureuptake of hemp. The Supporting Information shows inFigure S2 the closer position between the absorption anddesorption fits of the delignified sample than that of thefits of the raw hemp.
4.5 | Hysteresis
The application of the equation given in section 3.5 to theresults in Table 2 enabled determination of the hysteresisby comparing regain in desorption vs. that in absorptionfrom 0.05 to 0.85 water activity for the untreated and deli-gnified hemp at the three temperatures of the isotherms.Table S3 of the Supporting Information shows theresults.
The analysis of the results was performed by theapplication of analysis of variance to evaluate the effectof delignification on this parameter. Delignificationdecreased hysteresis at water activities lower than 0.45,while at higher values, hysteresis of the delignified hempremained above that of the untreated hemp. Hysteresiswas also greatly influenced by water activity, where thehighest hysteresis values were observed at the lowestvalues of water activity, which was related to moleculesof water directly linked to the polymer. As the wateractivity increased, hysteresis gradually decreased,reaching the lowest values at the highest water activity.The temperature of the isotherm also affected hysteresis:the greater the temperature was, the lower the hysteresis.Figure 3 shows the results according to water activity andtemperature.
Hysteresis seems to be due to hydroxyl groups takingpart in absorption and desorption, which are modified byswelling caused by water uptake, which also modified the
FIGURE 1 Mean values of sorption ratio at 15, 25, and 35�Cincluding confidence intervals at 95% between delignified and raw
hemp as a function of the water activity and the method of
stabilization (absorption/desorption) [Color figure can be viewed at
wileyonlinelibrary.com]
FIGURE 2 Plot of the linear regressions between the predicted
regain at 0�C and the thermal regain loss of delignified hemp
versus raw hemp to estimate the effect of delignification on the
influence of temperature on regain [Color figure can be viewed at
wileyonlinelibrary.com]
8 of 15 MANICH ET AL.
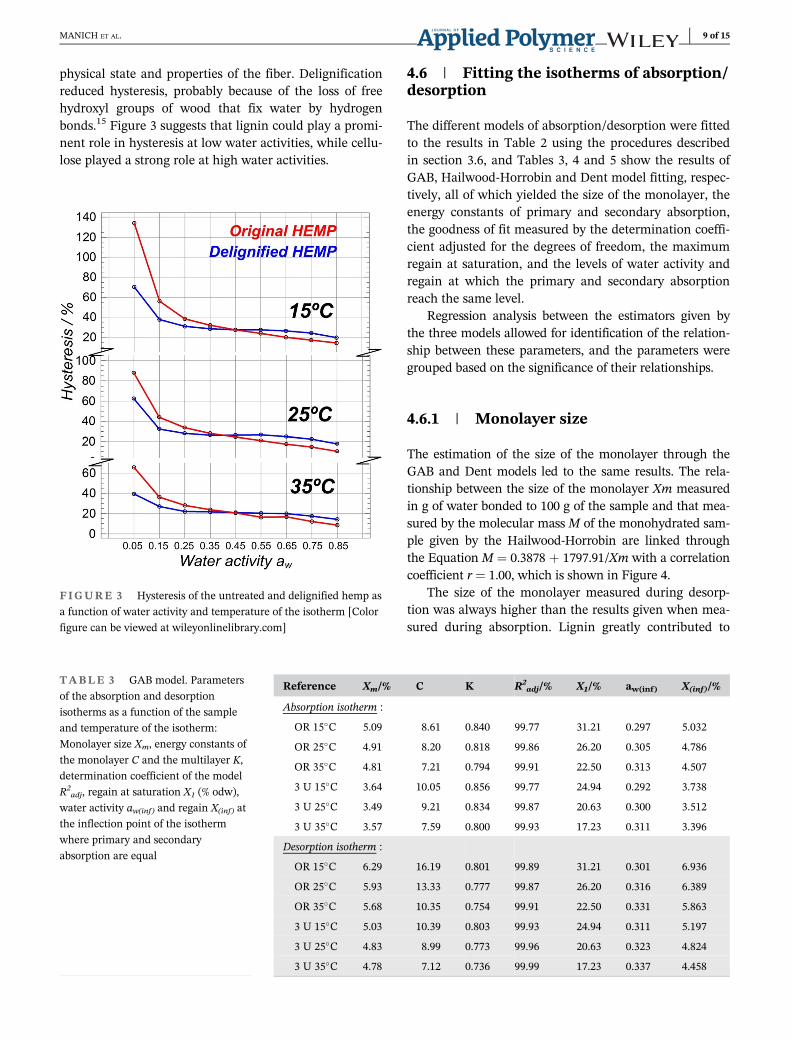
physical state and properties of the fiber. Delignificationreduced hysteresis, probably because of the loss of freehydroxyl groups of wood that fix water by hydrogenbonds.15 Figure 3 suggests that lignin could play a promi-nent role in hysteresis at low water activities, while cellu-lose played a strong role at high water activities.
4.6 | Fitting the isotherms of absorption/desorption
The different models of absorption/desorption were fittedto the results in Table 2 using the procedures describedin section 3.6, and Tables 3, 4 and 5 show the results ofGAB, Hailwood-Horrobin and Dent model fitting, respec-tively, all of which yielded the size of the monolayer, theenergy constants of primary and secondary absorption,the goodness of fit measured by the determination coeffi-cient adjusted for the degrees of freedom, the maximumregain at saturation, and the levels of water activity andregain at which the primary and secondary absorptionreach the same level.
Regression analysis between the estimators given bythe three models allowed for identification of the relation-ship between these parameters, and the parameters weregrouped based on the significance of their relationships.
4.6.1 | Monolayer size
The estimation of the size of the monolayer through theGAB and Dent models led to the same results. The rela-tionship between the size of the monolayer Xm measuredin g of water bonded to 100 g of the sample and that mea-sured by the molecular mass M of the monohydrated sam-ple given by the Hailwood-Horrobin are linked throughthe Equation M = 0.3878 + 1797.91/Xm with a correlationcoefficient r = 1.00, which is shown in Figure 4.
The size of the monolayer measured during desorp-tion was always higher than the results given when mea-sured during absorption. Lignin greatly contributed to
FIGURE 3 Hysteresis of the untreated and delignified hemp as
a function of water activity and temperature of the isotherm [Color
figure can be viewed at wileyonlinelibrary.com]
TABLE 3 GAB model. Parameters
of the absorption and desorption
isotherms as a function of the sample
and temperature of the isotherm:
Monolayer size Xm, energy constants of
the monolayer C and the multilayer K,
determination coefficient of the model
R2adj, regain at saturation X1 (% odw),
water activity aw(inf) and regain X(inf) at
the inflection point of the isotherm
where primary and secondary
absorption are equal
Reference Xm/% C K R2adj/% X1/% aw(inf) X(inf)/%
Absorption isotherm :
OR 15�C 5.09 8.61 0.840 99.77 31.21 0.297 5.032
OR 25�C 4.91 8.20 0.818 99.86 26.20 0.305 4.786
OR 35�C 4.81 7.21 0.794 99.91 22.50 0.313 4.507
3 U 15�C 3.64 10.05 0.856 99.77 24.94 0.292 3.738
3 U 25�C 3.49 9.21 0.834 99.87 20.63 0.300 3.512
3 U 35�C 3.57 7.59 0.800 99.93 17.23 0.311 3.396
Desorption isotherm :
OR 15�C 6.29 16.19 0.801 99.89 31.21 0.301 6.936
OR 25�C 5.93 13.33 0.777 99.87 26.20 0.316 6.389
OR 35�C 5.68 10.35 0.754 99.91 22.50 0.331 5.863
3 U 15�C 5.03 10.39 0.803 99.93 24.94 0.311 5.197
3 U 25�C 4.83 8.99 0.773 99.96 20.63 0.323 4.824
3 U 35�C 4.78 7.12 0.736 99.99 17.23 0.337 4.458
MANICH ET AL. 9 of 15

the increase in the size of the monolayer. The greater thetemperature was, the smaller the size of the monolayer,although the delignified sample exhibited the smallestmonolayer size during absorption, the smallest size wasthat given by the sample measured at 25�C. The lowestvalues were those measured on delignified samples dur-ing absorption, and the greatest values were measured onthe untreated samples during desorption. Intermediateresults were given by both the delignified samples duringdesorption and the untreated samples during absorption,showing that the lower the temperature was, the greaterthe monolayer size.
4.6.2 | Energy constants of themonolayer
The energy constants of the monolayer for the threemodels were highly related. The relationship betweenthem, shown in Figure 5 are the following:
1. GAB C and Hailwood-Horrobin K1:K1 = C –1(r = 1.00)
2. GAB C and Dent b0:b0 = 0.04 + 0.8 C(r = 0.99)3. Hailwood-Horrobin K1 and Dent b0:b0 = 0.83
+ 0.8 K1(r = 0.99)
TABLE 4 Hailwood-Horrobin
model. Parameters of the absorption
and desorption isotherms as a function
of the sample and the temperature of
the isotherm: Molecular mass of the
monohydrated sample (g mol�1) M,
equilibrium constant of the primary K1
and the secondary K absorption, regain
at saturation X1 (% odw), determination
coefficient of the model R2adj, water
activity aw(p = s) and regain X(p = s)
levels where both the primary and the
secondary absorption are equal
Reference M/g mol�1 K1 K X1/% R2adj/% aw(p = s) X(p = s)/%
Absorption isotherm :
OR 15�C 353.3 7.61 0.840 31.21 99.77 0.517 7.822
OR 25�C 366.6 7.20 0.818 26.20 99.86 0.527 7.427
OR 35�C 374.3 6.21 0.794 22.50 99.91 0.529 6.949
3 U 15�C 493.7 9.05 0.856 24.94 99.77 0.519 5.841
3 U 25�C 515.9 8.21 0.834 20.63 99.87 0.526 5.463
3 U 35�C 504.7 6.59 0.800 17.23 99.93 0.530 5.254
Desorption isotherm :
OR 15�C 286.3 15.19 0.801 31.21 99.89 0.583 11.023
OR 25�C 303.5 12.32 0.777 26.20 99.87 0.591 10.081
OR 35�C 317.0 9.35 0.754 22.50 99.91 0.592 9.161
3 U 15�C 358.0 9.39 0.803 24.94 99.93 0.557 8.121
3 U 25�C 372.7 7.99 0.773 20.63 99.96 0.566 7.510
3 U 35�C 376.4 6.12 0.736 17.23 99.99 0.569 6.878
TABLE 5 Dent model. Parameters
of the absorption and desorption
isotherms as a function of the sample
and the temperature of the isotherm:
Monolayer size Xm, energy constants of
the monolayer b0 and the multilayer b,
regain at saturation X1 (% odw),
determination coefficient of the model
R2adj, water activity aw(p = s) and regain
X(p = s) levels where both the primary
and the secondary absorption are equal
Reference Xm/% b0 b X1/% R2adj/% aw(p = s) X(p = s)/%
Absorption isotherm :
OR 15�C 5.09 7.23 0.840 31.21 99.77 0.595 9.129
OR 25�C 4.81 6.70 0.818 25.67 99.86 0.612 8.578
OR 35�C 4.81 5.72 0.794 22.50 99.91 0.630 8.446
3 U 15�C 3.65 8.60 0.856 24.94 99.77 0.584 6.632
3 U 25�C 3.49 7.68 0.834 20.63 99.87 0.599 6.295
3 U 35�C 3.57 6.07 0.800 17.23 99.93 0.625 6.303
Desorption isotherm :
OR 15�C 6.29 12.96 0.801 31.21 99.89 0.624 11.845
OR 25�C 5.93 10.36 0.777 25.67 99.87 0.643 11.034
OR 35�C 5.68 7.81 0.754 22.50 99.91 0.663 10.354
3 U 15�C 5.03 8.34 0.803 24.94 99.93 0.623 9.174
3 U 25�C 4.83 6.95 0.773 20.63 99.96 0.647 8.692
3 U 35�C 4.78 5.24 0.736 17.23 99.99 0.680 8.386
10 of 15 MANICH ET AL.

Lignin causes great differences between absorptionand desorption when the energy constant of themonolayer was measured, while temperature madethese constants decrease. The delignification greatlyreduced differences between absorption and desorp-tion, with the effect of temperature being strongerthan that of the measuring process on lowering theenergy constant of the monolayer. The range of varia-tion in the monolayer constants was greatly reducedby delignification. The energy constants in the absorp-tion of the delignified fiber were higher than those ofthe original fibers, while the opposite occurs indesorption.
4.6.3 | Energy constant of the multilayerand regain at saturation
The energy constants of the multilayer were identical forthe three models, showing a greater range in variation indelignified samples than in the untreated samples. Theabsorption results were higher than those during desorp-tion and decreased with increasing temperature, beingthe highest and the lowest in delignified samples mea-sured during absorption at 15�C (0.856) and desorption at35�C (0.736), respectively.
Delignification caused a decrease in regain at satura-tion of approximately 5.7%, which was also affected bytemperature. The highest regain at saturation wasobserved for the original sample at 15�C (31.21%), whilethe lowest regain value was observed in the delignifiedsample measured at 35�C (17.23%).
4.6.4 | Water activities at which primaryand secondary moisture uptake valuesare equal
Water activity at which primary and secondary moistureuptake values are equal depends on the model used: thelowest values were those given by the GAB modelbecause its estimation was based on the inflection pointof the isotherm. Greater results were given by theHailwood-Horrobin model, and the highest results werethose of the Dent model. The estimations of these twolast models depend on the way they separate primaryand secondary moisture uptakes, resulting in differentlevels of water activity at which both primary and sec-ondary moisture uptake were equal.
A very strong relationship between these wateractivities and the energy constant of the multilayer(secondary sorption) was observed, so the greater theconstant was, the lower the water activity at whichprimary uptake was equal with the secondary uptake.The greater the multilayer energy constant K was, thelower the level at which primary sorption was equal tosecondary sorption.
Figure S3 shows these results according to the differ-ent models as a function of the energy constant of themultilayer. The supporting information also includesthe equations relating the energy constant of the multi-layer and the water activity at which primary and second-ary sorption are equal according to the models.
FIGURE 4 Relationship between two methods estimating the
size of the monolayer: That of GAB or Dent models measured as g
of water linked to 100 g of dry sample and that of the Hailwood-
Horrobin model as the molecular mass of the monohydrated
sample in g mol�1 according to the sample, measuring process and
temperature [Color figure can be viewed at wileyonlinelibrary.com]
FIGURE 5 Relationship between the GAB monolayer constant
C and those of the Hailwood-Horrobin (K1) and Dent (b0) models
[Color figure can be viewed at wileyonlinelibrary.com]
MANICH ET AL. 11 of 15
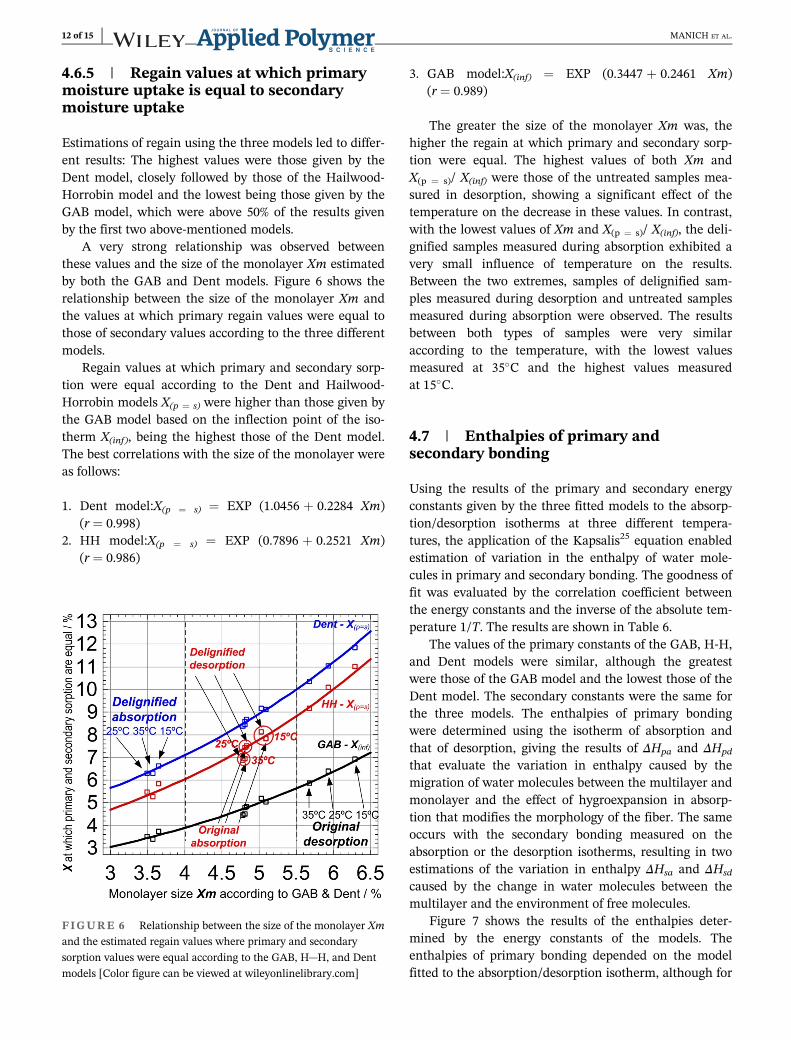
4.6.5 | Regain values at which primarymoisture uptake is equal to secondarymoisture uptake
Estimations of regain using the three models led to differ-ent results: The highest values were those given by theDent model, closely followed by those of the Hailwood-Horrobin model and the lowest being those given by theGAB model, which were above 50% of the results givenby the first two above-mentioned models.
A very strong relationship was observed betweenthese values and the size of the monolayer Xm estimatedby both the GAB and Dent models. Figure 6 shows therelationship between the size of the monolayer Xm andthe values at which primary regain values were equal tothose of secondary values according to the three differentmodels.
Regain values at which primary and secondary sorp-tion were equal according to the Dent and Hailwood-Horrobin models X(p = s) were higher than those given bythe GAB model based on the inflection point of the iso-therm X(inf), being the highest those of the Dent model.The best correlations with the size of the monolayer wereas follows:
1. Dent model:X(p = s) = EXP (1.0456 + 0.2284 Xm)(r = 0.998)
2. HH model:X(p = s) = EXP (0.7896 + 0.2521 Xm)(r = 0.986)
3. GAB model:X(inf) = EXP (0.3447 + 0.2461 Xm)(r = 0.989)
The greater the size of the monolayer Xm was, thehigher the regain at which primary and secondary sorp-tion were equal. The highest values of both Xm andX(p = s)/ X(inf) were those of the untreated samples mea-sured in desorption, showing a significant effect of thetemperature on the decrease in these values. In contrast,with the lowest values of Xm and X(p = s)/ X(inf), the deli-gnified samples measured during absorption exhibited avery small influence of temperature on the results.Between the two extremes, samples of delignified sam-ples measured during desorption and untreated samplesmeasured during absorption were observed. The resultsbetween both types of samples were very similaraccording to the temperature, with the lowest valuesmeasured at 35�C and the highest values measuredat 15�C.
4.7 | Enthalpies of primary andsecondary bonding
Using the results of the primary and secondary energyconstants given by the three fitted models to the absorp-tion/desorption isotherms at three different tempera-tures, the application of the Kapsalis25 equation enabledestimation of variation in the enthalpy of water mole-cules in primary and secondary bonding. The goodness offit was evaluated by the correlation coefficient betweenthe energy constants and the inverse of the absolute tem-perature 1/T. The results are shown in Table 6.
The values of the primary constants of the GAB, H-H,and Dent models were similar, although the greatestwere those of the GAB model and the lowest those of theDent model. The secondary constants were the same forthe three models. The enthalpies of primary bondingwere determined using the isotherm of absorption andthat of desorption, giving the results of ΔHpa and ΔHpd
that evaluate the variation in enthalpy caused by themigration of water molecules between the multilayer andmonolayer and the effect of hygroexpansion in absorp-tion that modifies the morphology of the fiber. The sameoccurs with the secondary bonding measured on theabsorption or the desorption isotherms, resulting in twoestimations of the variation in enthalpy ΔHsa and ΔHsd
caused by the change in water molecules between themultilayer and the environment of free molecules.
Figure 7 shows the results of the enthalpies deter-mined by the energy constants of the models. Theenthalpies of primary bonding depended on the modelfitted to the absorption/desorption isotherm, although for
FIGURE 6 Relationship between the size of the monolayer Xm
and the estimated regain values where primary and secondary
sorption values were equal according to the GAB, H H, and Dent
models [Color figure can be viewed at wileyonlinelibrary.com]
12 of 15 MANICH ET AL.
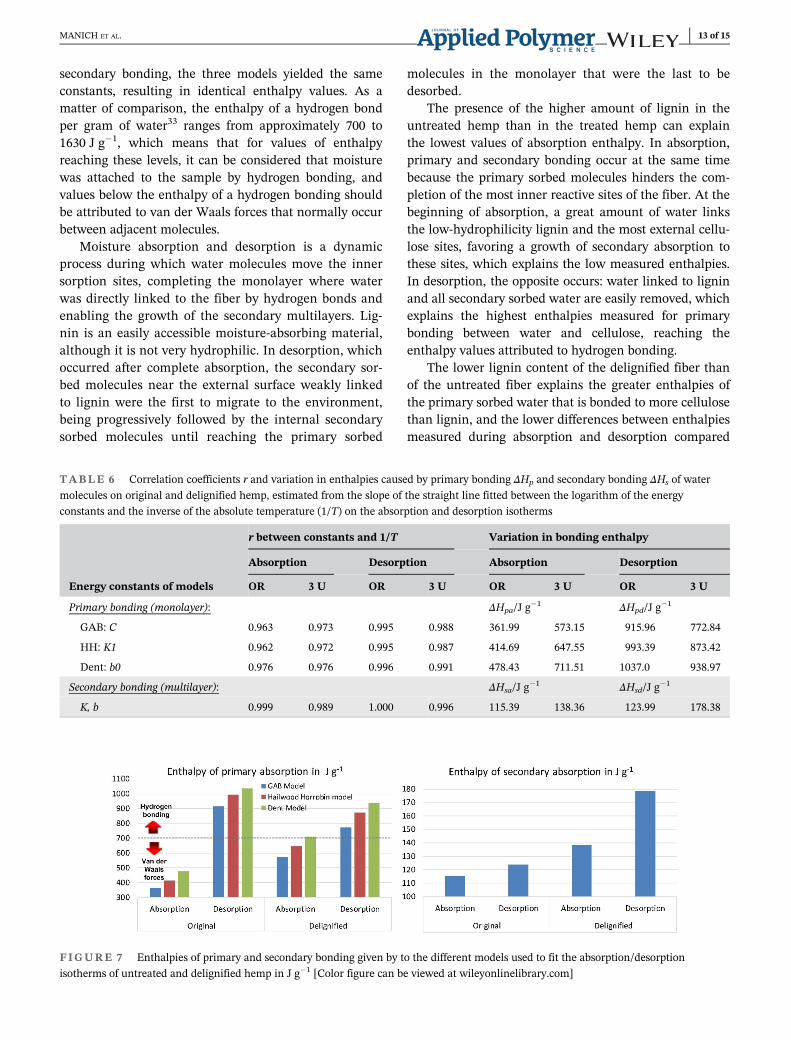
secondary bonding, the three models yielded the sameconstants, resulting in identical enthalpy values. As amatter of comparison, the enthalpy of a hydrogen bondper gram of water33 ranges from approximately 700 to1630 J g�1, which means that for values of enthalpyreaching these levels, it can be considered that moisturewas attached to the sample by hydrogen bonding, andvalues below the enthalpy of a hydrogen bonding shouldbe attributed to van der Waals forces that normally occurbetween adjacent molecules.
Moisture absorption and desorption is a dynamicprocess during which water molecules move the innersorption sites, completing the monolayer where waterwas directly linked to the fiber by hydrogen bonds andenabling the growth of the secondary multilayers. Lig-nin is an easily accessible moisture-absorbing material,although it is not very hydrophilic. In desorption, whichoccurred after complete absorption, the secondary sor-bed molecules near the external surface weakly linkedto lignin were the first to migrate to the environment,being progressively followed by the internal secondarysorbed molecules until reaching the primary sorbed
molecules in the monolayer that were the last to bedesorbed.
The presence of the higher amount of lignin in theuntreated hemp than in the treated hemp can explainthe lowest values of absorption enthalpy. In absorption,primary and secondary bonding occur at the same timebecause the primary sorbed molecules hinders the com-pletion of the most inner reactive sites of the fiber. At thebeginning of absorption, a great amount of water linksthe low-hydrophilicity lignin and the most external cellu-lose sites, favoring a growth of secondary absorption tothese sites, which explains the low measured enthalpies.In desorption, the opposite occurs: water linked to ligninand all secondary sorbed water are easily removed, whichexplains the highest enthalpies measured for primarybonding between water and cellulose, reaching theenthalpy values attributed to hydrogen bonding.
The lower lignin content of the delignified fiber thanof the untreated fiber explains the greater enthalpies ofthe primary sorbed water that is bonded to more cellulosethan lignin, and the lower differences between enthalpiesmeasured during absorption and desorption compared
TABLE 6 Correlation coefficients r and variation in enthalpies caused by primary bonding ΔHp and secondary bonding ΔHs of water
molecules on original and delignified hemp, estimated from the slope of the straight line fitted between the logarithm of the energy
constants and the inverse of the absolute temperature (1/T) on the absorption and desorption isotherms
Energy constants of models
r between constants and 1/T Variation in bonding enthalpy
Absorption Desorption Absorption Desorption
OR 3 U OR 3 U OR 3 U OR 3 U
Primary bonding (monolayer): ΔHpa/J g�1 ΔHpd/J g
�1
GAB: C 0.963 0.973 0.995 0.988 361.99 573.15 915.96 772.84
HH: K1 0.962 0.972 0.995 0.987 414.69 647.55 993.39 873.42
Dent: b0 0.976 0.976 0.996 0.991 478.43 711.51 1037.0 938.97
Secondary bonding (multilayer): ΔHsa/J g�1 ΔHsd/J g
�1
K, b 0.999 0.989 1.000 0.996 115.39 138.36 123.99 178.38
FIGURE 7 Enthalpies of primary and secondary bonding given by to the different models used to fit the absorption/desorption
isotherms of untreated and delignified hemp in J g�1 [Color figure can be viewed at wileyonlinelibrary.com]
MANICH ET AL. 13 of 15
with those measured in the untreated samples can be eas-ily explained by the dynamics of the process, whichrequires time for completion.
The enthalpies of secondary absorption were muchlower than those of primary absorption. The untreatedsamples with a greater amount of lignin showed the low-est enthalpies, and differences between absorption anddesorption can be explained by the effect of swellingand time needed to complete multilayer formation.
Considering primary and secondary bonding, estima-tions in desorption showed higher correlation coefficientswith energy constants than those in absorption and seemedto be more easily explained in desorption considering therelative amount of lignin and cellulose in the samples.
5 | CONCLUSIONS
Processing the results given by the absorption/desorptionisotherms made at 15, 25, and 35�C of alkaline delignifiedand untreated hemp fibers led to the following conclusions:
1. Delignification reduced the sorption ratio of hemp,although lignin plays a determinant role at low wateractivities, cellulose determined sorption behavior athigh water activities.
2. A model was developed that enables the estimation ofboth the absorption/desorption isotherms at 0�C andthe loss of regain caused by temperature. Deli-gnification lowered the effect of temperature on mois-ture uptake.
3. Hysteresis decreased with increasing water activity. Atlow water activities, related to molecules of waterdirectly linked to the polymer, the hysteresis of deli-gnified hemp was lower than that of the untreatedhemp, while at higher values, the opposite occurred.The greater the temperature was, the lower thehysteresis.
4. Regarding the parameters given by the models fittedto the absorption/desorption isotherms,a. The size of the monolayer measured during
desorption was always higher than that measuredduring absorption. Lignin greatly contributed tothe growth of the size of the monolayer, while tem-perature negatively affects the size.
b. The energy constants of the monolayer differedaccording to the model used. The energy constantvalues of delignified fiber measured during absorp-tion were higher than those of the untreated fiber,while the opposite occurred during desorption.Lignin caused great differences between absorptionand desorption, while the greater the temperaturewas, the lower the monolayer energy constant.
c. The energy constants of the multilayer were identi-cal for the three models, showing a greater rangeof variation in delignified samples than in theuntreated samples. The absorption results werehigher than those of desorption and decreased withincreasing temperature.
d. The water activity at which primary moistureuptake was equal with secondary moisture uptakedecreased with the increase in energy constant ofthe multilayer; thus, the greater the constant was,the lower the water activity at which primarymoisture uptake was equal to secondary one.
e. The level of regain at which primary moistureuptake was equal to secondary moisture uptake,was strongly related to the size of the monolayer.
5. The higher amount of lignin in the untreated hempthan in the delignified hemp explains the lowestvalues of sorption enthalpy. Differences in the estima-tion of sorption enthalpy between absorption anddesorption were explained by the role of low-hydrophilicity lignin and the most external cellulosesites during absorption, which made primary absorp-tion difficult while facilitating the removal of second-ary water in desorption, resulting in higher values ofenthalpy of bonding between water and cellulose,reaching enthalpies attributed to hydrogen bonding.
6. The enthalpies of secondary absorption were muchlower than those of primary absorption. The untreatedsample with a greater amount of lignin showed thelowest enthalpies, and differences between absorptionand desorption could be explained by the effect ofswelling and the time needed to complete multilayerformation.
7. Considering primary and secondary bonding, estima-tions during desorption showed higher correlationcoefficients with the energy constants and seemed tobe more easily explained considering the relativeamount of lignin and cellulose in the samples.
ACKOWLEDGEMENTS
The authors gratefully acknowledge the financial supportfor this research from the Ministry of Science and Inno-vation of Spain through the MAT2016-79352-R Project,the contribution of ''Masias Maquinaria'' for the cardingof hemp fibers and that of Mrs. Mercedes Sim�o for theirsupport in the experimental work.
ORCIDAlbert M. Manich https://orcid.org/0000-0002-9835-2850Manuel J. Lis https://orcid.org/0000-0002-2026-085X
14 of 15 MANICH ET AL.

Sonia Perez-Rentero https://orcid.org/0000-0002-7732-4543Ines Algaba https://orcid.org/0000-0002-1962-6359Meritxell Marti https://orcid.org/0000-0001-9681-6466Diana Cayuela https://orcid.org/0000-0002-1048-8340
REFERENCES[1] The Editors of Encyclopaedia Britannica. Hemp. Encyclopae-
dia Britannica, (Accessed: 1st December 2019) 2016[2] M. R. L. Horne, in Handbook of Natural Fibres, Vol. 1 (Ed: R.
Kozłowski), Woodhead Publishing Limited, Oxford, UK 2012,p. 620.
[3] M. A. ElSohly, M. M. Radwan, W. Gul, S. Chandra, A. Galal,in Phytocannabinoids: Unraveling the Complex Chemistry andPharmacology of Cannabis sativa (Eds: A. D. Kinghorn, H.Falk, S. Gibbons, J. Kobayashi), Springer International Pub-lishing, Switzerland 2017, p. 1.
[4] V. Angelova, R. Ivanova, V. Delibaltova, K. Ivanov, Ind. CropsProd 2004, 19, 197. https://doi.org/10.1016/j.indcrop.2003.10.001.
[5] L. Grabowska, P. Baraniecki, Three year results on utilizationsoil polluted by copperproducing industry in Proc. of the Flaxand Other Bast Plants Symp. Natural Fibres, Spec. Ed. INF,Pozna�n 123–131, 1997
[6] W. Grzebisz, B. Chudzinski, J. B. Diatta, P. Barlog, Nat Fibres1997, 111.
[7] B. M. Pejic, M. M. Kostic, P. D. Skundric, J. Z. Praskalo, Bio-resour. Technol. 2008, 99, 7152.
[8] W. Cierpucha, R. Kozłowski, J. Ma�nkowski, J. Wa�sko, T.Ma�nkowski, Fibres Text. East. Eur. 2004, 12, 13.
[9] D. Cayuela, M. Riba-Moliner, M. Rafael, G. Mijas, M. J. Lis,A. M. Manich, Control de la eliminaci�on de la lignina en lostratamientos de algodonizaci�on del c�añamo in Calorimetry andThermal Analysis in Current Chemistry Symposia, XXXVIIReuni�on Bienal de la RSEQ, Donostia, 2019.
[10] Proc.2002 2nd International NETECOFLAX workshop (Eds.A. M. Manich, M. H. Ussman ) Updating the ''Cottonized'' FlaxProcessing ISBN-972-9209-93-6, University of Beira Interior,Covilh~a, Portugal 2002.
[11] N. Stevulova, J. Cigasova, A. Estokova, E. Terpakova, A.Geffert, F. Kacík, E. Singovszka, M. Holub, Materials 2014, 7,8131.
[12] M. S. Islam, K. L. Pickering, N. J. Foreman, J. Polym. Environ.2010, 18, 696.
[13] D. Nilsson, B. Svennerstedt, C. Wretfors, Biosyst. Eng. 2005, 91, 35.[14] M. Kostic, B. Pejic, P. Skundric, Bioresour. Technol. 2008, 99, 94.[15] X. Guo, Y. Qing, Y. Q. Wu, Q. L. Wu, Int. J. Biol. Macromol.
2016, 83, 117.
[16] T. Yang, E. Ma, J. Cao, Holzforschung 2018, 72, 943.[17] R. Meredith, The Mechanical Properties of Textiles Fibres,
North-Holland Publishing Co., Amsterdam 1956, p. 34.[18] J. G. Weigerink, J. Res. Natl. Bur. Stand 1940, 24, 645.[19] S. Okubayashi, U. J. Griesser, T. Bechtold, Carbohydr. Polym.
2004, 58, 293.[20] E. O. Timmermann, Colloids Surf., A 2003, 220, 235.[21] C. Simon, L. G. Esteban, P. Palacios, F. G. Fern�andez, A.
García-Iruela, R. Martín-Sampedro, M. E. Eugenio, Wood Sci.Technol. 2017, 51, 517.
[22] C. A. S. Hill, A. Norton, G. Newman, J. Appl. Polym. Sci. 2009,112, 1524.
[23] S. Furmaniak, A. P. Terzyk, R. Gołembiewski, P. A. Gauden,L. Czepirski, Food Res. Int. 2009, 42, 1203.
[24] R. W. Dent, Text. Res. J. 1977, 47, 145.[25] J. G. Kapsalis, in Water Activity: Theory and Applications to
Food (Eds: L. B. Rockland, L. R. Beuchat), Marcel Dekker,Inc., New York 1987, p. 205.
[26] R. Mead, R. N. Curnow, A. M. Hasted, Statistical Methods inAgricultural and Experimental Biology, Chapman & Hall/CRCPress Company, Boca Raton 2003.
[27] N. Arslan, H. To�grul, J Stored Prod Res 2006, 42, 112.[28] A. M. Manich, J. Barenys, L. Martínez, J. Lloria, J. Carilla, A.
Marsal, J. Am. Leather Chem. Assoc. 2017, 112, 10.[29] S. Brunauer, E. Emmett, E. Teller, J. Am. Chem. Soc. 1938,
60, 309.[30] Statgraphics Plus 5; Manugistics, Inc. 2115 East Jefferson St.,
Rockville, Maryland 20852 USA 2000[31] D. R. Heldman, C. W. Hall, T. I. Hedrick, J. Dairy Sci. 1965,
48, 845.[32] A. M. Manich, F. Maldonado, J. Carilla, M. Catalina, A.
Marsal, J. Am. Leather Chem. Assoc. 2010, 105, 229.[33] J. A. Babor, J. Ibarz, Química General Moderna, Editorial
Marín, Barcelona, Spain 1977.
SUPPORTING INFORMATIONAdditional supporting information may be found onlinein the Supporting Information section at the end of thisarticle.
How to cite this article: A. M. Manich, M. J. Lis,S. Perez-Rentero, I. Algaba, M. Marti, D. Cayuela,J Appl Polym Sci 2021, e50990. https://doi.org/10.1002/app.50990
MANICH ET AL. 15 of 15