inferring contagion patterns in social contact networks using a
TRANSCRIPT

Inferring Contagion Patterns in Social Contact NetworksUsing a Maximum Likelihood Approach
Lauren M. Gardner1; David Fajardo2; and S. Travis Waller3
Abstract: The spread of infectious disease is an inherently stochastic process. As such, real-time control and prediction methods present asignificant challenge. For diseases that spread through direct human interaction, the contagion process can be modeled on a social contactnetwork where individuals are represented as nodes, and contact between individuals is represented as links. The objective of the modeldescribed in this paper is to infer the most likely path of infection through a contact network for an ongoing outbreak. The problem isformulated as a linear integer program. Specific properties of the problem are exploited to develop a much more efficient solution methodthan solving the linear program directly. The model output can provide insight into future epidemic outbreak patterns and aid in the develop-ment of intervention strategies. The model is evaluated for a combination of network structures and sizes, as well as various disease propertiesand potential human error in assessing these properties. The model performance varies based on these parameters, but it is shown to performbest for heterogeneous networks, which are consistent with many real world systems. DOI: 10.1061/(ASCE)NH.1527-6996.0000135.© 2014 American Society of Civil Engineers.
Author keywords: Network optimization; Contagion models; Social contact networks.
Introduction
Many factors contribute to the spread and control of disease withina region, such as the standard of living, infection prevention prac-tices (e.g., vaccination), local programs (e.g., health, emergencyresponse), and, also critically significant, the interaction patternsamong individuals. Today, a large proportion of the populationlives in increasingly dense conditions, an ideal environment forrapid disease transmission. The stochastic nature of the contagionprocess (i.e., contact between an infectious and susceptible personmay or may not result in a new infection) makes it difficult to iden-tify the path of infection or predict the impact that a new diseasemight have on a region.
Over the last 100 years, significant research efforts have focusedon predicting the expected spreading behavior of contact-based in-fectious diseases, exploiting characteristics of the population andthe disease itself. However, there have been limited research effortsfocusing on the use of future social network data: whereas currentsocial network models are abstract constructs where people areanonymously represented, it is not unreasonable to expect develop-ments in data collection (through Facebook, Twitter, Foursquare,etc.) that will allow accurate mappings between known individuals.Furthermore, spatial analysis of transport and communication net-works that exploits these data sources is a growing area of research(Candia et al. 2008; Gastner and Newman 2006; Schintler et al.
2007; Erath et al. 2009; Wang et al. 2009; González et al. 2006,2008) and has recently been expanded to include social networkmodeling, specifically, the ability to reproduce spatial structureand interaction between individuals for large-scale social networks(Illenberger et al. 2013). The ongoing development of activity-based travel models, which examine why, where, and when variousactivities are engaged in by individuals (Lam and Huang 2003;Roorda et al. 2009; Ramadurai and Ukkusuri 2010; Illenberger et al.2013), as well as innovations in pedestrian modeling (Hoogendoornand Bovy 2005) present additional promising alternatives to gen-erate social-contact networks in the future. Of significant interest isthe public transit system, which represents a potential catalyst in thedisease transmission process within metropolitan regions. Advan-ces in public transit modeling can now provide detailed contact pat-terns, including temporal patterns (e.g., bus travel time), and spatialpatterns (a function of the vehicle size and passenger volume)(Nassir et al. 2012; Pendyala et al. 2012). Although these methodswill potentially allow accurate mappings among known individ-uals, they do not provide a means to use the data for tracking dis-ease transmission. As such, it is critical to develop methods that canexploit these data as they become available.
The objective of the model proposed in this work is to infer thespatiotemporal path of infection through a social contact networkfor an ongoing outbreak scenario. This work specifically considerscontact-based diseases, which refer to the family of infectious dis-eases that are transmitted from an infected to susceptible individualthrough direct contact. This category includes sexually transmitteddiseases, various strands of the flu, SARS, and the common cold,among others. In turn, the social contact network is representativeof the social interactions (e.g., through school, work, or home)that occur among a group of individuals in a given time period(e.g., a day).
Specifically, the problem approached in this paper considers thecase in which the structure of the network is deterministicallyknown (set of nodes and links), time-of-infection data are availablefor all infected nodes, but no information is known about the in-fection tree (i.e., the set of social contacts through which the diseasespread). The problem is formulated as a linear integer program.
1School of Civil and Environmental Engineering, Univ. of New SouthWales, Sydney, NSW 2052, Australia (corresponding author). E-mail:[email protected]
2School of Civil and Environmental Engineering, Univ. of New SouthWales, Sydney, NSW 2052, Australia. E-mail: [email protected]
3Professor, School of Civil and Environmental Engineering, Univ. ofNew South Wales, Sydney, NSW 2052, Australia. E-mail: [email protected]
Note. This manuscript was submitted on November 28, 2012; approvedon December 11, 2013; published online on May 22, 2014. Discussion per-iod open until October 22, 2014; separate discussions must be submitted forindividual papers. This paper is part of the Natural Hazards Review,© ASCE, ISSN 1527-6988/04014004(10)/$25.00.
© ASCE 04014004-1 Nat. Hazards Rev.
Nat. Hazards Rev. 2014.15.
Dow
nloa
ded
from
asc
elib
rary
.org
by
UN
IVE
RSI
TY
OF
NE
W S
OU
TH
WA
LE
S on
01/
15/1
5. C
opyr
ight
ASC
E. F
or p
erso
nal u
se o
nly;
all
righ
ts r
eser
ved.

Instead of solving the integer program directly, a much more effi-cient solution method is developed that exploits properties ofthe problem. Specifically, a maximum-likelihood estimation pro-cedure is implemented on a simplified acyclic network to effi-ciently solve the problem. The proposed methodology makesuse of network-based optimization algorithms, network structure,and disease properties to determine infection paths based on time-dependent infection reports.
The novelty of the model arises from the utilization of optimi-zation methods (rather than enumeration followed by a posteriorianalysis) to infer a contagion process through a network. Themodel performance is based on how accurately it predicts the pathsof infection (which are extracted from simulation outputs). Further-more, the model’s performance is shown to vary significantly asa function of network structure and transmission probability, itbut performs best for heterogeneous networks, which are consistentwith many real world systems.
The proposed model specifically aims to1. Provide a novel method for evaluating a region that has been
exposed to infection;2. Provide insight into future epidemic outbreak behavior; and3. Aid in the evaluation and recommendation of intervention
strategies.In the application of the model evaluated in this paper, individ-
uals are modeled explicitly, and social contacts define the networkstructure. In previous work by Gardner et al. (2012), similar meth-odology was implemented to infer the most likely air travel routesresponsible for spreading the Swine Flu to unexposed geographicregions. In Gardner’s paper, social contact networks were not con-sidered, and the network structure was defined by the air trafficsystem. In addition, the proposed solution methodology can beextended to alternative contagion processes that occur atop knownnetwork structures (e.g., tracking food-borne outbreaks that propa-gate though a distribution network or computer viruses that spreadthrough a communications network). The remainder of this manu-script includes a literature review of related epidemiology models,problem definition, mathematical formulation and solution meth-odology, followed by numerical results and conclusions.
Literature Review
Dynamic contagion processes impact copious network systems andare therefore the focus of various studies within the emerging fieldof network science. In addition to the transmission of infectiousdisease through communities and biological systems (Murray2002; Anderson and May 1991), the spread of information, ideas,and opinions through social networks can also be modeled as acontagion process (Coleman et al. 1966; Hasan and Ukkusuri2013) as well as the global spread of computer viruses on theInternet (Newman et al. 2002; Balthrop et al. 2004), power gridfailures in electricity markets (Kinney et al. 2005; Sachtjen et al.2000), and the collapse of financial systems (Sornette 2003).Of interest to this study is the propagation of disease through asocial contact network, which therefore will be the focus of theliterature review.
The infection rate and pattern of the disease-spreading processthrough a network is dependent on both the parameters of thedisease (e.g., infectious period, level of contagiousness) and thefundamental structure of the network. In efforts to predict expecteddisease-spreading behavior and characteristics, epidemiologicalmodels span from extremely generalized and simplified analyticalmodels to increasingly in-depth stochastic agent-based simu-lation tools. Analytical models are used to quantify the statistical
properties of epidemic patterns (Colizza et al. 2006; Balcan et al.2009); however, they are unable to capture certain behavioral as-pects of the dynamics of disease spreading and often lack detailedinformation about the network structure. In contrast, agent-basedsimulation models can be used to replicate possible spreading sce-narios, predict average spreading behavior, and analyze various in-tervention strategies for a given network and disease whilecapturing a greater degree of detail, but in turn require a highlydetailed set of input data (Rvachev and Longini 1985; Epsteinet al. 2002; Eubank et al. 2004; Hufnagel et al. 2004; Dibbleand Feldman 2004; Cahill et al. 2005; Dunham 2005; Meyers et al.2005; Small and Tse 2005; Carley et al. 2006; Ferguson et al. 2006;Germann et al. 2006; Ekici et al. 2008; Roche et al. 2011; Haydonet al. 2003). The most recent and comprehensive models provide agreater degree of realism but are difficult to implement within theshort time frames in which real-time control decisions must bemade. Large-scale simulation models can also be computationallytaxing, because multiple runs are required to accurately predictexpected outcomes.
There currently exists a gap in the literature that calls forscenario-specific disease prediction models. Most contagion mod-els predict future potential outbreak scenarios based on system-wide information; however, they are not able to reconstruct thecontagion process of an ongoing outbreak to reveal informationabout the current state of the network. Recent advances in diseasemodeling have begun addressing this issue. For example, there aremodels that use genetic sequencing data to analytically infer thegeographic history of a given virus’s migration (Drummond andRambaut 2007; Lemey et al. 2009; Wallace et al. 2007; Cottamet al. 2008; Haydon et al. 2003). Often this approach involves firstenumerating all possible evolutionary trees, then assigning pos-terior probabilities based on specifics of the respective virus’ mu-tation rates. Additionally, the infection trees only include locationswhere samples were available. Jombart et al. (2009) proposed anovel approach to reconstruct the spatiotemporal dynamics ofoutbreaks from sequence data by inferring ancestries directlyamong strains of an outbreak using their genotype and collectiondate. The “infectious” links were selected such that the number ofmutations between nodes is minimized. The idea of using infectiondata to construct the most likely path of transmission is the high-lighted goal of this paper. The proposed approach relies instead onavailable infection reports, contact network structure, and diseaseproperties to infer the spatiotemporal path of infection through acontact network.
The set of infection-spreading links identified by the model canprovide insight into the spreading behavior of a disease because thecontact types most likely to have spread infection are revealed.The expected role that each type of contact plays in the disease-spreading process can then be quantified. The methodology canalso be used to evaluate various intervention strategies by adjustingproperties of specific link types (e.g., removing or reducing thetransmission probability of certain school links to represent aschool closure) and comparing the resultant likelihood of a givenoutbreak scenario. However, to implement this type of analysis, acritical level of detail on the network structure is required, which isjust in the initial stages of becoming available.
Problem Definition
Using infection reports, contact network structure, and diseaseproperties, the methodology described in this section makesinferences about infection-spreading patterns in a population. Theproblem assumes an underlying contagion process that can be
© ASCE 04014004-2 Nat. Hazards Rev.
Nat. Hazards Rev. 2014.15.
Dow
nloa
ded
from
asc
elib
rary
.org
by
UN
IVE
RSI
TY
OF
NE
W S
OU
TH
WA
LE
S on
01/
15/1
5. C
opyr
ight
ASC
E. F
or p
erso
nal u
se o
nly;
all
righ
ts r
eser
ved.

represented on a network by a discrete-time, stochastic process.The following terminology is used for the remainder of this paper:1. ti, time stamps: the time period at which a node was reportedly
infected, or predicted to be infected;2. pij, link transmission probability: the probability that an in-
fected node i will infect a susceptible (and adjacent) node jin a single time step; and
3. λ, infectious period: the number of time steps an infected noderemains infectious (i.e., is able to infect others) following itsown infection; λ can also represent the amount of time beforerecovery, hospitalization, or some other type of removal fromthe network.
The problem objective is defined as follows: For a given socialcontact network that has been exposed to infection [Fig. 1(a)] andknown time stamps for all infected nodes [Fig. 1(b)], the authorsseek to identify the infection pattern (i.e., a set of contact links)most likely to have produced the known (node level) infection data[Fig. 1(c)].
The network G ∈ ðV;AÞ is formally defined by a set of nodes,V, which represent a population of individuals; and links, A, whichrepresent physical daily contacts between individuals; N representsthe set of individuals that became infected during the time periodwhen population V was exposed to infection; I represents the set ofinformation nodes: a subset of the infected individuals N, whichwere identified as infected (i.e., they visited a doctor, hospital, phar-macy, etc.). The full information case is the focus of this paper, anddefined as follows: The complete set of infected nodes and the timestamp, ti, for each infected node is available, i.e., I ¼ N.
The relationship between the underlying contagion process andthe mathematical programming formulation are of specific interestin regard to the problem definition. The link-based infection pro-cess, the building block of the network-based contagion process, isintroduced first.
Link-Based Infection Process
The link-based infection process consists of a set of link trials thatare the basic building blocks of the network-level contagion pro-cess. In other words, a given infection scenario at the network levelis the result of many individual link-based trials. Each link trialconsists of the following evaluation: At a discrete time step t,assume node i is in an infectious state, node j is in a susceptible
state, and the two nodes are connected by link (i; j) with a linktransmission probability pij. A successful link trial is defined aswhen node i infects node j in time step t, and occurs with prob-ability pij. The probability a link trial is unsuccessful is therefore(1 − pij). A simulation time step t is representative of the latentperiod, or the amount of time between when an individual contractsthe disease and becomes infectious.
The timestamp of node i, ti, represents the time (e.g., day) atwhich individual i was infected. The value Δtij is the time differ-ence between when nodes i and j were infected. If timestamps areknown for two directly connected nodes, where node iwas infectedbefore node j, the probability that infection occurred between thesetwo nodes can be calculated using Eq. (1):
αij ¼ ð1 − pijÞðΔtij−1Þpij ð1Þ
The first term represents the probability of one or more “infec-tion delays,” and the second term represents the probability of asingle successful link trial. Similarly, the probability that thelink-based infection of (i; j) will never be successful is definedas γij: over Δtij consecutive link trials, all will be unsuccessful.The value of γij is given by Eq. (2):
γij ¼ ð1 − pijÞminfΔtij;λg ð2Þ
The expression is based on the assumption that node i has alimited infectious period and remains infectious for λ time units.This assumption may not be valid for certain diseases (e.g., forsome sexually transmitted diseases individuals remain infectiousindefinitely). However, there are many diseases for which theassumption of a limited infectious period is valid. It is assumed thatλ is a homogeneous parameter for all nodes.
Now, consider a link selection variable xij, which is equal to 1 iflink (i; j) is selected to be part of the infection tree, and 0 otherwise.The probability associated with including link (i; j) is equivalent tothe probability of infection having occurred between nodes i and j,and can then be expressed in terms of Eqs. (1) and (2):
πijðxijÞ ¼ ð1 − pijÞxijðΔtij−1Þpxijij γ
ð1−xijÞij ∀ ði; jÞ ∈ A ð3Þ
When xij ¼ 0, the link is not included in the infection tree andπij ¼ γij. When xij ¼ 1, the link is included in the infection tree
Fig. 1. (a) Sample contact network structure G ∈ ðV;AÞ, and link transmission probabilities, pij; (b) example of the node level information provided(after an outbreak); set of information nodes, I are solid with associated timestamps, ti; (c) example of model output (arrows) predicting the infectionpattern; the node with timestamp, t ¼ 0, is the source
© ASCE 04014004-3 Nat. Hazards Rev.
Nat. Hazards Rev. 2014.15.
Dow
nloa
ded
from
asc
elib
rary
.org
by
UN
IVE
RSI
TY
OF
NE
W S
OU
TH
WA
LE
S on
01/
15/1
5. C
opyr
ight
ASC
E. F
or p
erso
nal u
se o
nly;
all
righ
ts r
eser
ved.

and πij ¼ αij. In the next section, this result is extended to thenetwork level.
Network-Based Infection Process
This work treats the network-based infection process as an iterativeaggregation of individual link trials. The simulation model starts byinitializing all nodes to a susceptible state and randomly choosing aset of nodes to be infected (O ∈ V). Then, transmission of the dis-ease is simulated over multiple time steps, t, for a predeterminedsimulation period, T. During each time step, all links that connectinfectious nodes and susceptible nodes are identified, and infectiontrials for each such link are performed. If the link infection is suc-cessful, then the newly infected node status is changed to “infected”in the following time step. The node remains infected for λ timesteps. After a node is infected for λ time steps, its status is changedto “recovered.”Once a node is recovered, it can no long transmit thedisease or become infected again (the equivalent of gaining immun-ity or being removed from the network).
This process is representative of a discrete-time networksusceptible-infected-removed (SIR) contagion process. The SIRmodel is a well-established stochastic simulation model used inthe epidemiological literature to model the progress of an epidemicin a large population (Grassly and Fraser 2008). The simulationmodel described previously forms the basis for the mathematicalformulation and evaluation presented in the remainder of this paper.It follows that the aim of this solution methodology is to replicatethe actual infection tree for a specific outbreak scenario by exploit-ing node-level infection information and the network structure.
Assumptions
Multiple simplifying assumptions are necessary to solve the pro-posed problem. This work assumes:1. A priori knowledge of the underlying social contact net-
work, G ∈ ðV;AÞ;2. The contagion process can be approximated as discrete-time
network SIR contagion process with known transmissionprobabilities, pij;
3. An individual can be infected at most once, and thus onlythose diseases for which immunity is acquired after recoveryare considered;
4. Known timestamps ti for the full set of infected nodes, N; and5. Incubation period, λ is a homogeneous parameter.The first assumption is the most debatable of the five. Social
contact networks are difficult to characterize, as they are notdirectly observable, and are also highly unstable. However, theincrease of social networking information available online andimprovements in activity-based travel modeling both contributetowards the possibility of access to more detailed social contactinformation in the future. Potential sources and methods for gen-erating social contact networks are discussed and cited in the in-troduction. Assumption two addresses the use of the SIR model,which is used to simulate outbreak patterns in this paper, and awell-established stochastic simulation model (Grassly and Fraser2008). This simulation tool is therefore the best option to quantifythe performance of the proposed model. Quantifying the transmis-sion probability is beyond this scope of this work, but remains ahighly researched topic among epidemiologists. Various methodsexist to quantify this parameter for known diseases; therefore,the transmission probability is assumed to be available from priorclinical and epidemiological studies for the disease in question. Thethird assumption restricts the set of applications to those diseasesfor which acquiring immunity restricts an individual from being
infected more than once over the entire course of an outbreak.Assumption four is based on the premise that information is madeavailable for all infected individuals (i.e., through some type ofmedical authority hospital, private clinic, pharmacy). Althoughthe assumption of full infection data may seem limiting at thepresent time, various online global health databases and real-time reporting currently exist through organizations such as theWorld Health Organization (WHO), Centers for Disease Controland Prevention (CDC), Centers for Infectious Disease Researchand Policies (CIDRAP), and the International Society forInfectious Diseases (through ProMED), among others. These data-bases are becoming increasingly relied on for tracking outbreaks.Assumption five requires an average incubation period to be ap-plied homogenously across all individuals.
Method
In this section, the mathematical formulation and solution method-ology for the full information case are presented. First, the partialinformation case is briefly discussed, and a linear programmingformulation for the full information case is provided. The solutionmethod for the full information case is then described.
Mathematical Problem Formulation
The linear integer programming formulation and proposed solutionmethodology for the full information case follows:
maxx
fðxÞ ¼Y
∀ði;jÞ∈Að1 − pijÞxijðΔtij−1Þpxij
ij γð1−xijÞij ð4Þ
s.t.
tmaxðxij − 1Þ < tj − ti ∀ ði; jÞ ∈ A ð5Þ
tmaxð1 − xijÞ þ λ ≥ tj − ti ∀ ði; jÞ ∈ A ð6Þ
X
j∈Nxji ¼ 1 ∀ i ∈ N \O ð7Þ
xij ¼ f0; 1g ∀ ði; jÞ ∈ A ð8Þ
The decision variable is xij, which is set to 1 if link (i · j) isincluded in the infection tree and 0 otherwise. The objective[Eq. (4)] enforces that the set of links included in the final spanningtree maximizes the likelihood of the tree; the product of the indi-vidual probabilities corresponding to each link included in the tree,as defined in Eq. (3). The first two constraints enforce consistencybetween the x variable and the contagion process: if xij ¼ 1, mean-ing i is the predecessor of j in the infection tree, then Eq. (5) guar-antees that the infection time of j will be later than that of i. Eq. (6)ensures that that the infection period of j will be within the timeperiod when i is infectious, i.e., within λ time units of the infectiontime of i. The variable tmax is set equal to the largest time stamp, andrepresentative ofM in the BigM method traditionally used for solv-ing linear programming problems. Eq. (7) enforces the spanningtree structure of the solution; every known infected node, exceptthe source node, is infected exactly once (i.e., has exactly one in-coming link). Eq. (8) declares the decision variable xij to be binary.
© ASCE 04014004-4 Nat. Hazards Rev.
Nat. Hazards Rev. 2014.15.
Dow
nloa
ded
from
asc
elib
rary
.org
by
UN
IVE
RSI
TY
OF
NE
W S
OU
TH
WA
LE
S on
01/
15/1
5. C
opyr
ight
ASC
E. F
or p
erso
nal u
se o
nly;
all
righ
ts r
eser
ved.

Link Cost Transformation
The objective function [Eq. (4)] can be transformed from a productof terms to an equivalent summation of terms by maximizing thenatural logarithm of the objective function, which results in thefollowing:
maxx
X
∀ði;jÞ∈Axij½ðΔt − 1Þ lnð1 − pijÞ þ lnpij − ln γ� þ ln γij ð9Þ
The new formulation features additive terms rather than multi-plicative terms. The set of constraints remains the same with theaddition of (11) the new link cost function definition:
maxx
f 0ðxÞ ¼X
∀ði;jÞ∈AxijPij ð10Þ
s.t.
Pij ¼ ðΔtij − 1Þ lnð1 − pijÞ þ lnpij − ln γij ∀ ði; jÞ ∈ A ð11Þ
tmaxðxij − 1Þ < tj − ti ∀ ði; jÞ ∈ A ð12Þ
tmaxð1 − xijÞ þ λ ≥ tj − ti ∀ ði; jÞ ∈ A ð13Þ
X
j∈Nxji ¼ 1 ∀ i ∈ N \ O ð14Þ
xij ¼ f0; 1g ∀ ði; jÞ ∈ A ð15Þ
Solution Methodology
Eqs. (10)–(15) allows one to exploit specific properties to develop amuch more efficient solution method than solving this linear pro-gram directly. As stated previously, this work seeks the most likelyinfection-spreading pattern for the full information case. The prop-erties of the full information case result in a spanning tree thatbranches to every node i ∈ N. The general problem of finding adirected maximum branching tree can be solved using the algo-rithm developed by Edmonds (1967). The algorithm consists ofmaintaining an optimal subnetwork that reaches every node andworks towards feasibility by replacing links that form a cycle inthat subnetwork. As such, the cycle-finding subroutine of the algo-rithm is the most computationally taxing part of the algorithm.
Although Edmonds’ algorithm is relatively efficient, a signifi-cantly more efficient algorithm is developed here by exploiting theproblem properties already presented in this section. Attention isfirst focused on Eqs. (12) and (13), which allow for the efficientpruning of the set of links that must be considered as part ofthe procedure. The resulting network is acyclic, which greatly sim-plifies the maximum branching procedure.
Let the set of feasible links ði; jÞ ϵ L be such thatti < tj < ðti þ λÞ. It is trivial to show that in all feasible solutions,xkl ¼ 0 for all links (k; l) in A \L. Therefore, focus can be limited tothe link set L. Because of Eq. (12), which requires feasible links inL to connect nodes with increasing timestamps, the resulting sub-network has a topological ordering, and as such, cannot contain anydirected cycles. Eqs. (14) and (15) represent the requirement thatexactly one incoming link is chosen for every infected node. Assuch, any solution that only chooses links in L so that every nodehas exactly one incoming link will be feasible. The mathematicalprogram can be written as follows:
maxx
f 0ðxÞ ¼X
∀ði;jÞ∈SxijPij ð16Þ
s.t.
Pij ¼ ðΔt − 1Þ lnð1 − pijÞ þ lnpij − ln γij ∀ ði; jÞ ∈ L ð17ÞX
j∈Nxji ¼ 1 ∀ i ∈ N \O ð18Þ
xij ¼ f0; 1g ∀ ði; jÞ ∈ L ð19Þ
The most computationally intensive portion of Edmonds’ maxi-mum branching algorithm is the search for and removal of cycles.Because of the acyclic nature of the set L, a simplified version ofEdmonds’ algorithm can be developed that is significantly moreefficient, defined by steps 1–3:1. Define the set of feasible links, L ¼ fði; jÞ∶ti < tj < ðti þ λÞg;2. Calculate link costs, Pij for links (i; j) in feasible set L using
Eq. (17); and3. For each infected node, jϵN, select the incoming link (i; j)
with the highest cost, Pij, from the set of feasible links L,and add it to the solution tree S.
The set of selected links S forms the maximum likelihood tree.
Network Structures
The network structures evaluated in this work are intended torepresent social contact networks. Two types of networks areconstructed:1. Randomly generated: The structure of the network (number of
contacts per individual) is determined by a prespecified degreedistribution; and
2. Activity-based: The network structure is generated usingregional demographic characteristics and human activitypatterns.
For a given network, links may have homogenous transmissionprobabilities, p, or heterogeneous transmission probabilities, inwhich case, each link is assigned a transmission probability, pij.This transmission probability can be a dependent on the type ofinteraction between the two individuals i and j, (e.g., school, work,social). The actual transmission probability values are dependenton the specific characteristics of the disease in question and arenot the focus of this study. Therefore, the values selected for theanalysis are not specific to any particular virus, and a analysis isconducted to evaluate the sensitivity of the model performanceto changes in these parameters.
Urban Network
The urban network generated is representative of a social contactnetwork for a community of individuals that interact on a daily ba-sis though activities such as school and work. In the future, thisinformation could be made available by activity-based travel mod-els or online social network data. However, the sample networkanalyzed in this paper was created using a synthetic data set con-sistent with the demographic characteristics of Travis County,Texas, taken from the 2008 U.S. Census Bureau (2008).
The urban network has multiple link types, dependent on thetype of trip-based contact (e.g., school, work, social) and corre-sponding heterogeneous link properties (activity-based transmis-sion probabilities). For example, a node (representing child A)might have two school links (connecting child A to child Band child C) representing contacts at school, and a social link
© ASCE 04014004-5 Nat. Hazards Rev.
Nat. Hazards Rev. 2014.15.
Dow
nloa
ded
from
asc
elib
rary
.org
by
UN
IVE
RSI
TY
OF
NE
W S
OU
TH
WA
LE
S on
01/
15/1
5. C
opyr
ight
ASC
E. F
or p
erso
nal u
se o
nly;
all
righ
ts r
eser
ved.
representing contact with a neighbor they interact with after school.A social link and school link can have different link transmissionprobabilities. The network structure is defined by the set of nodesand the complete set of link types. For a set number of nodes thenumber of links in the network will vary as a function of the level ofconnectivity specified when generating the network. To generatethe network, the following steps were taken:1. Randomly assign an age to each node selected from a given
age distribution;2. Assign all individuals to households either of size 1, 2, 3, or 4;3. Assign all children (individuals under 18) to a school;4. Assign all adults (individuals 18-65) to a place of work;5. Create link connections:
a. Connect all individuals who share a household with prob-ability 1 (if two individuals share a home link, then theydon’t share any other links);
b. Connect all children at the same school to each other witha probability 0.2;
c. Connect all adults assigned to the same work office withprobability 0.1;
d. Create random shopping links between any two nodeswith probability 0.01;
e. Create random social connections between any two nodeswith probability 0.005; and
6. Assign link probabilities pðÞ, dependent on link type.The generated network has 250 nodes and 979 links. The trans-
mission probabilities pðÞ and link connectivity probabilities usedfor the base case are listed in Table 1. The urban network createdis a relatively homogenous network structure; the majority of nodeshave degree values close to the network average. The network de-gree distribution is most similar to a Poisson distribution, with anaverage degree approaching nine. To contrast this type of networkstructure, the model performance is compared with various powerlaw network structures.
The probabilities used to connect this network and the corre-sponding transmission probabilities are not representative of anyspecific virus. Because the networks presented here are intendedto evaluate the proposed methodology, region-specific structuralinaccuracies are not yet of vital importance. That being said, devel-oping accurate input data remains a valuable future research prob-lem, specifically (1) calibrated transmission probabilities based onhistorical outbreak data, and (2) social contact networks extractedfrom activity-based travel models.
Power Law Networks
Power law networks are the most common structures used to re-present social contact networks, which warrants their inclusion
in this analysis (González et al. 2008). Power law networks havea degree distribution fðxÞ ¼ axk. In this analysis, the exponentparameter k is in the range [1, 3]. The higher exponent k corre-sponds to a more heterogeneous degree distribution. As k ap-proaches one, the network structure begins to display moreuniform degree characteristics. In addition, the number of links in-creases significantly as k decreases, for the same number of nodes.This is because (for the same number of nodes) there are more no-des with a higher number of connections. The networks are gen-erated according to the method developed by Viger and Latapy(2005). For the power law networks generated, the transmissionprobabilities are assumed to be homogeneous and are analyzedacross a range of values, (0, 1).
Measure of Performance
The proposed methodology is likely to perform differentlydepending on the network structure and properties of the disease.Therefore, sensitivity analysis was conducted to compare the per-formance across various combinations of network structures(urban, power law), network sizes (in terms of number of nodes),and disease parameters (transmission probabilities). Although thesolution method itself does not require the use of a microscopiclevel stochastic simulation model for implementation, a simulationmodel capable of replicating the progress of an epidemic in a largepopulation was used in to evaluate the performance of the proposedmethodology. The model performance is measured by comparingthe set of links identified in the simulation-based scenario, K(e.g., the actual set of infection spreading links), with those iden-tified by the model, S. The following steps were used to evaluatethe performance of this solution methodology:
For a given network structure, G ∈ ðV;AÞ, with known linktransmission probabilities, pij.1. Set the infectious period λ and time period, T;2. Randomly introduce an infected individual into the net-
work, O;3. Simulate an infection spreading scenario for the time peri-
od, T;4. Extract the Full set of links in the infection tree, K from the
simulation to use for evaluating the solution methodology;5. Extract the following information from the simulation to use as
(required) input for the solution methodology:a. Full set of infected nodes, N;b. Timestamps for each infected node, ti∀i ∈ N;
6. Implement the solution algorithm (steps 1–3 presented inthe solution methodology section) on the extracted net-work G ∈ ðN;LÞ;
7. Compute the percentage of correctly predicted links, q, for thesimulated contagion scenario:a. Identify the set of linksM ∈ K, whereM is the set of links
in the output tree S;b. q ¼ jMj=jKj, that is the percentage of infection links
correctly identified by the model; and8. Repeat steps (1)–(7) X times and average q (step 7.b) over all
iterations.The preceding outlined procedure returns the expected perfor-
mance of the solution methodology, Q, which is how accurately Srepresents the actual spreading scenario on average, for a given net-work. For both network structures, Q is based on X ¼ 1,000 iter-ations. This analysis is performed for various combinations ofnetwork structures, sizes, and disease parameters. The results arepresented in the following section.
Table 1. Urban Network Parameters for Base Case
Parameter Value
Number of links 979Probabilities used to create random network links
Work 0.1Shopping 0.01Social 0.005School 0.2
Probabilities of transmission used in simulationHome 0.2Work 0.1Shopping 0.05Social 0.1School 0.1
© ASCE 04014004-6 Nat. Hazards Rev.
Nat. Hazards Rev. 2014.15.
Dow
nloa
ded
from
asc
elib
rary
.org
by
UN
IVE
RSI
TY
OF
NE
W S
OU
TH
WA
LE
S on
01/
15/1
5. C
opyr
ight
ASC
E. F
or p
erso
nal u
se o
nly;
all
righ
ts r
eser
ved.

Numerical Results and Analysis
The expected performance of the solution methodology, Q isillustrated in Figs. 2 and 3 for the following network structures,respectively:1. Urban network2. Power law networkThe urban network used in this analysis has 250 nodes, 979
links, and the original transmission probabilities as defined inTable 1, varying between [05, 0.2]. The power law network alsohas 250 nodes, although with fewer links because of the heaviertailed distribution (relative to the Poisson-characterized urban net-work). The power law network used in this analysis has 379 links,the exponent k is 3, and the transmission probability is set at a con-stant value (p ¼ 0.5) for all links
In the figures, each series represents Q for a constant infectiousperiod, λ. The results illustrate a decrease in expected performance,Q, as the simulation time, T increases. The value of Q also de-creases as the infectious period, λ, increases for a constant simu-lation period, T. These are intuitive results because of the stochasticnature of the contagion process, for which the feasible solution setincreases with higher infectious periods and simulation times.
The same general behavior is observed for both the urban andpower law network structures, although Q performs better for thepower law network—remaining above 85% for all cases analyzed,and above 90% for T < 9. In the urban network, Q remains above80% for T < 7, but falls to 60% for higher (λ;T) combinations. Thedifference in performance among the networks can be partiallyattributed to the network structures, specifically the high averageconnectivity in the urban network relative to the power law net-work. Power law networks have a hub and spoke structure, with
a small percentage of highly connected nodes (known as superspreaders), with the majority of nodes having a very low degree(one or two). In the case where the initially infected node is selectedrandomly, a super spreader node in a power law network structurehas a low probability of being selected. In addition, the remainingless-connected nodes have limited opportunity to spread infection,therefore the disease is less likely to spread to a significant portionof the population. In more homogenous network structures, such asPoisson networks, most nodes have close to the average degree,resulting in a more connected network. In a more connectednetwork a higher number of infections are likely to occur. The chal-lenge in predicting the set of infection spreading links (the objectiveof this study) is that a given set of infected nodes (specific to a givencontagion scenario) may correspond to multiple feasible (link-level) infection patterns. Furthermore, for the same number of in-fected nodes, a more connected network structure will have morefeasible infection spreading patterns, thus the likelihood of identi-fying the actual infection tree is reduced. This reasoning explainswhy the model performs better for the power law network com-pared with the more homogenous urban network structure whichhas an average degree distribution around 8. The same reasoningexplains the improved performance under shorter infectious periodsand shorter simulation times, for which the number of feasible in-fection trees is minimized.
Sensitivity to Transmission Probability
As previously discussed, accurately quantifying the transmissionprobability for a given disease is beyond the scope of this work.However sensitivity analysis was conducted for urban and powerlaw network structures for varying transmission probabilities toexplore the model performance for different potential diseases.In the analysis the infectious period and simulation time were keptconstant at λ ¼ 3 and T ¼ 10, respectively.
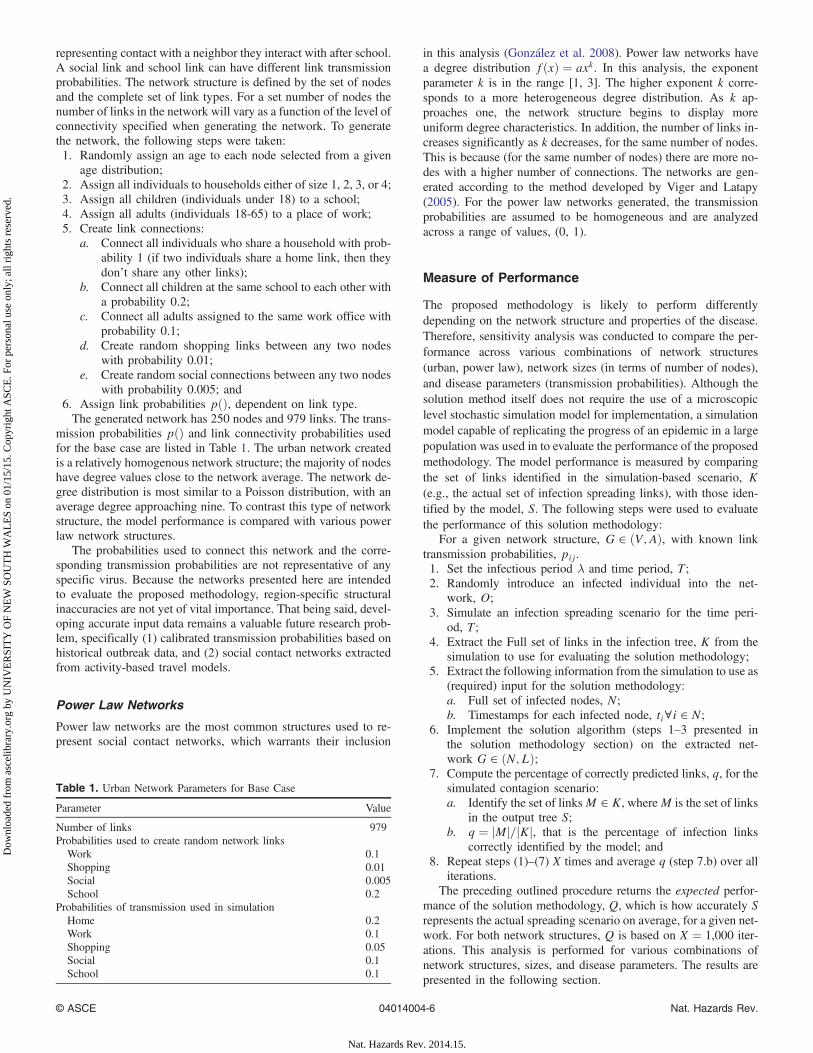
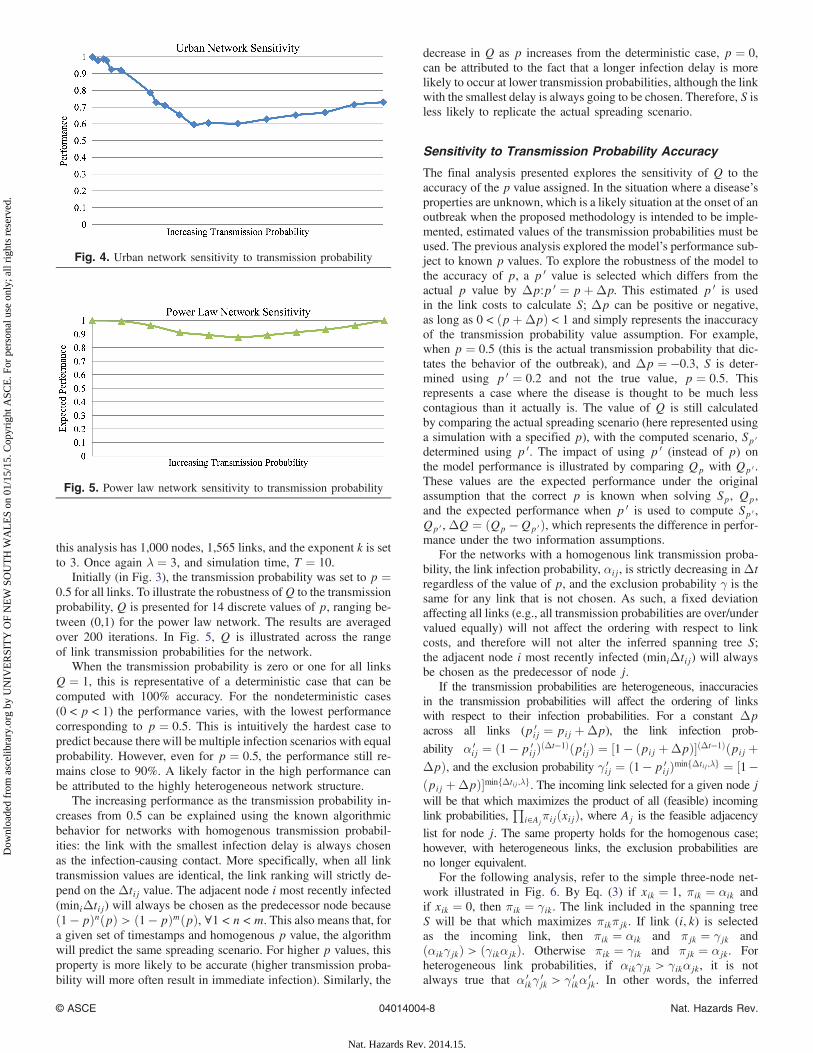
In Fig. 4, Q is illustrated for the urban network subject tovarying transmission levels (which increase along the x-axis).The original transmission probabilities are inflated and deflatedby a constant factor, thus remaining proportional to the originalactivity-specific values. The maximum inflation factor is five, atwhich point some of the links take on a transmission probabilityvalue of one. The maximum deflation is 0.01, which results inmany pij values close to zero. These inflation and deflation factorsare chosen such that (0 < pij < 1). The results are again averagedover 1,000 iterations.
If all the transmission probabilities were zero or one, then theexact scenario would be predicted for S because the infection pro-cess would actually be a deterministic process, (with the exceptionof arbitrarily broken ties, when two different nodes could haveresulted in the infection of a third). However, because the transmis-sion probabilities vary across the links, this scenario is not possibleto replicate for the urban network. However, the figure shows Qperforms very well for extremely low transmission probabilities(when the transmission probabilities are deflated to near zero)due to the decreased level of uncertainty associated with theinfection process. Under this condition, the infection process isnearly deterministic. The lower performance when the transmissionprobabilities are midrange is a function of the extreme variationin transmission probability values across links, which range from.05 to 1, and the increased level of uncertainty in the contagionprocess.
In Fig. 5 a similar analysis is presented for a power law network,specifically exploring the robustness of Q to varying levels oftransmission probability. The power law network generated for
Fig. 2. Expected performance, Q, for urban network
Fig. 3. Expected performance, Q, for power law network
© ASCE 04014004-7 Nat. Hazards Rev.
Nat. Hazards Rev. 2014.15.
Dow
nloa
ded
from
asc
elib
rary
.org
by
UN
IVE
RSI
TY
OF
NE
W S
OU
TH
WA
LE
S on
01/
15/1
5. C
opyr
ight
ASC
E. F
or p
erso
nal u
se o
nly;
all
righ
ts r
eser
ved.
this analysis has 1,000 nodes, 1,565 links, and the exponent k is setto 3. Once again λ ¼ 3, and simulation time, T ¼ 10.
Initially (in Fig. 3), the transmission probability was set to p ¼0.5 for all links. To illustrate the robustness ofQ to the transmissionprobability, Q is presented for 14 discrete values of p, ranging be-tween (0,1) for the power law network. The results are averagedover 200 iterations. In Fig. 5, Q is illustrated across the rangeof link transmission probabilities for the network.
When the transmission probability is zero or one for all linksQ ¼ 1, this is representative of a deterministic case that can becomputed with 100% accuracy. For the nondeterministic cases(0 < p < 1) the performance varies, with the lowest performancecorresponding to p ¼ 0.5. This is intuitively the hardest case topredict because there will be multiple infection scenarios with equalprobability. However, even for p ¼ 0.5, the performance still re-mains close to 90%. A likely factor in the high performance canbe attributed to the highly heterogeneous network structure.
The increasing performance as the transmission probability in-creases from 0.5 can be explained using the known algorithmicbehavior for networks with homogenous transmission probabil-ities: the link with the smallest infection delay is always chosenas the infection-causing contact. More specifically, when all linktransmission values are identical, the link ranking will strictly de-pend on the Δtij value. The adjacent node i most recently infected(miniΔtij) will always be chosen as the predecessor node becauseð1 − pÞnðpÞ > ð1 − pÞmðpÞ, ∀1 < n < m. This also means that, fora given set of timestamps and homogenous p value, the algorithmwill predict the same spreading scenario. For higher p values, thisproperty is more likely to be accurate (higher transmission proba-bility will more often result in immediate infection). Similarly, the
decrease in Q as p increases from the deterministic case, p ¼ 0,can be attributed to the fact that a longer infection delay is morelikely to occur at lower transmission probabilities, although the linkwith the smallest delay is always going to be chosen. Therefore, S isless likely to replicate the actual spreading scenario.
Sensitivity to Transmission Probability Accuracy
The final analysis presented explores the sensitivity of Q to theaccuracy of the p value assigned. In the situation where a disease’sproperties are unknown, which is a likely situation at the onset of anoutbreak when the proposed methodology is intended to be imple-mented, estimated values of the transmission probabilities must beused. The previous analysis explored the model’s performance sub-ject to known p values. To explore the robustness of the model tothe accuracy of p, a p 0 value is selected which differs from theactual p value by Δp∶p 0 ¼ pþΔp. This estimated p 0 is usedin the link costs to calculate S; Δp can be positive or negative,as long as 0 < ðpþΔpÞ < 1 and simply represents the inaccuracyof the transmission probability value assumption. For example,when p ¼ 0.5 (this is the actual transmission probability that dic-tates the behavior of the outbreak), and Δp ¼ −0.3, S is deter-mined using p 0 ¼ 0.2 and not the true value, p ¼ 0.5. Thisrepresents a case where the disease is thought to be much lesscontagious than it actually is. The value of Q is still calculatedby comparing the actual spreading scenario (here represented usinga simulation with a specified p), with the computed scenario, Sp 0
determined using p 0. The impact of using p 0 (instead of p) onthe model performance is illustrated by comparing Qp with Qp 0 .These values are the expected performance under the originalassumption that the correct p is known when solving Sp, Qp,and the expected performance when p 0 is used to compute Sp 0 ,Qp 0 , ΔQ ¼ ðQp −Qp 0 Þ, which represents the difference in perfor-mance under the two information assumptions.
For the networks with a homogenous link transmission proba-bility, the link infection probability, αij, is strictly decreasing in Δtregardless of the value of p, and the exclusion probability γ is thesame for any link that is not chosen. As such, a fixed deviationaffecting all links (e.g., all transmission probabilities are over/undervalued equally) will not affect the ordering with respect to linkcosts, and therefore will not alter the inferred spanning tree S;the adjacent node i most recently infected (miniΔtij) will alwaysbe chosen as the predecessor of node j.
If the transmission probabilities are heterogeneous, inaccuraciesin the transmission probabilities will affect the ordering of linkswith respect to their infection probabilities. For a constant Δpacross all links (p 0
ij ¼ pij þΔp), the link infection prob-
ability α 0ij ¼ ð1 − p 0
ijÞðΔt−1Þðp 0ijÞ ¼ ½1 − ðpij þΔpÞ�ðΔt−1Þðpij þ
ΔpÞ, and the exclusion probability γ 0ij ¼ ð1 − p 0
ijÞminfΔtij;λg ¼ ½1−ðpij þΔpÞ�minfΔtij;λg. The incoming link selected for a given node jwill be that which maximizes the product of all (feasible) incominglink probabilities,
Qi∈Aj
πijðxijÞ, where Aj is the feasible adjacencylist for node j. The same property holds for the homogenous case;however, with heterogeneous links, the exclusion probabilities areno longer equivalent.
For the following analysis, refer to the simple three-node net-work illustrated in Fig. 6. By Eq. (3) if xik ¼ 1, πik ¼ αik andif xik ¼ 0, then πik ¼ γik. The link included in the spanning treeS will be that which maximizes πikπjk. If link (i; k) is selectedas the incoming link, then πik ¼ αik and πjk ¼ γjk andðαikγjkÞ > ðγikαjkÞ. Otherwise πik ¼ γik and πjk ¼ αjk. Forheterogeneous link probabilities, if αikγjk > γikαjk, it is notalways true that α 0
ikγ0jk > γ 0
ikα0jk. In other words, the inferred
Fig. 4. Urban network sensitivity to transmission probability
Fig. 5. Power law network sensitivity to transmission probability
© ASCE 04014004-8 Nat. Hazards Rev.
Nat. Hazards Rev. 2014.15.
Dow
nloa
ded
from
asc
elib
rary
.org
by
UN
IVE
RSI
TY
OF
NE
W S
OU
TH
WA
LE
S on
01/
15/1
5. C
opyr
ight
ASC
E. F
or p
erso
nal u
se o
nly;
all
righ
ts r
eser
ved.
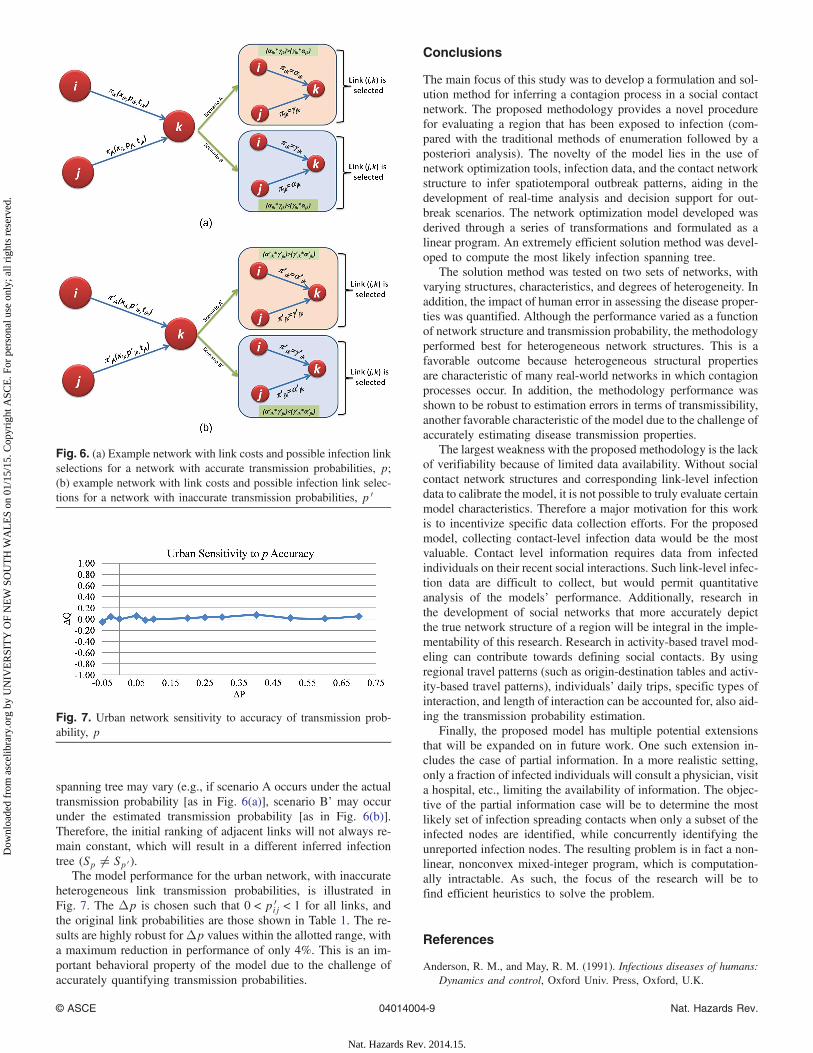
spanning tree may vary (e.g., if scenario A occurs under the actualtransmission probability [as in Fig. 6(a)], scenario B’ may occurunder the estimated transmission probability [as in Fig. 6(b)].Therefore, the initial ranking of adjacent links will not always re-main constant, which will result in a different inferred infectiontree (Sp ≠ Sp 0 ).
The model performance for the urban network, with inaccurateheterogeneous link transmission probabilities, is illustrated inFig. 7. The Δp is chosen such that 0 < p 0
ij < 1 for all links, andthe original link probabilities are those shown in Table 1. The re-sults are highly robust forΔp values within the allotted range, witha maximum reduction in performance of only 4%. This is an im-portant behavioral property of the model due to the challenge ofaccurately quantifying transmission probabilities.
Conclusions
The main focus of this study was to develop a formulation and sol-ution method for inferring a contagion process in a social contactnetwork. The proposed methodology provides a novel procedurefor evaluating a region that has been exposed to infection (com-pared with the traditional methods of enumeration followed by aposteriori analysis). The novelty of the model lies in the use ofnetwork optimization tools, infection data, and the contact networkstructure to infer spatiotemporal outbreak patterns, aiding in thedevelopment of real-time analysis and decision support for out-break scenarios. The network optimization model developed wasderived through a series of transformations and formulated as alinear program. An extremely efficient solution method was devel-oped to compute the most likely infection spanning tree.
The solution method was tested on two sets of networks, withvarying structures, characteristics, and degrees of heterogeneity. Inaddition, the impact of human error in assessing the disease proper-ties was quantified. Although the performance varied as a functionof network structure and transmission probability, the methodologyperformed best for heterogeneous network structures. This is afavorable outcome because heterogeneous structural propertiesare characteristic of many real-world networks in which contagionprocesses occur. In addition, the methodology performance wasshown to be robust to estimation errors in terms of transmissibility,another favorable characteristic of the model due to the challenge ofaccurately estimating disease transmission properties.
The largest weakness with the proposed methodology is the lackof verifiability because of limited data availability. Without socialcontact network structures and corresponding link-level infectiondata to calibrate the model, it is not possible to truly evaluate certainmodel characteristics. Therefore a major motivation for this workis to incentivize specific data collection efforts. For the proposedmodel, collecting contact-level infection data would be the mostvaluable. Contact level information requires data from infectedindividuals on their recent social interactions. Such link-level infec-tion data are difficult to collect, but would permit quantitativeanalysis of the models’ performance. Additionally, research inthe development of social networks that more accurately depictthe true network structure of a region will be integral in the imple-mentability of this research. Research in activity-based travel mod-eling can contribute towards defining social contacts. By usingregional travel patterns (such as origin-destination tables and activ-ity-based travel patterns), individuals’ daily trips, specific types ofinteraction, and length of interaction can be accounted for, also aid-ing the transmission probability estimation.
Finally, the proposed model has multiple potential extensionsthat will be expanded on in future work. One such extension in-cludes the case of partial information. In a more realistic setting,only a fraction of infected individuals will consult a physician, visita hospital, etc., limiting the availability of information. The objec-tive of the partial information case will be to determine the mostlikely set of infection spreading contacts when only a subset of theinfected nodes are identified, while concurrently identifying theunreported infection nodes. The resulting problem is in fact a non-linear, nonconvex mixed-integer program, which is computation-ally intractable. As such, the focus of the research will be tofind efficient heuristics to solve the problem.
References
Anderson, R. M., and May, R. M. (1991). Infectious diseases of humans:Dynamics and control, Oxford Univ. Press, Oxford, U.K.
Fig. 6. (a) Example network with link costs and possible infection linkselections for a network with accurate transmission probabilities, p;(b) example network with link costs and possible infection link selec-tions for a network with inaccurate transmission probabilities, p 0
Fig. 7. Urban network sensitivity to accuracy of transmission prob-ability, p
© ASCE 04014004-9 Nat. Hazards Rev.
Nat. Hazards Rev. 2014.15.
Dow
nloa
ded
from
asc
elib
rary
.org
by
UN
IVE
RSI
TY
OF
NE
W S
OU
TH
WA
LE
S on
01/
15/1
5. C
opyr
ight
ASC
E. F
or p
erso
nal u
se o
nly;
all
righ
ts r
eser
ved.

Balcan, D., et al. (2009). “Multiscale mobility networks and the spatialspreading of infectious diseases.” Proc. Natl. Acad. Sci., 106(51),21484–21489.
Balthrop, J., Forrest, S., Newman, M. E. J., and Williamson, M. M. (2004).“Technological networks and the spread of computer viruses.” Science,304(5670), 527–529.
Cahill, E., Crandall, R., Rude, L., and Sullivan, A. (2005). “Space-timeinfluenza model with demographic, mobility, and vaccine parameters.”Proc., 5th Annual Hawaii Int. Conf. Math., Statist., and Related Fields.
Candia, J., González, M. C., Wang, P., Schoenharl, T., Madey, G., andBarabási, A. L. (2008). “Uncovering individual and collective humandynamics from mobile phone records.” J. Phys. A: Math. Theor.,41(22), 224015.
Carley, K. M., et al. (2006). “BioWar: Scalable agent-based model of bio-attacks.” IEEE Trans. Syst. Man Cybern. Part A Syst. Humans, 36(2),252–265.
Coleman, J., Menzel, H., and Katz, E. (1966). Medical innovations: A dif-fusion study, Bobbs Merrill, New York.
Colizza, V., Barrat, A., Barthélemy, M., and Vespignani, A. (2006). “Themodeling of global epidemics: Stochastic dynamics and predictability.”Bull. Math. Biol., 68(8), 1893–1921.
Cottam, E. M., et al. (2008). “Integrating genetic and epidemiological datato determine transmission pathways of foot-and-mouth disease virus.”Proc. R. Soc. B, 275(1637), 887–895.
Dibble, C., and Feldman, P. G. (2004). “The geograph 3D computationallaboratory: Network and terrain landscapes for repast.” J. Artif. Soc.Social Simul., 7(1).
Drummond, A. J., and Rambaut, A. (2007). “Beast: Bayesian evolutionaryanalysis by sampling trees.” BMC Evol. Biol., 7(1), 214.
Dunham, J. B. (2005). “An agent-based spatially explicit epidemiologicalmodel in MASON.” J. Artif. Soc. Social Simul., 9(1).
Edmonds, J. (1967). “Optimum branchings.” J. Res. Natl. Bur. Stand.,71B(4), 233–240.
Ekici, A., Keskinocak, P., and Swann, J. L. (2008). “Pandemic influenzaresponse.” Simulation Conf., 2008 WSC, 1592–1600.
Epstein, J., et al. (2002). Toward a containment strategy for smallpoxbioterror: An individual-based computational approach, BrookingsInstitute Press, 55.
Erath, A., Löchl, M., and Axhausen, K. (2009). “Graph-theoretical analysisof the Swiss road and railway networks over time.” Networks Spat.Econ., 9(3), 379–400.
Eubank, S., et al. (2004). “Modeling disease outbreaks in realistic urbansocial networks.” Nature, 429(6988), 180–184.
Ferguson, N. M., Cummings, D. A. T., Fraser, C., Cajka, J. C., Cooley, P.C., and Burke, D. S. (2006). “Strategies for mitigating an influenzapandemic.” Nature, 442(7101), 448–452.
Gardner, Lauren M., Fajardo, D., and Waller, S. T. (2012). “Inferring in-fection spreading links in an air traffic network.” Transportation Re-search Record 2300, Transportation Research Board, Washington,DC, 13–21.
Gastner, M. T., and Newman, M. E. J. (2006). “The spatial structure ofnetworks.” Eur. Phys. J. B, 49(2), 247–252.
Germann, T. C., Kadau, K., Longini, I. M., and Macken, C. A. (2006).“Mitigation strategies for pandemic influenza in the United States.”Proc. Natl. Acad. Sci., 103(15), 5935–5940.
González, M. C., Hidalgo, C. A., and Barabási, A.-L. (2008). “Understand-ing individual human mobility patterns.” Nature, 453, 479–482.
González, M. C., Lind, P. G., and Herrmann, H. J. (2006). “System of mo-bile agents to model social networks.” Phys. Rev. Lett., 96(8), 088702.
Grassly, N. C., and Fraser, C. (2008). “Mathematical models of infectiousdisease transmission.” Nat. Rev. Microbiol., 6(6), 477–487.
Hasan, S., and Ukkusuri, S. (2013). “Social contagion process in informalwarning networks to understand evacuation timing behavior.” J. PublicHealth Manage. Pract., 19, S68–S69.
Haydon, D. T., et al. (2003). “The construction and analysis of epidemictrees with reference to the 2001 UK foot-and-mouth outbreak.” Proc. R.Soc. B, 270(1511), 121–127.
Hoogendoorn, S. P., and Bovy, P. H. L. (2005). “Pedestrian travel behaviormodeling.” Networks Spatial Econ., 5(2), 193–216.
Hufnagel, L., Brockmann, D., and Geisel, T. (2004). “Forecast and controlof epidemics in a globalized world.” Proc. Natl. Acad. Sci., 101(42),15124–15129.
Illenberger, J., Nagel, K., and Flötteröd, G. (2013). “The role of spatialinteraction in social networks.” Networks Spat. Econ., 13(3), 255–282.
Jombart, T., Eggo, R. M., Dodd, P., and Balloux, F. (2009). “Spatiotem-poral dynamics in the early stages of the 2009 A/H1N1 influenza pan-demic.” PLoS Curr. Influenza.
Kinney, R., Crucitti, P., Albert, R., and Latora, V. (2005). “Modelingcascading failures in the North American power grid.” Eur. Phys. J. B,46(1), 101–107.
Lam, W. H. K., and Huang, H. (2003). “Combined activity/travel choicemodels: Time-dependent and dynamic versions.” Networks Spat. Econ.,3(3), 323–347.
Lemey, P., Suchard, M., and Rambaut, A. (2009). “Reconstructing theinitial global spread of a human influenza pandemic: A Bayesianspatial-temporal model for the global spread of H1N1pdm.” PLoS Curr.Influenza.
Meyers, L., Pourbohloul, B., Newman, M. E. J., Skowronski, D., andBrunham, R. (2005). “Network theory and SARS: Predicting outbreakdiversity.” J. Theor. Biol., 232(1), 71–81.
Murray, J. D. (2002). Mathematical biology, 3rd Ed., Springer, New York.Nassir, N., Khani, A., Hickman, M., and Noh, H. (2012). “An intermodal
optimal multi-destination tour algorithm with dynamic travel times.”Transportation Research Record 2283, Transportation Research Board,Washington, DC, 57–66.
Newman, M. E. J., Forrest, S., and Balthrop, J. (2002). “Email networksand the spread of computer viruses.” Phys. Rev. E, 66(3), 035101.
Pendyala, R., et al. (2012). “Integrated land use-transport model systemwith dynamic time-dependent activity-travel microsimulation.” Trans-portation Research Record 2203, Transportation Research Board,Washington, DC, 19–27.
Ramadurai, G., and Ukkusuri, S. (2010). “Dynamic user equilibrium modelfor combined activity-travel choices using activity-travel supernetworkrepresentation.” Networks Spat. Econ., 10(2), 273–292.
Roche, B., Drake, J., and Rohani, P. (2011). “An agent-based model tostudy the epidemiological and evolutionary dynamics of Influenzaviruses.” BMC Bioinf., 12(87), 87.
Roorda, M. J., Carrasco, J. A., and Miller, E. J. (2009). “An integratedmodel of vehicle transactions, activity scheduling and mode choice.”Transp. Res. Part B, 43(2), 217–229.
Rvachev, L., and Longini, I. (1985). “A mathematical model for the globalspread of influenza.” Math. Biosci., 75(1), 3–22.
Sachtjen, M. L., Carreras, B. A., and Lynch, V. E. (2000). “Disturbances ina power transmission system.” Phys. Rev. E, 61(5), 4877–4882.
Schintler, L., Kulkarni, R., Gorman, S., and Stough, R. (2007). “Usingraster-based GIS and graph theory to analyze complex networks.” Net-works Spat. Econ., 7(4), 301–313.
Small, M., and Tse, C. K. (2005). “Small world and scale free model oftransmission of SARS.” Int. J. Bifurcation Chaos Appl. Sci. Eng., 15(5),1745–1755.
Sornette, D. (2003). Why stock markets crash: Critical events in complexfinancial systems, Princeton University Press, Princeton, NJ.
U.S. Census Bureau. (2008). “State & county quickfacts: Travis county,TX.” ⟨http://quickfacts.census.gov⟩ (Feb. 5, 2008).
Viger, F., and Latapy, M. (2005). “Efficient and simple generation of ran-dom simple connected graphs with prescribed degree sequence.” Proc.,11th Conf. on Computing and Combinatorics (COCOON), 440–449.
Wallace, R. G., HoDac, H., Lathrop, R. H., and Fitch, W. M. (2007). “Astatistical phylogeography of influenza A H5N1.” Proc. Natl. Acad.Sci., 104(11), 4473–4478.
Wang, P., González, M. C., Hidalgo, C. A., and Barabási, A.-L. (2009).“Understanding the spreading patterns of mobile phones viruses.” Sci-ence, 324(5930), 1071–1076.
© ASCE 04014004-10 Nat. Hazards Rev.
Nat. Hazards Rev. 2014.15.
Dow
nloa
ded
from
asc
elib
rary
.org
by
UN
IVE
RSI
TY
OF
NE
W S
OU
TH
WA
LE
S on
01/
15/1
5. C
opyr
ight
ASC
E. F
or p
erso
nal u
se o
nly;
all
righ
ts r
eser
ved.