inf-3-3... · web viewagenda item 3: update on the global framework for climate services (gfcs)...
TRANSCRIPT

Global Framework for Climate Services (GFCS) PAC-5/INF. 3.3IBCS-[...]/Doc. 4.1
PARTNER ADVISORY COMMITTEE Submitted by: SecretariatDate: 24.V.2016
FIFTH SESSIONBrussels, Belgium, 1-2 June 2016
Original Language: English
Status:
AGENDA ITEM 3: Update on the Global Framework for Climate Services (GFCS)AGENDA ITEM 3.3: Energy Exemplar
PROGRESS ON THE FINALIZATION OF THE ENERGY EXEMPLARAt the third session of the Management Committee of the Intergovernmental Board on Climate Services (IBCS MC-3, 26-28 October 2015, Geneva) several delegates expressed their concerns with respect to some parts of the text in the Energy Exemplar and provided comments on how the document should:
1) better reflect the nexus between energy and the other priority areas of GFCS;2) give more reference to the current dominant source of energy (i.e. fossil fuels) rather than being too focused on renewable energy;3) provide more guidance on the role of the private sector in the implementation of the energy exemplar;4) remove the mentioning of energy companies and related information that might be sensitive.
Following the decision taken during the session to initiate a broad process of collecting inputs from all the IBCS members to further develop the exemplar and thus finalize the document by the next session of the IBCS Management Committee, an invitation to provide comments/inputs, in consultation with the designated national experts on energy, was circulated to the IBCS principal members in December 2015. Comments and inputs were received by:1) UK Met Office (UKMO)2) Deutscher Wetterdienst (DWD)3) Hong Kong Observatory, China (HKO)4) Japan Meteorological Agency (JMA)5) China Climate Services (CMA) 6) Islamic Republic of Iran Meteorological Organization (IRIMO)A new version of the document is Annex 1. This version considers the inputs received by the national energy experts as well as it tries to address the concerns raised by the IBCS MC during their third session.

Annex 1:Energy Exemplar
to the User Interface Platform (UIP) of the Global Framework for Climate Services
Table of ContentsExecutive Summary...........................................................................................................................3
The Need........................................................................................................................................3Principles........................................................................................................................................4The GFCS and its Pillars................................................................................................................4Areas of Focus................................................................................................................................4Benefits to the Energy Sector Stakeholders...................................................................................5Timeline and Funding Opportunities...............................................................................................5Building on Existing Expertise and Structures................................................................................5Evaluating and Monitoring Progress...............................................................................................6Conclusions....................................................................................................................................6
1. Introduction.....................................................................................................................................71.1 Objective, Scope and Functions...............................................................................................71.2 Meeting Energy Demand Through a Mix of Energy Supplies...................................................81.3 Climate Services Considerations and Products for the Energy Industry..................................81.4 Climate Impacts on Energy Sector – Leading Organisations Raising the Alarm......................9
1.4.1 Examples of Impacts of Extreme Climate Events Experienced by the Energy Industry. .121.4.2 Towards a More Climate Resilient Energy Industry.........................................................13
1.5 Energy Sector-wide Climate Services Needs and Priorities...................................................131.5.1 Building Blocks for Climate Services for the Energy Sector by Focus Area.....................13
2. Implementation of the Energy Exemplar.........................................................................................i2.1 Conditions for Successful Implementation.................................................................................i2.2 The Identification of Projects.....................................................................................................ii2.3 Suggested Priority Categories of Activities...............................................................................iii2.4 Initial Implementation Activities and Approach.........................................................................xi2.5 Monitoring and Evaluation of Implementation Activities..........................................................xii2.6 Risk Management of Activity Implementation.........................................................................xiii
3. Enabling Mechanisms..................................................................................................................xv3.1 Synergies with Existing Activities............................................................................................xv3.2 Building National, Regional and Global Partnerships.............................................................xv3.3 Review Mechanisms...............................................................................................................xvi3.4 Communication Strategy.......................................................................................................xvii
4. Resource Mobilization................................................................................................................xviii4.1 Global to National Levels......................................................................................................xviii
5. Summary of Priority Activities/Projects.........................................................................................xxAnnexes xxi
Annex 1 – Climate-sensitive Energy Sub-sectors: a Selection....................................................xxiA1.1 Wind Power.......................................................................................................................xxiA1.2 Solar Power.....................................................................................................................xxixA1.3 Hydropower....................................................................................................................xxxvA1.4 Other energy sources for Thermal Power........................................................................xliii
Annex 2 – Relevant Existing Activities.......................................................................................xlviiiAnnex 3 – Specific Examples of Climate Product/Services...........................................................lvAnnex 4 – International Organisations, Programmes and Coordination Mechanisms Relevant to the GFCS Energy Exemplar........................................................................................................lxiii
A4.1 (International) Energy Companies...................................................................................lxiiiA4.2 International Organisations..............................................................................................lxiiiA4.3 Regional Organizations..................................................................................................lxviii
2

A4.4 (International or Regional) Activities/Projects.................................................................lxviiiAnnex 5 – Recommendations from World Bank 2011................................................................lxxiiAnnex 6 – Recommendations from WBCSD 2014.....................................................................lxxv
6. References................................................................................................................................lxxvi7. Acronyms...................................................................................................................................lxxx
Lead Author: Alberto Troccoli
Contributing authors: Laurent Dubus, Maxx Dilley, Mohammed Boulhaya, Filipe Lucio.
Reviewers: Heather Auld, Nicolas Fichaux, Sue Ellen Haupt, Chris Hewitt, Katrina Kelly, Tracy Lane, Christopher Oludhe, Sylvie Parey and Andreas Walter.
EXECUTIVE SUMMARYTHE NEEDEnergy systems are the engine of economic and social development. Their investments represent a sizeable portion of a country’s GDP. Indeed, energy is essential to practically all aspects of human welfare, including access to water, agricultural productivity, health care, education, job creation and environmental sustainability (UNDP, 2005). Furthermore, energy sector emissions such as CO2 account for the largest share of global anthropogenic greenhouse gas (GHG) emissions. Emissions reduction targets under the UN Framework Convention on Climate Change are expected to significantly increase demand for energy from renewable sources, which are highly sensitive to climate, as well as lead to requirements for energy efficiency measures. Energy planning and operations in general are markedly affected by meteorological events. For instance, 4.3% (equivalent to many hundreds of M€) of the total Electricité De France (EDF)’s 2013 income was attributed to effective management of weather and climate conditions in France. With an ever-growing global energy demand – currently about 13 billion tonnes of oil equivalent, an increase of nearly 30% in ten years – expanding energy systems are increasingly exposed to the vagaries of weather and climate. Although this is certainly the case for renewable sources such as wind, solar and hydropower, and for electrical distribution and transmission systems, the more traditional energy sources can also be severely affected by extreme weather and climate events. Thus, by properly taking into account weather and climate information, energy systems can considerably improve their resilience to weather extremes, climate variability and change. Climate services can also support increased development and use of renewable energy sources.
Better climate services can help meet these challenges by giving decision-makers enhanced tools and systems to analyse and manage risk, under current hydro-meteorological conditions, as well as in the face of climatic variability and change. This Exemplar explains how improved climate services can benefit the energy sector. It illustrates a vision as to how the development and application of targeted climate products and services through the Global Framework for Climate Services (GFCS) can help improve efficiency and reduce risk associated with hydro-meteorological hazards affecting energy systems. The main focus of this Energy Exemplar is to address climate services needed to support:
1. Greater climate resilience and adaptation across the sector, due to its fundamental importance for development;
2. The important role of efficiency and reduction of energy consumption with consequent emissions reduction in support of mitigation targets;
3. The growing renewable sub-sector, given the apparent climate sensitivity of renewables on the one hand and the policy priority accorded to them due to their GHG emissions reduction benefits on the other.
3

PRINCIPLES The GFCS Energy Exemplar will be implemented according to three (sequential) principles:
1. Take stock – The GFCS will take stock of relevant current activities in the area of meteorology/climate & energy so as to have a detailed overview of the state-of-the art.
2. Harmonise activities – The GFCS will assist in the coordination of available activities whenever there is a perceived benefit for doing so by a range of stakeholders. The GFCS is not meant to replace current activities but to provide a harmonization platform, with the aim of allowing stakeholders to increase their awareness of available data, tools and energy policies.
3. Multi Benefits – The GFCS will provide a platform for collaboration amongst energy sector stakeholders with a need for improved climate services. The GFCS will facilitate the implementation of new complementary projects.
It should be emphasised that in order for these principles to be effectively applied, and hence for the Energy Exemplar to be implemented in a successful manner, strong leadership is required. Such leadership should be shared via a partnership between WMO and counterpart organisations representing the energy industry.
THE GFCS AND ITS PILLARSThe World Climate Conference-3 (Geneva, 2009) unanimously decided to establish a GFCS, a United Nations-led initiative spearheaded by WMO to guide the development and application of science-based climate information and services in support of decision-making (http://www.gfcs-climate.org). The GFCS had four initial priorities: agriculture and food security, water, health and disaster risk reduction. Given that climate and energy are intrinsically entwined, subsequently energy was considered as a candidate to become the fifth priority sector. Energy itself plays a significant role for the other pillars, as a driver for improving them.
The GFCS is supported by a network of technical experts; national, regional and global specialized centers and services; and international partners. Its implementation plan spans five areas of activity (or pillars):
1. User Interface Platforms (UIP) – forums for forging the stakeholder relationships needed to define needs and respond to requirements for climate information and services in particular sectors and contexts
2. Climate Services Information System (CSIS) – for producing and distributing climate data and information tailored for policy- and decision-support
3. Observations and Monitoring (Obs/Mon) – for generating the necessary data for the development of climate services
4. Research, Modelling and Prediction (RMP) – to advance the science needed for improved climate services and climate-related outcomes
5. Capacity Development and Support – to support the systematic development of the institutions, infrastructure and human resources needed for effective climate services.
Work in each of these areas will be undertaken to support the specific needs of the energy sector. Due to their high sensitivity to climatic factors, renewables such as wind, bioenergy, solar and hydropower and their connecting infrastructure will receive particular attention.
AREAS OF FOCUSWork to be undertaken during the implementation of the Exemplar reflects the project stages of a generic energy system, namely from planning to construction, to operation & maintenance, including also the balancing of supply and demand:
MissionBy developing user-tailored weather-water-climate services in close cooperation with the Energy industry, the GFCS will enable it to better manage the risks and opportunities arising from extreme events, climate variability and change. The GFCS will ensure that the resulting science-based climate information leads to improved planning, policy and operational activities.
4

1. Identification & Resource Assessment2. Impact assessments (incl. infrastructure and environment)3. Site Selection & Financing 4. Operations & Maintenance 5. Energy Integration
BENEFITS TO THE ENERGY SECTOR STAKEHOLDERSThis Exemplar will benefit all energy industry activities influenced by meteorological events, the aim of this Exemplar is to improve energy industry resiliency while also contributing to mitigation targets.This Exemplar will benefit all energy industry activities influenced by meteorological events and whose aim is to reduce harmful emissions. Thus the aim of this Exemplar is to improve energy industry resiliency while also contributing to mitigation targets.
The GFCS will provide a coordinating mechanism to allow energy sector stakeholders to acquire wider access to relevant climate expertise, information, tools and energy policies beyond what may be currently accessible. While some energy stakeholders are well versed in the use of climate information, a considerable share of the stakeholders cannot afford to have climate specialists in their ranks. Similarly, engagement with energy-sector stakeholders will enable hydro-meteorological specialists to better understand and respond to the sector's needs. In either case, information gathering and sharing is a worthwhile investment in this burgeoning area at the relationship between energy and meteorology. The GFCS will allow stakeholders to contribute their services and tools into the system; it will also offer the opportunity to suggest improved ways to exchange information and/or request specific services or training.
TIMELINE AND FUNDING OPPORTUNITIESThe GFCS is already underway. The activities of the first four priority areas – Agriculture and Food Security, Disaster Risk Reduction, Health, and Water – are progressing according to the following three phases: Initial – Phase I (2015–2017), Implementation – Phase II (2017–2019), Consolidation – Phase III (2019–2023). Given that the governance structure of the GFCS has been established in the initial phase, activities of the Energy Exemplar will be integrated in the Operational Plan for the GFCS for the period 2015 – 2018.
WMO has set up a GFCS Trust Fund that has attracted contributions from a number of countries. It helps fund some initial projects and administrative costs. Moreover, the GFCS provides an organizing structure for framing initiatives and contributing to improved energy-related outcomes. This may generate incentives for self-funding as well as opportunities for funding from third parties.
BUILDING ON EXISTING EXPERTISE AND STRUCTURESThe GFCS seeks to promote support for its vision and activities at national, regional and global levels, building on existing partnerships and avoiding duplication. This principle can be implemented through active engagement in the working mechanisms, programmes and activities of the energy sector. While energy companies generally have a good appreciation of weather and climate information, technology and science advancements mean that weather and climate information is becoming broader and more sophisticated. The challenge for GFCS is enabling effective communication between a science-led provider community and a business-driven sector. Decision-making will take place whether or not adequate climate information is available. However, improved climate services, such as maybe developed on the basis of this Exemplar, will aid decision-making by reducing risks or costs.
Therefore, in order for the this Exemplar to be truly effective, strong partnerships are required with key international organizations, which recognize the benefit of developing climate services and which can assist in communicating and engaging with private-sector companies active in the energy industry.
5
EVALUATING AND MONITORING PROGRESSA principal challenge faced by the GFCS in its initial stages will be to demonstrate its ability to add value. In this sense, the risks associated with implementing GFCS priority activities include organizational complexity, leadership and management, resourcing, and support for coordination between international agencies and individual companies active in the energy sector. To manage these risks, the Exemplar proposes establishing monitoring and evaluation practices, both to assess the success of activities in its priority categories, and to measure overall improvement in climate knowledge and communication between technical experts, energy practitioners, and decision-makers at all levels. These will be incorporated in the GFCS operational plan and monitoring and evaluation framework.
CONCLUSIONSThe energy industry is a complex sector that is undergoing a major transformation, involving an increasingly diversified supply base (e.g. with the widespread rooftop solar systems) and less predictable demand patterns. A major consequence of this is that weather and climate are becoming increasingly critical to the balancing of energy supply and demand at any one time, and at a range of timescales. By leveraging the power of improved, more user-friendly climate services, the GFCS has a clear opportunity to beneficially contribute to this energy system transformation. Sustained, effective leadership and coordination are however crucial if climate services are to be embraced and adopted by the energy industry.
6

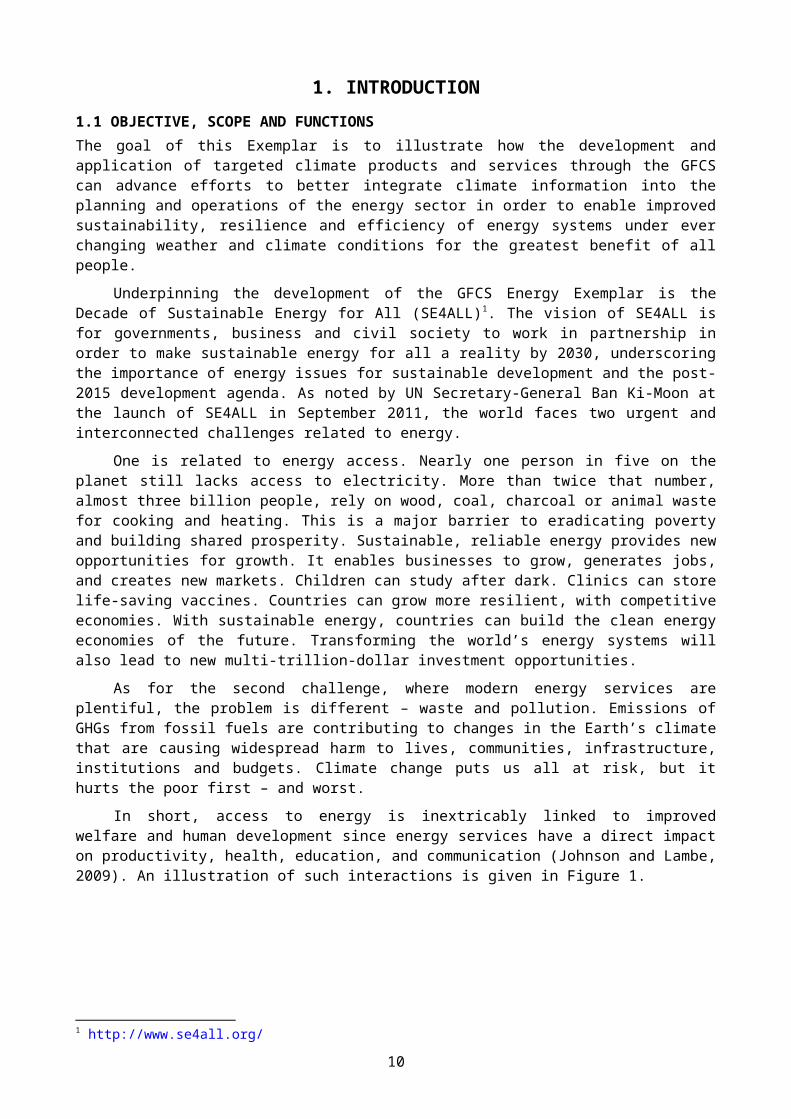
1. INTRODUCTION1.1 OBJECTIVE, SCOPE AND FUNCTIONS The goal of this Exemplar is to illustrate how the development and application of targeted climate products and services through the GFCS can advance efforts to better integrate climate information into the planning and operations of the energy sector in order to enable improved sustainability, resilience and efficiency of energy systems under ever changing weather and climate conditions for the greatest benefit of all people.
Underpinning the development of the GFCS Energy Exemplar is the Decade of Sustainable Energy for All (SE4ALL)1. The vision of SE4ALL is for governments, business and civil society to work in partnership in order to make sustainable energy for all a reality by 2030, underscoring the importance of energy issues for sustainable development and the post-2015 development agenda. As noted by UN Secretary-General Ban Ki-Moon at the launch of SE4ALL in September 2011, the world faces two urgent and interconnected challenges related to energy.
One is related to energy access. Nearly one person in five on the planet still lacks access to electricity. More than twice that number, almost three billion people, rely on wood, coal, charcoal or animal waste for cooking and heating. This is a major barrier to eradicating poverty and building shared prosperity. Sustainable, reliable energy provides new opportunities for growth. It enables businesses to grow, generates jobs, and creates new markets. Children can study after dark. Clinics can store life-saving vaccines. Countries can grow more resilient, with competitive economies. With sustainable energy, countries can build the clean energy economies of the future. Transforming the world’s energy systems will also lead to new multi-trillion-dollar investment opportunities.
As for the second challenge, where modern energy services are plentiful, the problem is different – waste and pollution. Emissions of GHGs from fossil fuels are contributing to changes in the Earth’s climate that are causing widespread harm to lives, communities, infrastructure, institutions and budgets. Climate change puts us all at risk, but it hurts the poor first – and worst.
In short, access to energy is inextricably linked to improved welfare and human development since energy services have a direct impact on productivity, health, education, and communication (Johnson and Lambe, 2009). An illustration of such interactions is given in Figure 1.
Figure 1 – Interactions between impacts of climate on the energy sector in relation to other sectors (from Wilbanks, 2014)
It is also worth noting that as stated in the ‘Implementation Plan of the Global Framework for Climate Services’ (WMO 2014a, p 13) ‘The natural evolution of Framework-related activity will see
1 http://www.se4all.org/
7

other sectors come into focus. As an example of a sector that is likely to be considered as one of the next priority areas, the energy sector is recognized for its importance in sustainability and in climate adaptation and mitigation. This sector is particularly sensitive to weather and climate and is therefore an experienced user of climate information.’
1.2 MEETING ENERGY DEMAND THROUGH A MIX OF ENERGY SUPPLIESGlobal energy production derives from different resources each contributing in different measures to the total primary energy supply. The current energy mix is roughly thus subdivided: 80% from fossil fuel, 13% from renewables (other than large hydro), 5% from nuclear and 2% from hydro larger than 10 MW (WER 2013). Numbers vary slightly when different sources are considered (Figure 2), also due to the sector evolution, but the overall picture is essentially the same. A further subdivision, by energy sub-sectors, is required in order to identify specific issues in each sub-sector, and to ultimately develop appropriate and relevant climate services. However, given the large number of energy sub-sectors – coal, oil, natural gas, nuclear, hydro, bio, peat, waste, wind, solar, geothermal, wave, tidal and ocean currents – it would be impractical to expand on each of these in this document (the WER [2013] publication provides a thorough coverage of all the main sub-sectors).
Note also that the sub-sectors listed above are normally referred to as resource endowments, as opposed to: energy supply (e.g. thermal plants, wind and solar power plants, liquid biofuels), energy transmission, energy distribution & transfer, energy infrastructure, and energy use (Schaeffer et al. 2012). As a way of providing a few examples, a select energy sub-sectors– wind power, solar power, hydropower and thermal power – are discussed in Annex 1.
Figure 2 – Estimated energy shares of global final energy consumption, 2013 (REN21, 2015)
In a sector-wide sense, the target is always achieving sufficient energy supply to match the (variable) demand. Also, aside from the strong constraint of the overall energy demand, the level of supply from each individual source is determined by its relative price2. Thus, if, for example, a single source had sufficient capacity to meet demand at any one time, a mix of sources would normally be used nonetheless, as there are constraints other than supply availability, represented by factors such as market mechanisms or network bottlenecks. It is therefore important to view the individual energy supply elements as part of the bigger, demand-constrained, picture.
1.3 CLIMATE SERVICES CONSIDERATIONS AND PRODUCTS FOR THE ENERGY INDUSTRYIn order to develop relevant and appropriate climate services for the energy sector, a thorough assessment of the way in which climate events affect the energy sector needs to be carried out. A basis for assessing these impacts, as well as a number of examples is presented, based on a growing number of publications in this area.
2 The price of individual supplies is the result of a combination of factors, including subsidies to renewables as well as to oil-based fuels, carbon price and level of demand.
8

As the sector producing the largest share of anthropogenic GHG emissions – in 2010, 35% of direct GHG emissions came from energy production – the energy sector could substantially contribute to mitigation options. While there is a distinct link between GHG emissions and climate change, this document does not deal with policy options for mitigation. Rather, the main focus of this Exemplar is to address climate services needed to support:
1. Greater climate resilience and adaptation across the sector, due to its fundamental importance for development;
2. The important role of efficiency and reduction of energy consumption with consequent emissions reduction in support to mitigation targets;
3. The growing renewable sub-sector, given the apparent climate sensitivity of renewables on the one hand and the policy priority accorded to them due to their GHG emissions reduction benefits on the other.
Specifically about the latter, while currently only a small portion of energy comes from renewable sources, international policy processes are underway which provide incentives to significantly increase their share, owing to climate change concerns. Already, improving technologies and decreasing costs of production have led renewables to become cost-competitive with traditional energy generation sources in several parts of the world (REN21, 2015). Since this segment of the sector has undergone a rapid expansion, the meteorological products and services it needs are less clearly articulated and less well served.
After describing how climate can affect energy from an industry-wide perspective, an attempt is made to provide an as inclusive as possible schematic of the types of services required by the energy industry to address impacts related to climate phenomena. The schematic conforms to the five pillars of the GFCS. In addition, in order to understand better how climate is linked to energy systems and to define in more detail the type of services needed for energy systems, more focussed discussions about specific energy sub-sectors are also presented in Annex 1.
1.4 CLIMATE IMPACTS ON ENERGY SECTOR – LEADING ORGANISATIONS RAISING THE ALARM
Energy services and resources will be increasingly affected by climate change – changing trends, increasing variability, greater extremes, and large inter-annual variations in climate parameters in some regions. Although energy systems already take account of some climate risks in their operation and planning, adaptation measures can further reduce their vulnerability to environmental change by building capacity and improving information for decision-making and climate risk management. Further, climate impacts cross the entire energy supply chain. Existing energy infrastructure, new infrastructure and future planning need to consider emerging climate conditions and impacts on design, construction, operation, and maintenance. Impacts on energy supply and demand are the most intuitive but there are also direct effects on energy resource endowment, infrastructure, and transportation, and indirect effects through other economic sectors (for example, water, agriculture) (Ebinger and Vergara 2011).
Integrated risk-based planning processes will be critical to address these impacts and harmonize actions within and across sectors. This will help to avoid locking in unsustainable practices today through investments in long-lived infrastructure and associated consumption patterns. Awareness, knowledge, and capacity impede mainstreaming of climate risk management into the energy sector. The fact that information needs are complex and to a certain extent regionally and sector specific makes the task more complicated. Issues are exacerbated in developing countries, where there is often a dearth of historical hydro-meteorological data and limited capacity to provide climate services (Ebinger and Vergara, 2011).
Specific vulnerabilities of the power sector to projected climate changes are also discussed in the Asian Development Bank publication (Johnston et al. 2012). Amongst these are:
Increases in air temperature will reduce generation efficiency and output as well as increase customers’ cooling demands, stressing the capacity of generation and grid networks.
Changes in precipitation patterns and surface water discharges, as well as an increasing frequency and/or intensity of droughts, may adversely impact hydropower generation and
9
reduce water availability for cooling purposes to thermal and nuclear power plants (Figure 3).
Extreme weather events, such as stronger and/ or more frequent storms, ice accretion loads, extreme winds and offshore hazards can reduce the supply and potentially the quality of fuel (coal, oil, gas), reduce the input of energy (e.g., water, wind, sun, biomass), damage generation and grid infrastructure, reduce output, and affect security of supply.
Sea level rise can affect energy infrastructure in general and limit areas appropriate for the location of power plants and grids (see also Table 1).
Detailed local assessments are necessary to provide greater confidence in understanding current climate variability and how the climate might change in the future, and therefore which measures are warranted at the level of specific projects. There is a need to improve energy sector (and broader) decision making by improving local weather and climate knowledge, regardless of whether large climate changes are expected, by improving access to existing meteorological and hydrological data, and by developing better mechanisms so that local weather and climate data as well as specialized analyses are archived for the public good (Johnston et al. 2012).
Amongst the options the energy sector has to improve its resilience to climate change, there are a number of technological improvements for thermal power plants which, if implemented, will bring efficiency gains that more than compensate for losses due to higher ambient temperatures. For instance, coal-mining companies can improve drainage and run-off for on-site coal storage, as well as implementing changes in coal handling due to the increased moisture content of coal. Authorities can plan for evolving demand needs for heating and cooling by assessing the impact on the fuel mix: heating often involves direct burning of fossil fuels, whereas cooling is generally electrically powered. More demand for cooling and less for heating will create a downward pressure on direct fossil fuel use, but an upward pressure on demand for electricity (ECF/WEC/UoC 2014).
Figure 3 – Potential effects on energy supply due to climatic changes (from Wilbanks 2014)
Table 1 – Relationship between climate change projections and implications for the energy sector (from DoE 2013). Additional detail is provided in Annex 1 for selected sub-sectors.
Energy Sector Climate projection Potential implicationOil and gas exploration
and production
Thawing permafrost in Arctic Alaska Longer sea ice-free season in Arctic
Alaska
Damaged infrastructure and changes to existing operations
Limited use of ice-based
10

Decreasing water availability Increasing intensity of storm events,
sea level rise and storm surge
infrastructure; longer drilling season; new shipping routes
Impacts on drilling, production, and refining
Increased risk of physical damage and disruption to offshore and coastal facilities
Fuel transport
Reduction in river levels Increasing intensity and frequency of
flooding
Disruption of barge transport of crude oil, petroleum products, and coal
Disruption of rail and barge transport of crude oil, petroleum products, and coal
Thermoelectric power
generation (Coal, natural gas, nuclear, geothermal
and solar CSP)
Increasing air temperatures Increasing water temperatures Decreasing water availability Increasing intensity of storm events,
sea level rise and storm surge Increasing intensity and frequency of
flooding
Reduction in plant efficiencies and available generation capacity
Reduction in plant efficiencies and available generation capacity; increased risk of exceeding thermal discharge limits
Reduction in available generation capacity; impacts on coal, natural gas, and nuclear fuel supply chains
Increased risk of physical damage and disruption to coastal facilities
Increased risk of physical damage and disruption to inland facilities
Hydropower
Increasing temperatures and evaporative losses
Changes in precipitation and decreasing snowpack
Increasing intensity and frequency of flooding
Reduction in available generation capacity and changes in operations
Reduction in available generation capacity and changes in operations
Increased risk of physical damage and changes in operations
Bioenergy and biofuel
production
Increasing air temperatures Extended growing season Decreasing water availability Sea level rise and increasing intensity
and frequency of flooding
Increased irrigation demand and risk of crop damage from extreme heat
Increased production Decreased production Increased risk of crop damage
Wind energy Variation in wind patterns Increase in tropical cyclone intensity Onshore and offshore storms
Uncertain impact on resource potential Interrupting operations Damage of wind turbines
Solar energy
Increasing air temperatures Decreasing water availability Increase in extreme weather events
(e.g. storms, heatwaves, severe thunderstorms, etc.)
Reduction in potential generation capacity
Electric grid
Increasing air temperatures More frequent and severe wildfires Increasing intensity of storm events
Reduction in transmission efficiency and available transmission capacity
Increased risk of physical damage and decreased transmission capacity
Increased risk of physical damage
Energy demand
Increasing air temperatures Increasing magnitude and frequency
of extreme heat and cold events.
Increased electricity demand for cooling; decreased fuel oil and natural gas demand for heating
Increased peak electricity demand
1.4.1 Examples of Impacts of Extreme Climate Events Experienced by the Energy IndustryWhile projected climate changes are likely to considerably affect the energy industry, energy systems have been historically exposed to the vagaries of the climatic events. The following examples illustrate some of the practical consequences of severe climatic events.
11

The 1998 Eastern Canada ice storm damaged 116 transmission lines and 3,110 support structures (including 1,000 steel pylons), as well as 350 low-voltage lines and 16,000 wood posts. To restore service rapidly to its customers following the disaster, Hydro-Québec spent CDN$725 million repairing the lines and support structures with the least damage and building temporary transmission and distribution equipment (Audinet et al. 2014). Several strong hurricanes have brought widespread disruption to the oil industry, as with hurricanes Katrina (2005), Ike (2008) and Isaac (2012). Specifically in the latter case, the repair costs for hurricane Isaac were estimated to have reached around $400 million in four USA states (Arkansas, Louisiana, Mississippi and New Orleans) for Entergy alone (Audinet et al. 2014).
In 2008, South-central China faced an unprecedented ice storm, as they are not common in this area, the storm caused direct economic losses for more than $20 U.S. billion. As an extreme event that last several days, affections in the infrastructure of the region (most populated and economically developed region of China), had negative consequences in the power grid, where 36,740 high-voltage transmission lines, 8,381 towers, 2,018 transformer stations were damaged. (CEC, 2008).
Coal mines in Queensland, Australia, experienced widespread disruptions in late 2010 to early 2011 because of heavy rains and floods caused by an unusually strong La Niña event. As a consequence of this event, and the projection of similar ones to come, one large mine built a new bridge and a levee designed for a 1 in 1,000 year flood event to prepare for the eventuality that these conditions become more typical (Johnston et al. 2012, Love et al. 2014).
Nuclear power stations rely on water flows for their cooling. Warm and hot weather may cause cooling water to reach temperatures too high for the water to be effective. In addition, such higher temperatures returned to rivers can result in damage to flora and fauna. In France in 2003, the very low river flows and increased water temperature led to reductions in power production and exceptional exemptions from legal limits on the temperature at which water may be returned to rivers (Dubus 2010).
It is therefore evident that weather and climate is an important factor for planning and operations in traditional energy sub-sectors, typically coal, oil, gas, nuclear and hydro – additional examples can be found in Troccoli (2009), Schaeffer et al (2012), DOE (2013) and Troccoli et al. (2014). This is a reflection of the current mix in energy supply. With increasing meteorological observations and monitoring, and the acquired knowledge about our ever-changing climate, the resilience of energy system to climatic events can be enhanced (Troccoli et al. 2013).
Weather and climate information is also important in informing energy efficiency measures. For example, insulating a home allows a building to use less heating and cooling energy to achieve and maintain a comfortable temperature. Also, although thermal power plants are designed to operate under diverse climatic conditions, they will be affected by the decreasing efficiency of thermal conversion as a result of rising ambient temperatures (ECF/WEC/UoC 2014). Overall, energy efficiency – in buildings, industrial processes and transportation – is a large and low-cost energy resource that can save on the order of 20 percent of end-use energy consumption and costs substantially less than new supply resources. It also helps control global GHG emissions (EPA 2009).
The projected increase in renewable energy generation means that weather and climate information will become even more critical for the energy industry as a whole. Indeed there is growing awareness that increased deployment of renewable energy is critical for addressing climate change, creating new economic opportunities, and providing energy access to the billions of people still living without modern energy services. Renewable energy provided an estimated 19.1% of global final energy consumption in 2013, and growth in capacity and generation continued to expand in 2014. In parallel with growth in renewable energy markets, 2014 saw significant advances in the development and deployment of energy storage systems across all sectors. The year also saw the increasing electrification of transportation and heating applications, highlighting the potential for further overlap among these sectors in the future (REN21, 2015).
The GFCS can therefore provide a key contribution towards the preparedness of the energy industry to tackle possible impacts resulting from future severe climatic events as well as to ensure
12

appropriate weather and climate services are developed in support of renewable energy generation and energy efficiency.
1.4.2 Towards a More Climate Resilient Energy IndustryAccurately assessing climate risks for the energy sector is difficult because of the uncertainty in predicting the level, impacts and timing of climate threats. Climate change uncertainties come from three sources (WBCSD 2014):
Economic and policy uncertainty. It is not clear how emissions of GHG will be affected by demographic and socio-economic trends, technologies and the political commitments.
Scientific uncertainty. The understanding of the functioning of the complex climate system is still developing. While the link between GHG emissions and global temperatures is quite clear, the impacts at regional levels and the reaction of affected systems (e.g., lakes, glaciers, etc.) are more difficult to predict.
Natural variability. Given the complexity and interlinked nature of the climate system, climate models can provide statistical information and causal relationships but not a deterministic prediction.
More recently, the International Energy Agency has also started to focus on the importance of making the energy sector resilient to climate change (IEA 2015). The threat that climate change poses to energy systems goes to the IEA’s core mission of enhancing energy security. Overall, the energy sector will need to develop resilience to climate change impacts through technological solutions, proactive climate design considerations, flexible management practices as well as preventive emergency preparedness and response measures. To facilitate these processes and enhance their effectiveness, policy and institutional responses will be needed (IEA 2015).
1.5 ENERGY SECTOR-WIDE CLIMATE SERVICES NEEDS AND PRIORITIESNot only is there an increasing concern around climate impacts on the energy industry, world-leading energy organisations such as the IEA are taking action to ensure energy systems become more resilient to changes in the climate. It is evident, however, that tackling the energy sector needs vis-à-vis i) climate resilience and adaptation, ii) energy efficiency measures and iii) the increasing share of renewables, is a mammoth task, which will require a concerted effort from a large numbers of organisations at various levels from global, to regional, to national. Indeed, the GFCS offers a unique opportunity to provide an overarching framework to help guide investments for the development of key enablers such as user interface platforms, climate services, observations, research and capacity building which will ensure a more robust implementation of resilience and adaptation measures for the energy sector.
1.5.1 Building Blocks for Climate Services for the Energy Sector by Focus AreaIn order to assist with the development of climate services for the energy sector, a schematic framework, which identifies key elements in the way the energy industry operates, is provided below. While recognising that the complexity of the industry does not allow for a unique and simple way to achieve this goal, a viable approach is to adopt a classification which reflects the various project stages of a generic energy industry project, namely from planning to construction, to operation and maintenance, including also the balancing of supply and demand. This classification is well aligned with the timescales of climate and weather information and its level of detail and accuracy. The energy sector stages, or areas of focus, which form the backbone of this Exemplar, along with their main requirements for climate information, are:
1. Identification & Resource Assessment – Requires climate information (historical and projected) for an initial assessment of the energy resource and the required infrastructure, and for management of weather/climate hazards and risks.
2. Impact assessments (including infrastructure and environment) – Requires detailed and tailored weather and climate information (historical and projected) for codes, standards, site-specific designs and policy, to assist with the construction and maintenance of the energy system infrastructure (e.g. power plants, solar collectors or coal mines), including connecting infrastructure for energy transmission, distribution, and transfer. It also requires
13

detailed site-specific and regional climate information (mainly historical) for assessments and mitigation of impact of energy systems on the surrounding environment (e.g. air quality modifications), on human health (e.g. air particles), on ecosystems (e.g. solar plants, marine turbines) and wildlife as well as potential contributions to GHG reduction.
3. Site Selection & Financing – Requires highly detailed site-specific climate information (mainly historical) for rigorous resource assessment, risk management and financial closure.
4. Operations & Maintenance – Requires highly detailed site-specific weather and climate information (predicted, historical and projected) for efficient running of the energy system as well as for site maintenance (e.g. on/off-shore wind turbines or oil rigs)
5. Energy Integration – Energy supplied by individual generators needs to be dispatched in a balanced/integrated manner to suitably meet energy demand
a. Market trading (including supply and demand forecasts) & Insurance – Requires highly detailed weather and climate information (predicted and historical) for efficient use of generated energy via optimal balancing of supply and demand as well as for pricing of insurance structures used to hedge against market volatility and/or risks to assets, such as wind farms, oil rigs and transmission infrastructure.
b. Energy efficiency – Requires highly detailed climate information (predicted, historical and projected) for an efficient use of generated energy via measures such as optimal infrastructure siting or use of shading on hot days to offset air conditioning energy use.
For each of these focus areas, the requirements for climate services are mapped against each of the five GFCS pillars:
1. User Interface Platforms (UIP) – forums for forging the stakeholder relationships needed to define needs and respond to requirements for climate information and services in particular sectors and contexts
2. Climate Services Information System (CSIS) – for producing and distributing climate data and information tailored for policy- and decision-support
3. Observations and Monitoring (Obs/Mon) – for generating the necessary data for the development of climate services
4. Research, Modelling and Prediction (RMP) – to advance the science needed for improved climate services and climate-related outcomes
5. Capability Development – aimed at supporting the systematic development of the institutions, infrastructure and human resources needed for effective climate services, accounted for in each of the four above pillars.
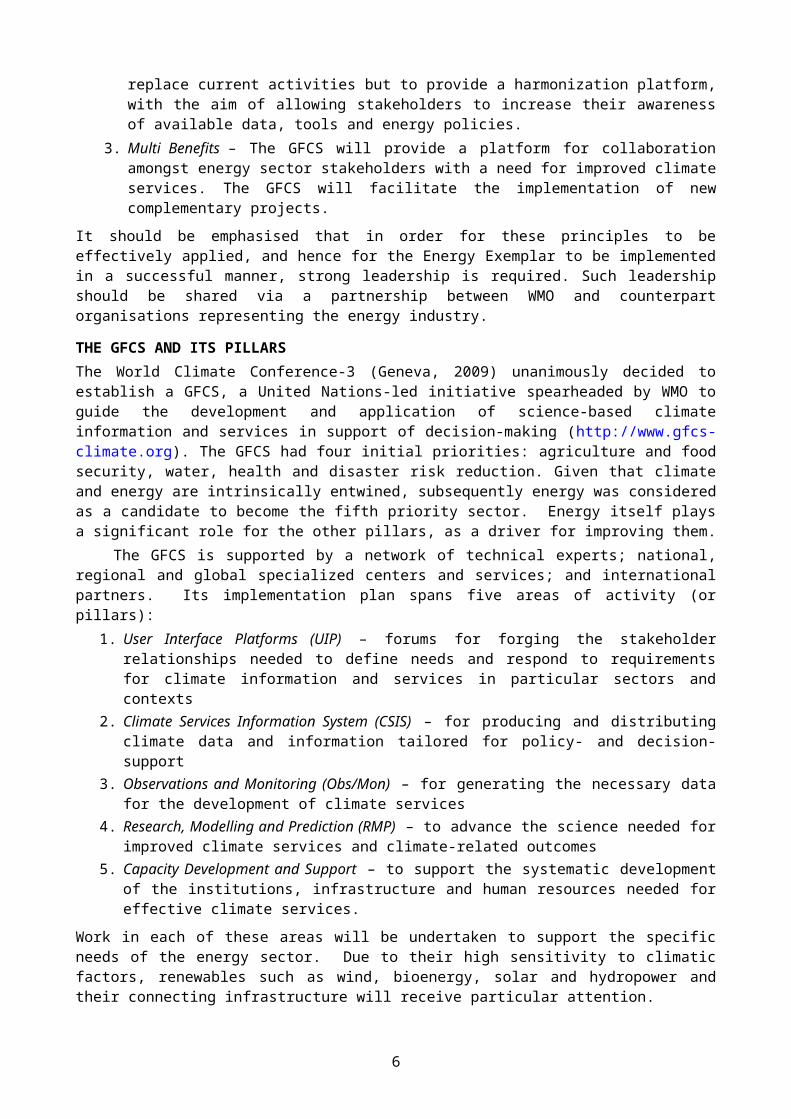
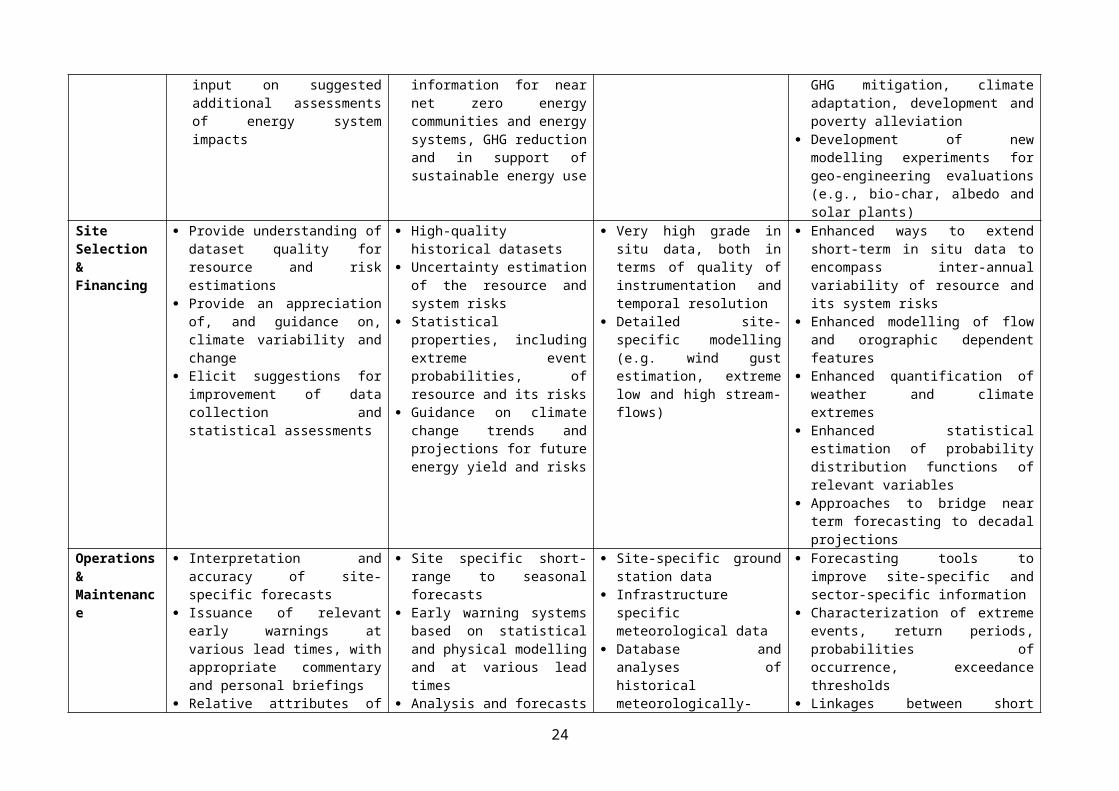
For each focus area and each of the first four GFCS pillars, specific requirements for the energy sector have been identified as a whole (Table 2). Such requirements, summarised in a synthetic and schematic way in Table 2, form the building blocks of the climate services/products which will be developed by the Energy Exemplar. The information in the table is elaborated further by combining the more general requirements with the specific services and/or activities identified in Annexes 2 and 3. A generic product/service framework, which will form the backbone of this Exemplar implementation, is presented in the next chapter.
Having presented the background and introduced the building blocks for the implementation of the Energy Exemplar, the following sections focus on measures that could be performed, either as new initiatives or as a re-enforcement of current activities, in order to provide valuable and effective climate services to the energy industry. After exploring some of the necessary conditions for a successful implementation, section 2 lays out some specific activities as well as a framework for generic projects based on the above building blocks. The way in which these suggested activities can be linked with existing activities – including those in the other GFCS priority areas – to leverage current efforts and therefore enhance the likelihood of success of this Exemplar, is discussed in section 3. Possible co-operation and funding mechanisms are presented in section 4. Section 5 provides a consolidation of priority activities for effective initial implementation of the
14

Energy Exemplar. Finally a series of Annexes provide additional supporting material for the development of specific projects.
15

Table 2 – Building blocks for energy sector climate services, by Pillar and Area of FocusUIP CSIS Obs/Mon RMP
Identification & Resource Assessment
Provide information about relevant repositories of data and products for resource and climate risk estimation
Provide understanding of dataset quality for resource and climate risk estimation
Provide support for the proper installation, operation and maintenance of meteorological instrumentation
Provide estimation of resource and climate uncertainty
Provide an appreciation of, and guidance on, climate variability and change
Discuss options for improvement of resource and climate risk assessment
Historical datasets of relevant meteorological data (in situ, satellite-derived and model-based) and related metadata
Tailored data-sets to specific energy sectors (e.g. heating and cooling degree days, wind gusts, water temperature and river flows)
Climate projections of relevant data
Uncertainty estimates of resource and risk estimations
Development of tailored climate values for energy systems codes, standards, best practices and guidelines
In situ, and satellite-derived meteorological data for assessment of resources and risks
Model-based high-resolution historical meteorological data
Climate change projections and their limitations
Data policy; guidance and possible formulation of updated guidelines
Ancillary datasets such as electric grid, distance to coast, elevations, populated centres, etc.
Improvement of observation instrumentation
Improvement of satellite retrieval and conversion algorithms
Study on sensitivity of resource to atmospheric constituents (e.g. aerosols)
Characterization of uncertainty of different data sources
Methods to combine various data sources
Approaches to bridge time scales and predictions from weather forecasts to seasonal predictions to climate change projections
Approaches to localize or downscale climate change projections for specific decisions
Approaches to assess and combine uncertainty information in individual data sources
Impact assessments
Identify relevant meteorological and climate phenomena for specific infrastructure (e.g. hail, snow and wind loads on PV panels, extreme rainfall and drought impacts on hydro-electric systems)
Identify relevant climate-related environmental impacts, e.g. air quality and human health, wind turbines and wildlife
Provide sound statistics on the impacts of weather and climate on energy systems and discuss assumptions
Provide sound statistics on the impacts of energy systems on
Historical datasets and climate analyses of extreme events
Detailed site-specific modelling
Historical datasets and analyses of extreme events
Projections of potential relevant meteorological/climate trends and changes
Return periods, probabilities of occurrence, exceedance thresholds of relevant extreme events
Support for national and international codes,
High-grade in situ data Observations and
monitoring of relevant climate-related variables for identification and mitigation of environmental impacts, e.g. on human health and safety and wildlife
Air quality and gas emission database (e.g. carbon-based gases from shale gas extractions)
Database on impact of above effects on health (link to Health Exemplar) and other externalities (e.g. water quality)
Characterization of extreme events and probabilities, return periods, probabilities of occurrence, exceedance thresholds
Investigation of specific physical phenomena (e.g. ice accretion, ice plus wind loading on transmission lines)
Downscaling of climate change projections; linkages between seasonal predictions and climate change projections
Development of new parameterizations for high-resolution numerical models in order to integrate energy features (e.g., wind turbines, albedo of solar plants)

the environment and discuss assumptions
Discuss climate support for national and international standards, codes, guidelines
Update standards, codes, etc. taking into account tailored, up-to-date climate information
Engage with civil society by providing assessments of scientifically validated energy system impacts
Elicit stakeholders' input on suggested additional assessments of energy system impacts
standards, etc. Climate change guidance for
long term decisions and assets
Relevant data for decision-support based on established relationships between energy systems and air quality, gas emissions, wildlife and other environmental factors
Prediction of air quality and gas dispersion in the neighbourhood of relevant energy systems
Integration of climate and weather information for near net zero energy communities and energy systems, GHG reduction and in support of sustainable energy use
Database on weather/climate risks to hydro-electricity facilities, solar panel risks to buildings, energy transport risks to communities, etc.
Research into climate-related environmental impacts associated with specific energy installations and technologies, e.g. particulate and gas emissions and their relationship to meteorological conditions
Links between more efficient energy systems and GHG mitigation strategies, climate change impacts
Identification of “win-win” energy systems supporting GHG mitigation, climate adaptation, development and poverty alleviation
Development of new modelling experiments for geo-engineering evaluations (e.g., bio-char, albedo and solar plants)
Site Selection & Financing
Provide understanding of dataset quality for resource and risk estimations
Provide an appreciation of, and guidance on, climate variability and change
Elicit suggestions for improvement of data collection and statistical assessments
High-quality historical datasets
Uncertainty estimation of the resource and system risks
Statistical properties, including extreme event probabilities, of resource and its risks
Guidance on climate change trends and projections for future energy yield and risks
Very high grade in situ data, both in terms of quality of instrumentation and temporal resolution
Detailed site-specific modelling (e.g. wind gust estimation, extreme low and high stream-flows)
Enhanced ways to extend short-term in situ data to encompass inter-annual variability of resource and its system risks
Enhanced modelling of flow and orographic dependent features
Enhanced quantification of weather and climate extremes
Enhanced statistical estimation of probability distribution functions of relevant variables
Approaches to bridge near term forecasting to decadal projections
Operations & Maintenance
Interpretation and accuracy of site-specific forecasts
Issuance of relevant early warnings at various lead times, with appropriate commentary and personal briefings
Relative attributes of statistically- and physically-
Site specific short-range to seasonal forecasts
Early warning systems based on statistical and physical modelling and at various lead times
Analysis and forecasts of probabilities of extreme
Site-specific ground station data
Infrastructure specific meteorological data
Database and analyses of historical meteorologically-driven problem (forensic) events for operations and
Forecasting tools to improve site-specific and sector-specific information
Characterization of extreme events, return periods, probabilities of occurrence, exceedance thresholds
Linkages between short term, seasonal and longer term climate
17

based forecasts and seasonal predictions
Elicit expert technical knowledge Support targeted training
events from short-range to seasonal time scales
maintenance needs for operations and maintenance (e.g. planning for variability, ranges, trends)
Improved communication methodologies to effectively convey warnings at various lead times
Energy Integration (Market trading & Insurance; Energy efficiency)
Interpretation of trends in demand and relevant meteorological/climate variables
Seek energy market operators’ opinions on role of meteorology and climate in demand modelling
Collect experiences in demand modelling and compile database, analyses (e.g. forensic analyses)
Analysis of correlation between climatic indexes and conventional power plant efficiency and safety
Increased interactions between energy traders/insurers and meteorologists/climatologists for the exchange of practices towards the development of improved tools (this is an area where meteorologists can learn a lot as industry uses advanced tools; at the same time commercial sensitivities make the exchange less straightforward)
Historical data of demand-related meteorological/climate variables
Analysis and forecasts of probabilities of extreme events from short-range to sub-seasonal to decadal range (e.g. plan energy infrastructure to meet future trends in demand)
Short-term to seasonal scale meteorological forecasts of sites and/or regions, including synoptic assessments
Assessment of historical performance of short-term to seasonal forecasts
Probabilistic post-processing of forecasts
Climate trends and projections for the future
Historical datasets of meteorological/climate variables relevant for demand, insurance and energy efficiency
Historical datasets of energy demand
Model-based data to extend observation records
Ancillary datasets such as shading, orientations of building and energy system response to weather variables
Historical energy trade data Site-specific ground station
data for triggering of weather index insurance policies
Data policy for consistent use of observations for insurance payouts
Modelling of interaction between meteorological/climate variables and energy demand
Forecasting tools to improve meteorologically-driven demand (including trends and projections longer into the future)
Investigation of relationship between meteorological variables and energy efficiency of buildings or other energy systems (includes longer term seasonal and decadal trends)
Improvement of skill of short-term to, especially, seasonal forecasts targeted at regions where energy systems operate
Tools to improve use of probabilistic information
Approaches to bridge time scales for decisions from weather forecasts to seasonal predictions to climate change trends and projections
Guidance on interpretation of climate change projections and their limitations and uncertainties
CAPACITY DEVELOPMENT AND SUPPORT
UIP – User Interface Platform; CSIS – Climate Services Information System; Obs/Mon – Observations and Monitoring; RMP – Research Modelling and Prediction
18

PAC-5/Doc 3.2, Draft 1, p. i
2. IMPLEMENTATION OF THE ENERGY EXEMPLARThe Energy Exemplar is the primary mechanism for the energy sector to contribute to and benefit from the GFCS. This Exemplar is the translation of the GFCS to the energy sector, and guides how the energy community can implement the Framework. The Exemplar work plan outlines specific activities that link energy sector priorities to the overall Framework. Implementation of the Exemplar can identify and accelerate beneficial interactions between the climate and energy communities at global, regional, and national levels.
The Exemplar is informed by the identified issues and requirements identified in the previous section. Their variety points to an overarching need to compile, assess, and learn from past and current projects and path-finding collaborations which can indicate good practices, gaps, and opportunities for on-going work under the GFCS. This Exemplar serves as a structure to facilitate this stocktaking, help standardize and institutionalize good practices, and bring partners together to innovatively respond to energy user needs. It aims to facilitate and structure the process toward eventually mainstreaming climate services for the energy industry.
2.1 CONDITIONS FOR SUCCESSFUL IMPLEMENTATIONIn order for this Exemplar to be successful there must be full engagement and buy-in of the energy industry, including energy companies, power suppliers, transmission and distribution operators, finance and insurance providers, and energy market operators. Depending on the situation, such entities can operate at local, national, regional or, sometimes, at global level. Three conditions (or principles) are critical to encourage this ownership on both sides and facilitate joint implementation of climate services for energy, namely:
1. Stock-take – Energy companies have been using weather and climate information for decades, as in the case of the metocean information used by the oil & gas sub-sector or more recently with the wind and solar resource assessment. It is critical therefore that an initial effort be devoted to a thorough and systematic analysis of available products and services. Such an analysis needs to be carried out in close consultation with the energy industry, so as to ensure accuracy of information and at the same time to get acquainted with industry players and their standard terminology. Thus, a major role of the energy Exemplar will be to facilitate stocktaking of relevant current climate-dependent energy sector activities.
2. Harmonisation of activities – The GFCS will assist in the coordination of available activities whenever there is a perceived benefit for doing so by a range of stakeholders. The GFCS is not meant to replace current activities but to provide a harmonization platform, with the aim to allow stakeholders to increase their awareness of available data, tools and policies. Thus, it is critical that the stakeholders of the Exemplar be informed of activities of potential interest – harmonisation of activities may therefore be achieved by providing platforms for knowledge sharing, such web portals or workshops.
3. Multi-Benefit – The GFCS will provide a platform for collaboration amongst energy sector stakeholders with a need for improved climate services. The GFCS will facilitate the implementation of new complementary projects and may be able to assist with resource mobilisation. Such complementary projects will be aimed at facilitating harmonisation of activities (mentioned above.) and at identifying gaps, with reference to the building blocks in Table 2 and Annex 2, and with guidance provided by the outlines for specific projects discussed in the section 2.3 2.3 SuggestedPriority Categories of Activities, below.
It is important to emphasise that, in order for these principles to be effectively applied and, therefore, for the Energy Exemplar to be successfully implemented, strong leadership is

PAC-5/Doc 3.2 Draft 1, p. ii
required. Such leadership currently provided by WMO will have to be complemented by a counterpart organisation representing the energy industry, in a similar way to what done for instance with the WMO-WHO partnership vis-à-vis the Health Exemplar. Possible organisations which would be appropriate for such collaborative leadership include: UN Energy, WEC, IEA and IRENA (see Annex 4 for their descriptions).
2.2 THE IDENTIFICATION OF PROJECTSCategories of activities for implementing the Exemplar fall into four classes:
1. Priority Categories of Activities: The five focus areas are presented in the section immediately below as generic descriptions of objectives, outputs, specific activities, inputs and partnerships. These descriptions illustrate how the GFCS can best add value to existing areas of work in the energy sector. These are not implementable projects, but rather are intended to define for the wider GFCS community some of the key products and services for the energy sector, and to explain how they are generated.
2. Individual Projects: Partners can use the 'priority categories' from (1), directly above, as templates or framing criteria when preparing actual projects for implementation in specific contexts. Funding mobilized for GFCS implementation could potentially be directed towards these projects, through a process yet to be determined. Alternatively, partners may find the generic descriptions in the Exemplar below to be useful guidance for preparing projects which embody the GFCS pillars, for funding by third parties. Specific examples of individual projects are provided in Annex 3.
3. GFCS Energy Capacity Development and Support Activities: In the initial stages of the energy Exemplar, in furtherance of the general areas of work described in the Exemplar, it is recommended that a set of start-up capacity development and support activities that would facilitate coordination be identified and designed. Initial proposals for activities in this category are contained in the GFCS Operational and Resources Plan. These proposals are intended to catalyze the contributions of the GFCS pillars to the categories of activities related to the energy industry that are identified in Table 2 and below.
4. Ongoing Activities: As indicated in Annex 2, there is a large body of ongoing activities at country, regional and global levels, along the lines of those described below, to be found worldwide. These activities provide entry points for GFCS products and services, as well as, potentially, resources for advancing the GFCS agenda of climate-resilient societies.
All individual Exemplar projects should support national sustainable development goals. They should also build on other government or inter-governmental efforts such as SE4ALL.
The High-Level Taskforce report (WMO 2011) identified the following timeframes for project implementation: two-year (2013-2015), six-year (2015-2019) and ten-year (2019-2023) timeframes. Since most of the first three years, 2013-2015, have been used to set up the governance structure of the GFCS and coordination mechanisms, the Exemplar would benefit from this GFCS-wide initial work. A critical step for this Exemplar would however be the establishment of a specific coordination mechanism. The coordination function could be one of the initial activities to be carried out. Projects in the six-year and ten-year timeframes will take advantage of the implementation lessons learned in the first two years but may or may not be continuations or scale- up of the first-term projects.
Out of the four classes of initiatives discussed in this section, the next section describes the first: suggested "priority categories of activities" for GFCS, in the area of energy.
ii

PAC-5/Doc 3.2 Draft 1, p. iii
2.3 SUGGESTED PRIORITY CATEGORIES OF ACTIVITIESFor each of the five focus areas (or categories) identified in Table 2, this section outlines generic activities or services that are suggested priorities for GFCS in the area of energy. Priority categories of activities are provided as project outlines. The rationale behind these project outlines is that the GFCS provides a Framework, rather than being prescriptive about specific products/services. Activities in these categories would catalyse provision of GFCS-related products and services, and promote widespread implementation of programmes and initiatives that incorporate climate information and services.
Central to the implementation of this Exemplar are also capacity building and support activities such as:
The provision of coordination, planning and technical advisory services at the country level
The organisation of:o Regular workshops, repeated in different regions of the worldo Targeted summer schools on specific topicso Regular webinarso A regular international conference (e.g. by linking with the ICEM series)
The setting up a web site and other social media tools (e.g. Twitter, Linkedin group) where regular updates are posted
Section 1.5.1 and Table 2 have already identified the five focus areas and some of the activities that this Exemplar can enhance, and contribute to, through its operations and the five constituent pillars, as:
1. Identification & Resource Assessment2. Impact assessments (incl. infrastructure and environment)3. Site Selection & Financing4. Operations & Maintenance5. Energy Integration
a. Market trading (incl. supply and demand forecasts) & Insuranceb. Energy efficiency
Through a process of generalization of specific product/services similar to those elaborated in Annex 3 and using the building blocks in Table 2, generic project outlines are derived here. The view is taken that while the specific product/services in Annex 3 are useful references for developing new projects, they may be either too sub-sector and/or geography specific or have a limited shelf life3. Thus, the more generic and flexible project outlines presented below should allow for a higher degree of versatility. The aim is that such project outlines will facilitate the development of specific projects, while also increasing the outlines’ shelf life.
In the following, the activities or services are described following standard project planning descriptors such as objective, benefit and output. The descriptions illustrate how GFCS can add value to existing areas of work in the energy industry. These are not implementable projects, but rather are intended to define for the wider GFCS community some of the key products and services for energy, and to explain how they are generated. It is important to note that applicability of activities in each focus area should be relevant for
3 The product/services in Annex 3 were identified by a number of experts who participated in the Private Sector Partnership Forum ‘Climate Services and Decision Support Tools for the Energy Sector’: though attempts were made to make them as generic as possible, they are framed around specific issues/contexts.
iii

PAC-5/Doc 3.2 Draft 1, p. iv
any sub-sector across the energy industry, whether for renewable or traditional energy generation.
Specific projects in the categories described below, and which could be undertaken with partners in GFCS’s during its implementation to demonstrate discrete climate-service results, are presented in Annexes 2 and 3. An inclusive, comprehensive process that ensures that the projects are part of a system-wide international effort is recommended so as to identify GFCS activities for the six-year and ten-year timeframes. Particular focus should be devoted to developing services for developing countries, for which the value add would be the greatest.
iv

PAC-5/Doc 3.2 Draft 1, p. v
Focus Area 1 Identification & Resource Assessment
Description Activities in this categories aim to collect, share and assess information regarding possible siting of new energy sources. For this stage information needs not be highly resolved or accurate but it has to be sufficiently detailed to encourage investments for the next phases of impact assessments, site selection and financing. Information required covers not only climate, but also all the electrical, economic, social, geological and planning aspects required for a proper site identification and an initial resource assessment.
Objective To provide energy site developers with data and tools to assist with initial estimates of potentially viable energy extraction and/or production sites.
Benefits Project cost reduction Duration of project planning phase reduced Potential wider competition for the development of energy projects with
consequent possible reduction in final energy costs More comprehensive knowledge of available sources of information Potential efficiency in sharing data through agreed standard formats Potential establishment of new collaborations/partnerships
Outputs Historical datasets of relevant meteorological data (in situ, satellite-derived and model-based) and related metadata
Tailored data-sets to specific energy sectors (e.g., heating and cooling degree days, wind gusts, water temperature and river flows)
Climate projections of relevant data along with uncertainty estimates of resource and risk estimations
Development of tailored climate values for energy systems codes, standards, best practices, guidelines
Activities Collect information about appropriate repository of data for resource and climate risk estimation
Provide understanding of quality of datasets for resource and climate risk estimations
Provide support for the proper installation, running and maintenance of meteorological instrumentation
Provide estimation of resource and climate uncertainty Provide an appreciation of and guidance on climate variability and change Discuss options for improvement of resource and climate risk assessment Improvement of observation instrumentation Improvement of satellite retrieval and conversion algorithms Study on sensitivity of resource to atmospheric constituents (e.g. aerosols) Characterization of uncertainty of different data sources Development of methods to combine various data sources Development of approaches:
o To bridge time scales and predictions from weather forecasts to seasonal predictions to climate change projections;
o To localize or downscale climate change projections for specific decisions
o To assess and combine uncertainty information in individual data sources
Inputs In situ, and satellite-derived meteorological data for assessment of resources and risks
Model-based high-resolution historical meteorological data Climate change projections Data policy; guidance and possible formulation of updated guidelines Ancillary datasets such as electric grid, distance to coast, elevations,
populated centres, geomorphology, social acceptance surveys, etc
v
PAC-5/Doc 3.2 Draft 1, p. vi
Partners Energy companies Energy development and investment companies Consultancy services companies National and regional government institutions National Meteorological and Hydrological Services Climate and energy research communities Energy commissions and regulators Citizens
Focus Area 2 Impact assessments (incl. infrastructure and environment)
Description Activities in this categories aim to collect, share and assess detailed information regarding potential impacts on the infrastructure of possible sites of new energy sources as well as on the local environment. Resolution, temporal extent and accuracy of these data need to be sufficiently high to allow estimation of key statistics such as return periods, probabilities of occurrence, and exceedance thresholds of relevant extreme events. Impact assessment also includes effects of new energy infrastructure on the regional and global environment, and may involve evaluations such as changes in the atmospheric circulation or GHG emissions.
Objective To provide energy site developers with data and tools to assist with accurate information to estimate impacts on infrastructure of new energy extraction and/or production sites
To provide policy makers, planning officers, citizens and other stakeholders with accurate information about impacts of new energy site on the environment
Benefits Project cost reduction Duration of project planning phase reduced Impacts on infrastructure and environment minimized Better use of raw materials, due to improved estimation of infrastructure
impacts Potential wider competition for the development of energy projects with
consequent possible reduction in final energy costs More robust decision making by planning offices Potential efficiency in sharing data through agreed standard formats Better and more informed engagement with the public due to improved
knowledge on environmental impactsOutputs Historical datasets and climate analyses of extreme events
Return periods, probabilities of occurrence, exceedance thresholds of relevant extreme events
Support for national and international codes, standards, etc Climate change guidance for long term decisions and assets Relevant data for decision-support based on established relationships
between energy systems and air quality, gas emissions, wildlife and other environmental factors
Prediction of air quality and gas dispersion in the neighbourhood of relevant energy systems
Integration of climate and weather information for near net zero energy communities and energy systems, GHG reductions and in support of sustainable energy use
Activities Identify relevant meteorological and climate phenomena for specific infrastructure (e.g. hail, snow and wind loads on PV panels, extreme rainfall and drought on hydro-electric systems)
Identify relevant climate-related environmental impacts, e.g. air quality and
vi

PAC-5/Doc 3.2 Draft 1, p. vii
human health, wind turbines and wildlife Provide sound statistics on the impacts of weather and climate on energy
systems and discuss assumptions Provide sound statistics on the impacts of energy systems on the
environment and discuss assumptions Discussion on climate support for national and international standards,
codes, guidelines Updating of standards, codes, etc. taking into account tailored, up-to-date
climate information Engage with civil societies by providing assessments of scientifically
proven energy system impacts Elicit stakeholders input on suggested additional assessments of energy
system impacts Characterization of extreme events and probabilities, return periods,
probabilities of occurrence, and exceedance thresholds Investigation of specific physical phenomena (e.g. ice accretion, ice plus
wind loading on transmission lines) Downscaling of climate change projections; linkages between seasonal
predictions and climate change projections Development of new parameterizations for high-resolution numerical
models in order to integrate energy features (e.g., wind turbines, albedo of solar plants)
Research into climate-related environmental impacts associated with specific energy installations and technologies, e.g. particulate and gas emissions and their relationship to meteorological conditions
Links between more efficient energy systems and GHG mitigation strategies, climate change impacts
Identification of “win-win” energy systems supporting GHG mitigation, climate adaptation, development and poverty alleviation
Development of new modelling experiments for geo-engineering evaluations (e.g., bio-char, albedo and solar plants)
Inputs High-grade in situ data Detailed site-specific modelling Historical dataset and analyses of extreme events Projections of potential relevant meteorological/climate trends and changes Observations and monitoring of relevant climate-related variables for
identification and mitigation of environmental impacts, e.g. on human health and safety and wildlife
Air quality and gas emission database (e.g. carbon-based gases from shale gas extractions)
Database on impact of above effects on health and other externalities (e.g. water quality)
Database on weather/climate risks to hydro-electricity facilities, solar panel risks to buildings, energy transport risks to communities, etc
Partners Energy companies Energy development and investment companies Industry or specific energy-technology-associations Development banks Consultancy services companies National and regional government institutions National Meteorological and Hydrological Services Climate and energy research communities Energy commissions and regulators Citizens
vii

PAC-5/Doc 3.2 Draft 1, p. viii
Focus Area 3 Site Selection & Financing
Description Activities in this categories aim to collect and assess information regarding power yield, and related financing, for possible new energy extraction and/or production sites. For this stage information needs to be as highly resolved and accurate as possible in order to reduce uncertainty on the long-term viability (e.g. financial investment) of new sites. Information required covers not only climate, but also all the electrical, economic, social, geological and planning aspects required for a proper site selection and an accurate resource assessment. Also required is site specific climatic design information that meets requirements of (inter-)national codes and standards.
Objective To provide energy site developers and investment institutions with data and tools to assist with highly accurate estimates of energy yield at planned extraction and/or production sites.
Benefits Improved energy yield estimation Project cost reduction with consequent reduction in final energy costs Duration of project planning phase reduced More efficient use of energy resources Increase in investment in meteorological observations and subject experts,
with potential strengthening of NMHSs particularly in developing countries Potential improvement in meteorological observations, modeling
capabilities and scientific understanding of meteorological phenomena relevant for energy extraction and/or production
Outputs High-quality historical datasets Uncertainty estimation of the resource and system risks Statistical properties, including extreme event probabilities, of resource and
its risks Guidance on climate change trends and projections for future energy yield
and risksActivities Provide understanding of quality of datasets for resource and risk
estimations Provide an appreciation of, and guidance on, climate variability and change Elicit suggestions for improvement of data collection and statistical
assessments Improvement in:
o Ways to extend short-term in situ data to encompass inter-annual variability of resource and its system risks
o Modelling of flow and orographic dependent featureso Quantification of weather and climate extremeso Statistical estimation of probability distribution functions of relevant
variables Development of approaches to bridge near term forecasting to decadal
projectionsInputs Very high grade in situ data, both in terms of quality of instrumentation and
temporal resolution Detailed site-specific modelling (e.g. wind gust estimation, extreme low and
high stream-flows)Partners Energy companies
Energy development and investment companies Energy planning authorities Energy commissions and regulators Consultancy services companies National Meteorological and Hydrological Services Meteorological instrumentations manufacturers Climate and energy research communities Citizens
viii

PAC-5/Doc 3.2 Draft 1, p. ix
Focus Area 4 Operations & Maintenance
Description Activities in this categories aim to improve energy production performance by monitoring and reducing stress on energy infrastructure, so as to extend asset lifetime, and to optimally schedule maintenance and down time sessions. Meteorological information, including local observations and forecasts, needs to be as detailed and accurate as possible. Information required covers not only climate, but also quantity such as electrical load and price.
Objective To provide energy site operators with accurate information in order to ensure infrastructure operates within the specified range, thus limiting undesirable and avoidable stresses on the infrastructure, and therefore optimising asset lifetime.
To provide energy site operators with advance warning of severe events at different lead times in order for them to effectively plan maintenance sessions.
Benefits Improved performance/yield of energy production Better protection of infrastructures/assets Improved asset protection with consequent optimization of asset lifetime Improved scheduling of maintenance sessions with consequent more
efficient use of alternate energy sources and possible reduction in final energy costs
Lowering of insurance risk Increase in investment in meteorological observations and subject experts,
with potential strengthening of NMHSs particularly in developing countries Improvement in forecasting methodology Improvement in the production, identification and delivery of warnings of
severe eventsOutputs Site specific short-range to seasonal forecasts
Early warning systems based on statistical and physical modelling and at various lead times
Analysis and forecasts of probabilities of extreme events from short-range to seasonal time scale
Planning for operations and maintenance under future climate trends and projections
Activities Interpretation and accuracy of site-specific forecasts Issuance of relevant early warnings at various lead times, with appropriate
commentary and personal briefings Relative attributes of statistically- and physically-based forecasts and
seasonal predictions Elicitation of expert technical knowledge Targeted training Forecasting tools to improve site-specific and sector-specific information Characterization of extreme events, return periods, probabilities of
occurrence, exceedance thresholds Linkages between short term, seasonal and longer term climate needs for
operations and maintenance (e.g. planning for variability, ranges, trends) Improved communication methodologies to effectively convey warnings at
various lead timesInputs Site-specific ground station data
Infrastructure specific meteorological data Databases and analyses of historical meteorologically-driven problem
(forensic) events for operations and maintenance Forecasts at various lead times Communication methodologies for warning systems
ix

PAC-5/Doc 3.2 Draft 1, p. x
Partners Energy site operators Energy market operators Energy commissions and regulators Insurance companies Maintenance engineers National Meteorological and Hydrological Services Meteorological instrumentations manufacturers Climate and energy research communities Water authorities
Focus Area 5 Energy Integration
Description Activities in this category aim to ensure energy demand is continually met by supply from a number of energy sources, via market or mandated mechanisms, in such a way to provide citizens with the most efficient, sustainable and least cost energy. Meteorological information, including local observations and forecasts, needs to be as detailed and accurate as possible and are used to predict both energy production and demand, as well as energy efficiency and insurance pricing. Information required covers also energy demand data, itself climate-dependent, which is clearly critical in optimizing energy integration as well as other aspects such as grid connectors, maintenance schedules, and financial/insurance tools.
Objective To provide energy market operators with accurate weather and climate information in order to ensure the most efficient, sustainable and least cost energy to meet demand is generated.
To provide (re-)insurance providers with accurate weather and climate information in order to competitively price insurance premiums and to provide appropriate target measurements for payouts.
To provide local energy companies, businesses, and citizens with accurate weather and climate information in order to apply appropriate energy efficiency measures.
Benefits Improved energy demand forecast Improved energy supply provision More efficient, balanced and sustainable use of energy resources Reduction in final energy costs Reduced of insurance risk and related premiums Improvement in forecasting methodologies and forecast communication Improvement in the production, identification and delivery of warnings of
severe events Greater involvement in energy efficiency decisions by businesses and
citizensOutputs Historical data of demand-related meteorological/climate variables
Predictions of energy demand with meteorology/climate as a driver/predictor at various time scales from minutes to years to decades
Analysis and forecasts of probabilities of extreme events from short-range to sub-seasonal to decadal range (e.g. plan energy infrastructure to meet future trends in demand)
Short-term to seasonal scale meteorological forecasts of sites and/or regions, including synoptic assessments
Assessment of historical performance of short-term to seasonal forecasts Probabilistic post-processing of forecasts Climate trends and projections for the future
Activities Interpretation of trends in demand and relevant meteorological/climate
x

PAC-5/Doc 3.2 Draft 1, p. xi
variables Seek energy market operators’ opinion on role of meteorology and climate
in demand modelling Collect experiences in demand modelling and compile database, analyses
(e.g. forensic analyses) Analysis of correlation between climatic indexes and conventional power
plant efficiency and safety Increased interactions between energy traders/insurers and
meteorologists/climatologists for the exchange of practices towards the development of improved tools
Modelling of interaction between meteorological/climate variables and energy demand
Forecasting tools to improve meteorologically-driven demand (include trends and projections for longer future)
Investigation of relationship between meteorological variables and energy efficiency of building or other energy systems (includes longer term seasonal and decadal trends)
Improvement of skill of short-term to, especially, seasonal forecasts targeted at regions where energy systems operate
Tools to improve use of probabilistic information Approaches to bridge time scales for decisions from weather forecasts to
seasonal predictions to climate change trends and projections Guidance on interpretation of climate change projections and their
limitations and uncertaintiesInputs Historical datasets of meteorological/climate variables relevant for demand,
insurance and energy efficiency Historical datasets of energy demand Model-based data to extend observation records Ancillary datasets such as shading, orientations of building and energy
system response to weather variables Forecasts at various lead times Climate projections Historical energy trade data Site-specific ground station data for triggering of weather index insurance
policies Data policy for consistent use of observations for insurance payouts
Partners Energy site operators Energy market operators Energy traders Energy commissions and regulators Local authorities Insurance companies National Meteorological and Hydrological Services Climate and energy research communities Citizens
2.4 INITIAL IMPLEMENTATION ACTIVITIES AND APPROACHTo implement the GFCS Exemplar on energy, the first steps will be to identify both relevant stakeholders and ways to integrate the described activities, organizationally and operationally, into existing programmes and initiatives. Activities will be demand-driven, with demand assessed by proxy through the existing processes of partners and with the assistance of the GFCS office. Therefore, implementation of the activities described in this Exemplar will require discussion with potential partners to further define the scope of activities, identify roles and responsibilities, garner energy companies and funding agencies
xi

PAC-5/Doc 3.2 Draft 1, p. xii
support, mobilize and allocate resources, agree on monitoring and evaluation methods, and undertake initial administrative procedures.
Throughout the development of this Exemplar, consultation with participants underlined the need to engage the final stakeholders of climate information – particularly energy companies but also private providers of climate information – to ensure that it is relevant and is used. It is also important to engage with national, regional and global activities such as Global Earth Observation System of Systems (GEOSS), the U.S. DOE’s Partnership for Energy Sector Climate Resilience4, the climate services developed under the EU Copernicus5, and the European Earth observation programme which also has a specific focus on Energy6.
Critical to Energy Exemplar success is the establishment of a coordinating entity tasked to provide strong leadership and coordination throughout the implementation of the Exemplar, by ensuring effective engagement with energy stakeholders and the GFCS. Additional key ingredients for successful implementation are the development of formal partnerships and collaboration with agencies and organizations working on energy, such as UN Energy, IRENA, IEA, WEC, as well as organisations working at the intersection between energy and climate such as WEMC. Overall, the underlying approach must be one, which adopts weather and climate information with the sole purpose to genuinely address key and relevant energy industry challenges.
This Exemplar will be implemented following analogous phases to the initial four GFCS priority areas (agriculture and food security, water, health and disaster risk reduction) – Phase I (2015-2017), Phase II (2017-2019), Phase III (2019-2023). Since the other four Exemplars started operations in 2013, initial activities in this Exemplar will have to be accelerated; by the same token, they will also benefit from the work done by the initial four priority areas. Table 3 describes that actions proposed for the first phase focus on addressing identified existing gaps and establishing institutional structures, and will prioritize learning from, strengthening or scaling up existing initiatives at either global, regional and national levels. Phase 1 may be largely centralized with the GFCS UIP and the representative bodies involved, whereas implementation activities regionally and nationally will concentrate within Phases 2 and 3.
Table 3 – Key actions for each phase of the implementation of the energy Exemplar
Phase 1 2015-2017 Phase 2 2017-2019 Phase 3 2019-2023Establish institutional
mechanisms/secretariat in close cooperation with counterpart energy organisation(s)
Establish workplansEstablish website & communication
strategyDevelop initial technical guidanceHarmonisation of existing projects
involving climate and energyAwareness and partnership building
with the energy sector
Maintenance and improvement of engagement in institutional mechanisms
Develop more refined technical guidance, tools & training curricula
Identify new projects and processes
Expansion and continuation of existing projects
Maintenance and sustainability of institutional mechanisms
Technical and operational support for continuation of existing projects
Widespread use of technical guidance & training curricula
Review of performance and lessons learned
Ensuring sustainability and mainstreaming of CS for Energy
2.5 MONITORING AND EVALUATION OF IMPLEMENTATION ACTIVITIES Monitoring and evaluation of GFCS activities will be required on at least two levels: to assess activities’ progress, and to measure achievement in meeting the GFCS' larger goals
4 http://energy.gov/epsa/partnership-energy-sector-climate-resilience5 http://www.copernicus.eu/ 6 http://www.copernicus.eu/main/climate-and-energy
xii

PAC-5/Doc 3.2 Draft 1, p. xiii
for improved climate knowledge and communication. For both levels, standard project management tools and reporting procedures can be used, through agreement among relevant partners. The mechanism for the final evaluation of activities would also be identified by agreement among the activities’ partners to ensure that the reporting requirements of each partners’ organisation are met.
The definition of criteria for monitoring and evaluation would be specific to each project. A method for quantifying the financial costs and benefits of implementing GFCS activities for energy should be developed and included in the monitoring and evaluation processes. This information would be an important contribution to global efforts to attach value to activities the weather and climate communities develop in partnership with energy sector companies, and it could help make the case for further investment to strengthen the link between energy and climate.
Furthermore, given the importance of information, knowledge sharing and training to the success of GFCS, a monitoring and evaluation process also is required to assess whether GFCS activities implemented under this Exemplar served the purpose of improving outcomes for the energy sector such as more efficient and sustainable risk management practices through the adoption of improved weather and climate information. Did the activities enable stakeholder needs to be understood to better deliver climate services? Did they promote dialogue among climate service providers and energy stakeholders? Did they contribute to monitoring and evaluating the effectiveness of GFCS?
2.6 RISK MANAGEMENT OF ACTIVITY IMPLEMENTATIONThe principal challenge faced by GFCS in its initial stages will be to demonstrate its ability to add value. In this sense, the risks associated with implementing GFCS priority activities for energy include organizational complexity, leadership and management, resourcing, and support for coordination between the entirety of the energy industry (energy producers, transmission operators, etc.) and the weather and climate community in all its facets (research organisations, National Meteorological and Hydrological Services [NMHSs], private service providers, etc.). In other words, there needs to be significant and genuine buy in and ownership from the energy industry in order for partnerships and actions to apply climate services for the energy sector to occur.
In a broader sense, the challenge for GFCS is enabling effective communication between a sciences-led provider community and a business-driven sector. Decision-making will take place whether or not adequate climate information is available. Nevertheless, it is hoped that by making improved climate services available via implementation of GFCS as soon as possible decision-making will be aided, and the desired outcome – that of reducing risks or reducing costs of the decision – will be promoted.
In addition, without mobilizing and sustaining financial resources at global, regional, and national levels via engagement of the energy sector, implementation of the Exemplar will be hampered. The energy industry might still continue to develop their own climate services but, without the overarching framework provided by the GFCS, duplication of efforts would be more likely; similarly execution time would be slower. Therefore the GFCS Secretariat and the coordinating/implementing entity for the Energy Exemplar, will need to make active efforts to identify, raise and sustain funding for the development of relevant and effective climate service activities. Rigorous M&E linked to energy outcomes will help mainstream climate services as an essential contributor to the energy sector, including enhancing climate risk management, and thus leverage resources for mainstreaming climate in all relevant aspects of energy projects across the five focus areas.
More specifically, Exemplar implementation risks may include:
xiii

PAC-5/Doc 3.2 Draft 1, p. xiv
1. High expectations from the energy users’ side for robust and highly accurate weather and climate information and services;
2. Inadequate availability of, or access to, relevant weather and climate data, including limitations of the science, deficient translation of science into decision-relevant information, poor communication of the information and services (particularly acute in developing countries);
3. Ineffective process to communicate and disseminate decision-relevant information to users;
4. Difficulties in establishing an effective engagement channel with the energy industry; 5. Dearth of qualified weather and climate experts (particularly acute in developing
countries);6. Lack of, or inadequate, guidelines in the collection and use of weather and climate
information.
xiv

PAC-5/Doc 3.2 Draft 1, p. xv
3. ENABLING MECHANISMSThe Energy Exemplar success can be improved by building synergies with existing activities (both within the energy sector and across the other GFCS priority areas), strengthening partnerships, and effective review, communication and resource mobilization. Investment in these mechanisms can ensure the necessary conditions are met and sustained, and energy sector priorities needs for climate services are met.
3.1 SYNERGIES WITH EXISTING ACTIVITIES Synergy with existing energy agendas and operations is not only an enabling mechanism, but also a necessary condition for the Exemplar implementation. As indicated in section 2.1, the stock-take and harmonisation principles are key to the enhancement of synergies within the energy sector. Thus, to ensure immediate progress and results, this Exemplar will benefit by learning from existing activities at global, regional, and national scales (see Annex 2) while attempting to provide an overarching thread to these activities through GFCS. Proper application of these two principles, would then allow a more efficient and effective development of new activities/services.
However, synergies should be also sought across the initial four GFCS priority areas (agriculture and food security, water, health and disaster risk reduction). Indeed, requirements on quality of meteorological observations and/or of forecasts are often of a similar nature across societal sectors. Thus, for instance, observations collected for water management may be useful also for hydropower generation. Similarly, solar radiation data used for agricultural purposes would be of value to the solar industry too. Climate model information is another common area with the other priority areas. In addition, there are other apparent potential cross-sector synergies, such water and energy – as with competition of water resources for electricity generation, oil refining, irrigation of energy crops or human water consumption (e.g. SEI 2014) – or agriculture and energy – as with land competition for food and biofuels production (e.g. Schaeffer et al. 2012). If properly addressed, such cross-sector issues can be harnessed to ensure climate services become even more relevant. Therefore, and in order to avoid costly duplication of effort, synergies between energy and each of the four current GFCS priority areas should be sought when developing new activities/services.
Annex 4 outlines existing partnerships, institutions, projects, and mechanisms that serve as initial points of engagement for the Exemplar. Almost all partners, even those based in OECD countries, either operate internationally or may serve as a resource base for capacity building, technical transfer, and collaboration with developing country partners.
3.2 BUILDING NATIONAL, REGIONAL AND GLOBAL PARTNERSHIPS The strength of future partnerships will depend upon multiple factors including the political support for the Framework by government and energy partners, the flexibility to advertise successful experience to encourage engagement, the ability to secure adequate financing, the effective establishment of a functional and communicative coordinating body. This Exemplar must offer concrete incentives, opportunities and advantages for partners to engage.
One of the central principles of GFCS is that its structure and activities should build on existing partnerships and avoid duplication. This principle can be implemented through active engagement in the working mechanisms, programmes and activities of existing energy networks and key organizations at national, regional and international levels. Linking with partners in ongoing global and regional work will be perhaps the most important component of such engagement. Working at the global and regional levels will ensure that stock-take and harmonisation of current activities, with the assistance of relevant global industry associations, can be achieved in a more systematic and effective way.
xv

PAC-5/Doc 3.2 Draft 1, p. xvi
The stakeholders in the energy sector are many and varied. They include energy exploration companies, generators, site operators, transmission operators, distribution operators, market operators, energy traders, private service companies, NMHSs, universities, national, state and local governments, non-profit organisations, national and international associations, the general public and many others – Annex 4 provides a list of stakeholders, with which possible partnerships can be formed. Given the wide scope of the energy sector, mechanisms for involvement and interactions also vary significantly, from high-level Ministerial Councils to local meetings and also involve media-based awareness raising and information distribution mechanisms.
Specifically at the global level, effective partnerships could be strengthened between the Energy Exemplar and organisations such as World Bank and WBCSD. In Ebinger&Vergara (2011), the World Bank's ESMAP highlighted a number of actions, which would benefit from strong partnerships (e.g. support awareness and knowledge exchange, see Annex 5 for a comprehensive list of suggested actions). Similarly, WBCSD (2014) provides a number of recommendations, which would be effectively enacted by partnerships between energy experts and the meteorology community (e.g. organize effective pooling of technical expertise, see Annex 6 for the full list of recommendations). Partnerships with other international and regional efforts such as GEO/GEOSS, IEA, IRENA, WEC or the US DOE and the EU Copernicus are also important for a successful implementation of the Exemplar.
While flexibility in approach is essential, a key role of the GFCS, as an overarching global effort, will be to ensure partnerships that include as many stakeholders as possible in the value chain, i.e. from energy exploration to consumption, are built. Such partnerships would have the potential to attract a solid buy-in from additional industry players and hence lead to the strongest outcomes.
3.3 REVIEW MECHANISMSThe mechanisms for review and evaluation of the Energy Exemplar implementation activities will be agreed with GFCS partners, through the coordination of a coordinating/implementing entity, to ensure that the reporting requirements of each organisation are met.
Long-term success of the overall Exemplar will be assessed in terms of improved climate-informed energy decision-making that results in outcomes such as more efficient energy supply, reduced impacts on energy infrastructure, lower overall energy costs, and increased access to energy. In the shorter-term, Success will be shown through metrics that capture the adequate access to, and appropriate application of, weather and climate information to energy decisions.
In terms of accountability, the Exemplar should:
Establish a results-based monitoring and evaluation framework to quantify how energy decision-making has improved with the availability and use of climate services, through metrics that capture outcomes such as improved relevance and quality of forecasts for energy demand and supply, effectiveness of warnings for energy infrastructure impacts, and achievement of better awareness of climate and energy interactions;
Develop and apply monitoring and evaluation standards for existing and new interventions, and develop indicators, particularly related to economic costs and benefits;
Integrate reporting on delivery of the GFCS into the existing governance mechanisms for meteorological agencies, and energy agencies, possibly including the UN-Energy, and equivalent bodies at the regional and national level;
Adopt financial reporting and auditing processes that comply with the standard criteria of WMO and/or UN.
xvi
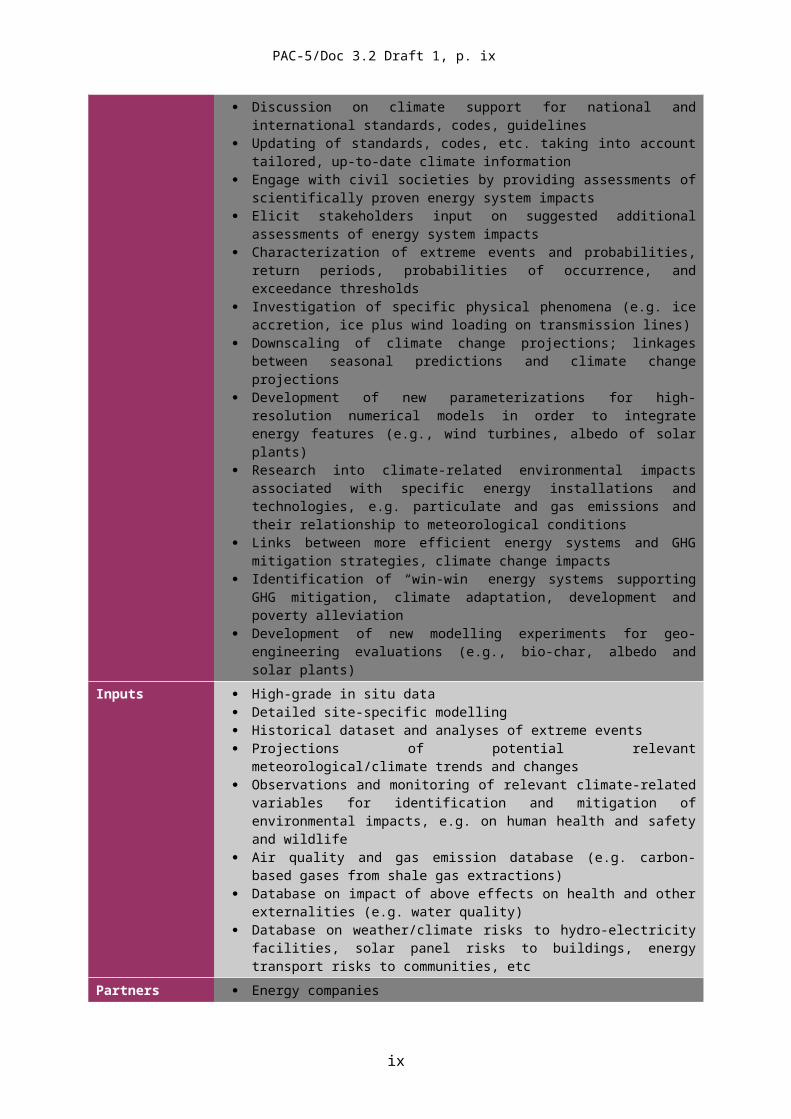
PAC-5/Doc 3.2 Draft 1, p. xvii
3.4 COMMUNICATION STRATEGYCommunication is a vital area of work necessary to strengthen partnerships between the energy sector and the meteorological community towards the development of useful and effective climate services. To this end, key messages the GFCS should deliver are:
The opportunity offered by GFCS: potential partners need to know that a framework is now available to develop climate information activities/services in a more effective way;
The benefits of collaboration: potential partners need to understand the final products that could result from collaboration, such as new tools for improved climate risk management decisions, or information factsheets to inform the energy sectors about latest developments by the climate community;
What is available and what is possible: climate service providers need to be able to describe in non-technical terms the existing technologies and climate products (such as their specifications and formats), as well as their limitations;
Willingness to understand and improve: climate service producers must show willingness to take time to understand potential partners' climate information requirements and the information used for energy;
Willingness to jointly develop, test and upgrade climate products: climate service producers must convey willingness to work with other stakeholders, rather than alone in, say, meteorological services, by also establishing community of practice, and network of partners and experts supporting and implementing climate and energy work;
Willingness to be proactive: climate service providers need to be keen to engage the energy industry in information sessions, via such mechanisms as webinars, workshops and community events.
Several national, regional and international events are being established which would represent ideal forums for the communication of (some of) the above points towards a better engagement between the energy industry and the weather and climate community. Amongst those are the International Conference Energy & Meteorology series, the American Meteorological Society sessions on Weather, Climate, and the New Energy Economy and the European Meteorological Society sessions on Energy Meteorology (for more detail refer to Annex 2).
xvii

PAC-5/Doc 3.2 Draft 1, p. xviii
4. RESOURCE MOBILIZATIONThe success of the Energy Exemplar will be a function of the effectiveness of communicating the benefits of this initiative, and leveraging existing and new resources and partnerships. Mobilizing manpower and material are the foundations needed in order to benefit from a systematic framework for the delivery and uptake of both general and targeted climate information services. At present the arrangements for provision of climate services for energy, in many instances, fall short of meeting the identified needs. There is vast, and as yet largely untapped, potential to improve these arrangements and enhance the quality and utility of climate services for the benefit of many countries and all sectors of society.
This Exemplar is critical, given ongoing investments in energy systems and increasing amounts of investment needed in coming years. To 2035, annual investment needs are projected to steadily rise towards $2 trillion, while annual spending on energy efficiency increases to $550 billion. This means a cumulative global investment bill of more than $48 trillion. It is important that these investments incorporate the best climate information, particularly since infrastructure investments cast a long shadow into the future (WEIO 2014).
4.1 GLOBAL TO NATIONAL LEVELSWhile many services/activities can and will be implemented at national level, a pro-active resource mobilization from a GFCS perspective would be best targeted at the global, or perhaps regional, levels. Working at these levels would allow the GFCS to maintain focus on the overall framework, and help harmonise activities at a high level in a more effective way.
At these global and regional levels, there are a number of energy associations/organisations whose involvement in mobilizing resources would be critical. These are essentially the same organisations which have demonstrated a direct interest in issues at the intersection between energy, weather and climate through, inter alia, the publications referred to in the introduction,namely: WB/ESMAP, WBCSD, WEC, ADB, IEA, and IRENA. Not only have these organisations made important recommendations for strengthening the link between energy and weather and climate in their publications (e.g. WBCSD’s recommendation ‘organize effective pooling of technical expertise’, see Annex 4), ESMAP, for instance, has been mobilizing resources by investing in a multi-million dollar project to map renewable energy resources in many developing countries7. Partnering with these organisations would facilitate resource mobilization by assisting to navigate international funding procedures for development, environment and climate-change adaptation in the context of energy resilience, access, efficiency and sustainability.
In general, effective resource mobilization can be achieved through Development banks and Climate funds (see WMO 2014a). In the case of this Exemplar, direct involvement of the private sector, possibly via industry associations, can also be an effective way to mobilise resource.
4.1.1. Development Banks
These are the World Bank and Regional Development Banks (African Development Bank, Asian Development Bank, European Bank for Reconstruction and Development, Inter-American Development Bank, etc.)
4.1.2 Climate Funds
The following are the key Funds related to climate change that countries might approach in support of the Framework:
7 http://www.esmap.org/RE_Mapping
xviii
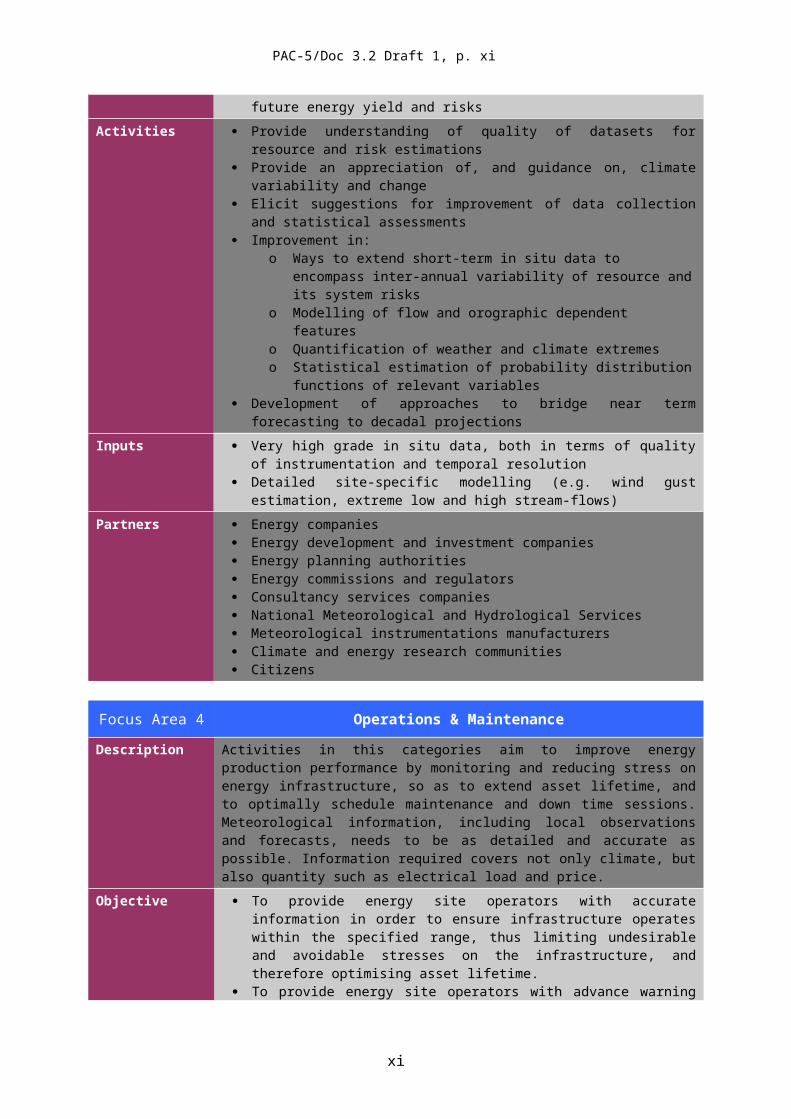
PAC-5/Doc 3.2 Draft 1, p. xix
Adaptation Fund: It finances concrete adaptation projects and programmes in developing countries that are Parties to the Kyoto Protocol;
Climate Investment Funds: It provides additional financial resources to developing countries in order to help them mitigate and manage the challenges of climate change. It aims to pilot and demonstrate ways in which climate risk and resilience may be integrated into core development planning and implementation. More than 60% of the projects within this programme portfolio have a strong meteorological (including climate) component;
Green Climate Fund: It channels additional financial resources to developing countries in order to assist them in adapting to and mitigating climate change, as well as catalysing climate financing (public and private) at the international and national levels;
The Global Environment Facility (GEF): It is an independent financial organization that provides grants to developing countries and to countries with economies in transition for projects related to biodiversity, climate change, international waters, land degradation, the ozone layer and persistent organic pollutants.
4.1.3 Private Sector
While much of the responsibility for driving climate change solutions that address the needs of the poorest and most vulnerable rests with governments, it has become increasingly clear that business will be an essential partner in building resilient, efficient and sustainable energy systems. The private sector has much to contribute to developing and implementing climate change adaptation solutions, including sector specific expertise, technology, significant levels of financing, efficiency and an entrepreneurial spirit. This is particularly valid in the case of the energy industry.
Thus, the energy Exemplar could be used as a platform to consider new forms of public-private partnerships for building climate services to tackle the most complex challenges to sustainable development and climate resilience for the energy sector. International corporate associations such as WBCSD, GSEP8, WEC, GWEC, provide pertinent avenues for bringing this Exemplar to the private sector and for engaging in dialogue on how the private sector can provide support.
8 The Global Sustainable Electricity Partnership: http://www.globalelectricity.org/en/
xix

PAC-5/Doc 3.2 Draft 1, p. xx
5. SUMMARY OF PRIORITY ACTIVITIES/PROJECTSAn effective implementation of the Energy Exemplar will benefit from focussed initial priorities. As discussed in the previous sections, such priorities will need to include the following activities:
1. Energy organization(s) partnership identification and formationa. This process will involve one-to-one, as well as broader, meetings to
consolidate relationships with key potential partners for the co-development of the Energy Exemplar; such organizations include WB/ESMAP, WBCSD, WEC, IEA, and IRENA;
b. Proposal for an Energy Exemplar implementation partnership with select organization(s), including clear commitment on common development plan for this Exemplar and identification of appropriate funding sources (e.g. Adaptation Fund, Green Climate Fund)
2. Pilot activity(ies)/project(s)a. Identification of opportunity(ies) and country(ies) for initial pilot
activity(ies)/project(s)b. Stakeholder workshop to consult relevant collaborators for the design and
implementation of the pilot activity(ies)/project(s)c. Capacity building and support activity(ies) to train relevant personnel for the
implementation of the pilot activity(ies)/project(s)3. Knowledge sharing
a. Development of a communication strategy and its implementation, including via the establishment of an informative website and an active Twitter account Consultation workshop to define terms of reference for an initial stock-take activity
b. Stock-taking through a systematic analysis of relevant products and services (an initial assessment is provided in this Exemplar, particularly with Annex 2)
All the above activities will have to be appropriately formulated through a standard project planning approach – with definitions of tasks, deliverables, milestones, people and funding allocations. Also for the Exemplar to demonstrate solid progress, and as an indicative timeframe, these activities will need to have reached a very advanced stage by the end of the first year from the start of the implementation of this Exemplar. An organisation like WEMC may be tasked to actively assist with the Energy Exemplar implementation.
xx

PAC-5/Doc 3.2 Draft 1, p. xxi
ANNEXES
ANNEX 1 – CLIMATE-SENSITIVE ENERGY SUB-SECTORS: A SELECTION This Annex provides an overview of a selection of energy sub-sectors in the context of climate services. These sub-sectors are solely meant to provide a more specific context to better conceptualize the Exemplar. Each of the selected (power) sub-sectors – wind, solar, hydro and thermal – are presented following a similar structure, namely i) the importance of the sub-sector, ii) its interaction with the surrounding environment and iii) its needs in terms of climate services.
It is worth noting that for each sub-sector the specifics of climate services have considerable overlaps across the different focus areas (see section 1.5.1). Thus, while attempts are made to define distinct requirements for each focus areas, in order to avoid unhelpful repetitions, only brief mentions of requirements will be mentioned for successive focus areas. Throughout, it is useful to refer to Table 2 for additional details about energy industry requirements. Moreover, as a rule-of-thumb, the accuracy of weather and climate information generally needs to be progressively higher, going from area one (Identification and Resource Assessment) through to five (Energy Integration).
A1.1 Wind Power
A1.1.1 Importance of Wind Power for SocietyWind energy offers significant potential for near-term (2020) and long-term (2050) GHG emissions reductions. A number of different wind energy technologies are available across a range of applications, but the primary use of wind energy is to generate electricity from larger, grid-connected wind turbines, deployed either on- or offshore. Wind power capacity installed by the end of 2013 was capable of meeting roughly 1.2% of worldwide total energy consumption (REN21 2015), and that contribution could grow many-fold by 2050 if ambitious efforts are made to reduce GHG emissions and to address the other impediments to increased wind energy deployment (IPCC 2011; WER 2103). Onshore wind energy is already being deployed at a rapid pace in many countries, and no insurmountable technical barriers exist that preclude increased levels of wind energy penetration into electricity supply systems. Moreover, though average wind speeds vary considerably by location, ample technical potential exists in most regions of the world to enable significant wind energy deployment.
In some areas with good wind resources, the cost of wind energy is already competitive with current energy market prices, even without considering relative environmental impacts. Indeed, onshore wind energy is a tried and tested technology that is already cost competitive with conventional power in some parts of the world, for example in Australia, Brazil and parts of the United States, among others (IPCC 2011; IEA 2014b). Nonetheless, in most regions of the world, policy measures are still required to ensure rapid deployment. However, subsidies to onshore wind are projected to reach a peak just before 2020 and then decline steadily as it becomes competitive with conventional power plants in many locations (WEO 2014).
The total wind resource is vast and is estimated to be around a million GW ‘for total land coverage’. If only 1% of this area was utilised, and allowance made for the lower load factors of wind plants (15–40%, compared with 75–90% for thermal plants) that would still correspond, roughly, to the total worldwide capacity of all electricity-generating plants in operation today (WER 2013). However, electricity generation from wind turbines is constrained by the varying availability of wind. This can make it challenging to maintain the necessary balance of electricity supply and consumption at all times. Consequently, the cost-effective integration of variable renewable energy (VRE, therefore including other
xxi

PAC-5/Doc 3.2 Draft 1, p. xxii
variable sources, namely mainly solar technologies) has become a pressing challenge for the energy sector. Based on a thorough assessment of flexibility options currently available for VRE integration, large shares of VRE (up to 45% in annual generation) can be integrated without significantly increasing power system costs in the long run (IEA 2014a). It is also clear that the role of high quality weather and climate information is a crucial component towards the achievement of such a cost-effective integration.
A1.1.2 Wind Power and its Interaction with the AtmosphereWind power harnesses the kinetic energy of moving air. Wind is available virtually everywhere on earth, although there are wide geographical variations in wind strengths. Technological advancements have led to a dramatic increase in wind turbine size, and hence their power, over the last 30-40 years (Figure 4). For instance, while in the early 1980’s wind turbines 15-20 meter high, with a power of 15-100 kW were available, by the early 2000’s turbines exceed 100 m in height (and a few megawatt [MW] in power), to our days when turbines have reached heights of around 200 m and are expected to further increase, particularly for offshore applications (Kaldellis 2012; IEA 2013).
In terms of interaction with the atmosphere, this technological evolution has meant that it has become much more critical to understand exactly how wind turbines are affected by the wind flow. In turn, it is crucial to identify the weather and climate variables of most relevance to the wind energy industry. Early onshore wind turbines had a rotor diameters much smaller than the vertical extent of the atmospheric surface layer which is roughly 80–100m deep. With the increasing size of turbines, the hub height of multi-MW turbines is now often above the atmospheric surface layer and rotor diameters larger than 100 m are becoming common. Offshore turbines with diameters larger than 160 m and a power of 7 MW have already been designed and will be deployed in the near future. This leads to much more complicated interactions between the turbines and the lower atmosphere. Weather and climate features that had been considered as irrelevant for a long time are now becoming decisive for planning and running single, large turbines and increasingly larger wind parks (Emeis 2014). In particular, vertical gradients in mean wind speed and wind direction as well as in turbulence intensity above the surface layer are critical to the construction, planning and operations of wind turbines. Similarly the impact of wind turbines and wind parks on the wind flow is another very important meteorological consideration.
In terms of measurements of the key weather and climate variables, onshore surface layer winds are relatively easy to assess, because in situ measurements from masts can be made with reasonable effort in order to calculate turbine loads and energy yields. Logarithmic and power laws that describe the vertical wind profiles in the surface layer allowed for reliable vertical interpolations and extrapolations in flat and homogeneous terrain. However, with the current much larger, the relevant wind parameters can no longer be fully obtained by masts. New measurement techniques are required to collect the necessary wind information. This has led to a boom in surface-based remote sensing techniques such as wind lidars (Emeis 2014).
xxii

PAC-5/Doc 3.2 Draft 1, p. xxiii
Figure 4 – Growth in size of wind turbines since 1980 and prospects (IEA 2013, adapted from EWEA 2009)
In addition, it is likely that offshore wind parks will deliver a considerable proportion of the wind energy in the future, because of the wider available space and the usually higher wind speeds compared to onshore sites. Therefore, marine boundary-layer weather and climate variables need to be assessed too. Until a few years ago, experimental data for the marine atmospheric boundary-layer were available, if any, for only a shallow layer explored from buoys, ships and oil riggs. A few masts, such as the three German 100 m high Forschungsplattformen in Nord- und Ostsee (FINO) masts, have been erected in the last 10 years. They are presently delivering long-term information on a deeper layer of the marine boundary for the first time (Emeis 2014).
While largest wind turbines tend to attract most interest as they produce the bulk of wind power, it is important to note that there is a wide range of turbine sizes available commercially, from small battery-charging machines with ratings of a few Watts, up to, say 100 kW for farm use (WER 2013). Although such turbines are relatively more expensive than their larger counterparts, they are generally not competing with electricity from large thermal power stations and may be the only convenient source of power - possibly in conjunction with batteries or diesel generators. In developing countries small wind turbines are used for a wide range of rural energy applications, and there are many ‘off-grid’ applications in the developed world as well – such as providing power for navigation beacons and road signs (WER 2013). The size and siting of such small turbines clearly have implications for the (different) type of weather and climate variables required for their operations, particularly if they are sited in complex terrains such as in urban environments.
Finally, it is also worth mentioning the higher-altitude wind power systems, which although still in a development phase, they have recently received some attention as an alternative approach to generating electricity from the wind. A principal motivation for the development of this technology is the sizable wind resource present at higher altitudes. Two main approaches to higher-altitude wind energy have been proposed: (1) tethered wind turbines that transmit electricity to earth via cables, and (2) base stations that convert the kinetic energy from the wind collected via kites to electricity at ground level. A variety of concepts are under consideration, operating at altitudes of less than 500 m to more than 10,000 m. Though some research has been conducted on these technologies and on the size of the potential resource, the technology remains in its infancy, and scientific, economic and institutional challenges must be overcome before pilot projects are widely deployed (Wiser 2011).
Table 4 – Benefits and drawbacks of wind
xxiii

PAC-5/Doc 3.2 Draft 1, p. xxiv
Benefits DrawbacksLow operating costs. Best locations for wind sites are often far
from demandNo waste or CO2 emissions Some pollution in the production of the
wind turbinesOnly a small plot of land is used Non flexible & variableDomestic source of energy Noise and aesthetic pollutionFree & clean fuel source Biodiversity affectionCost-competitiveness is being increasedUseful for remote areasEnourmous potential
A1.1.3 Needs of Wind Power Sector for Climate ServicesIn this section the needs of the wind power industry in terms of climate services for each of the five focus areas are discussed. To this end, it is useful also to refer to a practical process adopted by wind power developers, as the one shown in Figure 5.
A1.1.3.1 Identification and Resource AssessmentIn the identification and resource assessment phase, historical (and possibly projected) wind climate information is critical to identifying the best sites for the development of a wind power plant. Such information is normally referred to the wind resource, and it is used to assess not only how much power the plant could potentially produce over its expected lifetime but also to learn about the statistical features of the resource (e.g. inter-annual variability) as these are important considerations for instance for financial agreements. The process of quantifying the characteristics of the wind is referred to as resource assessment.
Figure 5 – An illustration of the wind energy installation development process is South Africa, from a developer’s perspective (IEA 2014b).
It is important to realize however that, particularly from a UIP perspective, wind resource assessment is just a (relatively) small piece of a wind farm development process (Figure 5). Other key enabling factors and constraints need to be considered too. These
xxiv
PAC-5/Doc 3.2 Draft 1, p. xxv
include the reach of the transmission network, transmission flow patterns between different parts of an area, protected areas (including for landscape, environmental, military or civil transportation purposes), and potential cumulative effects on protected or endangered species. Using this information, governments can develop a policy framework that specifies where wind power deployment is encouraged and facilitated, where it is simply permitted, and where it is restricted or excluded (ESMAP 2012). Depending on the policy framework, there could be several barriers that delay the deployment of wind energy and the achievement of targets set in energy policy. Permit/authorisation delays and high costs for administrative and grid connection procedures are issues in many countries. Other barriers relate to the lengthy approval of environmental impact assessments (EIAs), compliance with spatial planning, the number of parties involved, an absence of information on the grid connection capacity, a lack of planning for grid extension and reinforcements, insufficient grid capacity and land ownership (IEA 2013).
Despite the potential complexity of the policy framework, it is undisputable that reliable wind resource data are crucial ingredients in providing the certainty sought by commercial wind power developers. The process of identifying the wind resource normally starts from pre-competitive large-scale regional maps, often produced via mesoscale modeling, and with the financial support of national governments. While providing useful broad appraisals of the wind resource, coarse resolution data, as it is often the case in such assessments, have very serious drawback as hills and ridges are normally not as well resolved. Such orographic features tend to yield to increased wind speeds. Consequently, coarse resolution leads to an erroneous negative bias in the wind resource (Gryning et al. 2014).
Work is also ongoing at the international level to develop a consolidated Global Atlas for Wind (and Solar), drawing on previous initiatives such as the Solar and Wind Energy Resource Assessment (SWERA), and on the datasets that are already publicly available in most developed, and some developing, countries. Such large-scale maps offer a pre-competitive assessment of the wind resource and they are used to identify potentially high-yielding wind power sites. However, the lack of reliable ground-based data in many developing countries limits the accuracy of these resource assessments. A recent effort by the International Renewable Energy Agency (IRENA) to catalogue existing resource mapping studies concluded that the lack of a dense measurement network is the main reason for the limited number of maps and GIS portals in Africa and Oceania (IRENA, 2012). While country level resource assessment does not replace the need for site-specific, micro-level assessment (e.g. to determine the best location for a wind farm within a defined area, and the optimal location of individual turbines within a wind farm), the data obtained from country level measurement campaigns can be used for evaluation purposes, which can further shorten project development timelines and increase certainty. Therefore, country level resource assessment, mapping and spatial planning should be viewed as a ‘public good’ that has significant potential to increase investment, shorten deployment times, and reduce development costs. For countries with limited or zero penetration of a particular renewable electricity option, resource mapping can be the first step in increasing awareness and encouraging investment (ESMAP 2012).
Thus, climate services information systems (CSIS) would consist of maps and more generally datasets generated by using, and also combining, as many sources of wind data as possible (in situ, remote sensing, modeled via mesoscale/regional models). Uncertainty estimates of wind data would also be very useful, even if efforts and computer resources are often directed to producing the highest resolution possible rather than different estimates of the same resource. Wind data from climate projections, in principle a more appropriate source of data than past data for the estimation of power yield of a planned wind farm, should also be adopted. However, these projections are currently considered not of high enough quality for them to play an important role in the resource assessment.
xxv

PAC-5/Doc 3.2 Draft 1, p. xxvi
Observations and monitoring (OBS/MON) of wind data for pre-competitive resource assessment would be carried out at as many sites as possible so as to have an adequate geographical coverage but also a dense enough sampling of wind at different heights. However, being highly dependent on orography and height, wind can never be sampled well enough. That is why numerical/physical modeling is critical in filling spatial gaps and also for extending wind time series to periods when data are not available – typically high quality wind data, particularly mast data at heights of tens of meters, are only available for periods of up to 10 years. It is therefore critical the role of the research modeling (RMP) pillar, as physical models require continuous improvements both in terms of representation of processes and in terms of increased time/space resolution. In turn, quality wind observations are key to guiding the development of physical models.
Overall climate services for the identification and resource assessment of wind power require a high level of sophistication, involving quality and long-term wind data, physical modeling at high resolution, and refined techniques of assessment and data combination. Each of these aspects needs a non-trivial level of technical preparation, capital investment funding and computer resources, which are often present in developed countries, but definitely lacking in developing countries. Capacity building activities such as those implemented by the Energy Sector Management Assistance Program administered by the World Bank (ESMAP 2012) should therefore be strengthened. Contributions from the wind power industry could also be harnessed, in order to both ensure relevance of outcomes and possibly leverage investments.
A1.1.3.2 Impact Assessment
Infrastructure Impacts – Wind turbines and their towers, as any other infrastructure, are engineered to sustain well-defined environmental-related loads. A wide variety of loads have to be considered in the wind turbine design, from the aerodynamic, to the hydro-dynamic, to the gravitational, to the inertial, to ice and soli interactions loads (Karimirad 2012). For instance, wind turbines cannot operate above a certain wind threshold, the cut-out speed, typically between 20 to 30 m s-1 depending on the size of the turbine. Above the cut-out speed, power production is ramped down so as to protect the machine from heavy loading (Carta 2012, Zafirakis et al. 2012). The frequency and intensity of wind gusts, that is, wind speeds exceeding a certain wind speed for time durations of a few seconds, is also of major concern for the evaluation of a site.
Damage could also derive from turbulence induced by nearby turbines via wakes. The dynamic part of the wind speed, turbulence, includes all wind speed fluctuations with periods below the spectral gap. The spectral gap occurs around 1 h, which separates the slowly changing and turbulent ranges. Turbulence has a major impact on aero-elastic structural response and electrical power quality. One useful parameter is the turbulence intensity, which is defined as the ratio of the standard deviation of the wind speed to the mean wind speed. The turbulence intensity decreases with height. The turbulence intensity is higher when there are obstacles in the terrain; hence, the turbulence intensity for an offshore site is less than that for a land site. Ice can cover both the nonrotating parts of the turbine and the rotating parts (mainly the blades). The blades of a shutdown turbine can be covered by ice with an ice thickness up to several centimeters leading to extra roughness and stronger aerodynamic forces (Karimirad 2012).
Environmental Impacts – No energy source is free of environmental effects. As renewable energy sources make use of energy in forms that are diffuse, larger structures, or greater land use tend to be required and attention may be focused on the visual effects. In the case of wind energy, there is also discussion of the effects of noise and possible disturbance to wildlife – especially birds (WER 2013). Ensuring that the local community is fully briefed on the environmental implications of a planned wind farm, and particularly on the action taken by the wind farm developer to mitigate possible environmental impacts, is key to avoiding unnecessary delays in the construction, and subsequent operations, of the wind farms. In
xxvi

PAC-5/Doc 3.2 Draft 1, p. xxvii
fact, lengthy wind project approvals due to tortuous environmental impact assessments and/or lack of social acceptance are not uncommon (IEA 2013). In addition to the possible direct environmental impacts of wind farms, the public should also be informed about the indirect positive effects of wind farms, such as the reduction in greenhouse gas emissions and a possibly improved air quality due to the offsetting of likely more polluting traditional power plants.
Wind turbines emit noise from the rotation of the blades and from the machinery, principally the gearbox and generator. The noise level near the cut-in wind speed is important since the noise perceived by an observer depends on the level of local background noise in the vicinity, and this has a masking effect. At very high wind speeds, on the other hand, background noise due to the wind itself may be higher than noise generated by a wind turbine. The intensity of noise reduces with distance and it is also attenuated by air absorption. The exact distance at which noise from turbines becomes ‘acceptable’ depends on a range of factors, especially local planning guidelines (WER 2013). Climate services can therefore assist for instance in determining specific wind characteristics, such as occurrences of high wind events at different times of day, particularly during those times when local residents are likely to be most affected by noise disturbances.
The need to avoid areas where rare plants or animals are to be found is generally a matter of common sense, but the question of birds is more complicated and has been the subject of several studies. Problems arose at some early wind farms that were sited in locations where large numbers of birds congregate - especially on migration routes. However, such problems are now rare, and it must also be remembered that many other activities cause far more casualties to birds, such as the ubiquitous motor vehicle (WER 2013). Although a rather specialized use of weather and climate information, local flow data in the vicinity of wind farms could be used as input to evaluations of avian dynamics.
One of the more obvious environmental effects of wind turbines is their visual aspect especially that of a wind farm comprising a large number of wind turbines. There is no measurable way of assessing the effect, which is essentially subjective. As with noise, the background is important (WER 2013).
There are also some indications about a potential beneficial impact on nearby agriculture activity due to the enhanced mixing driven by the wind turbines’ rotation.
A1.1.3.3 Site Selection & Financing With pre-competitive planning data, observations and modeling of wind data do not necessarily need to focus on a specific site. With site selection and financing however wind data needs to be as accurate as possible for the site where the planned wind power farm is intended to be constructed. Thus, wind data has to be collected at the site of interest, using the best possible approach (ideally using mast data, but also lidar), including wind at several heights and at a few locations around the site, noting that the extent of a large wind farm can be tens of kilometers and hence with potentially differing wind characteristics within the same wind farm. Detailed monitoring and modeling are also required to assist with the evaluation of spatially inhomogeneous wind fields in complex terrain or wakes behind turbines. Wakes can lead to reduced wind speeds and enhanced levels of turbulence, with consequent reduced yields and enhanced loads on downwind turbines (Emeis 2014).
A1.1.3.4 Operations and maintenance Proper management of operating wind farms is critical to maximising returns on investment. Besides the day-to-day management, a wind farm operator will pro-actively seek to extract every possible hour of availability from the turbines. Thus, the primary aim of wind farm
xxvii

PAC-5/Doc 3.2 Draft 1, p. xxviii
operations and maintenance is to minimise the production costs per unit of energy generated over the life of the asset. Broadly, this is achieved by9:
1. Minimising operational and maintenance costs2. Improving turbine performance/yield3. Lowering insurance risk4. Protecting assets.
To achieve these goals, wind farm operators require site-specific forecasts, which are normally developed using statistical techniques often with predictors taken from the output of weather and/or climate prediction models. For instance, the National Center for Atmospheric Research (NCAR)/Xcel Energy Wind Power Forecasting System ingests external, publically available weather model data and observations. High-resolution Numerical Weather Prediction (NWP) simulations assimilate specific local weather observations. The weather observations range from routine meteorological surface and upper air data to data from the wind farms, including wind speed data from the Nacelle anemometers. An ensemble of somewhat coarser NWP runs provides an additional best estimate of wind speed and also includes uncertainty information. Finally, to optimize estimates of short-term changes in wind power requires nowcasting technologies such as the Variational Doppler Radar Analysis System (VDRAS) and an Expert System (Haupt et al. 2014).
A1.1.3.5 Energy Integration
The Australian Wind Energy Forecasting System (AWEFS)10 was established in response to the growth in variable generation in the National Electricity Market (NEM) and the increasing impact this growth was having on NEM forecasting processes. Operational since 2008, AWEFS’s aim is to provide better forecasts to drive improved efficiency of dispatch and pricing, and permits better network stability and security management. Its implementation project had two broad objectives:
Facilitating the operation of the market through more accurate wind generation forecasts;
Facilitating research to improve the quality and dimension of the forecast over time to accommodate other renewable types such as solar.
Specifically, AWEFS produces wind forecasts with lead times up to two years ahead for planning purposes and better allocate spinning reserves. The strength of AWEFS lies in blending various statistical models.
Resource assessment and forecasting can also increase wind farms efficiency through appropriate deployment of turbines within a wind farm so as to reduce wakes and also assist in assessing the optimal location of wind farms to take account of seasonal/interannual wind variability to balance other forms of generation to better meet variable/seasonal demand.
Moreover, wind power hedges are being developed, that allow investment protection. The protection, as developed by Swiss Re, is based on a Wind Production Index, which is a function of the measured wind speed and the turbine's power curve expressed in produced MWh (implicit production). Wind protection pays for itself by permitting sponsors to11:
Get an investment financed (in case debt is limiting factor) Optimize capital structure Reduce volatility from cash flow Hedge obligations under power purchase agreements.
9 http://www.wwindea.org/technology/ch03/en/3_1_1.html 10 http://www.aemo.com.au/Electricity/Market-Operations/Dispatch/AWEFS11 http://www.icem2013.org/wp-content/uploads/2013/08/01_StuartBrown.pdf
xxviii
PAC-5/Doc 3.2 Draft 1, p. xxix
A1.2 Solar Power
A1.2.1 Importance of Solar Power for SocietySolar energy is the most abundant energy resource. About 60% of the total energy emitted by the sun reaches the Earth’s surface. Even if only 0.1% of this energy could be converted at an efficiency of 10%, it would be four times larger than the total world’s electricity generating capacity of about 5 000 GW (WER 2013). Also, solar energy offers significant potential for near-term (2020) and long-term (2050) GHG emissions reductions.
The use of solar energy is growing strongly around the world, in part due to the rapidly declining solar panel manufacturing costs, also stimulated by national and regional subsidies. For instance, world Photovoltaics (PV) capacity in 2008 was 16 GW (for comparison, around a tenth of the 121 GW for wind) but in 2014 this had jumped to 177 GW (with 39 GW installed just in 2014, and a little less than half of the 370 GW for wind). The other technology used to convert solar power into electricity, concentrating solar power (CSP), contributes a much smaller 4.4 GW, as of 2014. In addition, solar energy is used to heat water via collectors, generating a total of 406 GWth in 2013 (REN21, 2015).
A1.2.2 Solar Power and its Interaction with the AtmospherePhotovoltaics (PV), solar heating and cooling, and concentrating solar power (CSP) are primary forms of energy applications using sunlight. Solar energy technologies harness the energy of solar irradiance to produce electricity using PV (via the photoelectric effect) and CSP (which produce electricity through an intermediary thermodynamic process). Such a distinction is critical as PV and CSP respond in different ways to solar irradiance. PV can produce electricity even under overcast conditions, as it is sensitive to the global component of irradiance, the sum of the two direct and diffuse irradiance components (see Figure 6). CSP, instead, can only function under the direct irradiance component (namely clear sky), and in fact broken cloud conditions are the most problematic for CSP operations. On the other hand, CSP has the capability to store the (thermal) energy produced, using materials such as molten salts, which allow a storage period of several hours. Although less common, concentration PV (CPV) is another available technology. CPV is photovoltaic using concentrated sunlight into the cell using an optic, as for CSP.
xxix

PAC-5/Doc 3.2 Draft 1, p. xxx
Figure 6 – Schematic of the solar irradiance (or radiation) components.
Accurate measurements of the incoming irradiance are essential to solar power plant project design, implementation and operations. Because irradiance data are relatively complex, and therefore expensive compared to other meteorological measurements, they are available for only a limited number of locations. This holds true especially for the direct irradiance component as it requires a solar tracking device, which is usually several times more expensive than good quality pyranometers, the latter used to measure global irradiance (Sengupta et al. 2015). Also, spatial correlation of direct irradiance typically is a few times smaller than global irradiance, therefore requiring more measurement sites to yield resource mapping of similar quality to global irradiance (e.g. Davy and Troccoli 2014).
Aside from the obvious crucial role of clouds in determining solar irradiance on the ground, atmospheric composition – water vapour, ozone and aerosols – is another very important factor. Aerosols are particularly relevant in certain areas such as near deserts, coastal areas or in polluted cities (the latter affecting rooftop PV production). Indeed, there are several types of aerosols – sea salt, desert dust, organic and black carbon, and sulfate – and they can affect the amount of available irradiance on the ground, potentially reducing it by up to a few tens of percent in areas with particularly high aerosol loading. For instance, a moderate smoke plume event, caused by bush fire burns, caused an overall reduction in PV output of 7% on average over a few hours and a peak reduction of 27% (Perry and Troccoli 2015).
In the absence of surface radiation measurements, estimates of surface radiation can also be made using meteorological ground measurements such as cloud cover, temperature, visibility, and water vapor in a radiative transfer model (Marion and Wilcox 1994).
Table 5 – Benefits and drawbacks of solarBenefits Drawbacks
Low operating and mainteinance costs Low conversion efficiencyNo waste or CO2 emissions Some pollution in the production of the
solar collectorsEnourmous potential Large areas of land are required for solar
xxx

PAC-5/Doc 3.2 Draft 1, p. xxxi
farmsDomestic source of energy Variable production, useful only during
sunny daytimeFree & clean fuel sourceUseful for remote areas
A1.2.3 Needs of Solar Power Sector for Climate ServicesIn a similar way to wind power, reliable solar information is required for every solar power conversion technology. This holds true for small installations on a rooftop as well as for large solar power plants. However, solar resource information is of particular interest for large installations, because they require a substantial investment, sometimes exceeding $1 billion in construction costs. Before such a project is undertaken, the best possible information about the quality and reliability of the fuel source must be made available. That is, project developers need to have reliable solar data at specific locations, including historic trends with seasonal, daily, hourly, and (preferably) subhourly variability to predict the daily and annual performance of a proposed power plant. Without these data, an accurate financial analysis is not possible (Sengupta et al. 2015).
Requirements for climate services by focus areas for solar power are very similar to those for wind power. The main differences are related to the accuracy of the meteorological variables needed for solar power devices – the direct irradiance is particularly problematic given the very limited number of observation sites and the relatively small spatial representativeness of site data.
A1.2.3.1 Identification and Resource AssessmentAs for wind, pre-competitive solar resource mapping is produced by means of combinations of high quality observations and numerical model data, with the model normally constrained by reanalyses data. Aside from the different accuracy of the meteorological variables involved, the main difference is that solar radiation resource assessment can benefit also from the use of satellite-derived solar data. These are computed by means of satellite information such as cloud images, top of atmosphere radiances and albedo and then processed using statistical or physical models to derive the irradiance at the ground (either or both of global and direct components) (Sengupta et al. 2015).
Although PV responds to global irradiance, this variable actually depends on the inclination and orientation of the plane used to measure it. Normally global irradiance is measured on the horizontal plane, but PV panels are mounted at differing angles. Thus pyranometers need to be oriented according to the PV panel orientations in order to provide the most appropriate resource assessment for the specific panel setting used. The cost of taking these measurements may be acceptable for a large solar farm, for which a large quantity of panels share the same geometry. In the case of residential rooftop PV, however, the orientations generally vary from case to case. Thus, a decomposition of the global irradiance, usually on the horizontal plane, is carried out with a subsequent re-composition on the target PV plane. This process requires the knowledge of at least two irradiance components, e.g. global and direct irradiances, therefore increasing observation costs. In practice, approximations exist, via statistical procedures, which convert global irradiance on the horizontal plane onto any inclination and orientation angles, although, not relying on local observations, such statistical approximations come at the cost of lower accuracy.
In the absence of long-term ground data, solar resource can be estimated via satellite imagery. In regional terms, identifying prime solar resource areas is fairly simple. The southwestern United States, for example, has broad areas of excellent solar resource. Narrowing down the data to a specific few square kilometers of land,however, requires considering local impacts. Although satellite data are very useful in mapping large regions
xxxi

PAC-5/Doc 3.2 Draft 1, p. xxxii
individual sites should be vetted by using ground-monitoring stations. Local measurements can be compared to same-day satellite data to test for bias in the satellite model results (Sengupta et al. 2015). Specifically, estimates of Global Horizon Irradiance (GHI) and Direct Normal Irradiance (DNI) at the surface can be obtained from geostationary satellites. Because geostationary satellite coverage is available at regular intervals on a fixed-grid surface, radiation can be available for the entire globe (at least between approximately -60 degrees and +60 degrees latitudes) at temporal and spatial resolutions representative of a particular satellite.
In addition to solar irradiance, several other meteorological variables need to be considered for a proper estimation of PV power yield. In fact, PV panel performance depends also on air temperature, wind speed, and to a lesser extent humidity. Specifically, air temperature (and irradiance) affects the solar panel temperature which has an inverse relation to PV performance: as a rule of thumb an increase of 1°C in panel temperature reduces the power output by 0.5% (Skoplaki and Palyvos 2009). PV panel temperatures can reach values as high as 80°C (Ye et al. 2013).
The DNI is the most important meteorological input parameter for CSP plants; however, further parameters must be provided for accurate yield analysis. High wind speed might force the plant operators to set the collectors to their stow position. Thermal losses are influenced by wind (convection) and ambient temperature. Humidity and pressure have an effect on the thermodynamic performance of CSP plants (Chhatbar and Meyer 2011). Recently, other parameters such as soiling and the extinction of radiation between the mirror and the receivers have gained interest (Sengupta et al. 2015).
As with wind, there are a number of global, regional and national resource assessment initiatives, such as those led by IRENA and ESMAP.
A1.2.3.2 Impact AssessmentInfrastructure Impacts – Solar PV infrastructure can be affected by a number of factors:
Humidity freeze Thermal cycle, especially with high-temperature operation Damp heat Strong winds affecting the bracing or rotating parts of solar power plant Hail.
Environmental Impacts – Utility-scale solar energy environmental considerations include land disturbance/land use impacts; potential impacts to specially designated areas; impacts to soil, water and air resources; impacts to vegetation, wildlife, wildlife habitat, and sensitive species; visual, cultural, paleontological, socioeconomic, and environmental justice impacts, and potential impacts from hazardous materials. Solar power facilities reduce the environmental impacts of combustion used in fossil fuel power generation, such as impacts from GHG and other air pollution emissions. Unlike fossil fuel power generating facilities, solar facilities have very low air emissions of air pollutants such as sulfur dioxide, nitrogen oxides, carbon monoxide, volatile organic compounds, and the greenhouse gas carbon dioxide during operations. However, there are also some adverse impacts associated with solar power facilities that must be considered. Potential adverse impacts to various resources associated with the construction, operation, and decommissioning of solar power plants are briefly outlined below. These impacts and mitigation measures for solar facilities are addressed in detail in the Solar Energy Development Programmatic EIS12. Overall, and on the basis 32 environmental impacts for solar power plants, Turney and Fthenakis (2011) found that 22 are beneficial relative to traditional power generation, 4 are neutral, none are detrimental, and 6 need further research. All high-priority impacts are favorable to solar power displacing traditional power generation, and all detrimental impacts from solar power
12 http://solareis.anl.gov/guide/environment/
xxxii

PAC-5/Doc 3.2 Draft 1, p. xxxiii
are of low priority. Turney and Fthenakis (2011) found land occupation metric to be most appropriate for comparing land use intensity of solar power to other power systems, and that a solar power plant occupies less land per kW h than coal power, for plant lifetimes beyond ∼25 years.
Land Disturbance/Land Use Impacts – All utility-scale solar energy facilities require relatively large areas for solar radiation collection when used to generate electricity at utility-scale (defined for the Solar PEIS as facilities with a generation capacity of 20 MW or greater). Solar facilities may interfere with existing land uses, such as grazing, wild horse and burro management, military uses, and minerals production. Solar facilities could impact the use of nearby specially designated areas such as wilderness areas, areas of critical environmental concern, or special recreation management areas. Proper siting decisions can help to avoid land disturbance and land use impacts.
Ecological Impacts – The clearing and use of large areas of land for solar power facilities can adversely affect native vegetation and wildlife in many ways, including loss of habitat; interference with rainfall and drainage; or direct contact causing injury or death. The impacts are exacerbated when the species affected are classified as sensitive, rare, or threatened and endangered.
Other Impacts – Because they are generally large facilities with numerous highly geometric and sometimes highly reflective surfaces, solar energy facilities may create visual impacts; however, being visible is not necessarily the same as being intrusive. Aesthetic issues are by their nature highly subjective. Proper siting decisions can help to avoid aesthetic impacts to the landscape. Additionally, particularly CSP systems could potentially cause interference with aircraft operations if reflected light beams become misdirected into aircraft pathways. However, such effects are not too dissimilar from reflections from bodies of water or buildings.
A1.2.3.3 Site Selection & Financing While with the identification and resource assessment stage the quality of the observations but also the exact location of the instrument is less critical, with site selection and financing the best possible instrumentation at the precise location of the proposed solar farm are required. This is because, and like with any other generation source, knowledge of the quality and future reliability of the fuel is essential to accurate analyses of system performance and the financial viability of a project.
Financial institutions evaluate the risk of uncertainty with solar resource data in terms of exceedance probabilities (e.g., P50 or P90). P50 is the result of achieving an annual energy production based on the long-term median resource value. For this value, the probability of reaching a higher or lower energy value is 50:50. For example, Typical Meteorological Years (TMYs) represent the P50 value. For an exceedance probability of P90, the risk that an annual energy value is not reached is 10% (90% of all values in a distribution exceed the P90 value) (Sengupta et al. 2015).
Studies have also been undertaken to determine how long surface measurements at a proposed site should be taken before the true long-term mean is captured. This is important when no concurrent data sets are available and yet project finance decisions must still be made. Another way to look at the problem is to ask how representative a short-term (perhaps 1-y) measurement is to the “true” climatological (nominally 30-y) mean? In the wind industry, a rule of thumb is that it takes 10 years of on-site wind measurements to obtain a mean annual wind speed that is within ± 10% of the true long-term mean, which is generally required by financial institutions. But in a case with only 1 year or 2 years of on-site measurements, these data may be all that are available to a financial institution conducting due diligence on a project (Sengupta et al. 2015).
xxxiii

PAC-5/Doc 3.2 Draft 1, p. xxxiv
Tomson et al. (2008) show that the mean annual global irradiation in any year is virtually independent of the previous year, which means that 11 years of on-site measurements does not represent the long-term mean. Gueymard and Wilcox (2011) examined the long- term data from four US National Solar Radiation Database (NSRDB) stations to address questions about how many years of measurements it takes to converge to the long-term mean and whether the variability in annual radiation changes significantly from one site to another. The results show that, first, there is much lower interannual variability in GHI than in DNI. GHI is almost always within ±5% of the true long-term mean after only one year of measurements, regardless of which year these measurements are taken. The situation is quite different for DNI, however. After only one year of measurements, the study shows that the estimate of the average DNI is no better than ± 10% to ± 20% of the true long-term mean. Another way of stating this finding is that the coefficient of variation for DNI is generally two to three times higher than the coefficient of variation for GHI (in line with Davy and Troccoli 2014).
A1.2.3.4 Operations and Maintenance Operations of solar farms heavily rely on forecasts at various timescales. Solar forecasting is an active area of research. Depending on the time horizon, different techniques to produce a solar forecast can be used. At the shortest time scales, up to about 30-minutes statistical models and/or sky imaging is used. For longer timescales and up to several hours, irradiance derived from satellite cloud images can be effective. Beyond several hours, however, the use of NWP model becomes necessary.
It is important to also consider potential losses due to shading, soiling and snow-coverage, as well as temperature effects on PV panel efficiency, DC cable losses, and inverter losses.
Less than 3% of total water consumption of solar thermal plants is used for the purpose of washing mirrors. Development of an efficient and cost-effective program for monitoring mirror reflectivity and washing mirrors is critical. Differing seasonal soiling rates require flexible procedures. For example, high soiling rates of 0.5% day−1 have been experienced during summer periods. After considerable experience, operation and maintenance procedures have settled on several methods, including deluge washing and direct and pulsating high-pressure sprays (Hoffschmidt et al. 2012).
A1.2.3.5 Energy IntegrationAs with wind, solar power forecasting is key the effective integration of solar power into the grid. A lot of effort is being devoted to improving solar forecasting. For instance, NCAR leads a project that involves performing cutting edge research, testing the forecasts in several geographically- and climatologically-diverse high penetration solar utilities and ISOs, and wide dissemination of the research results to raise the bar on solar power forecasting technology. The partners include three other national laboratories, six universities, industry partners, including four forecast providers, six utilities, and four balancing authorities13. Similarly, the Australian Solar Energy Forecasting System (ASEFS) has provided Australian Energy Market Operator (AEMO) with an operational system that uses basic forecasting techniques to cover all the AEMO-required forecasting timeframes, which range from five minutes to two years. The system caters to large-scale photovoltaic and solar-thermal plants as well as distributed small-scale photovoltaic systems14.
A1.3 Hydropower Hydropower is a renewable energy source where power is derived from the potential energy of water moving from higher to lower elevations. It is a widespread, proven, mature, predictable and cost-competitive technology. Being one of the less GHG emitting 13 https://www.ral.ucar.edu/projects/doe-suncast-solar-forecasting14 http://arena.gov.au/project/australian-solar-energy-forecasting-system-asefs-phase-1/
xxxiv

PAC-5/Doc 3.2 Draft 1, p. xxxv
technologies over its whole life cycle, its contribution is therefore very interesting to reduce the power sector’s carbon release to the atmosphere (IPCC 2011). Hydropower is one of the most efficient energy conversion systems, with 90% water to wire efficiency, and even up to 96% efficiency in best operational conditions for recent turbines.
A1.3.1 Importance of Hydropower for Society
Hydropower provides a significant amount of energy throughout the world even if, so far, only 25% of the hydropower potential has been developed across the world. It is used in more than 100 countries, contributing approximately 17% of the global electricity production (Figure 7). The top countries for hydropower in terms of capacity and generation are (in increasing order) India, Russia, Canada, the United States of America, Brazil and China, which significantly exceed the others. The total capacity of these six countries represented 60% of the global capacity at the end of 2014 (REN21, 2015). In several other countries, hydropower accounts for over 50% of all electricity generation, including Norway, Iceland and Mozambique for example. In 2014, an estimated 37 GW of new hydropower capacity was commissioned, bringing the global total to approximately 1,055 GW. An additional 2.4 GW of pumped storage capacity was commissioned: this should reach an estimated total of 146 GW at the end of the year (REN21 2015). In some countries, the growth in hydropower has been facilitated by the renewable energy support policies and CO2 penalties. Over the past two decades the total global installed hydropower capacity has increased by 55%, and the actual generation by 21%. However, in recent years, despite an increase in global installed hydropower capacity, the total electricity produced dropped significantly in many countries, partly due to water shortages, as well as an evolving energy mix and markets, which in turn encourage hydropower to operate in peaking mode rather than baseload, and therefore reducing the overall generation figures (WER 2013, REN21 2015).
Hydropower is flexible and can be reactive, as power output can be increased or decreased very quickly to respond to variations in electricity demand. In addition, pumped storage is the largest-capacity and commercially viable form of grid energy storage available today. Hydropower is therefore a vital component to electricity systems as it can deliver services to the whole power system of a country/area. Allowing for the managing of river flow, reservoir hydropower can support fossil fuel and nuclear generation, especially in regulating cooling water availability, and provides the required flexibility to allow a larger integration of VRE resources (wind & solar in particular). It can even be used to pump water back in reservoirs, absorbing excess system capacity and therefore avoiding VRE curtailment when such sources produce too much energy in periods of low demand.
Figure 7: Estimated energy shares of global electricity production, end-2014 (REN21, 2015)
xxxv

PAC-5/Doc 3.2 Draft 1, p. xxxvi
Though the primary role of hydropower in global energy supply today is in providing centralized electricity generation, hydropower plants can also operate in isolation and supply independent systems, often in rural and remote areas of the world (IPCC 2011). Hydropower, when associated with reservoir storage capacity, can also provide services for water management for drinking water supply, irrigation, flood control, drought mitigation, navigation services and tourism.
Essentially installed on rivers, hydropower plants can also take advantage of large tides, as is the case for instance in France for the La Rance tidal power production plant. However, this particular application remains marginal in a global context. Table 6 summarizes the main benefits and drawbacks of hydropower.
Table 6 – Benefits and drawbacks of hydropowerBenefits Drawbacks
Low operating costs, cost-competitive with fossil fuels High CAPEXNo waste or CO2 emissions Significant land requirement for large
plants with dams/lakesSimple proven technology with high efficiency Public resistance due to relocation or
micro climate effectsFreshwater management for multiple purposesFlexible & non variable (as opposed to wind and solar)Lower LCOE than other renewables
A1.3.2 Hydropower and its Interaction with the Climate SystemHydropower is obviously dependent on river flow, and more generally, the water cycle, and its variability. Generation then depends on the season, with periods of high/low flows, but it is also affected by interannual variability. For instance, in France, in the last 25 years, the difference between highest and lowest annual generation potential was 23 TWh, for a theoretical maximum generation of 44.4 TWh (Dubus, 2014).
River flow depends essentially on:
the geography, orography and geology of the watershed, and its land structure (the type of vegetation controlling in part the speed at which the water goes into rivers or groundwater);
precipitation and snow amounts; air temperature, which in particular controls the snow melting process in spring in
mountain areas; the altitude of the 0°C isotherm is of particular importance; evaporation, which plays a strong role in controlling the water level in large areas
reservoirs, in particular in tropical and sub-tropical regions.
Of course, floods and droughts have a strong impact on hydropower generation. The former, generally a sudden, short duration event, can imply the release of water with no electricity production, to ensure security and safety of installations, but also of people living in the area. Consequent flooding can nevertheless also have detrimental impacts on people and assets downstream. Droughts, which are in general slower but longer lasting events, can substantially reduce power generation capacity, either because of the direct lack of water, or because the small available amount of water is needed to address other uses, such as drinking water supply or irrigation for agriculture.
If hydropower is dependent on weather and the water cycle, it has itself environmental and social impacts (IPCC 2011):
changes in hydrological/flow regimes; erosion due to fluctuations in water levels, either in the lakes or along the river; changes in biodiversity (including fish habitat, and terrestrial habitat);
xxxvi

PAC-5/Doc 3.2 Draft 1, p. xxxvii
water quality; sedimentation; barriers for fish migration and navigation; involuntary population displacement; biological diversity.
Hydropower generation management requires river flow forecasts at the different time scales at which power systems are operated: yearly, quarterly, monthly, weekly, daily and intra-daily. The current practice in to use weather forecasts; either deterministic or probabilistic depending on the ability and means of each company, up to one or two weeks. For longer time scales, the more advanced energy companies use intra-seasonal to seasonal forecasts but the climatological approach, which uses historical time series of precipitation and/or river flow, is more wide spread. On longer time scales, for planning purposes, the general rule is to use climatological information as well, even as more and more companies have started to use climate change projections.
According to the IPCC Special Report on Renewable Energies (IPCC 2011), climate change is expected to increase overall average precipitation and runoff, but regional patterns will vary: the impacts on hydropower generation are likely to be small on a global basis, but significant regional changes in river flow volumes and timing may pose challenges for planning and operations (Figure 8).
xxxvii

PAC-5/Doc 3.2 Draft 1, p. xxxviii
Figure 8: from IPCC, WGI, 2013 Annual mean changes in precipitation (P), evaporation (E), relative humidity, E – P, runoff and soil moisture for 2081–2100 relative to 1986–2005 under the Representative Concentration Pathway RCP8.5. The number of Coupled Model Intercomparison Project Phase 5 (CMIP5) models to calculate the multi-model mean is indicated in the upper right corner of each panel. Hatching indicates regions where the multi-model mean change is less than one standard deviation of internal variability. Stippling indicates regions where the multi-model mean change is greater than two standard deviations of internal variability and where 90% of models agree on the sign of change.
The IPCC (2013, WG I) confirms that changes in the global water cycle in response to the warming over the 21st century will not be uniform. The contrast in precipitation between wet and dry regions and between wet and dry seasons will increase, although there may be regional exceptions. In addition, the report indicates that regional to global-scale projections of soil moisture and drought remain relatively uncertain compared to other aspects of the water cycle. Nonetheless, drying in the Mediterranean, southwestern USA and southern African regions are consistent with projected changes in the atmospheric circulation, so drying in these regions as global temperatures increase is likely for several degrees of warming under the Representative Concentration Pathway RCP8.5. Decreases in runoff are
xxxviii

PAC-5/Doc 3.2 Draft 1, p. xxxix
likely in southern Europe and the Middle East. Increased runoff is likely in high northern latitudes, and consistent with the projected precipitation increases there.
A limited number of studies show that climate change may have a slightly positive impact on existing hydropower systems, but regional discrepancies exist, in line with the above described patterns of precipitation and river flow – negative impact estimated in southern Europe and the Mediterranean basin for instance.
Clearly, hydropower systems with less storage capacity will be more vulnerable to climate change, as they do not benefit from the operational flexibility provided by the storage capacity. But even installations with storage may be impacted, especially with an increased evaporation due to higher air temperature, in particular in sub-tropical and tropical regions. Based on these likely changes, adaptation measures can already be taken to improve the level of resilience of hydropower systems, project design and location choices being key elements (WBCSD, 2014, see Table ).
The water storage component of hydropower, i.e. the reservoir, will be more and more important in the future, as it will ensure hydropower assets are more resilient, but also because societies will need more water storage to help adapt to climate change. Reservoir hydropower can then provide climate adaptation services by allowing a better management of water resources. Understanding future events, such as floods and droughts, will in particular be a key component for deciding on the appropriate amount of reservoir storage capacity.
Table 7– From WBCSD (2014)Climate change
effectLikely impacts Appropriate response
Changes in precipitation and snow melt
Changes in the location and patterns of precipitation will decrease hydropower production in some dams and increase it in others.
Run-off from rivers in areas dominated by snow melt may occur earlier in the year and with increased seasonal precipitation cycles.
Even relatively minor variations may make hydropower output more difficult to forecast in the long term.
Changes to the management of the plant and redesigns for certain elements
Increase dam height and/or build small dams upstream if flow is expected to increase
Modify number and type of turbines more suited to expected water flow rates
Modify canals or tunnels to handle expected changes in water flows
Drought Inadequate water volumes and the risk of damage from silt, which has already happened to many turbines in India.
Build or augment water storage reservoirs
Modify spillway capacities to flush silted reservoirs
Upgrade or adapt turbine runners to increase silt resilience and ability to operate in lower capacity conditions.
Landslips and other land effects
Hydropower infrastructure may incur physical damage – the flood from the Dig Tsho glacial lake outburst in Nepal in 1985 destroyed 14 bridges and damaged a hydropower plant.
Design more robust dams and infrastructure for heavier flooding and extreme events
Encourage forestation around the reservoirs
Higher air temperature, wind speeds and
Increased surface evaporation, reducing water storage and power output.
Build or augment reservoirs
xxxix

PAC-5/Doc 3.2 Draft 1, p. xl
humidity
A1.3.3 Needs of Hydropower Sector for Climate ServicesGiven the technical, physical and societal considerations discussed above, in this section the needs of the hydropower industry in terms of climate services for each of the five focus areas are identified.
Generally speaking, the increasing share of renewables in energy mixes requires a more homogeneous approach vis-à-vis climate data. Historically, air temperature (which controls power demand) and river flow were the key variables which needed to be considered in order to optimize the supply/demand balance for electricity. With the increased share of wind or/and solar generation, the climate dependence of power systems is increased, and there is a strong need to provide energy companies with coherent and homogeneous datasets of the different climate variables they use: air and water temperature, wind speed, solar radiation, precipitation, river flow, etc.
Therefore, strengthening communication (UIP, CD) between the energy sector and the meteorological community will be essential to homogenize datasets in terms of quality and availability (Obs/Mon, CSIS). Provision of climate predictions at all timescales, and most importantly at sub-seasonal to seasonal lead times, and climate projections will require the development of multi-variate methodologies for downscaling and model bias-adjustment.
As they share the same resource (water), another key aspect is that a close collaboration is required between the energy, water management and agriculture sectors in particular.
A1.3.3.1 Identification and Resource AssessmentSome 75% of the world hydropower potential is still unexploited. Properly selecting the most relevant sites for building new plants is then a key issue. Apart from political, economic and social acceptance considerations, long-term information about the hydrological cycle is an essential piece of information, both in the past (Obs/Mon) and the future (CSIS). In particular, long time series of river runoff are not available in many parts of the world. In addition to new observing systems, long and high resolution reanalysis coupled to hydrological models can thus provide very useful information. As hydropower plants are built for several decades, the long-term evolution of the hydrological cycle, its seasonal variations in the future, and the changes in extreme events intensity and frequency need to be assessed as well. Uncertainty about the hydrological cycle in current climate change projections is still high, despite constant improvement in climate models. Reduction in uncertainty, or at least a better understanding of the uncertainties will help reducing risks and better dimension future assets (RMP, CSIS), hence reducing the investments costs of hydropower projects. Improved communication, training and dialogue with users will allow to better take into account the available information in the decisions made (UIP, CD).
A1.3.3.2 Impact AssessmentAs for any other infrastructures, extreme events are of particular importance to the hydropower sector. Information needs cover:
Short to medium term forecasts of flood risks, where they do not exist, or improvements of existing systems, as in the European Flood Alert System (EFAS);
Seasonal to annual forecasts of droughts, to allow a better management of water stocks in reservoirs, and anticipate decrease in production due to runoff decrease;
xl

PAC-5/Doc 3.2 Draft 1, p. xli
Longer-term (decadal to centennial time scales) evaluation of extremes, to adapt existing assets so that then can still operate under different conditions, without degrading the surrounding environment
Erosion, sediment transport and reservoir sedimentation have negative impacts on efficiency, and biological/chemical/biodiversity impacts. Observation, monitoring, and modelling of these processes is important in order to monitor and anticipate power generation perturbations on the one side, and environmental impacts on the other side. In addition to Obs/Mon, CSIS and RMP, this also requires increased communication between service providers and users in different sectors (energy, agriculture, water management), in particular to share practises and exchange information (UIP, CD).
A1.3.3.3 Site Selection & Financing Hydropower requires a high initial investment (CAPEX), but then has low operation and maintenance (O&M) costs (OPEX) and long lifespan. The profitability of new production sites depends strongly on the initial assessment made about the power output potential and availability of the resource over the whole duration of the plant. Again, long observed time series of river runoff and of its variability throughout the year, together with future projections, are essential. Climate data are also essential for selecting the most appropriate hydropower plant design to withstand climate impacts and to provide sufficient water storage for flood protection/drought mitigation.
A1.3.3.4 Operations and Maintenance Although hydropower is an advanced and efficient technology, improvement is still possible, in particular if more accurate weather and climate information is made available. Improvements in river runoff forecasts at all time scales would generally allow a better management of water stocks in reservoirs, noting that the most interesting progress would come from sub-seasonal to seasonal forecasts instead of current climatological approaches. In this field, research efforts are needed, to improve the understanding and modelling capacities of the hydrological cycle at these time scales (RMP).
On the shorter-term, better flood forecasts (intense rainfall events) can greatly help operations and save money by optimizing water releases (CSIS, RMP).
A1.3.3.5 Energy IntegrationAs a flexible generation mean, and with the help of storage and pumped storage, hydropower is an ideal candidate to support variable renewable energy integration. Indeed, pumped storage can be used to provide active power reserve. In addition, on interconnected networks, hydropower can be used as a balancing reserve for neighbouring countries, as is the case between Norway, Germany and the United Kingdom. Hydropower can supplement wind and solar energy when their production is too low, or help avoid their curtailment when generation is too high, by using their energy to pump water back in reservoirs.
This integration component requires coherent information, both spatially and temporally, for the different production means (hydro, wind and solar in particular) and electricity demand. The necessary weather and climate observations should then be available at the same space and time resolution, the physical coherence of the datasets being key, in order to develop robust climate-based tools to advise energy planners and policy makers who must assess:
1. The ways in which energy supply and demand are affected by the spatial and temporal variations of their climate drivers; and
2. How scenarios with different energy supply mixes can meet demand at the continental scale, particularly given the projected high level of highly climate-sensitive RE.
xli

PAC-5/Doc 3.2 Draft 1, p. xlii
Developing such datasets, both in the past (from observations or reanalyses) and in the future (climate predictions and projections) require methodological developments, for instance to calibrate reanalysis on in-situ observations, or to adjust biases in a multivariate approach in climate simulations (RMP). This of course demands that available observations are shared widely, which for instance is far from being the case for river runoff data (Obs, UIP, CD).
xlii

PAC-5/Doc 3.2 Draft 1, p. xliii
A1.4 Thermal Power Thermal power is the most common and currently used way to produce electricity. Steam is generated that drives a steam turbine, which is connected to an electrical generator. The water is then condensed and reused; this cycle is known as the Rankine cycle. The different types of thermal power are defined by the procedure used to heat the water and produce steam. It can be based on coal, gas, fuel, nuclear, wastes, biomass, and even solar (CSP). A key element in a thermal power plant is its cooling system. The two main types are 1) a heat exchanger which uses cold water from the sea or a river and 2) a cooling tower which provides cold fluid to the condenser, the cold fluid getting heated and the heat being released to the atmosphere via natural convection in the cooling tower. In many cases, both systems are used simultaneously.
A1.4.1 Importance of Thermal Power for SocietyIf renewables have increased significantly their share in the world energy production in the last decades, fossil fuels are still dominating the world total primary energy supply (Figure 9) . Oil, coal and natural gas accounted for 81.7% of the total production in 2012.
World electricity generation is dominated by fossil fuels as well, with 67.9% of supply in 2012 coming from coal, oil and gas. Nuclear power also plays an important role, especially in OECD countries, with 10.9% of the total supply in 2012 (Figure 10).
Figure 9: World Total Primary Energy Supply, from IEA Key World Energy Statistics (IEA, 2014c). Left: evolution from 1973 to 2012; right: shares in 2012.
xliii

PAC-5/Doc 3.2 Draft 1, p. xliv
Figure 10: World Electricity Generation by Fuel, from IEA Key World Energy Statistics (IEA, 2014c)
In many countries, thermal power is the main source of electricity generation. Where other production sources exist (nuclear and renewables in particular), thermal power plants have an important role as well. They offer an important flexibility to manage peaks in demands, for instance during cold waves in winter or heat waves in summer. They can also be used to deal with the intermittency of renewables, wind and solar energy in particular. In such countries, thermal power is generally the main backup source for renewable sources.
Coal plays an important role in delivering energy access because it is widely available, safe, reliable and relatively low cost. Coal resources are large, particularly in developing countries in Asia and Africa, and coal will play an important role in the developing world in the coming decades.
Oil is a mature industry with good returns on investments. Even if its share in global electricity production is modest (around 5% in 2012), it offers a low cost resource in countries with reserves.
Natural gas has increased its share in global electricity supply, and the trend will continue in the coming decades, especially due to the replacement of old coal and fuel production units by more modern and efficient gas-fired power generation plants, such as Combined Cycle Gas Turbine (CCGT) with conversion efficiencies of about 60%.
Notwithstanding considerations on the security of nuclear energy, the problem of wastes and social acceptance, nuclear energy represents an advantage in climate change mitigation, as it is one of the less CO2 emitting power generation technologies. In addition, once commissioned, nuclear power plants have very low production costs, and allow countries to secure their power supply, in particular with respect to fossil fuels imports and prices. France for instance has electricity prices amongst the lowest in Europe.
According to the IEA and WEC, the share of nuclear energy should slightly increase by 2020 and beyond, and the share of fossil fuelled power production should decrease, especially due to decommissioning of old production units, but the global share of fossil fuels and nuclear will remain dominant in the world energy production, and in particular in the power sector (WER, 2013; IEA, 2014c). Moving away from fossil fuels will take decades, as coal, oil and gas will remain the main energy resources in many countries. In the IEA’s New Policies Scenario, demand for oil will continue rising, despite measures and policies aimed at promoting energy efficiency and fuel switching (IEA 2014d). Global gas use will continue to grow as well, and will even become the second-largest fuel in the global energy mix, after oil.
Fossil fuels will continue to dominate the power sector, although their share of generation will decline from 68% in 2012 to 55% in 2040 according to the New Policies
xliv

PAC-5/Doc 3.2 Draft 1, p. xlv
Scenario. Gas-fired power generation, in particular, will increase in most regions of the world. Nuclear power generation should slightly increase from 11% today to 12% in 2040.
A1.4.2 Thermal Power and its Interaction with the AtmosphereAs thermal production is based on combustion of a fossil fuel, it has impacts on the atmosphere, by releasing post-combustion chemical species in the air. These species can then either be deposited in the neighbourhood of the plant, or be transported in the atmosphere, where eventually they can interact chemically with other atmospheric constituents to form other species. The emitted species can be nitrous oxides, sulphurs, aerosols and, of course, carbon dioxide. All of these elements have impacts on the chemical composition of the atmosphere, and its radiation budget.
The power industry puts a lot of effort to reduce its GHG emissions, in particular by developing technologies to reduce the impacts of thermal power plants on the atmosphere, for instance with circulating fluidized bed, which reduces nitrous oxides and sulphur emissions, supercritic clean coal or combined cycle, which allows a higher efficiency rate. A better knowledge of coal and fuel characteristics allows to select the best quality resource, and reduce the emissions. In addition Carbon Capture and Storage (CCS) allows to reduce significantly the release of gases to the atmosphere, but at the price of a decrease in generation efficiency. CCS is identified by the World Energy Council (WER 2013) as one of the key elements to reduce CO2 emissions in the power sector in the next decades.
Conversely, the environment has impacts on thermal generation. First, exploration, extraction and transport of fossil fuels is dependent on climatic conditions, both onshore (mines can be flooded, as was the case for instance in eastern Australia in 2011) and offshore (oil drilling platforms in particular are exposed to storm and hurricanes, like Katrina in 2005 in the Gulf of Mexico; operations and maintenance as well as oil and coal shipping, depend on the sea state and wind force).
Like any other infrastructure, thermal power generation plants can be affected by severe and extreme weather events, causing unavailability of the production means, or even damages.
Thermal conversion efficiency depends on ambient air temperature. The efficiency of cooling systems depends on several parameters: water temperature (ocean, rivers), river flow (with special emphasis on drought periods, but also in the case of floods), and air temperature and humidity, which control the efficiency of cooling towers. Rising air and water temperature, and lack of water may then lead to reduced power generation or temporary shutdowns. Nuclear power plants are subject to similar risks, with possible disruption of the functioning of critical equipment.
As thermal plants include a variety of sources, shared advantages and disadvantages are listed below:
Table 8 – Benefits and drawbacks of Thermal Energy
Benefits DrawbacksFlexible High CO2 emissionsAdaptable anywhere Possible Non-Domestic sources of energyReliable Non-renewable resources
A1.4.3 Needs of Thermal Power Sector for Climate ServicesMany needs have already been addressed in the previous sections about wind, solar and hydropower, that apply to thermal power generation as well. In particular, the close links between thermal power production and water temperature and availability (river flow) reflects
xlv

PAC-5/Doc 3.2 Draft 1, p. xlvi
on the fact that needs identified for the hydropower case are equally relevant for thermal power. In the following, we will only introduce incremental or specific needs to avoid repetition.
A1.4.3.1 Identification and Resource AssessmentAs thermal power strongly relies on fossil fuels, changes in conditions of access to resources is a key issue, especially in the offshore oil & gas industry: climate change is likely to increase sea level, exacerbate high impact weather events (storms frequency, sea state), and affect deep currents for deep ocean drilling, pipelines resilience. Oil and coal shipping cost and security are particularly sensitive to ocean waves. Therefore, long time series of observations and reanalysis (Obs/Mon) and statistical methods to anticipate future extremes in a non-stationary climate (RMP) are needed, to allow for evaluation of extremes. Short term to seasonal forecasts of sea-states and surface winds are also needed to optimize maintenance and operations, as well as shipping routes and to choose the best locations for fuel supply (CSIS).
Cooling systems essentially require information on air and water temperature and river flow, at short to seasonal timescales for operations, and long-term projections for plants adaptation or site selection and dimensioning. Climate services information systems (CSIS) would then consist of maps and more generally datasets generated by using, and also combining, as many sources of air temperature, water (ocean and rivers) temperature, river flow, and ocean waves and surface winds. The relevant spatial scales range from global to local, with a strong need for downscaling methods and uncertainty analysis (RMP, CSIS).
A1.4.3.2 Impact AssessmentThermal power plants have an impact on their surrounding environment through their
releases both into the atmosphere and water bodies. Regulations exist and are in constant revision to minimize such impacts. Climate change may have an influence in modifying the current state of what can be considered as natural conditions, however. For example, regulations aiming at the preservation of wild life in rivers consider the current state of any particular river. Climate change already has induced, or will induce, species adaptations and/or migration, modifying the current biological as well as physical state. Therefore temperature limits may be controlled with the aim of preserving the endogenous species, besides thermal power plants consume up to several thousand litres of water per MWh produced, changing the environmental conditions of the thermal power plants locations, and CO2 emissions affecting the global environment through climate change.
Climate change will have impacts on the design and operation of thermal power plants too. As for hydropower, flood and drought risks may have to be revisited and adaptation measures taken. Sea level, wave heights and storm surges, high air and water temperature extremes may have to be reassessed too, through existing or to-be-developed methods in order to provide inputs for adaptation. Besides adaptation, resilience may be enhanced by short to medium term forecasts of flood, storm surge or heat wave risks (air and water temperature forecasts).
A1.4.3.3 Site Selection & Financing Improve identification/selection of sites for mining and drilling by taking into account changes in access conditions, and exploitation. Implement changes in coal handling due to the increased/decreased moisture content of coal.
A1.4.3.4 Operations and Maintenance Real-time monitoring of atmospheric composition and associated alert systems can help optimizing the power generation units mix, by reducing the power generation from fossil fuel units in case of a pollution event, for instance during an atmospheric blocking event.
xlvi

PAC-5/Doc 3.2 Draft 1, p. xlvii
Development and availability of atmospheric composition observing and forecasting systems, such as those developed in the Global Atmospheric Watch (GAW) program and the COPERNICUS Monitoring Atmospheric Composition & Climate (MACC) project in Europe would be required worldwide, user-friendly, easy and real-time access to the information being a key issue to allow decision making in operations. A strong interaction between providers and users is then essential and emphasizes the role of the UIP and the need for Capacity Development.
In addition to the needs identified for the hydropower sub-sector (temperature of water in rivers, river flow and their evolution under future climate), the same type of information is required for water temperature (rivers and oceans), air temperature and humidity in order to assess changes in cooling capacity at different time scales, from seasonal to multi-decadal.
Offshore operations and sea shipping require observations and monitoring (Obs) and forecasts up to several weeks in advance for sea-states (wave height, surface winds), extreme winds and storms.
A1.4.3.5 Energy Integration
In order to meet ever-fluctuating load demands, utilities must be able to predict at a high degree of accuracy when, and to what extent, the loads will change, so that they can take action to increase or decrease the supply of electricity to meet these changes. The bulk of the power supplied to a grid typically comes from base load power plants, traditionally plants that provide large quantities of electricity through steam generation systems or large hydro plants. As the load increases, utilities must bring in additional power sources from facilities that can be started up quickly, such as mid-merit or peaking plants (Renné 2014).
In this context it is critical to consider the reaction time of thermal power plants and the cost-effectiveness of their use, including possible carbon costs (the latter determined by either taxation or market mechanisms). Thus, gas turbine power plants are the most flexible in terms of adjusting power level, but are also among the most expensive to operate. Therefore they are generally used as "peaking" units at times of maximum power demand. Diesel and gas engine power plants can be used for base load to stand-by power production due to their high overall flexibility. Such power plants can be started rapidly to meet the grid demands. Large size coal fired thermal power plants can also be used as load following 15 / variable load power stations. Older nuclear (and coal) power plants may take many hours, if not days, to achieve a steady state power output. In general it is not economical for large thermal installations such as nuclear power plants to practice load following.
By adding predictions of energy demand – which in turn are markedly affected by meteorological conditions – to these cost considerations, scheduling of specific power plants is planned. Consequently, cost of electricity is determined by exactly which power plant(s) is (are) used to meet the expected demand.
15 A load following power plant, also known as mid-merit, is a power plant that adjusts its power output as demand for electricity fluctuates throughout the day
xlvii
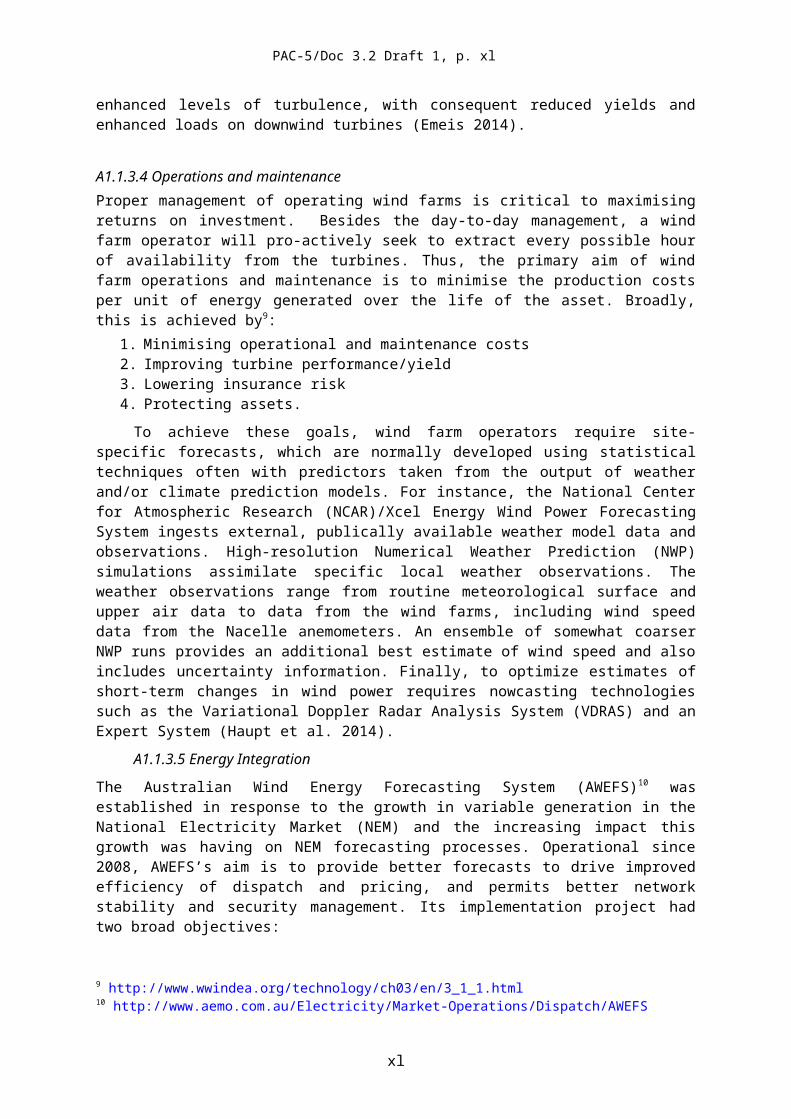
PAC-5/Doc 3.2 Draft 1, p. xlviii
ANNEX 2 – RELEVANT EXISTING ACTIVITIESThe climate and energy initiatives discussed in this section highlight the breadth of products and services which are already being developed by a wide number of organisations around the world. By listing a number of relevant initiatives, the complexity of the needs of the energy sector for climate products and services will become apparent. Rather than trying to structure this section according to well-defined clusters, the aim here is to provide an illustrating overview of currently developed climate services and products so as to assist in identifying needs and priorities of the energy sector. Naturally, the list of products and services presented here is by no means exhaustive.
To help address threat that climate change poses to energy systems, the IEA launched the Nexus Forum16 in 2012 as a platform to enhance awareness of the impacts of a changing climate on the energy sector and share emerging experience on building energy sector resilience. The IEA is currently working to enhance the climate change resilience aspect in several of its core activities:
1. Dialogue facilitation: promote dialogue on climate change impacts and resilience topics of relevance to business and policy-making communities through the Nexus Forum workshops on the climate change-energy security nexus.
2. Policy information collection and dissemination: identify energy resilience and preparedness policies that are being used by governments and appropriate platforms for disseminating this information to stakeholders. With this in mind, the IEA Policies and Measures (PAMS) Database17 is being expanded to include relevant resilience policies.
3. Data and modelling: investigate how data and modelling of climate impacts on the energy system can be improved. The IEA had already begun to deepen its analysis of resilience issues, notably reflected in the publication IEA (2013) on climate. Further consideration is given to integrating climate change impacts and their uncertainties (and potentially adaptation/resilience policies) into IEA modelling and analytic capabilities.
4. Research stocktaking on impacts, vulnerability, and resilience policy: keep abreast of and help to disseminate studies in this emerging literature.
5. Policy development: facilitate the development of resilience and preparedness policies. Building on the experience of the Nexus Forum to date, the IEA is exploring how it could play a more pro-active role in actual policy development on both the government and business sides. Existing processes within the IEA, as well as outreach to member states, could potentially enable future actions in this workstream.
The US Department of Energy (DOE) recently launched the Partnership for Energy Sector Climate Resilience18, an initiative to enhance U.S. energy security by improving the resilience of energy infrastructure to extreme weather and climate change impacts. The goal is to accelerate investment in technologies, practices, and policies that will enable a resilient 21st century energy system. Under this Partnership, owners and operators of energy assets will develop and pursue strategies to reduce climate and weather-related vulnerabilities. Collectively, these Partners and the DOE will develop resources to facilitate risk-based decision-making and pursue cost-effective strategies for a more climate-resilient U.S. energy infrastructure.
The Group on Earth Observations (GEO), through its GEO Energy-related programmes, namely GEO Energy and Geo-resources and GEO Impacts tasks, coordinates the development of tools and products that provide support to energy decision makers. It also facilitates the provision of freely accessible data, both remotely sensed and in-situ, via
16 http://www.iea.org/media/workshops/2014/5thnexusforum/NexusForumSummaryDocMarch2014.pdf17 http://www.iea.org/policiesandmeasures/18 http://energy.gov/epsa/partnership-energy-sector-climate-resilience
xlviii

PAC-5/Doc 3.2 Draft 1, p. xlix
the GEOSS Portal19, the main entry point to Earth Observation data from all over the world. In terms of tools and products, these are organised in terms of Energy Resources, Energy Access and Energy Efficiency20.
1. Energy Resources: The GEO Energy team develops Energy Resources planning and monitoring tools and products, clustered in three main categories: Renewable Energy, Fossil Fuels and Minerals, and Energy Mix Scenarios. Examples of such products are given in the following (further details are available from the GEO website).
Renewable Energy – Renewable energy activities of the GEO Energy Team include a wide range of renewable energy technologies from wind and solar to hydropower and bioenergy and both offshore and onshore. The products and tools developed facilitate evidence-based decision both of private and public sector. For instance, the GEO Energy Team contributes to the development of the Global Renewable Energy Atlases for IRENA and more specifically the development, compilation and provision of data through web-portal and mapping tools (Figure 11)21. The World Bank’s ESMAP is also contributing to the provision of renewable energy observation and mapping services22. These activities have also benefitted from the support of the Clean Energy Ministerial (CEM).
Figure 11 – IRENA Global Solar and Wind Atlas Global to National / Wind and Solar
Other products include: prediction maps for wind and solar resources over a number of timescales (e.g. monthly, seasonal, annual, multi-annual or decadal) and at global and country levels23 and a portfolio of environmental performance maps enabling “geo-localized life cycle assessment” of offshore wind farms for different configurations24.
Fossil Fuels and Minerals – Fossil fuels activities of the GEO Energy Team are dominated by the impacts of coal mining. This is mainly due to: a) the potential environmental impacts of coal production and energy utilization, and b) the fact that coal is currently the main energy resource of most developing countries. Tools and
19 http://www.geoportal.org 20 https://www.earthobservations.org/geoss_en_ph.shtml 21 http://geocatalog.webservice-energy.org/geonetwork/srv/eng/main.home, http://www.irena.org/globalatlas/ 22 http://www.esmap.org/RE_Mapping 23 http://www.ic3.cat/ 24 http://viewer.webservice-energy.org/energeo_wind_pilot/index.htm
xlix

PAC-5/Doc 3.2 Draft 1, p. l
products that support the planning and monitoring of coal mining and utilization are of great value for both national decision makers, especially in developing countries, to ensure sub-national and national sustainable development, and regional or international decision makers who need to address regional and global environment issues and energy-water-food-air security. Examples of products include: The development of a pan-African spatial data infrastructure (SDI) making
accessible data and knowledge on geo-resources, i.e. minerals, construction materials, groundwater and geothermal energy through governance maps on mineral potential/mining activities vs. land use planning (pilot projects in Ghana and Senegal25);
The use of Earth Observations for the spatial correlation between energy consumption (electricity consumption from statistical data, and the satellite-based night-time light data reflecting energy consumption) and air quality (aerosol and NO2) in China;
The development, and promotion of the use, of integrated EO for each stage of the mineral life cycle to provide the basis for informed decision-making and improved geo-resources management, including the impact of mining on air pollution, biodiversity and acid mine drainage on soil and water quality (three pilot projects are underway in Bohemia province, Czech Republic; Toguz-Toro region, Kyrgyz Republic; and Mpumalanga Province, South Africa)26;
The environmental assessment of the world's largest coal mining area, Shendong (China), through the monitoring of satellite-based vegetation change with the view to inform environmental preservation policy and vegetation recovery activities;
Environmental impact monitoring of mining operations using EO techniques (four pilot projects have been undertaken in Mostar Valley, Bosnia and Herzegovina; Rosia Montana, Romania; Kristineberg, Sweden; and Karabash, Russia)27.
Energy Mix Scenarios – The GEO Energy Team provides decision makers also with tools that allow the comparison of different technologies based on specific criteria. These tools can take into consideration national priorities, such as job creation, while respecting the related (international) sustainability standards and can, therefore, be used both for planning in a specific area (e.g., biofuels, forest conservation or wood production) and for promoting a specific technology (e.g., optimum location for the promotion of a wind energy installation). An example of such a product is a modelling platform that will enable planners and governments to forecast and monitor the environmental and health impact of changes in the energy mix for alternative energy scenarios. This platform, developed under the EU project EnerGEO28, includes (Figure12): i) Integrated assessment models for designing and evaluating mitigation strategies for fossil fuels installation by correlating particulate matter, ozone and mercury emissions from fossil fuels with atmospheric levels of air pollutants through the use of chemistry transport models; and ii) a modelling framework that incorporates energy potential maps into energy models and subsequently integrated impact assessment models. Another example is the assessment of the percentage of heat demand coverage among different energy technologies in the Sauwald region (Austria)29.
2. Energy Access: The GEO Energy Team is currently working on the optimisation of the technical and economic integration of renewable energies into electricity grids and markets. Also, the Team is working on the risk management of energy installations such as energy grid and pipelines, for instance by developing an early warning system for hot spot areas. This will be achieved through collaboration with the GEO Disaster
25 http://www.aegos-project.org/index.php 26 http://www.eo-miners.eu/index.htm 27 http://www.impactmin.eu/index.php 28 http://www.energeo-project.eu 29 http://ispacesrv008.researchstudio.at/BioSpaceOpt/index_mix.jsp
l

PAC-5/Doc 3.2 Draft 1, p. li
Team active in risk management projects and the development of early warning systems. Furthermore, the Team is developing planning tools for new infrastructures including smart grid, and additional pilot projects in specific regions taking into consideration the energy resources of the region/country (e.g., Africa, Latin America).
3. Energy Efficiency: The improvement of energy efficiency is case specific and should be targetted mainly downstream at energy users. The GEO Energy Team has developed a tool for the residential sector whereby annual lighting energy savings resulting from the control of blinds and artificial lights by daylight, for building design and retrofit, energy regulation policy planning, and private investment are computed (EU project ENDORSE30). Another tool being developed concerns the optimization of the coupling between geothermal resources and solar energy, in such a way as to save on heating, cooling and power needed for the operation of greenhouses (pilot in Northern Greece, EU project ENERGEIA31).
Figure 12 – Modelling platform to forecast and monitor the environmental and health impact of various energy mix scenarios (EU project EnerGEO).
Although the American Society of Heating, Refrigerating, and Air-Conditioning Engineers (ASHRAE) standards have been used for decades for building energy efficient design and operations worldwide, some of the climate analyses in past ASHRAE climate information likely require improved country customization, at least for site specific values (IECC 2013). The International Energy Conservation Code (IECC) is used for locations worldwide. It contains different climate analyses, even for U.S. regions, and likely also requires improved customization by country, at least for site specific values32.
A number of different products have been developed by the other EU projects such as CLIMRUN33, EUPORIAS34, SPECS35, which although not solely focussing on energy applications have developed important examples of climate services for the energy industry.
The Metocean community is another very active area, probably for longer than any other energy related area. Over many years oil & gas (O&G) companies have together acquired a large volume of metocean data sets worldwide. Often these data sets are acquired at substantial cost and for remote areas. However there is not a common 30 http://www.endorse-fp7.eu/ 31 http://www.energeia-med.eu/ 32 http://reca-codes.org/about-iecc.php33 http://www.climrun.eu/34 http://www.euporias.eu/ 35 http://www.specs-fp7.eu/
li

PAC-5/Doc 3.2 Draft 1, p. lii
awareness of available data sets and no systematic indexing and archival of these data sets within the industry. Knowledge of metocean conditions is essential for the safe and efficient design, and operation, of offshore installations. Wind, wave current and tidal conditions at the location of the installation are the most important. However, other parameters, such as air and sea temperature, visibility and ice conditions may also be important, depending on the location and type of operations. This information is used also for supporting the planning of, for example diving operations and the installation of pipelines, and the forecasting of storms and heavy weather conditions, which might require timely evacuation or other safety measures to be taken during the operation of offshore installations. In addition, ‘once in a hundred years’ extreme metocean conditions need to be accounted for in the design stage – and estimating extreme values associated with return periods of 100 years and beyond is an area of active research.
The members of the International Association of Oil & Gas Producers (IOGP)36 promote the development of these vital metocean data, and the tools to leverage it, through the Metocean Committee. Twice a year, the metocean community of the O&G industry arranges meetings to discuss progress of the various Joint Industry Projects (JIPs), in which it is involved. These have included:
1. Generating hindcast databases of regions such as the South China Sea, West Africa and North Sea
2. Developing new methods 3. Comparing instruments such as wave sensors 4. Basic research such as the definition of distributions for wave crest elevations
Since June 2005, the EU project SIMORC (System of Industry Metocean data for the Offshore and Research Communities)37 has been developing an internet service with the aims: i) to manage and to operate a central index and database of metocean data sets, collected by the O&G industry at various sites on the globe in the past and continuing at present; ii) to facilitate harmonisation in quality and formats, storing and retrieving of these industry metocean datasets for use by industry partners and scientific users. Under the coordination of MARIS (Mariene Informatie Service “MARIS” BV), the IOGP engages participation by major O&G companies, bringing in their considerable data sets. This is done via a Limited Interest Project, which has been signed by major O&G companies such as Shell, Total, BP, Hydro, Statoil, and Chevron.
There have also been a number of knowledge sharing and capacity building efforts. Some of these are presented here roughly following a chronological order. The Utility Variable-Generation Integration Group (UVIG), previously known as the Utility Wind Integration Group (UWIG), was established in 1989 to provide a forum for the critical analysis of wind and solar technology for utility applications and to serve as a source of credible information on the status of wind and solar technology and deployment. The group’s mission is to accelerate the development and application of good engineering and operational practices supporting the appropriate integration and reliable operation of variable generation on the electric power system. To this end, some of UVIG’s activities are regular topical and technical workshops and user groups operating through live meetings, teleconferences, and listserv forums.
The NATO Advanced Research Workshop Weather/Climate Risk Managementfor the Energy Sector38 held in Italy in 2008 gathered around 30 participants including weather and 36 http://www.iogp.org/Metocean 37 http://www.simorc.org/ 38 http://www.albertotroccoli.org/CapacityBuilding/nato_arw/
lii

PAC-5/Doc 3.2 Draft 1, p. liii
climate scientists, engineers, economists, and other specialists in the use of energy and formulated recommendations aimed at improving the collaborative use of information by climate scientists and the energy industry (Troccoli et al. 2010). The ensuing International Conferences Energy & Meteorology (ICEM), with the inaugural one held in Australia in 201139, the second one in France in 201340, and the third one in USA in 201541, have been continuing and strengthening the dialogue between energy industry experts and the meteorological (weather and climate) community (Troccoli et al. 2013). The need for an increasingly stronger interaction between ICEM participants has resulted in the formation of the World Energy & Meteorology Council (WEMC)42, a non-profit organisation devoted to promoting and enhancing the interaction between the energy industry and the weather, climate and broader environmental sciences community. The primary goal of WEMC is to enable improved sustainability, resilience and efficiency of energy systems under ever changing weather and climate for the greatest benefit of all people. Working together with a large number of stakeholders, WEMC organizes and implements recommendations from the ICEMs.
The COST (European Cooperation in Science and Technology) network Weather Intelligence for Renewable Energies (WIRE)43, which run from 2011 to 2014, had two main lines of activity: the first was to develop dedicated post-processing algorithms coupled with weather prediction models and measurement data especially remote sensing observations; the second was to investigate the difficult relationship between the variable weather dependent power production and the energy distribution towards end users. Also, although not sector specific, the Climate Services Partnership (CSP)44, a platform for knowledge sharing and collaboration aimed at promoting resilience and advancing climate service capabilities worldwide, also has a (minor) chapter on energy.
A number of specialised sessions are also being held during conferences organized either by meteorological organisations – the American Meteorological Society with a Weather, Climate, and the New Energy Economy45 session since 2010 and the European Meteorological Society46 with an Energy Meteorology session also since 2010) or by energy industry bodies (e.g. American Wind Energy Association, SolarPaces).
In 2009 the Meter Online (MOL) was launched by CLP Power Hong Kong (CLP Power), a power utility that provides electricity to 80% of Hong Kong’s population, being a "saving energy through weather watch", with a high energy consumption client’s assistance orientation, through electricity utilization patterns.
The MOL service enables customers to have a timely access to their latest half-hourly energy consumption and demand profiles online, generating a consumption profile that together with the climate data generate an electricity demand pattern of each consumer, through a tailor-made regression model and with reference to HKO’s latest weather forecasts, giving the possibility to have energy-saving measures in relation to high temperatures high consumption days early alerts. As a result, after reviewing the MOL performance nine months after, 5% of electricity accounts were able to achieve energy savings.
39 http://www.icem2011.org40 http://www.icem2013.org41 http://www.icem2015.org42 http://www.wemcouncil.org43 http://www.wire1002.ch/44 http://www.climate-services.org45 http://annual.ametsoc.org/2016/index.cfm/programs-and-events/conferences-and-symposia/seventh-conference-on-weather-climate-and-the-new-energy-economy/46 http://www.emetsoc.org/meetings-events/ems-annual-meetings
liii

PAC-5/Doc 3.2 Draft 1, p. liv
liv

PAC-5/Doc 3.2 Draft 1, p. lv
ANNEX 3 – SPECIFIC EXAMPLES OF CLIMATE PRODUCT/SERVICESOn 23-24 March 2015, WMO organised a Private Sector Partnership Forum ‘Climate Services and Decision Support Tools for the Energy Sector’ held at the WMO Secretariat, Geneva, Switzerland47. This forum, which followed the approval by the GFCS governing board of the development of a component of the GFCS implementation plan (Exemplar) focused on climate services for the energy sector, and participated by a number of representatives from the energy sector and the meteorological community, identified specific high-priority weather, water and climate-related products and services for decision-support in the energy sector. It also highlighted specific contexts where such products and services could be initiated or strengthened, including what would be required in order to develop them. Seven climate product/services were developed during this Private Sector Partnership Forum:
Scenarios for energy mixes Delivering decision-support climatic scenarios data for use in the energy sector Multi-year prospective climatologies for the energy sector Training in the use of extended-range weather forecasts Seasonal forecasting for hydropower production Seasonal forecasting for energy demand Observations and reanalysis data for energy
Together with the activities mentioned in Annex 2 and the generic activities presented in 2.3 Suggested Priority Categories of Activities, this set of activities (expanded in the tables below) provides an appreciation of the scope and breadth of the products and services which the energy sector would benefit from, either in the form of improved available products/services or as new products/services to be developed. Note that no costing is provided for these activities – this is done deliberately as the cost will vary depending on the scope, size, and complexity of the specific project.
1 Scenarios for energy mixesProduct/Service Design energy mix and % for each component that will meet the country’s
electricity demand both near term and long term.Description 1.Demand must equal supply
2.Supply can be generated from a known mix of options3.Problem is to compartmentalise each energy component and define its
expected potential contribution to the energy mix.a. Using the current climate it is possible to build an expected (mean)
supply profile over a typical year (including diurnal and seasonal variability)
b. Based on climate record can then quantify variability around this mean supply profile to build a range of supply.
c. Need to explicitly identify thresholds at which extreme conditions impact supply (eg wind over a threshold and turbine must be turned off, cooling water for thermal plant eg nuclear reactor too high so need to wind back power generation)
d. Around these energy profiles build a further uncertainty range which is driven by those considerations that we don’t know with certainty eg climate change which we may have some confidence but also issues that are completely unknown
e. Other future considerations that can impact this supply profile should be considered such as whether storage solutions can modulate the effectiveness of a component such as PV which has a strong diurnal cycle.
f. Externalities must be acknowledged, for instance a dam may serve multiple purposes such as water supply, flood mitigation so that it may
47 http://www.wmo.int/worldmetday/content/private-sector-partnership-forum
lv

PAC-5/Doc 3.2 Draft 1, p. lvi
not be possible to operate it purely on the basis of energy production4.A unit cost of energy (possibly variable based on scale) can be derived (must
also acknowledge uncertainties in this, as it is impossible to accurately predict commodity prices etc. that some components will depend on)
5.Demand forecast should also be compartmentalised and its expected profile defined. Clearly seasonality affects, extremes in demand.
a. In same way need to identify future unknowns. For instance climate change may have future impacts on water availability in Mediterranean climates. Some countries are being forced to consider desalination which will become a large part of the electricity market demand side.
6.Problem becomes one of optimisation to match the profiles in demand with the mix of supply in the most cost effective way. The problem of the range of uncertainties in supply must be within the range of redundancy that will be required to meet the ultimate objective of supply always meeting demand at all cost.
Optimisation process7.Models exist to optimally deploy different energy sources in the day to day
operation of the energy network – names to be confirmed but they feed systems such as SCADA
8.Such models could be adapted to take as input our supply scenarios (with their ranges) to develop our planning mix of energy.
Using forecasting to tune optimal mix9.The energy mix has the potential to be tuned according to expected weather
conditions.10. For instance if the lowest cost component can produce more power
in the outlook period, its percentage should be maximised and other units can be wound back
11. There are existing systems (Supervisory Control and Data Acquisition, SCADA) that currently model the mix of different energy sources.
12. If NWP forecasts (and possibly climate outlooks) could be integrated into such decision support tools this would enable a better decision making process that more optimally tuned the energy mix.
13. Past data exists that could validate such a framework14. Some production systems have far more inertia than others and
there are limitation on their ability to stop and start15. The timescales for decision making around these high inertia
systems (e.g. only have 3 steam production systems running instead of 4 because confident there will be sufficient wind energy generated) are such that NWP forecasts are quite reliable. As such there is significant potential to use forecasts to supplement a system such as SCADA.
Regional Markets16. Where an energy market is not constrained to an individual country,
decisions around energy mix should not be made in isolation.17. If a country decides to change its energy mix this can bring surplus
energy to the market that makes other countries energy generated overpriced.
18. Such decisions have perverse political implications even if they bring a lower energy cost to the market. Accordingly the politics of such decisions need to be carefully worked through.
Storage of excess energy generated19. Some innovative solutions to the previous problem of cheaper
energy coming onto the market e.g. Switzerland: they purchase the cheapest energy (rather than use their own hydro) and then use the excess energy to pump water to a higher reservoir banking the potential energy. Effectively a water battery.
20. Others use this same concept domestically so they put in additional PV/wind to generate excess energy when they can, use this to pump water and then use the potential energy when the wind/solar is not available.
21. Such flexibility seems to be very valuable as there will be times
lvi

PAC-5/Doc 3.2 Draft 1, p. lvii
when generate more energy than required is generated, for the operator to have flexibility to bank some of the additional supply.
Objective Want to match the energy supply mix from each component including its variability to meet the expected demand in the most cost-effective manner acknowledging that demand must always be met. The tolerance for black outs is effectively zero.
Benefits Energy demand will be met through a well thought out range of expected scenarios (including climate change scenarios)
o Low tolerance for black outs will be avoided by pre-planning Energy mix will be provided in the most cost effective manner
Outputs Energy production profile of each energy mix (with ranges, uncertainties and unknowns built in)
Energy demand profile scenarios (with ranges and uncertainties or projections)
Optimisation tool to take into account component mix profiles as well as externalities
Activities Build profiles for each supply component Build profile for demand
Inputs Last 20 years of energy usage to build a model around energy demand Last 20(-100) years of climate information (solar, wind, rainfall, streamflow,
dam levels, etc). 20 years gives typical, 100 years gives better sampling for extremes to inform design e.g. 1 in 50 year extreme event
Partners Energy suppliers Climate data holders Infrastructure designers
2 Delivering decision-support climatic scenarios data for use in the energy sector
Product/Service Climatic projections for renewable energy generation, transmission and distribution
Description Climatic scenarios for sector-specific impact studies, including generation, transmission and distribution of energy.
Objective To provide the energy sector stakeholders with the relevant climate scenarios for the medium term (20–30 years) and long term (50–100 years) planning, according to the lifetime of the energy infrastructure (grid infrastructure, lines, stations, dams, equipment, management, power plants etc).
Benefits Inform and support political decision makers, Assist energy sector managers in their pursue of efficient energy planning, Address and support other concurrent sectors of the economy (e.g., farming,
water management, including drought or flood control) Inform and support the end users, including the citizens Improve operational activities such as regulation of dams and rivers Ensure the sustainability of the socioeconomic activities Efficient environmental security planning
Outputs Since we are targeting different social, economic and technical segments, the output should be custom made to fill in the needs of the user. So, gridded data should be provided to the engineering and science communities. However, charts, tables, diagrams should be more appropriate for easier understanding and interpretation by policy makers.
Guidelines to conduct impact studies Description of the methodology adopted so that it can be in principle applied
to any region. Software for downscaling and extracting the needed information for the
preparation of impact studies. Tools to interface climatic scenarios data with impact models. Uncertainty assessment studies.
Activities Selection of appropriate model or combination of models. Analysis of models’ performance/sensitivity.
If existing climatic scenarios for selected variables are not sufficient, then
lvii
PAC-5/Doc 3.2 Draft 1, p. lviii
adapt or post-process for more refined information. Search for existing climatic scenarios for selected variables (temperature and
rainfall, for example) and their spatial resolution. These can be used directly or post-processed for refined information, if needed.
Formulate the output according to user needs (gridded data, graphics, etc) Uncertainty estimation and capacity building. Ensure that the users are
informed of the uncertainties and be able to incorporate this information in their own simulation and decision processes.
Inputs Securing the necessary hardware, software and other resources (look for partnerships, if needed),
Determine the time frame for projections so that we specify the objective (i.e., decadal versus climatic projections),
Collection, formatting and archiving of existing data/observations to be used in model validation and hindcasts,
Search for existing climatic scenarios for selected variables (temperature and rainfall, for example) and their spatial resolution. These can be used directly if they fulfill the needs.
Partners Politicians Decision makers Researchers Energy regulators Energy commissions Meteorological services Industry representatives Regulators Financiers Citizens Regional climatic centres
3 Multi-year prospective climatologies for the energy sectorProduct/Service Provision of guidance on how to project climatologies for the future (10 - 30
years)Description There is a need for guidance on best practices for generating coarse spatial
resolution, but high temporal resolution climatologies that can be used as projections for the coming 10-30 years. The climatologies should include at least temperature and precipitation, and should retain realistic covariability in space and time. The information is to be used to help the energy sector anticipate significant changes in the demand and production pattern at regional scale
Objective High quality climatologies for anticipating changes in future demand and possible disruptions to supply
Benefits • Technical: better representation of possible climate outcomes to better operate existing energy systems by anticipating possible risks
• Management: scientifically validated methodologies for defining climatologies; harmonization of definitions
Outputs • Guidance document on methodologies for generating climatologies (short-term, GFCS year-4, i.e. first 2 years)
• The climatologies themselves, designed and organised by region (defined by interconnection of power networks – typically sub-continental) (longer term, GFCS year-6 and 10)
Activities First 2 years• RMP: Research on different methodologies (including dynamical, statistical
and hybrid) for projecting climatologies that retain realistic, temporal and spatial covariability.
• UIP: More thorough regionally and nationally based needs assessments for climate information for planning needs for the next few years. In particular, the need for projections that represent multi-annual variability may differ from region to region, as may the climate parameters of interest, definitions of extremes, and acceptable validation criteria.
lviii

PAC-5/Doc 3.2 Draft 1, p. lix
Subsequent 4 years• CSIS: RCCs and some NMHSs generate climatologies using recommended
methodologies.• CSIS: RCCs and some NMHSs validate climatologies with focus on extreme
events.Inputs • Historical high temporal resolution climatologies
• Decadal climate projections and relevant models (e.g., weather generators)• Reanalyses (including ensembles to represent uncertainties)• Validation criteria• Ancillary data for defining relevant spatial scales
Partners • Climate research community• Statistical modelers• Transmission System Operators (TSO)• National regulation authorities• Power companies
4 Training in the use of extended-range weather forecastsProduct/Service Two-way training on the need for and use of extended-range weather and intra-
seasonal forecastsDescription • There is a need for training of energy system manager and team members in
the use of probabilistic forecasts, including ensemble predictions and multi-model ensembles
• There is a need for training of climate scientists to understand the decision-making process and potential climate inputs of the energy sector
Objective Raise the awareness and mutual understanding between the climate and energy sector
Benefits • Better use of existing weather and climate information products• Improved service provision
Outputs • Training programme addressing different needs of possible target audiences• Workshop reports and recommendations where appropriate• Trained personnel in the energy and climate sectors• Online training materials focused on specific issues
Activities • CD and UIP: Formulation of a training programme addressing different needs of possible target audiences
• CD: A series of two-way 1- to 5-day training workshops• CD: Development of online training materials focused on specific issues
Inputs • Existing training materials, including online tools• List of training needs
Partners • Climate and energy research community• Energy community• Experts in training in cross-sectorial settings• IT experts for online materials
5 Seasonal forecasting for hydropower productionProduct/Service Provision of seasonal forecasts of dam inflowDescription There is a need to improve inflow 1- to 12-month forecasts at the scale of the
watershedObjective Optimise management of water resources for generating power in the context of
multiple usesBenefits • Better reservoir management, including less frequent water shortages for
power generation and other uses• Decreased cost of power generation• More reliable and cheaper supply of energy• Provision of information at appropriate resolutions
lix

PAC-5/Doc 3.2 Draft 1, p. lx
Outputs • Ensemble (rather than probabilistic) forecasts of monthly or seasonal accumulated dam inflow for the next 1 to 12 months
• Monthly or seasonal ensemble forecasts of daily rainfall and temperature for the next 1 to 12 months
Activities • RMP: Research to improve forecasts• RMP: Downscaling of climate information to relevant spatial and temporal
timescales• UIP: Working groups to assist in the design of the forecast system, and to
address possible constraints in using the information (e.g., legal constraints on standard operating procedures)
• RMP and UIP: Pilot studies to demonstrate value of using seasonal climate information
Inputs • Basin-level hydrological models• Monitoring and recent historical climate information for operational
forecasting• Historical climate and river-flow information for verification and for training of
statistical modelsPartners • Research community
• NMHSs• Dam managers
6 Seasonal forecasting for energy demandProduct/Service Seasonal forecasting temperature with a focus on high-impact eventsDescription There is a need to improve on the widespread use of climatology of anticipating
anomalous periods of demand for energyObjective Improve anticipation of large fluctuations in demand for energy, and thus reduce
the risk of power disruptionBenefits • Better anticipation of high-impact weather events resulting in improved
management of demand-supply balance; better scheduling of use of production units
• Lower production costsOutputs Prototype forecast products for high-impact temperature events (defined in
terms of area, duration and intensity)Activities • RMP: Improve forecast skill generally, and investigate predictability.
Verification.• UIP: Interaction to define criteria• CD: Training• CSIS: Seasonal forecasts
Inputs • Historical temperature data• Historical demand data• Seasonal forecasts• Downscaling tools• Criteria for definitions of relevant temperature events
Partners • Research community• NMHSs• TSOs• Energy companies
7 Observations and reanalysis data for energyProduct/Service Observations and reanalysis data needed for specific uses for power
generation, demand estimation and assessment of risks associated with extreme events
Description Meteorological variables needed for conversion to energy demand and supply and for estimation of risks
Objective Increased efficiency and cost-effectiveness at various stages of planning,
lx

PAC-5/Doc 3.2 Draft 1, p. lxi
design, and operation through the use of data in support of decision-makingBenefits Data inputs for improved:
• Long term plans• Resource assessments• Financing• Forecast development• Climate change scenarios• Risk assessment for design and management and insurance resulting in
improved outcomes for associated stakeholdersOutputs Solar data
Global Horizontal Irradiance Direct Normal Irradiance Cloud images Temperature (efficiency of PV) Wind gusts for risk assessment Hail for risk assessment
Wind data continuous wind speed and direction at different heights (80-100m) temperature (monthly summaries or more frequent) pressure roughness/land use
Hydro data precipitation soil moisture river flow wind temperature humidity soil type land use floods
Ocean data wave height wave direction wave spectrum bathymetry salinity current tides sea level
[Data needs of conventional energy TBD]
Extremes can be characterized from the above by specifying location, duration, magnitude and timing
Activities Define the requirements Inventory available information Evaluate usability/suitability of available data Define quality control and assurance criteria Perform appropriate downscaling of reanalyses Construct data product meeting requirements from available data if
necessary (e.g. reanalysis, blended product)Inputs TBDPartners NMHSs
GEO IRENA World Bank ESMAP Private sector (including as sources of observations, as well as consumers)
lxi

PAC-5/Doc 3.2 Draft 1, p. lxii
Insurance companies IPPs Research centers and academia Comprehensive nuclear Test Ban Treaty Organization (observation network
and international data center)
lxii
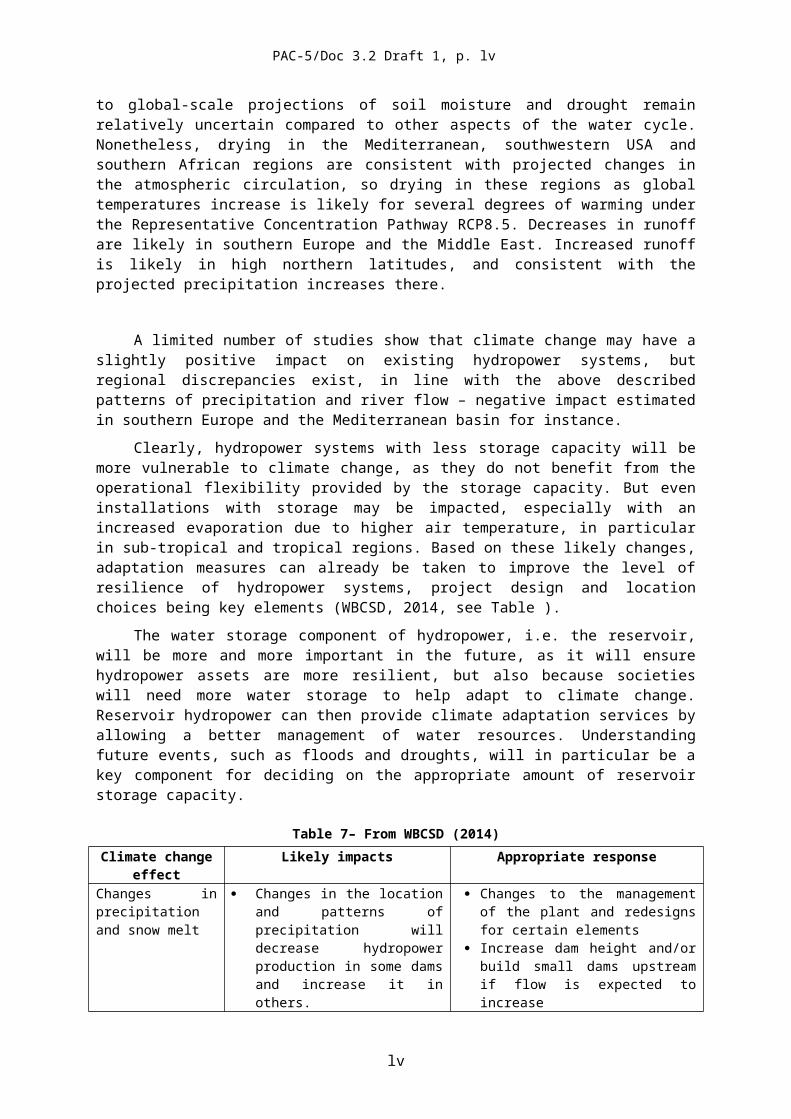
PAC-5/Doc 3.2 Draft 1, p. lxiii
ANNEX 4 – INTERNATIONAL ORGANISATIONS, PROGRAMMES AND COORDINATION MECHANISMS RELEVANT TO THE GFCS ENERGY EXEMPLAR
Here a list of organisations, amongst private energy companies, international associations, and regional projects, which have produced important climate services and/or can be key partners in mobilizing resources, is presented. The list is by no means exhaustive.
A4.1 (International) Energy CompaniesEDF (http://www.edf.com/)The EDF group is a leading energy player active in all major electricity businesses. EDF is committed to:
▪ Giving people a reliable, energy-efficient power supply backed by unbeatable customer service;
o Ensuring maximum energy safety;o Remaining at the forefront of energy technology—whether for nuclear, hydro,
wind, or solar power—and leading the drive towards a carbon-free world.
Hydro-Québec (http://www.hydroquebec.com/en/)Hydro-Québec is a major supplier of electricity, relying on clean, renewable energy. Hydro-Québec generates, transmits and distributes electricity. Its sole shareholder is the Québec government. It uses mainly renewable generating options, in particular large hydro, and supports the development of other technologies—such as wind energy and biomass. A responsible corporate citizen committed to sustainability, Hydro-Québec carries out construction projects to prepare for the future. It also conducts R&D in energy-related fields, including energy efficiency.
Total (http://www.total.com/en/)With its affiliates, Total is active in every segment of the oil and gas industry, plus solar energy, biomass and specialty chemicals. Total is a global energy company. Leveraging its integrated business model, Total operate across the oil and gas value chain, from exploration to marketing. Total are a top-tier chemical producer and is poised to become a leader in new energies. Total is organized into three interrelated business segments: Upstream, Marketing & Services and Refining & Chemicals.
Shell (http://www.shell.com/)Shell is a global group of energy and petrochemical companies. Shell strategy to generate profitable growth remains to drive forward with its investment programme, to deliver sustainable growth and provide competitive returns to shareholders, while helping to meet global energy demand in a responsible way. In Upstream Shell focuses on exploring for new oil and gas reserves and developing major projects where our technology and know-how adds value to the resource holders. In Downstream Shell emphasis remains on sustained cash generation from its existing assets and selective investments in growth markets.
A4.2 International OrganisationsESMAP (http://www.esmap.org/)ESMAP (Energy Sector Management Assistance Program) is a global knowledge and technical assistance program administered by the World Bank. Established in 1983, ESMAP is a global, multidonor technical assistance trust fund administered by the World Bank and cosponsored by 13 official bilateral donors. It provides analytical and advisory services to
lxiii

PAC-5/Doc 3.2 Draft 1, p. lxiv
low- and middle-income countries to increase their know-how and institutional capacity to achieve environmentally sustainable energy solutions for poverty reduction and economic growth. Supporting over a hundred activities in countries around the world at any given time, ESMAP is an integral part of the Energy and Extractives Global Practice of the World Bank.
ESMAP’s services for its client countries can be grouped into two categories:
▪ Technical Assistance and Policy Advice: This includes country-level activities to address specific national energy challenges, which are designed to inform country policy development and reforms, as well as follow-on investments by the World Bank Group (WBG), its development partners, and national governments. Other country-level engagements are grouped under strategic initiatives that leverage ESMAP’s experience and global resources. Examples include the Global Geothermal Development Plan, Renewable Energy Resource Mapping, and the City Energy Efficiency Transformation Initiative.
▪ Knowledge Products and Knowledge Exchange: ESMAP supports the development of global “public goods”: reports, decision-support tools and online knowledge resources that are designed to inform policymakers, technical specialists, and teams from the WBG and partner agencies. Examples include the Tool for Rapid Assessment for City Energy (TRACE), the Geothermal Handbook, the Renewable Energy Project Resource Center, and the Gender Online Resources. ESMAP also brings together countries to share experiences and disseminate global best practices on issues of mutual interest.
GSEP (http://www.globalelectricity.org/en)GSEP (Global Sustainable Electricity Partnership) is a not-for-profit organisation whose members are the world’s leading electricity companies. GSEP promotes sustainable energy development through electricity sector projects and human capacity building activities in developing and emerging nations worldwide. The mission of GSEP is to play an active role in addressing global electricity issues and to promote sustainable development worldwide, by:
• Developing joint policy frameworks and implement related initiatives in both domestic and international markets.
• Engaging in the global debates on electricity-related issues, taking joint positions.• Providing information and expertise on the efficient generation and use of electricity
to assist developing countries in strengthening their human capabilities.
GWEC (http://www.gwec.net/)GWEC (Global Wind Energy Council) is the international trade association for the wind power industry. GWEC is a member-based organisation that represents the entire wind energy sector. The members of GWEC represent over 1,500 companies, organisations and institutions in more than 80 countries, including manufacturers, developers, component suppliers, research institutes, national wind and renewables associations, electricity providers, finance and insurance companies.
GWEC mission is to ensure that wind power establishes itself as the answer to today's energy challenges, providing substantial environmental and economic benefits.
GWEC’s mandate from our members is to communicate the benefits of wind power - to national governments, policy makers and international institutions
GEWC provides authoritative research and analysis on the wind power industry in more than 80 countries around the world
lxiv

PAC-5/Doc 3.2 Draft 1, p. lxv
GWEC works with governments to give them transparent information about the benefits and potential of wind power, enabling them to make informed decisions about national energy policies
GEWC supports collaboration between policy makers in different countries to help them share best practices and experiences in adding clean power to their energy mix.
IAEA (https://www.iaea.org/)IAEA (International Atomic Energy Agency) is the world's centre for cooperation in the nuclear field. It was set up as the world's "Atoms for Peace" organization in 1957 within the United Nations family. The Agency works with its Member States and multiple partners worldwide to promote the safe, secure and peaceful use of nuclear technologies. As an independent international organization related to the United Nations (UN) system, the IAEA's relationship with the UN is regulated by a special agreement.
IEA (http://www.iea.org)Founded in 1974, the IEA (International Energy Agency) was initially designed to help countries co-ordinate a collective response to major disruptions in the supply of oil such as the crisis of 1973/4. While this remains a key aspect of its work, the IEA has evolved and expanded. It is at the heart of global dialogue on energy, providing authoritative statistics and analysis.
An autonomous organisation, the IEA examines the full spectrum of energy issues and advocates policies that will enhance the reliability, affordability and sustainability of energy in its 29 member countries and beyond. The four main areas of IEA focus are:
Energy security: Promoting diversity, efficiency and flexibility within all energy sectors;Economic development: Ensuring the stable supply of energy to IEA member countries and promoting free markets to foster economic growth and eliminate energy poverty;Environmental awareness: Enhancing international knowledge of options for tackling climate change; andEngagement worldwide: Working closely with non-member countries, especially major producers and consumers, to find solutions to shared energy and environmental concerns.
IOGP (http://www.iogp.org/Metocean)IOGP (International Association of Oil & Gas Producers) is the voice of the global industry. Oil and gas continue to provide a significant proportion of the world’s energy to meet growing demands for heat, light and transport. IOGP Members produce more than half of the world’s oil and over a third of its gas. IOGP serves industry regulators as a global partner for improving safety, environmental and social performance. IOGP also acts as a uniquely upstream forum in which IOGP Members identify and share knowledge and good practices to achieve improvements in health, safety, the environment, security and social responsibility.
IMarEST (http://www.imarest.org)IMarEST (Institute of Marine Engineering, Science and Technology) is an international professional body and learned society for all marine professionals. IMarEST is the first Institute to bring together marine engineers, scientists and technologists into one international multi-disciplinary professional body. IMarEST is the largest marine organisation of its kind with a worldwide membership based in over 100 countries, it is a registered charity and provides grades of membership for everyone, from those seeking to become Chartered
lxv

PAC-5/Doc 3.2 Draft 1, p. lxvi
or gain other Professional Recognition, to those just starting out in their careers or studying in education.
IMarEST works within the global marine community to promote the scientific development of marine engineering, science and technology, providing opportunities for the exchange of ideas and practices and upholding the status, standards and knowledge of marine professionals worldwide.
IRENA (http://www.irena.org)IRENA (International Renewable Energy Agency) is an intergovernmental organisation that supports countries in their transition to a sustainable energy future, and serves as the principal platform for international cooperation, a centre of excellence, and a repository of policy, technology, resource and financial knowledge on renewable energy. Currently, IRENA has 140 Members and 32 States have started the formal process of becoming Members. IRENA promotes the widespread adoption and sustainable use of all forms of renewable energy, including bioenergy, geothermal, hydropower, ocean, solar and wind energy in the pursuit of sustainable development, energy access, energy security and low-carbon economic growth and prosperity.
With a mandate from countries around the world, IRENA encourages governments to adopt enabling policies for renewable energy investments, provides practical tools and policy advice to accelerate renewable energy deployment, and facilitates knowledge sharing and technology transfer to provide clean, sustainable energy for the world’s growing population.
In line with these aims, IRENA provides a range of products and services, including: Renewable Readiness Assessments, conducted in partnership with governments
and regional organisations, to provide policy guidance and facilitate the sharing of case studies and best practices;
the Global Renewable Energy Atlas, hosted on the IRENA website, which maps solar, wind sources country by country;
the IRENA Renewable Energy Learning Partnership (IRELP), an online learning network;
Handbooks for renewable energy policy development; Technology briefs and cost studies to strengthen evidence-based policy-making and
investment; Facilitation of renewable energy planning at regional levels; Renewable Energy Country Profiles.
Specifically, the Global Atlas for Renewable Energy (Global Atlas, http://irena.org/globalatlas) is an initiative coordinated by IRENA, aimed at closing the gap between nations having access to the necessary datasets, expertise and financial support to evaluate their national renewable energy potential, and those countries lacking such elements. As of January 2015, 67 countries and more than 50 institutes and partners were contributing to the initiative. The Global Atlas facilitates a first screening for areas of opportunity where further assessments can be of particular relevance. It enables the user to overlay information listed in a catalogue of more than 1,100 datasets, and to identify areas of interest for further prospection. Currently, the initiative includes maps on solar, wind, geothermal and bioenergy resources along with one marine energy map. The initiative will eventually encompass all renewable energy resources, at the global scale.
UN-Energy (http://www.un-energy.org/)UN-Energy, the United Nations’ mechanism for inter-agency collaboration in the field of energy, was established in 2004 to help ensure coherence in the United Nations system’s multidisciplinary response to the 2002 World Summit on Sustainable Development (WSSD), and to support countries in their transition to sustainable energy. The core fields of access to
lxvi

PAC-5/Doc 3.2 Draft 1, p. lxvii
energy, renewable energy and energy efficiency – UN-Energy’s clusters – have garnered major attention and experienced rapid growth in investments and policy-related focus with an ever-growing number and variety of players involved.
UN-Energy aims to promote system-wide collaboration in the area of energy with a coherent and consistent approach, as there is no single entity in the United Nations system that has primary responsibility for energy. Its role is to increase the sharing of information, encourage and facilitate joint programming and develop action-oriented approaches to co-ordination. It was also initiated to develop increased collective engagement between the United Nations and other key external stakeholders. UN-Energy brings together members on the basis of their shared responsibility, deep commitment, and stake in achieving sustainable development.
UN-Energy's work is organized around three thematic clusters, each led by two United Nations organizations:
Energy access: led by UN DESA and UNDP, in partnership with the World Bank Renewable energy: led by FAO and UNEP, with support of UNESCO Energy efficiency: led by UNIDO and the IAEA
In addition, UN-Energy Africa (UNEA) was established as a subprogramme of UN-Energy focusing specifically on the African context. UN-Energy Africa is currently chaired by UN-HABITAT and co-chaired by UNIDO. UNEA's secretariat services are provided by UNECA and supported by UNIDO.
UVIG (http://uvig.org)UVIG (Utility Variable-Generation Integration Group), previously known as the Utility Wind Integration Group (UWIG), was established in 1989 to provide a forum for the critical analysis of wind and solar technology for utility applications and to serve as a source of credible information on the status of wind and solar technology and deployment. The group’s mission is to accelerate the development and application of good engineering and operational practices supporting the appropriate integration and reliable operation of variable generation on the electric power system.
WBCSD (http://www.wbcsd.org/)WBCSD (World Business Council for Sustainable Development) is a CEO-led organization of forward-thinking companies that galvanizes the global business community to create a sustainable future for business, society and the environment. From its starting point in 1992 to the present day, the Council has created respected thought leadership on business and sustainability. The Council plays a leading advocacy role for business. Leveraging strong relationships with stakeholders, it helps drive debate and policy change in favor of sustainable development solutions.
The Council provides a forum for its 200 member companies – who represent all business sectors, all continents and combined revenue of over $US 7 trillion – to share best practices on sustainable development issues and to develop innovative tools that change the status quo. The Council also benefits from a network of 60 national and regional business councils and partner organizations, a majority of which are based in developing countries.
By thinking ahead, advocating for progress and delivering results, the WBCSD both increases the impact of its members’ individual actions and catalyzes collective action that can change the future of our society for the better.
WEC (http://www.worldenergy.org)WEC (World Energy Council) is the principal impartial network of leaders and practitioners promoting an affordable, stable and environmentally sensitive energy system for the greatest benefit of all. Formed in 1923, the Council is the UN-accredited global energy body,
lxvii

PAC-5/Doc 3.2 Draft 1, p. lxviii
representing the entire energy spectrum, with more than 3000 member organisations located in over 90 countries and drawn from governments, private and state corporations, academia, NGOs and energy-related stakeholders.
The World Energy Council informs global, regional and national energy strategies by hosting high-level events, publishing authoritative studies, and working through its extensive member network to facilitate the world’s energy policy dialogue.
WEMC (http://wemcouncil.org/)WEMC (World Energy & Meteorology Council) is a fledgling non-profit organisation devoted to promoting and enhancing the interaction between the energy industry and the weather, climate and broader environmental sciences community. Its primary goal is to enable improved sustainability, resilience and efficiency of energy systems under ever changing weather and climate for the greatest benefit of all people. Working together with a large number of stakeholders, WEMC organizes and implements recommendations from the International Conferences on Energy and Meteorology.
A4.3 Government OrganizationsU.S. DOE (http://www.energy.gov)The U.S. DOE (Department of Energy) has as its mission to ensure America’s security and prosperity by addressing its energy, environmental and nuclear challenges through transformative science and technology solutions. The DOE catalyzes the timely, material, and efficient transformation of the nation’s energy system and secure U.S. leadership in clean energy technologies. It also enhances nuclear security through defense, nonproliferation, and environmental efforts. Moreover, it maintains a vibrant U.S. effort in science and engineering as a cornerstone of the U.S. economic prosperity with clear leadership in strategic areas.
A4.4 (International or Regional) Activities/ProjectsCLIM-RUN (http://www.climrun.eu)CLIM-RUN (Climate Local Information in the Mediterranean region Responding to User Needs) was the first EU FP7 project to focus on climate services with also an energy focus and run from 2011 to 2014. The objective of the CLIM-RUN project was to contribute to the creation in the Mediterranean area of a Climate Services Network, in line with the GFCS.
lxviii

PAC-5/Doc 3.2 Draft 1, p. lxix
CLIM-RUN will provide an important instrument for the development of a Mediterranean-wide network of climate services that would eventually confluence into a pan-European network.
To reach this aim, CLIM-RUN will pursuit the following:
▪ Increasing the quality, reliability and detail of climate information for societal use in the Mediterranean area by activating an effective exchange of information between the science and stakeholder communities, in key economic sectors: energy and tourism. These two sectors will be complemented by a cross-cutting issue, forest fires, whose occurrence in the Mediterranean concerns several business activities and by integrated case studies in which multiple sectors are involved.
▪ Developing a communication protocol by which climate information is transferred from the researchers to the stakeholders in order to develop suitable adaptation measures. The most innovative aspect in the development of this protocol will be its bottom-up approach, by which stakeholders will be involved in the design of the protocol from its early stages in conjunction and strong communication with the science community and the climate information providers (e.g. national and international Meteorological Centers). The protocol will be illustrated through its application to a series of case studies throughout the Mediterranean basin.
▪ Developing and providing training for a new research expertise lying at the interface between the science results and the stakeholder application.
▪ Developing a web-portal for:1. Integrating the different levels of climate and sector-relevant information and
tailoring the dissemination for different stakeholders (policy makers,business stakeholders etc.);
2. disseminating on-line surveys to increase the number of the stakeholders outside of the case-study level;
3. optimizing communication within and outside the project (e.g. web communication tools, blogs, social-networks) iv) supporting e-learning tools (training on-line, interactive material etc.).
COPERNICUS (http://www.copernicus.eu/)Copernicus is a European system for monitoring the Earth. Copernicus consists of a complex set of systems which collect data from multiple sources: earth observation satellites and in situ sensors such as ground stations, airborne and sea-borne sensors. It processes these data and provides users with reliable and up-to-date information through a set of services related to environmental and security issues. The services address six thematic areas: land, marine, atmosphere, climate change, emergency management and security. They support a wide range of applications, including environment protection, management of urban areas, regional and local planning, agriculture, forestry, fisheries, health, transport, climate change, sustainable development, civil protection and tourism.
The main users of Copernicus services are policymakers and public authorities who need the information to develop environmental legislation and policies or to take critical decisions in the event of an emergency, such as a natural disaster or a humanitarian crisis. Based on the Copernicus services and on the data collected through the Sentinels and the contributing missions, many value-added services can be tailored to specific public or commercial needs, resulting in new business opportunities. In fact, several economic studies have already demonstrated a huge potential for job creation, innovation and growth.
The Copernicus programme is coordinated and managed by the European Commission. The development of the observation infrastructure is performed under the aegis of the European Space Agency for the space component and of the European Environment Agency and the Member States for the in situ component.
lxix

PAC-5/Doc 3.2 Draft 1, p. lxx
GEO/GEOSS (https://www.earthobservations.org/geoss_en_ph.shtml)The Group on Earth Observations (GEO), established in 2005, is coordinating efforts to build a Global Earth Observation System of Systems (GEOSS) with a vision of a world where decisions and actions are informed by coordinated, comprehensive and sustained Earth observations. For this purpose, GEO fosters the coordinated and sustained access to Earth observations and their use for the global environment and human wellbeing. GEO’s Members include 90 countries and the European Commission plus 67 intergovernmental, international, and regional organizations. GEO is organized around nine areas, including energy, agriculture, biodiversity, climate, disaster, ecosystems, health, water, weather and also five cross-cutting areas, such as sustainability impacts, forests, land cover, ocean and urban. Interactions among these areas help citizens, scientists and policy makers address complex environmental issues in a cost efficient and effective way.
GEO Energy and Geo-resources Team
The GEO Energy and Geo-resources Team consists of top energy experts from four continents joined forces under the umbrella of GEO to develop tools and products that cover the specific needs of decision makers at multiple levels. This team develops tools and products that:
Facilitates user choice of the most appropriate products or tools given user’s capacities and needs;
Contributes to the monitoring and assessment of regional and global issues by allowing interoperability among the tools;
Provides a state of knowledge on existing related materials; and Identifies potential gaps and fills them.
EUPORIAS (http://www.euporias.eu/)EUPORIAS is a four-year collaborative project funded by the European commission under the seventh framework programme. EUPORIAS commenced on 1 November 2012. The EUPORIAS consortium is made up of 24 partners from across Europe and brings together a wide set of expertise from academia, the private sector and the national met services.
EUPORIAS intends to improve our ability to maximise the societal benefit of predictions of future environmental conditions. Working in close relation with a number of European stakeholders this project want to develop a few fully working prototypes of climate services addressing the need of specific users. The time horizon is set between a month and a year ahead with the aim of extending it towards the more challenging decadal scale. Representing a diverse community ranging from UN organisations to small enterprises, EUPORIAS will increase the resilience of the European Society to climate change by demonstrating how climate information can become directly usable by decision makers in different sectors.
SIMORC (http://www.simorc.org/)SIMORC (System of Industry Metocean data for the Offshore and Research Communities) was established to stimulate and support a wider application of industry metocean datasets. The SIMORC service aims at improving a common awareness of available data sets and a systematic indexing and archival of these data sets within the industry. It also aims at improving considerably reporting and access to these data sets & results of field studies for other parties, in particular the scientific community.
The SIMORC service is the result of a unique and challenging development, undertaken by major ocean data management specialists: MARIS (NL), BODC (UK) and IOC-IODE (UNESCO), and the International Association of Oil & Gas Producers (IOGP), involving participation of major oil & gas companies that bring in their considerable data sets.
lxx

PAC-5/Doc 3.2 Draft 1, p. lxxi
The initial development of SIMORC took place within the SIMORC project from 1st June 2005 till 1st December 2007 and has been co-funded by the European Commission. From 1st December 2007 onwards the SIMORC service is operated by MARIS and BODC in an arrangement with IOGP.
The SIMORC service had its public launch in March 2007. At present it covers more than 3600 data sets from Shell, Total and BP, covering more than 2000 years of observations of winds, waves, currents and sealevels. The SIMORC system is operational to serve users in identifying and getting access to data sets and to extend its coverage regularly with additional data sets from oil & gas companies.
SPECS (http://www.specs-fp7.eu/)SPECS is a EU FP7 project and is motivated by the need to develop 1) a new generation of European climate forecast systems that makes use of the latest scientific progress in climate modelling and in operational forecasting, 2) efficient local and regional forecast methods that produce skilful and reliable predictions over land areas for both the local and large scales, 3) clear examples of how actionable this climate information is for a range of stakeholders and 4) a strategy to disseminate and illustrate the usefulness of improved, high-quality climate prediction information and to integrate it with other climate services initiatives focusing mainly on the long-term climate change problem.
CM SAF (www.cmsaf.eu)The EUMETSAT Satellite Application Facility on Climate Monitoring (CM SAF) generates, archives, and distributes satellite-based climate data records. Among other parameters the CM SAF provides high-quality long-term data records of surface solar radiation based on geostationary and polar-orbiting satellite observations. The SARAH data record (Surface Solar Radiation Data Set - Heliosat, doi: 10.5676/EUM_SAF_CM/SARAH/V001) provides temporally (hourly, daily, monthly) and spatially (0.05° x 0.05°) highly resolved information on the global horizontal, the direct horizontal and the direct normalized surface solar radiation starting from 1983. The SARAH data record covers Europe, Africa, and parts of South America. A comparable data record starting 1999 is available covering Central Asia and the Western part of Australia. The CLARA data record (CM SAF Clouds, Albedo and Radiation dataset from AVHRR data, doi: 10.5676/EUM_SAF_CM/CLARA_AVHRR/V001) includes daily and monthly global information on the surface horizontal irradiance starting 1982 with a spatial resolution of 0.25° x 0.25°. These long-term climate data records are consistently and timely updated.
lxxi

PAC-5/Doc 3.2 Draft 1, p. lxxii
ANNEX 5 – RECOMMENDATIONS FROM WORLD BANK 2011
The following recommendations were made by ESMAP, World Bank, in the Ebinger and Vergara (2011) publication Climate Impacts on Energy Systems: Key Issues for Energy Sector Adaptation, with a clear focus on adaptation but which are appropriate for the GFCS Energy Exemplar too.
General Recommendations
Support awareness and knowledge exchange
There is a need to disseminate and learn from the increasing data and knowledge of climate impacts on the energy sector, and their management. To be able to take informed actions, it will be important to: (a) support better awareness of these issues with public and private decision makers, and (b) support access to state of the art data on the consequences of climate destabilization
Undertake climate impacts needs assessment
Location specific adaptation requirements are dependent on an analysis of impacts. Climate impact analysis is the first step toward the development of adaptation strategies. Such an assessment should quantify the impacts, and hence risks, and data and information needs through the energy life cycle to guide adaptation practice in any country. It should incorporate and critique existing practices and potentially include an assessment of the associated costs of impacts, and of con- sequences if climate risk management is not applied
Develop project screening tools
Develop templates to screen individual energy projects for climate vulnerability and risks, either retrospectively or during project planning and implementation. This should particularly target strategic and large-scale projects. Develop supporting guidance, information, and simple decision rules for climate risk integration into decision making (for example how to choose locations for new power plants, taking into account climate change impacts, or power plant robustness to extreme events). Simulation modeling could support the development of pertinent “what-if” scenarios
Develop adaptation standards for the energy sector
Such standards should cover engineering matters and information requirements. Though the development of standards is beyond the remit of the UNFCCC, it could be handled through the energy sector itself, through international organizations such as the UN, International Energy Agency (IEA), International Renewable Energy Association (IRENA), and universities or research institutions. The International Civil Aviation Authority could provide a model framework for an organization tasked with developing adaptation standards relevant to the energy sector. Agreement on, and enactment of, standards would require coordination with other pertinent organizations. Some examples include: standards for robust coastal infrastructure that take into account the anticipated strength of extreme weather events; revised zoning standards to minimize climate risks for future assets; and construction standards in traditional permafrost areas to accommodate changes in soil structural characteristics
Revisit planning timeframes and the use of historic data for future investments
Traditional planning approaches that use historic data may need to be revisited an adjusted to reflect anticipated climate trends. There is a need to review and implement changes in the use of historic data as a basis for future energy investments (for example, introduce weighting that reflects recent climate trends and adjust the shelf-life of investments where energy resource endowments are affected by climate change
Address potential climate impacts when retrofitting existing infrastructure
Planned retrofits of existing assets need to address climate impacts. Already available methodologies, such as energy or environmental audits, can help identify any needed changes in operational and maintenance protocols, structural changes and/ or the relocation of existing plants
lxxii

PAC-5/Doc 3.2 Draft 1, p. lxxiii
Implement specific adaptation measures
Adaptation measures can include a range of off-the-shelf (for example, the use of reverse osmosis units to address seawater intrusion in cooling water) and innovative solutions. In the latter case, this requires investment in pilot or demonstration projects to illustrate the costs and benefits of alternative adaptation strategies; and subsequent support to integrate results into large scale operations. There is also a need to expand the knowledge base through actions that:
Explore the interaction between water demand and use, and cross-sector and regional energy and water balances
Better understand the impacts of climate change on renewable resource potential (for example, wind, solar, biomass)
Explore synergies and trade-offs between climate mitigation and adaptation strategies for the energy sector
Identify options (technological and behavioural) to save cooling energy and reduce electrical peak load demand
Identify policy instruments
These are needed to support climate impact management— for example, policy instruments that support internalization of adaptation issues in energy operations; or, incentives to adjust planning and operational process to reflect longer timeframes
Support capacity building
Increase the capacity of key stakeholders, including energy sector policy makers, regulators, and operators, for climate risk management; in particular “bring policy makers up to speed”
Recommendations on Climate Information Networks
Observation Networks
In developing countries a key priority is to return deteriorating observation networks to minimum WMO standards. This will provide broader weather and climate benefits (including in calibrating satellite measurements) for the energy sector rather than immediate gains given the location-specific information needs for infrastructure-based decisions. However, energy information could be improved if basic weather and cli- mate networks are provided with platforms (ideally automated) or supported with on-going maintenance in areas with immediate benefit to the energy sector. Priority could be given to creating subsidiary hydro-meteorological networks (again ideally automated, perhaps including upper-air and offshore measurements) that would benefit current and planned energy sector activities. Assistance might also be provided to improve communications and capacity not only for a country to collect its own data but also to provide data to the international community and to receive and process data, including those from re-analyses and satellites.
Support Data Rescue and Archiving
There are various programs supporting data rescue, including one in WMO, but the need is extensive. Paper records need to be digitized, and documented climate information needs to be recovered, such as from missionaries’ diaries. Support is needed to build secure digitized data archives, ideally to a common standard, and to ensure archives are accessible and protected from possible destruction. If appropriate, extended climate series might be created using proxy data
Upgrade Resources for Weather and Seasonal Forecasts and Outlooks
In many countries resources for the delivery of forecasts, and the development and use of forecast models for the energy sector, could be upgraded substantially. Support needs include:
Facilities for receipt and processing of forecast information Capacity building for forecasters to interpret and verify advanced
forecasts, including from ensemblesBuild Capacity to Prepare Projections
Access to IPCC projections is straightforward, but developing countries re- quire substantial capacity building support to process, interpret, and
lxxiii

PAC-5/Doc 3.2 Draft 1, p. lxxiv
of Climate and Associated Impacts
produce national-level impact projections. The UNFCCC promotes adaptation through National Adaptation Programmes of Action (NAPAs) and the Nairobi Work Programme (UNFCCCNWP). The UNFCCCNWP provides a framework for capacity building. It includes national downscaling using RCM. RCMs can be an invaluable tool provided recognition is made of the inherent uncertainties.
Support Cross-Sector Dialogue
Facilitate engagement between weather and climate information providers and energy users (possibly at a regional level), with the aim of providing early warning and advisory climate services
lxxiv

PAC-5/Doc 3.2 Draft 1, p. lxxv
ANNEX 6 – RECOMMENDATIONS FROM WBCSD 2014
The following recommendations were made by the WBCSD in their 2014 report Building a resilient power sector.
Recommendations for the industry
Build expertise in analyzing climate information to better understand risks, especially downscaling global climate models to a more local level
Use risk management and risk-cost benefit analysis when developing adaptation strategies to determine which solutions are efficient and cost-effective
Continue investing in R&D to develop effective upgrades to major infrastructure elements, broadening the range of options and reducing costs over time
Pool learning, exchange best practice and share resources to respond more effectively to extreme events.
Recommendations for policymakers
Consider market signals and regional regulatory structures appropriate to local circumstances that can mitigate some of the risks
Support a business model that is viable in the context of climate change, including incentives for utilities to invest in adaptation
Adjust regulations to recognize the high-impact risks faced today and the likelihood of increasing frequency in future
Reflect climate risks in system specification and equipment standards.
Recommendations for public-private collaboration
Organize cross-sector collaboration for long-term infrastructure planning and organize mutual aid for crisis response.
Organize effective pooling of technical expertise, risk assessment and understanding of socioeconomic costs and develop new business models to price and manage risk
Develop more useful, local forecasts over time periods short enough to be relevant to business decision-making by giving utilities access to climate data and hydrological information
Improve public-private collaboration to share information, especially on a local scale, to improve community resilience
lxxv
PAC-5/Doc 3.2 Draft 1, p. lxxvi
6. REFERENCESAudinet P, Amado J C, Robb B, (2014) Climate risk management approaches in the electricity sector:
Lessons from early adapters. Weather Matters for Energy, Springer, New York, USA, pp 17-64. DOI: 10.1007/978-1-4614-9221-4_2
Carta JA (2012) 2.18 Wind Power Integration. In Comprehensive Renewable Energy, Vol. 2, 2.18, Elsevier Ltd. doi:10.1016/B978-0-08-087872-0.00221-3
Chhatbar K and Meyer R (2011) The Influence of Meteorological Parameters on the Energy Yield of Solar Thermal Power Plants. SolarPACES Conference Proceedings; 20–23 September 2011, Spain.
Davy R and Troccoli A (2014) Continental-scale spatial optimisation of a solar irradiance monitoring network. Solar Energy, 109, 36–44, doi: 10.1016/j.solener.2014.08.026
Dubus (2010) Practices, needs and impediments in the use of weather/climate information in the electricity energy sector. In: Troccoli A (ed) Management of weather and climate risk in the energy industry, NATO Science Series, Springer Academic Publisher, pp 175–188.
Dubus, L., (2014) Weather and Climate and the Power Sector: Needs, Recent Development and Challenges. Weather Matters for Energy, Springer, New York, USA, pp 379-398. DOI: 10.1007/978-1-4614-9221-4_2
Ebinger J and Vergara W (eds) (2011) Climate Impacts on Energy Systems: Key Issues for Energy Sector Adaptation, World Bank publication. Available at: http://www.esmap.org/sites/esmap.org/files/E-Book_Climate%20Impacts%20on%20Energy%20Systems_BOOK_resized.pdf
Emeis S (2014) Current issues in wind energy meteorology. Meteorol. Appl. 21: 803–819 (2014) DOI: 10.1002/met.1472
Energy Sector Management Assistance Program (ESMAP) (2012) Renewable Energy Resource Mapping. Available at: http://www.esmap.org/RE_Mapping
European Climate Foundation (ECF), the World Energy Council (WEC) and the University of Cambridge’s Judge Business School (CJBS) and Institute for Sustainability Leadership (CISL) (ECF/WEC/UoC) (2014) Climate Change: Implications for the Energy Sector. Key Findings from the Intergovernmental Panel on Climate ChangeFifth Assessment Report. Available at: http://www.worldenergy.org/news-and-media/news/climate-change-implications-for-the-energy-sector-key-findings-from-the-ipcc-ar5/
European Wind Energy Association (EWEA) (2009) Wind Energy – The Facts, a Guide to the Technology, Economics and Future of Wind Power. Available at: http://www.wind-energy-the-facts.org.
Gryning S-E, Badger J, Hahmann AN and Batchvarova E (2014) Current Status and Challenges in Wind Energy Assessment. In Troccoli A., Dubus L and Haupt SE (eds.), Weather Matters for Energy, Springer Science, 275-293 DOI: 10.1007/978-1-4614-9221-4_13.
Gueymard CA and Wilcox SM (2011) “Assessment of Spatial and Temporal Variability in the U.S. Solar Resource from Radiometric Measurements and Predictions from Models Using Ground-Based or Satellite Data.” Solar Energy (85), 1,068–1,084.
Haupt SE, Mahoney WP and Parks K (2014) Wind Power Forecasting. In Troccoli A., Dubus L and Haupt SE (eds.), Weather Matters for Energy, Springer Science, 295-318 DOI: 10.1007/978-1-4614-9221-4_14.
Hoffschmidt B, Alexopoulos S, Göttsche J, Sauerborn M and Kauffhold O (2012) High Concentration Collectors. In: Comprehensive Renewable Energy, Vol. 3, 3.06, Elsevier Ltd. doi:10.1016/B978-0-08-087872-0.00306-1
International Conference Energy & Meteorology (ICEM) (2011) http://www.icem2011.org ICEM (2013) http://www.icem2013.org ICEM (2015) http://www.icem2015.org International Energy Agency (IEA) (2013) Technology Roadmap: Wind Energy - 2013 edition.
Available at: http://www.iea.org/publications/freepublications/publication/Wind_2013_Roadmap.pdf
IEA (2013) World Energy Outlook Special Report. Available at: http://www.iea.org/publications/freepublications/publication/WEO_Special_Report_2013_Redrawing_the_Energy_Climate_Map.pdf
lxxvi

PAC-5/Doc 3.2 Draft 1, p. lxxvii
IEA (2014a) The Power of Transformation: Wind, Sun and the Economics of Flexible Power Systems. Available at http://www.iea.org
IEA (2014b) Technology Roadmap: How2Guide for Wind Energy Roadmap Development and Implementation. Available at: http://www.iea.org/publications/freepublications/publication/How2GuideforWindEnergyRoadmapDevelopementandImplementation.pdf
IEA (2015) Resilience of the energy sector to climate change. Web resource: http://www.iea.org/topics/climatechange/subtopics/resilience/ accessed on 6 April 2015.
International Energy Conservation Code (IECC) and ANSI/ASHRAE/IES 90.1-2010 (2013). Available at: http://www.techstreet.com/ashrae/products/1862478
Intergovernmental Panel on Climate Change (IPCC) (2011) Special Report on Renewable Energy Sources and Climate Change Mitigation. Working Group III of IPCC [O. Edenhofer, R. Pichs-Madruga, Y. Sokona, K. Seyboth, P. Matschoss, S. Kadner, T. Zwickel, P. Eickemeier, G. Hansen, S. Schlömer, C. von Stechow (eds)]. Cambridge University Press, Cambridge, UK and New York, USA, 1075 pp.
IPCC, 2013: Climate Change 2013: The Physical Science Basis. Contribution of Working Group I to the Fifth Assessment Report of the Intergovernmental Panel on Climate Change [Stocker, T.F., D. Qin, G.-K. Plattner, M. Tignor, S.K. Allen, J. Boschung, A. Nauels, Y. Xia, V. Bex and P.M. Midgley (eds.)]. Cambridge University Press, Cambridge, United Kingdom and New York, NY, USA, 1535 pp, doi:10.1017/CBO9781107415324.
International Renewable Energy Agency (IRENA) (2012). IRENA’s Interactive Geographic Database on renewable energy potentials. Available at: http://www.irena.org/resource/
Johnson FX and Lambe F (2009) Energy Access, Climate and Development. Stockholm Environment Institute for The Commission on Climate Change and Development. Available at: http://www.sei-international.org/mediamanager/documents/Publications/Climate/ccd_energyaccessclimateanddev2009.pdf
Johnston PC, Gomez JF, Laplante B (2012) Climate risk and adaptation in the electric power sector. Asian Development Bank publication. Available at: http://www.iadb.org/intal/intalcdi/PE/2012/12152.pdf
Kaldellis JK (2012) Wind Energy – Introduction. In Comprehensive Renewable Energy, Vol. 2, 2.01, Elsevier Ltd. doi:10.1016/B978-0-08-087872-0.00201-8
Karimirad M (2012) Mechanical-Dynamic Loads. In Comprehensive Renewable Energy, Vol. 2, 2.09, Elsevier Ltd. doi:10.1016/B978-0-08-087872-0.00210-9
Love G, Plummer N, Muirhead I, Grant I and Rakich C (2014) Meteorology and the energy sector. In Troccoli A., Dubus L and Haupt SE (eds.), Weather matters for energy, Springer, New York, USA, pp 221-235, DOI: 10.1007/978-1-4614-9221-4_10
Marion W and Wilcox S (1994). Solar Radiation Data Manual for Flat-Plate and Concentrating Collectors. NREL/TP-463-5607. Golden, CO: National Renewable Energy Laboratory.
Perry M and Troccoli A (2015) Impact of a fire burn on solar irradiance and PV power. Solar Energy, 114, 167–173, doi:10.1016/j.solener.2015.01.005
Renné D (2014) Emerging Meteorological Requirements to Support High Penetrations of Variable Renewable Energy Sources: Solar Energy. In Troccoli A., Dubus L and Haupt SE (eds.), Weather matters for energy, Springer, New York, USA, pp 257-273, DOI: 10.1007/978-1-4614-9221-4_12
Renewable Energy Policy Network for the 21st Century (REN21) (2015) Renewables 2015: Global Status Report. Available at: http://www.ren21.net/gsr
SBC Energy Institute (SEI) (2014) Introduction to the water and energy challenge. A FactBook in the Leading the energy transition series. Available at: www.sbc.slb.com/SBCInstitute
Schaeffer R, Szklo A, Frossard Pereira de Lucena A, Soares Moreira Cesar Borba B, Pinheiro Pupo Nogueira L, Pereira Fleming F, Troccoli A, Harrison A, Boulahya MS (2012) “Energy Sector Vulnerability to Climate Change: a review”, The International Energy Journal, 38, 1-12, doi: 10.1016/j.energy.2011.11.056.
Sengupta M, Habte A, Kurtz S, Dobos A, Wilbert S, Lorenz E, Stoffel T, Renné D, Gueymard C, Myers D, Wilcox S, Blanc P and Perez R (2015) Best Practices Handbook for the Collection and Use of Solar Resource Data for Solar Energy Applications. Technical Report, NREL/TP-5D00-63112. Available at: http://www.nrel.gov/docs/fy15osti/63112.pdf
lxxvii

PAC-5/Doc 3.2 Draft 1, p. lxxviii
Skoplaki E and Palyvos J (2009) Operating temperature of photovoltaic modules: a survey of pertinent correlations. Renewable Energy 34, 23– 29.
Tomson T, Russak TV, and Kallis VA (2008) Dynamic Behavior of Solar Radiation. In: Badescu V (ed.) Modeling Solar Radiation at the Earth’s Surface. Berlin, Germany: Springer.
Troccoli, A. (2009), Climate and the development community. Weather, 64: 25–26. doi: 10.1002/wea.350
Troccoli A (ed) (2010) Management of Weather and Climate Risk in the Energy Industry, NATO Science Series, Springer Academic Publisher.
Troccoli A, Boulahya MS, Dutton JA, Furlow J, Gurney RJ and Harrison M (2010) Weather and Climate Risk Management in the Energy Sector, Bull. Amer. Meteorol. Soc., 6, 785-88. Available at: http://dx.doi.org/doi:10.1175/2010Bams2849.1
Troccoli A, Audinet P, Bonelli P, Boulahya MS, Buontempo C, Coppin P, Dubus L, Dutton JA, Ebinger J, Griggs D, Gryning S-E, Gunasekera D, Harrison M, Haupt S-E, Lee TR, Mailier P, Mathieu P-P, Schaeffer R, Schroedter-Homscheidt M, Zillman J and Zhu R (2013) Promoting New Links Between Energy and Meteorology, Bull. Amer. Meteorol. Soc., ES36-40. Available at: http://dx.doi.org/doi:10.1175/BAMS-D-12-00061.1
Troccoli A, Dubus L and Haupt SE (eds) (2014) Weather Matters for Energy, Springer Academic Publisher, 528 pp.
Turney D and Fthenakis V (2011) Environmental impacts from the installation and operation of large-scale solar power plants. Renewable and Sustainable Energy Reviews, 15, 3261–3270
United Nations Development Programme (UNDP) (2005) Energizing the Millennium Development Goals: A Guide to Energy's Role in Reducing Poverty. Available at: http://www.undp.org/content/undp/en/home/librarypage/environment-energy/sustainable_energy/energizing_the_mdgsaguidetoenergysroleinreducingpoverty.html
U.S. Department of Energy (DOE) (2013) U.S. Energy Sector Vulnerabilities to Climate Change and Extreme Weather. DOE/PI-0013. Available at: http://energy.gov/sites/prod/files/2013/07/f2/20130716-Energy%20Sector%20Vulnerabilities%20Report.pdf
U.S. Environmental Protection Agency (EPA) (2009) Energy Efficiency as a Low-Cost Resource for Achieving Carbon Emissions Reductions. Available at: http://www.epa.gov/eeactionplan
Wilbanks TJ (2014) Implications of climate change for energy systems in a multisectoral context. In Pittock J, Hussey K and Dover S (eds), Climate, Energy and Water: Managing Trade-Offs, Seizing Opportunities. Cambridge University Press, 28-44.
Wiser, R., Z. Yang, M. Hand, O. Hohmeyer, D. Infield, P. H. Jensen, V. Nikolaev, M. O’Malley, G. Sinden, A. Zervos, 2011: Wind Energy. In IPCC Special Report on Renewable Energy Sources and Climate Change Mitigation [O. Edenhofer, R. Pichs-Madruga, Y. Sokona, K. Seyboth, P. Matschoss, S. Kadner, T. Zwickel, P. Eickemeier, G. Hansen, S. Schlömer, C. von Stechow (eds)], Cambridge University Press, Cambridge, United Kingdom and New York, NY, USA.
World Business Council for Sustainable Development (WBCSD) Electric Utilities (2014) Building a resilient power sector. Available at: http://www.wbcsd.org/resilience.aspx
World Energy Investment Outlook (WEIO) (2014) Special Report. An IEA publication. Available at: http://www.worldenergyoutlook.org/investment
World Meteorological Organization (WMO) (2011) Climate Knowledge for Action: A Global Framework for Climate Services – Empowering the Most Vulnerable. Report of the High-Level Taskforce for the Global Framework for Climate Services (WMO-No. 1065), Geneva, Switzerland.
WMO (2014a) Implementation Plan of the Global Framework for Climate Services, Geneva, Switzerland. Available at: http://www.gfcs-climate.org/implementation-plan
WMO (2014b) Agriculture and Food Security Exemplar to the User Interface Platform of the Global Framework for Climate Services, Geneva, Switzerland. Available at: http://www.gfcs-climate.org/food_and_security
WMO (2014c) Disaster Risk Reduction Exemplar to the User Interface Platform of the Global Framework for Climate Services, Geneva, Switzerland. Available at: http://www.gfcs-climate.org/disaster_risk_reduction
lxxviii

PAC-5/Doc 3.2 Draft 1, p. lxxix
WMO (2014d) Health Exemplar to the User Interface Platform of the Global Framework for Climate Services, Geneva, Switzerland. Available at: http://www.gfcs-climate.org/health
WMO (2014e) Water Exemplar to the User Interface Platform of the Global Framework for Climate Services, Geneva, Switzerland. Available at: http://www.gfcs-climate.org/water
World Energy Outlook (WEO) (2014) Factsheet. A IEA publication. Available at: http://www.worldenergyoutlook.org/media/weowebsite/2014/141112_WEO_FactSheets.pdf
World Energy Resources (WER) (2013) Survey. A World Energy Council (WEC) publication. Available at: http://www.worldenergy.org/wp-content/uploads/2013/09/Complete_WER_2013_Survey.pdf
Ye Z, Nobre A, Reindl T, Luther J and Reise C (2013) On PV module temperatures in tropical regions. Solar Energy, 88, 80–87.
Zafirakis DP, Paliatsos AG, and Kaldellis JK (2012) Energy Yield of Contemporary Wind Turbines. In Comprehensive Renewable Energy, Vol. 2, 2.06, Elsevier Ltd. doi:10.1016/B978-0-08-087872-0.00207-9
lxxix

PAC-5/Doc 3.2 Draft 1, p. lxxx
7. ACRONYMS
EWEA European Wind Energy AssociationCD Capacity DevelopmentCLIMRUN Climate Local Information in the Mediterranean region Responding to User NeedsCSIS Climate Services Information SystemEDF Electricité De France ESMAP Energy Sector Management Assistance ProgramFAO Food and Agricultural Organization of the United NationsGEOSS Global Earth Observation System of SystemsGHG GreenHouse GasesGSEP The Global Sustainable Electricity PartnershipGWEC Global Wind Energy CouncilICEM International Conference Energy & MeteorologyIAEA International Atomic Energy AgencyIEA International Energy AgencyIECC International Energy Conservation CodeIPCC Intergovernmental Panel on Climate ChangeIRENA International Renewable Energy AgencyNMHS National Meteorological Hydrological ServiceNWP Numerical Weather PredictionObs/Mon Observations and MonitoringREN21 Renewable Energy Policy Network for the 21st CenturyRMP Research Modelling and PredictionSE4ALL Sustainable Energy for AllSRREN Special Report on Renewable Energy Sources and Climate Change MitigationSEWRA Solar and Wind Energy Resource AssessmentUIP User Interface PlatformUN United NationsUN DESA United Nations Department of Economic and Social AffairsUNDP United Nations Development ProgrammeUNDEP United Nations Environment ProgrammeUNEA UN-Energy AfricaUNECA United Nations Economic Commission for AfricaUNESCO United Nations Educational, Scientific and Cultural OrganizationUNIDO United Nations Industrial Development OrganizationUS EPA United States Environmental Protection AgencyUS DOE United States Department of EnergyUVIG Utility Variable-Generation Integration GroupVRE Variable Renewable EnergyWBCSD World Business Council for Sustainable Development WEC World Energy CouncilWEMC World Energy & Meteorology CouncilWEO World Energy OutlookWMO World Meteorological Organization
lxxx