inequities in the utilization of obstetric care services
TRANSCRIPT

INEQUITIES IN THE UTILIZATION OF OBSTETRIC CARE SERVICES IN GHANA
AND ITS IMPLICATIONS FOR POLICY: EVIDENCE FROM A POPULATION-
BASED STUDY
A Thesis Submitted to the College of
Graduate and Postdoctoral Studies
In Partial Fulfilment of the Requirements
For the Degree of Doctor of Philosophy
In the School of Public Health
University of Saskatchewan
Saskatoon
By
Emmanuel Dankwah
Copyright Emmanuel Dankwah, October, 2020. All rights reserved.
Unless otherwise noted, copyright of the material in this thesis belongs to the author.

i
PERMISSION TO USE
In presenting this thesis/dissertation in partial fulfillment of the requirements for a Postgraduate
degree from the University of Saskatchewan, I agree that the Libraries of this University may
make it freely available for inspection. I further agree that permission for copying of this
thesis/dissertation in any manner, in whole or in part, for scholarly purposes may be granted by
the professor or professors who supervised my thesis/dissertation work or, in their absence, by
the Executive Director of the School of Public Health or the Dean of the College in which my
thesis work was done. It is understood that any copying or publication or use of this
thesis/dissertation or parts thereof for financial gain shall not be allowed without my written
permission. It is also understood that due recognition shall be given to me and to the University
of Saskatchewan in any scholarly use which may be made of any material in my
thesis/dissertation. I certify that the version I submitted is the same as that approved by my
advisory committee.
Requests for permission to copy or to make other uses of materials in this thesis/dissertation in
whole or part should be addressed to:
Executive Director, School of Public Health
University of Saskatchewan
104 Clinic Place
Saskatoon, Saskatchewan S7N 2Z4
Canada
OR
Dean, College of Graduate and Postdoctoral Studies
University of Saskatchewan
116 Thorvaldson Building, 110 Science Place
Saskatoon, Saskatchewan S7N 5C9
Canada

ii
ABSTRACT
Maternal and newborn morbidity, as well as deaths, are disproportionately high in the
African region, especially in sub-Saharan Africa. The majority of newborn and maternal
mortality happens either during childbirth or immediately after childbearing. Although the use
of obstetric services has proven to be vital in decreasing mortality arising from pregnancy
complications, only antenatal care service has received significant attention across the West
Africa region. Still substantial proportions of women in sub-Saharan Africa, including Ghana,
miss life-saving obstetric interventions such as labor and delivery care in health facilities,
caesarean section (CS) delivery, and postnatal care (PNC) services. In many low-income
countries, the high rates of non-use of obstetric services are a major impediment to attaining the
sustainable development goals (SDGs) on maternal and child health. Thus, evidence-informed
policy interventions need to consider the determinants of under- and non-use of obstetric services
among women of childbearing age. Research exploring the usage of obstetric services in
developing nations, particularly in Ghana, tended to focus on limited individual-level factors of
non-utilization using facility-based studies or convenience samples. Studies done thus far offer
mixed empirical findings on the utilization of obstetric services, rendering policymaking in this
area difficult and without clear direction. In addition to examining individual-level factors,
exploring utilization of obstetric services at a more aggregate level, for example, at the level of
community, are also warranted.
The objectives of this thesis are to (1) identify the social determinants of delivery in a
health facility among women in Ghana; (2) examine the association between socio-economic
factors and CS delivery among reproductive aged women in Ghana; (3) to assess the population
attributable risk of socio-demographic characteristics on the usage of PNC services; (4) explore
iii
spatial patterns of non-utilization of PNC services across communities and determine
community-level factors linked to PNC services in Ghana. The research has yielded the
following results:
1. An increased risk for delivering outside a health institution was identified among women
who had lower levels of education, low-income, who live in rural locality, have
experienced childbirth, and who lack knowledge about pregnancy-related complications.
2. Wealth-associated disparities in caesarean delivery was observed in Ghana. Further,
affluent and well-educated women had greater likelihood to overutilize CS delivery.
3. In the study population, a substantial proportion of PNC services use were attributable to
wealthier, highly educated, urban women who were Christians or Muslims.
4. From the 2-level mixed-method model, the community a woman resides in explains part
of the unobserved heterogeneity in PNC services utilization. Also, spatial patterns
identified hotspots of non-utilization of postnatal care services.
The central message from this dissertation is that inequalities in the use of obstetric services exist
in Ghana and measures to address the disproportionate utilization of this vital services call for
targeted policies that consider both individual and community-level factors.

iv
ACKNOWLEDGMENTS
I want to express my sincere appreciation to some outstanding individuals who have
contributed meaningfully in my doctoral degree journey and the completion of this doctoral
thesis. Firstly, I want to thank my academic supervisor, Dr. Marwa Farag, for her continuous
encouragement, inspiration, special guidance and meticulous review of the thesis. Secondly, I
want to reiterate my heartfelt gratitude to Dr. Rein Lepnurm, my co-supervisor, for his timely
and insightful feedback and the amazing guidance on this thesis. I enjoyed working as a teaching
assistant under him. Special gratitude to my thesis advisory committee: Dr. Shelley Kirychuk,
Dr. Carl D’Arcy, Dr. Wu Zeng, Dr. Cindy Feng for their invaluable comments and support. As
well, I would like to acknowledge all my professors at the School of Public Health for their time
and dedication, and MEASURE DHS for granting access to the 2014 GDHS dataset that was
used in this thesis.
I am also grateful for the financial support I enjoyed from the John Spencer Middleton &
Jack Spencer Gordon Middleton Bursary, the University of Saskatchewan School of Public
Health, CREATE-ITraP (NSERC) Scholarship, Ivan and Margaret Toutloff Bursary, and
Graduate Students’ Association (GSA) Winter Bursaries.
I want to thank my family for their unwavering support and love during my doctoral
studies. Particularly, I want to express my profound appreciation to my mum and dad, Reverend
and Mrs. Dankwah, for believing in me and praying for me even during difficult times. Also, I’m
highly grateful to my beautiful wife, Priscilla, and my cherished sons and daughter, Kwame,
Kwaku and Kharis for wholeheartedly loving and supporting me. To my awesome brothers:
Jerry, Stephen, and Isaac for the unflinching support they gave me.

v
TABLE OF CONTENTS
ABSTRACT ................................................................................................................................... ii
ACKNOWLEDGMENTS ........................................................................................................... iv
LIST OF TABLES ..................................................................................................................... viii
LIST OF FIGURES .......................................................................................................................x
LIST OF EQUATIONS ............................................................................................................... xi
LIST OF ABBREVIATIONS .................................................................................................... xii
Chapter 1. Introduction ................................................................................................................1
1.1. Pregnancy and Birth-related deaths ................................................................................. 2
1.2. Obstetric Care Services Utilization .................................................................................. 3
1.3. Purpose of the research work ............................................................................................ 5
1.4. Theoretical Framework: Andersen’s Behavioral Model ................................................ 7
1.5. Review of determinants of Obstetric Services Utilization ............................................ 10
1.5.1. Contextual-level Factors of Obstetric Services Utilization ......................................... 10
1.5.1.1. Community-level factors ........................................................................................... 10
1.5.1.2. Health System-level factors ...................................................................................... 11
1.5.2. Individual-level Factors of Obstetric Services Utilization .......................................... 12
1.5.2.1. Health Facility Delivery ........................................................................................... 12
1.5.2.2. Caesarean Section Delivery ..................................................................................... 17
1.5.2.3. Postnatal Care Utilization ........................................................................................ 21
1.6. Context of the Research ................................................................................................... 25
1.7. Obstetric Care Interventions in Ghana .......................................................................... 27
1.8. Ethical considerations ...................................................................................................... 29
References ................................................................................................................................ 29
Chapter 2. The Social Determinants of Health Facility Delivery Among Reproductive Aged
Women in Ghana .........................................................................................................................47
2.1. INTRODUCTION ............................................................................................................ 47
2.2. METHODS ....................................................................................................................... 49
2.2.1. Study Data ................................................................................................................... 49
2.2.2. A conceptual framework for health facility delivery ................................................... 49
2.2.3. Study variables ............................................................................................................ 51
2.2.4. Statistical Analyses ...................................................................................................... 54
vi
2.3. RESULTS .......................................................................................................................... 55
2.4. DISCUSSION ................................................................................................................... 67
2.5. CONCLUSION ................................................................................................................. 72
References ................................................................................................................................ 72
Chapter 3. Socioeconomic inequalities in the use of Caesarean Section Delivery in Ghana: a
cross-sectional study using nationally representative data ......................................................81
3.1. INTRODUCTION ............................................................................................................ 81
3.2. METHODS ....................................................................................................................... 83
3.2.1. Study data and variables ............................................................................................. 83
3.2.2. Statistical Analyses ...................................................................................................... 86
3.3. RESULTS .......................................................................................................................... 88
3.4. DISCUSSION ................................................................................................................... 98
3.5. CONCLUSION ............................................................................................................... 102
References .............................................................................................................................. 103
Chapter 4. Sociodemographic correlates of postnatal care services utilization among
Ghanaian mothers: a population attributable risk approach................................................114
4.1. INTRODUCTION .......................................................................................................... 114
4.2. METHODS ..................................................................................................................... 115
4.2.1. Study data .................................................................................................................. 115
4.2.2. Study variables .......................................................................................................... 116
4.2.3. Statistical Analyses .................................................................................................... 117
4.3. RESULTS ........................................................................................................................ 119
4.3.1. Descriptive statistics .................................................................................................. 119
4.3.2. Inferential statistics ................................................................................................... 119
4.4. DISCUSSION ................................................................................................................. 124
4.5. CONCLUSION ............................................................................................................... 128
References .............................................................................................................................. 128
Chapter 5. Assessing the Contextual Effect of Community in the Utilization of Postnatal
Care Services in Ghana .............................................................................................................139
5.1. INTRODUCTION .......................................................................................................... 139
5.2. METHODS ..................................................................................................................... 142
5.2.1. Study sampling and data source ................................................................................ 142
5.2.2. Study factors .............................................................................................................. 143
vii
5.2.3. Statistical analyses .................................................................................................... 148
5.3. RESULTS ........................................................................................................................ 152
5.4. DISCUSSION ......................................................................................................................167
5.5. CONCLUSIONS .................................................................................................................173
References .............................................................................................................................. 174
Chapter 6. Conclusions ..............................................................................................................182
6.1. The Flow of the Research work .................................................................................... 182
6.2. Methodological Considerations ..................................................................................... 184
6.3. Summary of Findings ..................................................................................................... 185
6.4. Implications of the Findings .......................................................................................... 187
6.5. Strengths and Limitations ............................................................................................. 190
6.6. Direction for future research ........................................................................................ 191
References .............................................................................................................................. 192
Appendix ................................................................................................................................ 194
Letter of exemption from ethical review ............................................................................. 194

viii
LIST OF TABLES
Table 2-1. Study Variable description .......................................................................................... 53
Table 2-2. Distribution of health facility delivery across sociodemographic predictors (N=4293)
....................................................................................................................................................... 58
Table 2-3. Unadjusted Odds ratio and 95% Confidence interval of having health facility delivery
by sociodemographic risk factors in the bivariate logistic regression analyses ............................ 62
Table 2-4. Results of the multicollinearity test ............................................................................. 63
Table 2-5. Adjusted Odds ratio and 95% Confidence interval of having health facility delivery by
sociodemographic risk factors in the multivariable logistic regression analyses ......................... 66
Table 3-1. Description of study variables ..................................................................................... 85
Table 3-2: Distribution of women by predictors and caesarean section (CS) delivery, and crude
odds ratio and 95% confidence interval of having CS delivery in univariable model ................. 90
Table 3-3. Results of the multicollinearity test ............................................................................. 92
Table 3-4. AORs and corresponding 95% CIs of having a caesarean delivery by predictors in the
multivariable logistic regression model ........................................................................................ 95
Table 4-1. Distribution of PNC services utilization across sociodemographic factors (N=4,292),
and Unadjusted odds ratio (UOR) and 95% confidence interval (CI) for socio-demographic
factors of utilization of PNC services in the unadjusted GEE model, Ghana, 2014. .................. 120
Table 4-2. Adjusted odds ratio (AOR) and PAR with 95% confidence interval (CI) and p-value
for sociodemographic factors of utilization of PNC services in the multivariable GEE model,
Ghana, 2014 ................................................................................................................................ 123
Table 5-1: Summary of study factors.......................................................................................... 147

ix
Table 5-2: Distribution of women by predictors and PNC services utilization, and unadjusted
odds ratios (UOR), 95%CI, and p-values for predictors of using PNC services among Ghanaian
women from the univariable 2-level logistic regression model. ................................................. 157
Table 5-3: Distribution of women by predictors and PNC services utilization, and unadjusted
odds ratios (UOR), 95%CI, and p-values for predictors of using PNC services among Ghanaian
women from the univariable 2-level mixed logistic regression model. ...................................... 160
Table 5-4: Results of multicollinearity test for selected predictors for the multivariable model 162
Table 5-5: Population-averaged Odds ratios (OR) and 95%CI for socioeconomic predictors of
using PNC services among Ghanaian women from the final 2-level mixed logistic regression
model........................................................................................................................................... 165
x
LIST OF FIGURES
Figure 1-1. Conceptual framework for obstetric care services utilization adapted from
Andersen’s health behavioural model [30] ................................................................................... 45
Figure 1-2 Map showing Administrative Regions of Ghana [26] ................................................ 45
Figure 2-1: Theoretical framework adapted from Andersen’s health utilization model for health
facility delivery ............................................................................................................................. 51
Figure 2-2. The receiver operating characteristic (ROC) curve of the final model ...................... 65
Figure 3-1. Receiver Operator Characteristics curve of the final model ..................................... 93
Figure 3-2. Distribution of caesarean delivery by wealth quintile, GDHS data 2014 .................. 96
Figure 3-3. Concentration curve for caesarean delivery, GDHS data 2014 ................................. 97
Figure 5-1: Map of Ghana and its location in Africa. Source: http://www.mapsopensource.com.
..................................................................................................................................................... 141
Figure 5-2. Hierarchical structure of the 2014 GDHS data. ....................................................... 143
Figure 5-3. Adapted Andersen’s health utilization model for PNC services utilization ............ 144
Figure 5-4. Distribution of postnatal care service utilization among reproductive aged Ghanaian
women, 2014 GDHS data. .......................................................................................................... 153
Figure 5-5: Map of Ghana showing significant clusters of non-utilization of PNC services ..... 154
Figure 5-6. Receiver Operating Characteristics curve of the final model .................................. 163
Figure 6-1: Research work flowchart ......................................................................................... 193

xi
LIST OF EQUATIONS
Equation 2-1: Logistic Regression Model for Health facility delivery......................................... 54
Equation 3-1: Logistic Regression model for CS delivery ........................................................... 86
Equation 3-2: Concentration index ............................................................................................... 88
Equation 4-1. The Population Attributable Risk equation for PNC services usage: ................. 118
Equation 5-1: Multilevel logistic regression model .................................................................... 149
Equation 5-2: Population-averaged Odds Ratios ........................................................................ 151
Equation 5-3: Variance Partition Coefficient (VPC) .................................................................. 151
Equation 5-4: Design effect ........................................................................................................ 152
xii
LIST OF ABBREVIATIONS
AIC-Akaike’s Information Criterion
ANC-Antenatal Care
AOR-Adjusted Odds Ratio
AUC-Area under the curve
BIC-Bayesian Information Criterion
CHPS-Community-based Health Planning and Services
CI-Confidence Interval
CS-Caesarean section
GDHS-Ghana Demographic and Health Survey
GPS-Global Positioning System
GSS-Ghana Statistical Service
ICC-Intraclass Correlation Coefficient
OR-Odds Ratio
PAR – Population Attributable Risk
PCA-Principal Component Analysis
QIC- Quasilikelihood Information Criterion
ROC-Receiver operating characteristics
PHC-Population and housing Census
SD-Standard deviation
SDG-Sustainable Development Goal
UOR-Unadjusted Odds Ratio

xiii
VIF-Variance Inflation Factor
VPC-Variance Partition Coefficient
WHO-World Health Organization
1
Chapter 1. Introduction
Unfortunately, every minute a mother dies from delivery in the world [1], and over 90%
of these deaths occur in low- and middle-income countries. For mothers that are fortunate to
survive childbearing, roughly 10 million of them are afflicted with pregnancy and birth-related
illnesses every year [2]. These maternal health figures underscore the relevance of strategic
interventions in low income countries, especially in the sub-Saharan Africa region.
While an appreciable increase in the availability of obstetric care services in some sub-
Saharan African countries has been observed lately, many women still do not benefit fully from
essential obstetric services. To improve the utilization of obstetric care services for underserved
populations, several interventions have been proposed in some jurisdictions, but their
implementation in sub-Saharan Africa has not yielded the expected results due to contextual
differences [3]. The Governments of most sub-Saharan African countries are still searching for
cost-effective and efficient interventions to improve obstetric care service utilization in order to
reduce maternal deaths. According to the Africa Progress Panel, governmental efforts ensuring
timely access and usage of obstetric care services can avert nearly 75% of maternal deaths and
complications arising from pregnancy and childbearing [3].
The government of Ghana and some non-governmental organizations (NGOs) have
prioritized improving coverage of obstetric care services (health facility delivery, Caesarean
Section (CS) delivery, and postnatal care (PNC) [4, 5] to reduce avoidable maternal deaths.
Additionally, policymakers are constantly exploring innovative and cost-effective ways to reduce
maternal deaths in Ghana [5]. Nevertheless, to formulate effective policies to increase and ensure
equitable use of obstetric care services, it is crucial to identify locally appropriate determinants

2
of obstetric care service use both at the individual and contextual level. Past studies reported that
several factors are linked to obstetric care usage[6]. For instance, a study in Ghana reported that
health insurance coverage alone is not enough to stimulate obstetric services use, but rather a
combination with other factors [6]. Therefore, it is paramount to understand the facilitators and
barriers of obstetric care services use that can be modified.
This chapter introduces the background about maternal and newborn deaths as well as
utilization of obstetric services in Sub-Saharan Africa and Ghana. Besides, a conceptual
framework on factors associated with obstetric services usage and relevant contextual
information about Ghana were described.
1.1. Pregnancy and Birth-related deaths
There are about 289,000 maternal deaths per year [7] and approximately 2.9 million annual
newborn mortalities [8] worldwide. Recent data revealed a global maternal death ratio of 211
deaths per 100,000 live births in 2017 [9] and a neonatal death ratio of 18 per 1,000 live births
in 2018 [10]. Nearly two-thirds of maternal mortality occurs post-delivery [11, 12]. However,
the situation is different for women living in low-and middle-income countries and those in
high-income countries, with the vast majority of maternal mortality occurring in low-income
countries [7, 8, 11, 12]. Specifically, compared to women in high-income countries, women
in low-income countries are 300 times more probable to experience maternal death resulting
from pregnancy and delivery complications [1, 2]. In addition, Rahman et al. [13] estimated
that in low-income countries, close to 40% of mothers encounter health issues after childbirth
while 15% experience fatal complications.
Notwithstanding the global priority to reduce maternal health risks facing women of
childbearing age in low-income countries, the problem is even more pressing in sub-Saharan

3
Africa where one out of 36 women will experience pregnancy-related deaths in their lifetime
[14]. The maternal health complication rates in sub-Saharan Africa contribute to approximately
66% of global maternal morbidities [14]. In addition, 1 in 36 newborns in sub-Saharan Africa
dies within one month of birth, accounting for roughly 38% of global neonatal deaths [15].
Available statistics indicated that in sub Saharan Africa the maternal mortality ratio was 533
deaths per 100.000 live births in 2017 and the neonatal mortality ratio was 27 deaths per 1,000
live births in 2017 [9, 10], which is higher than the global mortality ratio of 211 maternal deaths
per 100,000 live births [14] and the worldwide newborn deaths rate of 19 deaths per 1,000 live
births [15]. Together, these maternal and neonatal deaths disproportionally affect sub-Saharan
Africa region.
In Ghana, a sub-Saharan African country, despite the reduction from 484 deaths per
100,000 live births in 2000 to approximately 319 deaths per 100,000 live births [14], the
maternal mortality ratio is still high when compared with the 2017 global average of 211 deaths
per 100,000 live births. Comparing with sub-Saharan African average of 533 deaths per 100,000
live births in 2017 [16], Ghana has a lower maternal mortality ratio. The neonatal mortality ratio
of Ghana was about 24 deaths per 1,000 live births in 2017 [17] after a reduction from 43 deaths
per 1,000 live births in 2003 [18]. Ghana’s neonatal death ratio is lower than the sub-Saharan
Africa average of 27 deaths per 1,000 live births in 2017, yet higher relative to the global
average of 18 deaths per 1,000 live births in 2017 [17].
1.2. Obstetric Care Services Utilization
Most sub-Saharan Africa countries are not on track to achieving the Sustainable
Development Goal (SDG) on good health and wellbeing especially on the reduction of maternal
and neonatal deaths [14] largely due to the underutilization of obstetric services [19, 20]. To

4
ensure the SDG goals for both maternal and child health are met and to address the disparities of
maternal and newborn mortality in the sub-Saharan region including Ghana, concerted efforts are
required to increase the uptake of obstetric care services [21, 22]. More importantly, adequate
and continued use of essential obstetric care services is critical to ensure maternal and neonatal
survival [21-24]. Obstetric services encompass different levels of care, including antenatal,
health facility delivery, caesarean delivery, and postnatal care (PNC). Antenatal care (ANC)
refers to the monitoring of pregnant women to detect early complications; the goal is to protect
both mother and baby preemptively. Health facility delivery refers to childbirth inside of an
institution under the supervision of a health professional. A caesarean (CS) delivery is an
abdominal surgical intervention performed to deliver a baby [25]. Lastly, PNC is preventive care
meant to identify and manage complications shortly after delivery and up until six weeks post-
delivery [26].
Recent estimates indicate that almost every pregnant woman (98%) uses antenatal care
service in Ghana [27], a statistic that is above both the global (87%) and sub-Saharan Africa
(78%) percentage of women who had at least one ANC visit in 2019 [28]. Although other
obstetric services such as health facility delivery, CS delivery and PNC services have seen a rise
in the uptake, the expected continuous use of obstetric care services beyond ANC services
among pregnant women remains low. For instance, delivery at a facility with skilled care in
Ghana has increased from 46 percent in 2003 to 73% in 2014 [29]. This prevalence of delivery
care usage is less than Ghana’s ANC services (98%) in 2018 utilization [27] and the global
average of institutional delivery (76.4%) in 2019 [28]. Perhaps, the use of mobile community-
based ANC clinics could explain the discrepancies. On the other hand, the facility-based delivery
is greater than the sub-Saharan Africa prevalence of 59.5% in 2019. Likewise, CS delivery had
5
increased from 7% in 2008 to 12.8% in 2014 [29], however, the CS delivery in Ghana is lower
than the worldwide average of 21.1% and higher than the sub-Saharan Africa prevalence of 4.1%
[30]. Also, PNC services utilization within 41 days after birth has risen from 46.4% in 2003 to
84.6% in 2014 [29] which is higher than sub-Saharan prevalence of 42.8 percent [28].
1.3. Purpose of the research work
Despite the deliberate efforts of the government to increase both economic and physical
access to obstetric care services via a fee exemption policy for obstetric care, together with the
establishment of health posts in remote communities, discrepancies in the usage of essential
obstetric care services still exist among Ghanaian women [6, 31, 32].
Even though some studies have evaluated inequities in health facility delivery [33-36],
CS delivery [37-39] and postnatal care services [23] use in Ghana, there are several issues with
the existing research in Ghana. Firstly, most studies were restricted to specific geographical
settings [33, 35, 40] and others were hospital-based [34], which seriously affects the
generalizability of the study findings. For instance, Esena and colleagues [40] studied factors
related to delivery assisted by skilled attendants in the Ga East Municipality, one of 216 districts
in Ghana. The small sample size used by previous studies to examine factors that were linked to
health facility delivery makes it problematic to draw inferences for policy purposes. Although
Gudu and Addo (2017) used 400 Ghanaian women to ascertain factors that influence the decision
to choose a place for delivery [41], once geographic and demographic characteristics are
considered, the subpopulations are insufficient to draw policy conclusions. Secondly, the
majority of the authors used only descriptive statistics [40, 41] or a bivariate analysis [42, 43]
and only a few studies used a multivariable model [33, 36]. This makes controlling for
confounding variables deficient. Most studies in Ghana assessing postnatal care service

6
utilization were completed at the individual level [23, 44]. Thirdly, through an extensive
literature review, it is clear that there is a paucity of studies considering the influence of the
community where women live on postnatal care services even though there is growing evidence
that community-level factors influence health care utilization [45]. In addition, assessing spatial
clustering of obstetric care services is relevant to both detect hotspots of underutilization [46]
and to help guide resource allocation, which is limited in Ghana. Fourthly and most importantly,
previous studies’ findings varied both in magnitude and direction, perhaps due to the number and
type of variables that were studied, as well as the geographical context among other reasons.
Considering the identified gaps in research as well as the high maternal and neonatal
deaths in Ghana, it is crucial to comprehensively examine the socioeconomic and demographic
factors driving the discrepancies in the use of obstetric care services. Investigating these
characteristics will shed light on the dynamics of obstetric services use, and to guide the design
of policies and programs to improve accessibility to quality obstetric services and ultimately
reduce preventable infant and maternal deaths.
Therefore, using the Andersen theoretical framework, this research work explored the
socioeconomic and demographic factors that contributed to the underuse and lack of usage of
health facility delivery, CS delivery, and PNC services in Ghana.
The chapters of the dissertation articulate four manuscripts examining different aspects of
obstetric care utilization in Ghana. The second chapter will explore social determinants of
delivering at a health facility in Ghana. Chapter three will examine the socio-economic
inequalities in cesarean CS delivery. The fourth chapter will determine the sociodemographic
disparities in the utilization of PNC services. Chapter five will explore spatial autocorrelation of
non-utilization of PNC services and identify community-level characteristics influencing the use

7
of PNC services in Ghana. Chapter six summarizes the findings, deriving implications useful for
Ghana and other developing countries.
1.4. Theoretical Framework: Andersen’s Behavioral Model
Several theoretical frameworks and health behavior models including Andersen’s health
behavior, health belief model, young’s choice-making model, and proximate determinants
framework have attempted to better understand the factors influencing use or non- use of
healthcare services. The Health Belief Model [47] posits that an individual’s health-care
utilization choice is dependent on the perceived risk of becoming ill, severity of illness,
perceived balance of benefits against costs of treatment, and source of information on treatment
of illness. Young’s choice-making model [48] proposes that an individual’s decision making
around health care use is influenced by perceived severity of illness, awareness of alternative
treatment such as home remedy, belief in efficacy of treatment regime, and access to the
services. Moreover, Proximate Determinants framework combines both individual’s indirect
determinants such as socioeconomic status and proximate (intermediate) determinants [49].
Although, these models are useful in explaining individual health-care utilization decisions,
Andersen’s behavioral model is the only model, which explicitly includes community resources
and the health care system as variables influencing health care seeking decisions.
This study used Andersen’s model to guide the selection of potential variables
influencing the use of obstetric care services. The model has evolved over time starting as a
framework in the United States of America used to assess health care utilization at the
individual-level [50] and subsequently, modified to become a behavioral health model
encompassing the influence of individual-level, extrinsic and health care system characteristics

8
on health services usage [50, 51]. Later, this model has prominently been used to evaluate health
care utilization, especially in developing countries [23, 52-54].
Starting with individual-level characteristics, Andersen’s model broadly classified these
characteristics into predisposing, enabling and need factors. Based on this theoretical
perspective, predisposing factors represent an individual’s pre-existing characteristics that can
facilitate or impede health care use.
Enabling factors represent the wherewithal to seek health care services among
predisposed individuals and those in need of care. Generally, enabling factors influence both
economic and geographical access to care at the individual level.
Notwithstanding the powerful force that predisposing and enabling characteristics exert
on the utilization of health services, need factors remain at the foundation of health care
utilization. Need factors can either be evaluative or perceived. The evaluative need for health
care is borne out of clinical assessment by skilled professionals while a perceived need is based
on personal or self-evaluation, determined either from the perception of health status or the belief
about the efficacy of health care [51].
Based on Andersen’s theory, the community where an individual resides plays an
important role as well because it tends to alter health perception and practices, which may
eventually influence health utilization behavior.
Moreover, according to Andersen’s model, health system factors also influence the
decision of an individual to seek healthcare. Organizational, structural, and quality of care
variables all influence the decision to seek health services, including distance to a health facility,
travel time to seek care, transportation, and travel costs; all used in previous research as proxies
for health system factors [50, 51].

9
Despite the comprehensive nature of Andersen’s health behavioral model and the series
of modifications it has experienced, the model does have limitations. For instance, the model
fails to directly measure the effect of culture on access to health care. Yet, the model is
informative and useful to guide this research.
Predisposing
factors Enabling
factors
Individual-level characteristics
Health system
factors
Need
factors
Health facility
delivery usage
Caesarean
delivery usage
Postnatal care
(PNC) usage
Maternal age
Marital status
Religion
Ethnicity
Parity
Maternal
education
Financial/
Wealth status
Employment
status
Place of
residence
Perceived need
Told about
pregnancy
complications
Community
factors
Poverty level
Unemployment level
Area of residence
Women with at least
High school
Distance to health facility
Contextual-level characteristics

10
Figure 1-1. Conceptual framework for obstetric care services utilization adapted from
Andersen’s health behavioural model [50]
1.5. Review of determinants of Obstetric Services Utilization
This research adopts and modifies Andersen’s behavioral health model as depicted in
Figure 1-1. Andersen’s health care utilization model was used in organizing literature review of
the determinants of obstetric care services usage. Both contextual and individual-level
socioeconomic and demographic factors explaining the use of obstetric services are discussed.
1.5.1. Contextual-level Factors of Obstetric Services Utilization
The community-level and health system-level factors were believed to have an effect on
the use of obstetric care services. A review of the findings of previous studies have been
highlighted.
1.5.1.1. Community-level factors
Community-level factors have been demonstrated in earlier studies to influence obstetric
care services utilization. However, a study by Darega et al [55] stated that employment status has
no strong relationship with health facility delivery. Other studies have found a significant
association between health facility delivery and area of residence [56-58], concentration of
women with higher education [56-59] and community’s poverty level [21, 60].
Also, a study in Bangladesh found that health facility delivery was concentrated among
communities with high wealthier households (OR=1.15, 95% CI 1.03 to 1.28), and educated
women (OR=1.25, 95%CI 1.07 to 1.34) [58].
11
The impact of community-level characteristics on CS delivery has been established in
developing countries [61]. Yaya et al [6] indicated that neighborhood socio-economic status;
which was generated from education level, rural, unemployment rate, and poverty level of the
neighborhood; had significant effects on CS delivery in public health care.
Moreover, some researchers have disaggregated community-level socioeconomic status
to test the differential effect of factors including community poverty level, education level
among others on PNC use [62, 63]. Although Mohan et al [62] and Jacobs et al [63] identified
significant unobserved community-level variance of 0.47 and 0.43 respectively, the community
poverty level, education level and type of residence were not significantly associated with PNC
services usage.
1.5.1.2. Health System-level factors
Past studies have linked the utilization of obstetric services to health system-level factors
especially distance to a health facility [64, 65]. Some researchers reported the strong effect of
distance to a health facility in a community on health facility delivery [64]. Similarly, other
investigators found the association between PNC services usage and distance to a health facility
to be significant [65]. The Somefun and Ibisomi (2016) study in Nigeria identified that women
who had major problems with distance to nearest health facility had 0.83 times lower likelihood
of using PNC services than those without a big problem concerning distance to nearest health
facility [65]. However, a review of earlier studies shows that insignificant association between
the use of obstetric care services and distance to a health facility has been discerned. The Anwar
et al., (2008) study revealed that the likelihood of having CS delivery was not significantly
different between women with distance to hospital of 5 or more kilometers and women who

12
reside less than 5 kilometers from the hospital [66]. Finally, some authors reported that the effect
of distance to a health facility on PNC services were not significant [62, 66-68].
1.5.2. Individual-level Factors of Obstetric Services Utilization
As depicted in Figure 1-1, maternal age, ethnicity, marital status, parity, religious
affiliation, and maternal education were used as predisposing factors alongside enabling factors
(wealth/financial status, place of residence and employment status) and need factor (told about
pregnancy complication) in this current study as individual-level characteristics to investigate the
utilization of obstetric care services.
1.5.2.1. Health Facility Delivery
This section summarized the results that were discerned concerning associations between
health facility and some sociodemographic factors including age, marital status, religion,
ethnicity, parity, number of living children, education, place of residence, employment status,
wealth and perceived need characteristics.
Age
Associations between health facility delivery and age have been tested [35, 36, 42, 69-
72]. For instance, a study by Speizer et al [72] found that health facility delivery among women
between the ages of 25 and 34 years was not significantly different from women who were below
25 years. Likewise, no significant difference in delivery at a health facility was detected between
women aged 35-49 years and those less than 25 years [72]. However, Chubike and Constance
(2013) found a significant association between maternal age and health facility delivery [73].

13
This conflicting finding may be due to different geographical context: Speizer et al [72] focused
on only Ghana’s central and northern districts while Chubike and Constance [73] studied urban
Abakaliki in Nigeria, but did not control for confounding variables.
Marital status
Studies have investigated the link between marital status and health facility delivery [36,
69, 70]. For example, Enuameh et al [36] reported no strong difference in health facility delivery
among women who were cohabiting, divorced or separated or widowed and never married when
compared with married women. On the other hand, marital status have shown a predictive effect
on health facility delivery in earlier studies done in developing countries [74, 75]. In the case of a
study conducted in Tanzania, married women had lower likelihood of having a supervised
delivery in a health facility when compared to single women (OR=0.41, 95% C.I.: 0.25–0.66).
This variation in results may be because of the larger sample size used by Enuameh et al [36] as
well as the cultural diversity between Ghana and Tanzania.
Religion
Various articles examined the influence of religion on health facility delivery [35, 36, 69-
72]. Some found no significant association between religion and health facility delivery [36, 71,
76] whereas others have found a strong association between health facility delivery and religion
[35, 69, 70]. Boah et al [35] reported that Muslim women were more likely to have health facility
deliveries than traditional believers. The study of Speizer, Story and Singh (2014) revealed that
women who were traditional believers or had no religion or belong to other minority religions
had a lower likelihood of delivering at a health facility than Christian women [72]. Perhaps,

14
these discrepancies in the findings reported by the authors could be due to the differences in
sample size, study design, geographical and cultural contexts.
Ethnicity
Concerning the influence of ethnicity on health facility delivery, some of the authors
reported no significant association between health facility delivery and ethnicity [35, 36, 70-72].
Among the studies that found a significant association between ethnicity and health facility
delivery, Adu et al [69] revealed that women from the northern background were more likely to
use health facility for delivery relative to Akans. Similarly, another study found that the odds of
giving birth at a health facility were greater among Mole–Dagbani and Mande women than
Akans [42]. Conversely, Gurma women had lower propensity of having health facility delivery
[42]. The incoherent findings from these studies, may be due to the differences in the criteria for
the selection of study participants. While many studies used nationwide data of women of
childbearing age [42, 69], some researchers studied only women from just two out of the ten
regions of Ghana [72].
Parity
Several earlier studies assessed the effect of parity on health facility delivery [35, 36, 42,
69, 70, 72], documenting that the parity of the women had no significant effect on health facility
delivery [36, 70]. Others found a negative association between parity and health facility delivery
[35, 42, 69, 72]. According to a study by Dickson et al [42], women who have four or more
birthing experiences were less likely to have health facility delivery compared to those with less
than 4 births. Similarly, Adu et al., (2018) found that women with 3 to 5 births and 6 or more
births were less likely to have health facility delivery relative to women with births lower than 3

15
[69]. These varied results may be attributed to the sample size, geographical as well as cultural
differences. Therefore, to minimize contextual effects, Boah et al [35] studied only 423 women
in a district in northern Ghana with predominantly common cultural practices.
Maternal education
Regarding education, many studies presented the impact of education on health facility
delivery [35, 36, 42, 69-72]. The researchers reported mixed findings. On one side, an
insignificant association between education and health facility delivery was reported [35, 36, 70],
on the other side some studies indicated a significant association between maternal education and
health facility delivery [42, 69, 71, 72]. Speizer et al [72] estimated that the likelihood of
delivering at a health facility were higher among women who had primary and at least
secondary education than women without formal education. Similarly, Dickson, Adde and Amu
(2016) found that odds of having health facility delivery among primary and secondary educated
women in rural Ghana were 30% and 84% greater than uneducated women [42]. Further, some
studies revealed that the effect of a partner’s education on health facility delivery was significant
[42, 71]. Dickson et al [42] reported that a woman with a partner who had primary, secondary
and higher education were more probable to give birth at a health facility than those with no
formal education. But Dickson et al [42] failed to control confounding variables such as wealth
status, and employment status that has the potential to influence the association.
Financial/Wealth status
Most studies conducted in other developing countries [77-79] reported that wealth status
is a key determinant driving the choice of the place to deliver a baby. Most studies explained the
effect of wealth or financial status on health facility delivery in terms of the indirect costs

16
associated with birthing at a health facility especially in the context where facility delivery is a
public good [80-82]. Some authors indicated that transportation cost can cause a delay in seeking
a health facility for delivery [83] and even birthing outside a health facility [81, 84]. Perhaps, the
extra cost associated with the purchase of delivery products such as detergents, diapers, sanitary
pads, bed sheets, and many others at the health facility further pushes poorer mothers away from
having facility-based delivery as expressed in a similar study [85]. Also, studies in India reported
that the main factor in women’s decision to have health facility delivery is affordability [86];
wealthier women tend to have the autonomy to freely make an informed choice about the place
to give birth [87].
Employment status
Previous researchers have investigated the influence of employment status on health
facility delivery [35, 69, 71, 72]. However, the authors reported varied results. The disparities in
findings could be attributed to smaller size [35], and limited geographical coverage [72]. No
strong associations between employment status and health facility delivery were reported [69,
71]. Conversely, some studies stated a strong association between employment status and health
facility delivery [35, 72]. Speizer et al, (2014) revealed that the probability of delivering at a
health facility was greater among women who were farmers and self-employed than unemployed
women (OR=0.73, 95%CI: 0.56-0.96), after adjusting for confounding variables [72].
Place of residence
Prior studies assessed the effect of residing place of women on health facility delivery
[69-71]. The Adu et al. (2018) study detected a significant association between place of
residence and health facility delivery revealing that the odds of having health facility delivery
17
among rural dwellers were lower than urban women (OR=0.51, 95%CI: 0.17-0.85) [69].
However, other studies reported no strong association between health facility delivery and place
of residence [70, 71].
Knowledge of pregnancy complications
According to the Mpembeni et al., (2008) study conducted in Tanzania, a significant
association was established between knowledge of pregnancy complications and delivering in a
health facility under the supervision of skilled health professional [74]. This study reported that
after adjusting for confounding variables, the odds of delivering in a facility with skilled
attendants was about 3 (OR=2.95, 95% Confidence interval (CI): 1.65-5.25) times higher among
women with moderate knowledge of pregnancy risk factors than those with no knowledge on
pregnancy risk factors [74]. The review of the studies conducted in Ghana found that none
examined the effect of knowledge of pregnancy complications on the use of health facility
delivery.
1.5.2.2. Caesarean Section Delivery
There are many studies that have investigated the effect of women’s socio-economic
characteristics on CS delivery [38, 66, 88, 89]. Evidence from past studies have been
summarized based on the factors such as age, marital status, religion, ethnicity, parity, number of
living children, maternal education, wealth status, employment status and place of residence.
Age
Previous studies have examined the role of maternal age on uptake of CS delivery [38,
88, 89]. Some studies reported that age influences CS delivery [38, 89]. Khawaja et al [89]

18
intimidated that older women aged 20-29 years, 30-39 years and > 40 years were 1.50 times,
1.83 times and 3.75 times respectively more likely to have CS delivery than younger women
(below 20 years). However, studies in Ghana [88] and India [90] found no significant association
between age and CS delivery. The incoherence in results could partially be ascribed to the fact
that some of the studies were hospital-based and sample size were smaller [88, 90].
Marital status
Despite the importance of marital status of women on CS delivery reported in other
countries [91, 92], an insignificant association was reported by Manyeh (2018) in Ghana [38].
The conflicting findings could be attributed to the fact that Fairley et al [91] conducted their
study in Scotland, a developed country which has a different demographic and cultural setting.
On the other side, the Manyeh et al [38] carried out their investigation in only Greater Accra
region of Ghana.
Religion
The effect of religion on CS delivery have been published in some developing countries
[66, 93, 94]. A study in India found that Christian women had lower likelihoods of having CS
delivery than Hindu women [93] whereas another study discovered that Bangladeshi women
who belong to other religious group relative to Muslims were more likely to have CS delivery
(OR=2.05, 95%CI: 1.22–3.43) [66]. There is no clear direction and magnitude of the effect of
religion on CS delivery. On top of that, no study has been done in Ghana to ascertain the
influence of women’s religious affiliation on CS delivery.

19
Ethnicity
Regarding the association between ethnicity and CS delivery, some studies have been
carried out [95, 96]. A study conducted in the United States reported a significant association
between ethnicity and CS delivery [96]. A similar study that was conducted in India revealed that
Turks were less likely to have delivery by CS than Persians (OR=0.77, 95%CI: 0.60- 0.99) [95].
Nonetheless, extensive literature search finds that no study in Ghana has investigated the
association between ethnicity and CS delivery.
Parity
The influence of parity on caesarean delivery been reported in earlier studies [38, 88, 89,
95]. Many of the studies indicated that parity of women was significantly associated with CS
delivery [38, 95, 97, 98]. For instance, Yassin and Saida (2012) a study revealed that women
who have given birth thrice or more were more likely to have CS delivery relative to women
with two or less birthing experience (OR=2.0, 95%CI: 1.6-2.4) [98]. However, other studies
found no significant association between parity and caesarean delivery [88, 89]. The
demographic distribution and geographical difference of the study locations as well as the use of
smaller sample size, and the hospital-based nature of some of the studies could explain the
discrepancies in the findings.
Education
The association between education and caesarean delivery has been examined [38, 88,
93]. Apanga and Awoonor-Williams (2018) reported that women who attained secondary or
higher were less likely to have a caesarean delivery than those with primary or no education [88].
On the other hand, Manyeh et al., (2018) found that women who had primary, junior high and at

20
least senior high education were more likely to have caesarean delivery than uneducated women
[38]. Also, no strong association between CS delivery and women’s education was found by
other studies [89, 90]. The contrasting findings could be attributed to differences in the study
design. As an example, Apanga and Awoonor-Williams [88]employed case-control study design
while Manyeh et al [38] used cross-sectional study design. Some of the studies were hospital-
based [90] whilst others used smaller sample sizes [88, 90].
Wealth status
Though the negative association between wealth status and CS delivery has been reported
elsewhere [99], others have indicated a positive effect of wealth status on CS delivery [93, 100-
102]. The Manyeh et al., (2018) study found that women who were poorer, middle-class, richer
and richest had higher likelihood of having CS delivery than poorest women [38]. Perhaps this
may be attributed to the ancillary costs linked to seeking CS delivery as stated in similar studies
[103, 104]. These studies indicated that indirect costs such as unapproved fees, income loss from
inability to work, travel and transportation costs, prevent vulnerable groups from accessing this
surgical procedure [103, 104]. The concentrated CS delivery among women with lower financial
restrictions could be explained by the perception of CS delivery being a safer choice for delivery
[105, 106] and therefore increasing maternal requests [107].
Employment status
Though some studies have been done to decipher the association between employment
status and CS delivery [93-95, 98, 99], the findings were incoherence. Some studies reported
significant effect of women’s employment status on CS delivery [90-92]. Conversely,
insignificant associations between employment status and CS delivery were reported in similar

21
studies [38, 93-95, 98]. Variation in study design and smaller sample sizes may have
influence the disparities in the study findings.
Place of residence
Research into the impact of place of residence on the utilization of CS delivery has been
well-documented in other low- and lower-middle-income countries [90, 93, 97-99] but no study
in Ghana has examined this association. The existing studies in other countries reported
conflicting results. Some researchers identified association between place of residence and CS
delivery [97-99]. The Long et al., (2015) study in Mozambique indicated that urban women were
4.45 times more likely to have CS birth than rural women [97]. Other studies found the
association between CS delivery and place of residence not significant [90, 93]. The varied
results could be as a result of the hospital-based nature of the studies, smaller sample sizes, and
the limitation of the data analysis to only univariate as shown in a study in India [90].
1.5.2.3. Postnatal Care Utilization
The effect of socio-economic and demographic determinants on PNC services use have
been previously been investigated [62, 63, 65]. Some of the findings from the earlier studies are
presented according to the study factors.
Age
Studies on the influence of maternal age on PNC use have been published [108, 109] but
they reported mixed findings. While a study reported a significant influence of maternal age on
PNC usage [109], other studies indicated that there was no significant effect of maternal age on
PNC use [12, 62, 63, 108]. These varied findings can be attributed to the study type, sample size,

22
and geographical differences. For instance, Jacobs et al [63] studied 551 mothers in 4 rural
districts of Zambia whereas the study by Dhaher et al [12] was conducted in three Palestinian
clinics and 264 postpartum mothers were used.
Marital Status
Most previous studies that investigated the effect of marital status on PNC services
utilization [108-110], indicated that no strong association exists. The Jacobs (2017) study in
Zambia reported no strong difference in the utilization of PNC services between married and
unmarried women [63].
Religion
Researchers have attempted to link religion affiliation of women to the use of PNC
services especially in low- and lower-middle-income countries [65, 66, 108, 109]. The Anwar et
al., (2008) study conducted in Bangladesh found no strong association in the use of PNC services
between other religious group and Muslim women (OR=0.87, 95%CI:0.57- 1.33) [66]. Although
this finding is consistent with similar studies in Ghana, those studies utilized smaller sample
sizes with smaller geographical range [69, 108, 109]. On the other hand, a study that was carried
out in Nigeria found that Christians as well as traditional and other believers were more likely to
use PNC services than Muslim women [111]. Due to the mixed findings, population-based
studies that employ large sample sizes are warranted in Ghana in the near future.
Ethnicity
Considering the impact of ethnicity on PNC services usage, investigations have been
conducted [69, 111]. Adu et al., (2018) reported that Ghanaian women who belong to the
23
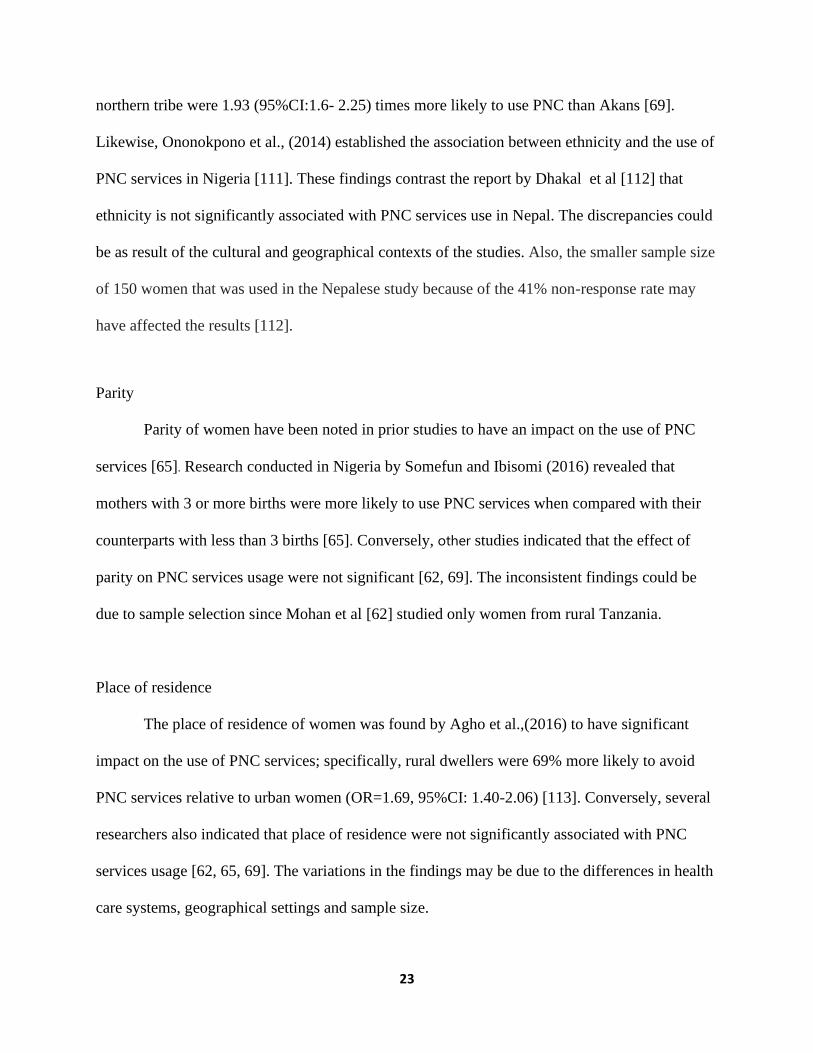
northern tribe were 1.93 (95%CI:1.6- 2.25) times more likely to use PNC than Akans [69].
Likewise, Ononokpono et al., (2014) established the association between ethnicity and the use of
PNC services in Nigeria [111]. These findings contrast the report by Dhakal et al [112] that
ethnicity is not significantly associated with PNC services use in Nepal. The discrepancies could
be as result of the cultural and geographical contexts of the studies. Also, the smaller sample size
of 150 women that was used in the Nepalese study because of the 41% non-response rate may
have affected the results [112].
Parity
Parity of women have been noted in prior studies to have an impact on the use of PNC
services [65]. Research conducted in Nigeria by Somefun and Ibisomi (2016) revealed that
mothers with 3 or more births were more likely to use PNC services when compared with their
counterparts with less than 3 births [65]. Conversely, other studies indicated that the effect of
parity on PNC services usage were not significant [62, 69]. The inconsistent findings could be
due to sample selection since Mohan et al [62] studied only women from rural Tanzania.
Place of residence
The place of residence of women was found by Agho et al.,(2016) to have significant
impact on the use of PNC services; specifically, rural dwellers were 69% more likely to avoid
PNC services relative to urban women (OR=1.69, 95%CI: 1.40-2.06) [113]. Conversely, several
researchers also indicated that place of residence were not significantly associated with PNC
services usage [62, 65, 69]. The variations in the findings may be due to the differences in health
care systems, geographical settings and sample size.
24
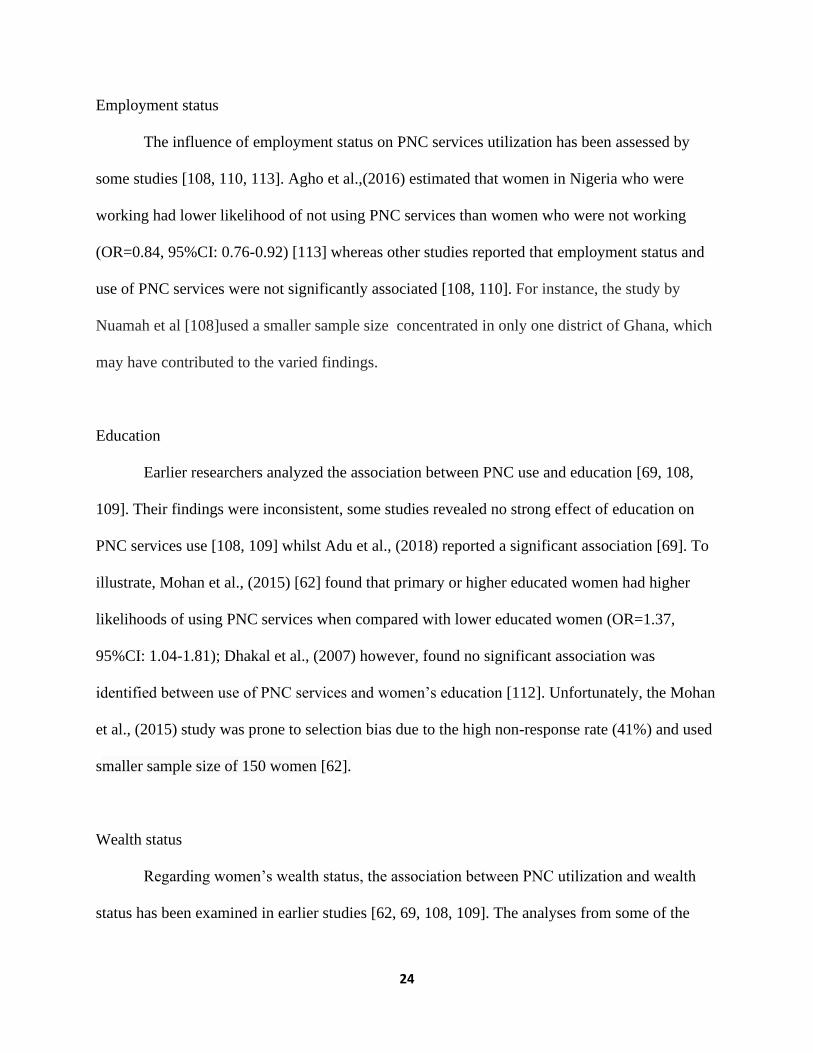
Employment status
The influence of employment status on PNC services utilization has been assessed by
some studies [108, 110, 113]. Agho et al.,(2016) estimated that women in Nigeria who were
working had lower likelihood of not using PNC services than women who were not working
(OR=0.84, 95%CI: 0.76-0.92) [113] whereas other studies reported that employment status and
use of PNC services were not significantly associated [108, 110]. For instance, the study by
Nuamah et al [108]used a smaller sample size concentrated in only one district of Ghana, which
may have contributed to the varied findings.
Education
Earlier researchers analyzed the association between PNC use and education [69, 108,
109]. Their findings were inconsistent, some studies revealed no strong effect of education on
PNC services use [108, 109] whilst Adu et al., (2018) reported a significant association [69]. To
illustrate, Mohan et al., (2015) [62] found that primary or higher educated women had higher
likelihoods of using PNC services when compared with lower educated women (OR=1.37,
95%CI: 1.04-1.81); Dhakal et al., (2007) however, found no significant association was
identified between use of PNC services and women’s education [112]. Unfortunately, the Mohan
et al., (2015) study was prone to selection bias due to the high non-response rate (41%) and used
smaller sample size of 150 women [62].
Wealth status
Regarding women’s wealth status, the association between PNC utilization and wealth
status has been examined in earlier studies [62, 69, 108, 109]. The analyses from some of the

25
studies showed that the wealth status of women and PNC usage were not strongly associated
[69, 109]. Conversely, studies by Mohan et al., (2015) [62, 108] and Nuamah et al., (2019) [62,
108] found that women with the highest wealth status had a greater likelihood of using postnatal
care than their counterparts with the lowest wealth status. The difference in the study findings
could partly be attributed to the variation in geographical coverage and sample size of the
studies.
1.6. Context of the Research
This research was carried out in Ghana, a British colony that gained independence on
March 6, 1957, and subsequently became a republic on July 1, 1960. The Republic of Ghana is
situated on the coast of the Gulf of Guinea at the center of West Africa with three neighboring
countries: Togo, Côte d’Ivoire, Burkina Faso (Figure 1-2). The overall land cover of Ghana is
238,537 square kilometers which can be demarcated into 3 ecological zones, namely: coastal,
middle and savannah [29]. Accra is the administrative capital, which is in Greater Accra, one of
the 10 administrative regions of the country: Western, Central, Volta, Eastern, Ashanti, Brong
Ahafo, Northern, Upper East and Upper West (Figure 1-2). Based on decentralization, the
regions are sub-divided into 216 metropolitan/municipal/ districts [114].
The country has a population of 30.42 million from a projected 2010 census figure [115],
and a population density of 103 persons per square kilometer in 2010 [114]. Ghana is a multi-
ethnic country with Akans constituting nearly half (48%) of the population [114]. Concerning
geographical location, 50% of the populace inhabit three regions (Greater Accra, Ashanti,
Eastern), while the Upper East region has the least number of residents [114]. Also, about 51%
of Ghanaian residents are living in urban areas.

26
Figure 1-2 Map showing Administrative Regions of Ghana [29]
The Ghanaian economy is diversified, with a mix of agriculture, service and industrial
sectors, and recently commercialized oil production [116]. Surprisingly, the agriculture sector,
contributes least to the gross domestic product [117], employs about 45% of the workforce [118].
Typical of lower-middle-income countries, there is inequality in wealth status in Ghana with the
coexistence of people in extreme poverty with those who are very rich. To reduce Ghana’s
poverty levels , in 2007 the government introduced the Livelihood Empowerment Against
Poverty (LEAP) program [29].
Also, the educational system of the country has received enormous investment; notable
ones include the introduction of free education for public basic schools (primary and junior high
school) [119] and more recently the removal of school fees for senior high school education in

27
2017 [120]. For tertiary education, there are public and private universities, colleges of
education, colleges of nursing, and many others. Moreover, the literacy rate among youth (15-24
years) in Ghana is about 85% [114].
According to the 2010 Ghana population and housing census (GSS 2012), no substantial
population differences exist between males and females (95.2 males per 100 females). Like most
countries, the life expectancy rate for males (60 years) is lower than females (63 years), with a
national goal to increase overall life expectancy to 70 years no later than 2020 [121]. Ghana has
a low contraceptive usage rate of 26.7% and a high adolescent birth rate of 76.3 births per 1,000
girls, contributing to a fertility rate of 4. The national goal is to reduce the fertility rate to 3 by
the year 2020; the government intends to achieve this target by increasing contraceptive usage
rates to 50% [121]. Roughly 40% of the Ghanaian population is under 15 years of age.
1.7. Obstetric Care Interventions in Ghana
To ensure quality maternal health care is equitable, accessible and available, the
government of Ghana initiated several interventions spanning from disease control programs,
sanitation projects to reproductive health policies. For instance, the water, sanitation, and
hygiene (WASH) project in Ghana was initiated to increase access to improved sanitation and
drinking water sources [118]. But the two prominent policy interventions implemented are the
Community-Based Health Planning and Services (CHPS) and the maternal care fee exemption
policy. Studies have linked these policy changes to an increase in the uptake of obstetric care
services since their implementation [29, 122].
The CHPS program was implemented country-wide in 1999 after a successful pilot
project in 1994 [123]. The program aims to help deliver universal primary health care through

28
the provision of services at the community-level especially at rural, remote and hard -to-reach
areas [124]. The strategy of the CHPS is to promote task shifting by training community health
officers and the selection of volunteers from the communities to run health posts. These
personnel are tasked with delivering basic essential medical care to the community and refer
complicated conditions for further medical attention. In 2016, the government of Ghana showed
continuous commitment to ensuring universal primary health care coverage by the revision of the
national CHPS policy to facilitate its implementation [125].
The National Health Insurance Scheme (NHIS) and the fee exemption policy for maternal
care were operationalized to ensure financial accessibility [2]. Ghana abolished the out-of-pocket
payment popularly referred to as “cash and carry system” literally meaning pay before you
receive healthcare services [126] with the introduction of NHIS in September 2003. The full-
scale implementation of the policy was carried out in April 2005 [127]. The NHIS is funded
from taxes, social security contributions and international partners [122]. The free maternal
health care policy was initiated in 2008 with the aim of exempting pregnant women from paying
fees when accessing maternity. The free maternal care policy covers antenatal care and
pregnancy-related care, delivery care including caesarean section, postnatal care for both mother
and baby and even support care for babies with special needs such as preterm, low birth weight,
birthed by HIV infected mothers, and many more [128]. In addition to specialized care,
newborns receive umbilical cord care, assessment for growth restriction, screening, and
management of anemia [129]. The postnatal benefit package for mothers includes provisions for
iron and folic acid supplement, screening, and management of medical conditions, counseling on
healthy feeding practice, early detection of danger signs for babies such as feeding problems, as
29
well as reproductive options such as contraception usage, and spacing of births among others
[128].
1.8. Ethical considerations
This thesis used the 2014 Ghana Demographic and Health Survey (GDHS) dataset.
Ethical approval was granted for the 2014 GDHS by both the Ethics Boards of the ICF
International and Ghana Health Service. For this research, permission to use the anonymized
publicly available secondary data was obtained from Measure DHS. Survey participants were
anonymous in the study and so additional ethics approval was not required. Exemption from
ethics review was granted by the Ethics Review Board of the University of Saskatchewan.
References
1. WHO: Maternal mortality in 2005: estimates developed by WHO, UNICEF,
UNFPA, and the World Bank: Geneva: World Health Organization; 2007.
2. UNICEF.: The state of the world's children 2009: maternal and newborn health, vol.
9: Unicef; 2008.
3. Panel AP: Maternal health: Investing in the lifeline of healthy societies and
economies. African Progress Panel Policy Brief, September 2010. In.
4. UNICEF: Ghana: Evaluation of the free maternal health care initiative in Ghana.
In.: UNICEF: New York; 2012.
5. MOH: National Consultative Meeting on The Reduction of Maternal Mortality In
Ghana: Partnership for Action A Synthesis Report. In.: Ministry of Health 2008.
6. Yaya S, Da F, Wang R, Tang S, Ghose B: Maternal healthcare insurance ownership
and service utilisation in Ghana: Analysis of Ghana Demographic and Health
Survey. PloS one 2019, 14(4):e0214841.

30
7. WHO: Trends in maternal mortality: 1990 to 2013: estimates by WHO, UNICEF,
UNFPA, The World Bank and the United Nations Population Division. 2014.
8. Lawn JE, Blencowe H, Oza S, You D, Lee AC, Waiswa P, Lalli M, Bhutta Z, Barros AJ,
Christian P: Every Newborn: progress, priorities, and potential beyond survival. The
Lancet 2014, 384(9938):189-205.
9. WHO: Trends in maternal mortality 2000 to 2017: estimates by WHO, UNICEF. In.:
World Health Organization, UNFPA, World Bank Group and the United Nations
Population Division; 2019.
10. UNIGME: Levels and trends in child mortality: Report 2018. United Nations Inter-
agency Group for Child Mortality Estimation: UNIGME, New York 2018.
11. Ronsmans C, Graham WJ, group LMSSs: Maternal mortality: who, when, where, and
why. The lancet 2006, 368(9542):1189-1200.
12. Dhaher E, Mikolajczyk RT, Maxwell AE, Krämer A: Factors associated with lack of
postnatal care among Palestinian women: a cross-sectional study of three clinics in
the West Bank. BMC pregnancy and childbirth 2008, 8(1):26.
13. Mosiur Rahman M, Haque SE, Sarwar Zahan M: Factors affecting the utilisation of
postpartum care among young mothers in Bangladesh. Health & Social Care in the
Community 2011, 19(2):138-147.
14. WHO: Trends in maternal mortality: 1990-2015: estimates from WHO, UNICEF,
UNFPA, World Bank Group and the United Nations Population Division. 2015.
15. You D, Hug L, Ejdemyr S, Beise J: Levels and trends in child mortality. Estimates
developed by the UN Inter-agency Group for Child Mortality Estimation (IGME).
Report 2015. 2015.
31
16. Organization WH: Trends in maternal mortality 2000 to 2017: estimates by WHO,
UNICEF, UNFPA, World Bank Group and the United Nations Population Division.
2019.
17. Hug L, Dharrow D, Zhong K, You D: Levels and trends in child mortality: Report
2018. In.: The World Bank; 2018.
18. Service GS, Unit GMoHHR, Macro O: Ghana Service Provision Assessment Survey
2002: Ghana Statistical Service; 2003.
19. Zere E TP, Walker O, Kirigia J, Mwikisa C, Mbeeli T: Inequities in utilization of
maternal health interventions in Namibia: implications for progress towards MDG
5 targets. Int J Equity Health 2010(9):16.
20. Adjiwanou V, LeGrand T: Gender inequality and the use of maternal healthcare
services in rural sub-Saharan Africa. Health & place 2014, 29:67-78.
21. Gabrysch S, Campbell OM: Still too far to walk: literature review of the determinants
of delivery service use. BMC pregnancy and childbirth 2009, 9(1):34.
22. Say L, Raine R: A systematic review of inequalities in the use of maternal health care
in developing countries: examining the scale of the problem and the importance of
context. Bulletin of the World Health Organization 2007, 85:812-819.
23. Aseweh Abor P, Abekah-Nkrumah G, Sakyi K, Adjasi CK, Abor J: The socio-economic
determinants of maternal health care utilization in Ghana. International Journal of
Social Economics 2011, 38(7):628-648.
24. Essendi H, Mills S, Fotso J-C: Barriers to formal emergency obstetric care services’
utilization. Journal of Urban Health 2011, 88(2):356-369.

32
25. Gibbons L, Belizán JM, Lauer JA, Betrán AP, Merialdi M, Althabe F: The global
numbers and costs of additionally needed and unnecessary caesarean sections
performed per year: overuse as a barrier to universal coverage. World health report
2010, 30:1-31.
26. WHO: World Health Organization technical consultation on postpartum and
postnatal care. In.: Geneva: World Health Organization; 2010.
27. GSS: Ghana Maternal Health Survey 2017: Key Indicators Report. In. Accra, Ghana:
Ghana Statistical Service (GSS), Ghana Health Service (GHS), and ICF; 2018.
28. UNICEF: Global databases based on MICS, DHS and other nationally
representative household surveys 2019.
29. GSS: Ghana Demographic and Health Survey 2014. In.: Ghana Statistical Service
(GSS), Ghana Health Service (GHS), and ICF International; 2015.
30. Boerma T, Ronsmans C, Melesse DY, Barros AJ, Barros FC, Juan L, Moller A-B, Say L,
Hosseinpoor AR, Yi M: Global epidemiology of use of and disparities in caesarean
sections. The Lancet 2018, 392(10155):1341-1348.
31. Penfold S, Harrison E, Bell J, Fitzmaurice A: Evaluation of the delivery fee exemption
policy in Ghana: population estimates of changes in delivery service utilization in
two regions. Ghana medical journal 2007, 41(3):100.
32. Mensah J, Oppong JR, Schmidt CM: Ghana's National Health Insurance Scheme in
the context of the health MDGs: An empirical evaluation using propensity score
matching. Health economics 2010, 19(S1):95-106.
33
33. Manyeh AK, Akpakli DE, Kukula V, Ekey RA, Narh-Bana S, Adjei A, Gyapong M:
Socio-demographic determinants of skilled birth attendant at delivery in rural
southern Ghana. BMC research notes 2017, 10(1):268.
34. Amoakoh-Coleman M, Ansah EK, Agyepong IA, Grobbee DE, Kayode GA, Klipstein-
Grobusch K: Predictors of skilled attendance at delivery among antenatal clinic
attendants in Ghana: a cross-sectional study of population data. BMJ open 2015,
5(5):e007810.
35. Boah M, Mahama AB, Ayamga EA: They receive antenatal care in health facilities,
yet do not deliver there: predictors of health facility delivery by women in rural
Ghana. BMC pregnancy and childbirth 2018, 18(1):125.
36. Enuameh YAK, Okawa S, Asante KP, Kikuchi K, Mahama E, Ansah E, Tawiah C, Adjei
K, Shibanuma A, Nanishi K: Factors influencing health facility delivery in
predominantly rural communities across the three ecological zones in Ghana: A
cross-sectional study. PloS one 2016, 11(3):e0152235.
37. Danso K, Schwandt H, Turpin C, Seffah J, Samba A, Hindin M: Preference of
Ghanaian women for vaginal or caesarean delivery postpartum. Ghana medical
journal 2009, 43(1):29.
38. Manyeh AK AA, Akpakli DE, Williams J, Gyapong M: Socioeconomic and
demographic factors associated with caesarean section delivery in Southern Ghana:
evidence from INDEPTH Network member site
BMC pregnancy and childbirth 2018, 18(1):405.

34
39. Prah J KA, Afrifa A, Abdulai M, Sirikyi I, Abu E: Caesarean section in a primary
health facility in Ghana: Clinical indications and feto-maternal outcomes. Journal of
public health in Africa 2017, 8(2).
40. Esena RK, Sappor M-M: Factors associated with the utilization of skilled delivery
services in the Ga East Municipality of Ghana Part 2: barriers to skilled delivery.
Int J Sci Tech Res 2013, 2(8):195-207.
41. Gudu W, Addo B: Factors associated with utilization of skilled service delivery
among women in rural Northern Ghana: a cross sectional study. BMC pregnancy
and childbirth 2017, 17(1):159.
42. Dickson KS, Adde KS, Amu H: What Influences Where They Give Birth?
Determinants of Place of Delivery among Women in Rural Ghana. International
journal of reproductive medicine 2016, 2016.
43. Asiedu C: Determinants of the utilisation of skilled delivery services by pregnant
women in the central region of Ghana. University of Cape Coast; 2017.
44. Ganle JK, Parker M, Fitzpatrick R, Otupiri E: Inequities in accessibility to and
utilisation of maternal health services in Ghana after user-fee exemption: a
descriptive study. International journal for equity in health 2014, 13(1):89.
45. Adekanmbi VT, Adedokun ST, Taylor-Phillips S, Uthman OA, Clarke A: Predictors of
differences in health services utilization for children in Nigerian communities.
Preventive medicine 2017, 96:67-72.
46. Gayawan E: Spatial analysis of choice of place of delivery in Nigeria. Sexual &
Reproductive Healthcare 2014, 5(2):59-67.
35
47. Rosenstock IM, Strecher VJ, Becker MH: The health belief model and HIV risk
behavior change. In: Preventing AIDS. edn.: Springer; 1994: 5-24.
48. Young JC: Non-use of physicians: methodological approaches, policy implications,
and the utility of decision models. Social Science & Medicine Part B: Medical
Anthropology 1981, 15(4):499-507.
49. Bongaarts J: A framework for analyzing the proximate determinants of fertility.
Population and development review 1978:105-132.
50. Andersen R, Newman JF: Societal and individual determinants of medical care
utilization in the United States. The Milbank Memorial Fund Quarterly Health and
Society 1973:95-124.
51. Andersen RM: Revisiting the behavioral model and access to medical care: does it
matter? Journal of health and social behavior 1995:1-10.
52. Thorvaldsen G, Islam R: Family planning knowledge and current use of
contraception among the Mru indigenous women in Bangladesh: a multivariate
analysis. 2012.
53. Fagbamigbe AF, Idemudia ES: Wealth and antenatal care utilization in Nigeria:
policy implications. Health care for women international 2017, 38(1):17-37.
54. Appiah-Kubi K: Access and utilisation of safe motherhood services of expecting
mothers in Ghana. Policy & Politics 2004, 32(3):387-407.
55. Darega B, Dida N, Tafese F, Ololo S: Institutional delivery and postnatal care services
utilizations in Abuna Gindeberet District, West Shewa, Oromiya Region, Central
Ethiopia: A Community-based cross sectional study. BMC pregnancy and childbirth
2016, 16(1):149.

36
56. Singh PK, Kumar C, Rai RK, Singh L: Factors associated with maternal healthcare
services utilization in nine high focus states in India: a multilevel analysis based on
14 385 communities in 292 districts. Health policy and planning 2013, 29(5):542-559.
57. Mezmur M, Navaneetham K, Letamo G, Bariagaber H: Individual, household and
contextual factors associated with skilled delivery care in Ethiopia: Evidence from
Ethiopian demographic and health surveys. PLoS One 2017, 12(9):e0184688.
58. Huda TM, Chowdhury M, El Arifeen S, Dibley MJ: Individual and community level
factors associated with health facility delivery: A cross sectional multilevel analysis
in Bangladesh. PloS one 2019, 14(2):e0211113.
59. Achia TN, Mageto LE: Individual and contextual determinants of adequate maternal
health care services in Kenya. Women & health 2015, 55(2):203-226.
60. Moyer CA, Mustafa A: Drivers and deterrents of facility delivery in sub-Saharan
Africa: a systematic review. Reproductive health 2013, 10(1):40.
61. Leone T, Padmadas SS, Matthews Z: Community factors affecting rising caesarean
section rates in developing countries: an analysis of six countries. Social science &
medicine 2008, 67(8):1236-1246.
62. Mohan D, Gupta S, LeFevre A, Bazant E, Killewo J, Baqui AH: Determinants of
postnatal care use at health facilities in rural Tanzania: multilevel analysis of a
household survey. BMC pregnancy and childbirth 2015, 15(1):282.
63. Jacobs C, Moshabela M, Maswenyeho S, Lambo N, Michelo C: Predictors of antenatal
care, skilled birth attendance, and postnatal care utilization among the remote and
poorest rural communities of Zambia: a multilevel analysis. Frontiers in Public
Health 2017, 5:11.

37
64. Lakew Y, Tessema F, Hailu C: Birth preparedness and its association with skilled
birth attendance and postpartum checkups among mothers in Gibe Wereda, Hadiya
Zone, South Ethiopia. Journal of environmental and public health 2016, 2016.
65. Somefun OD, Ibisomi L: Determinants of postnatal care non-utilization among
women in Nigeria. BMC research notes 2016, 9(1):21.
66. Anwar I SM, Akhtar N, Chowdhury ME, Salma U, Rahman M, Koblinsky M.: Inequity
in maternal health-care services: evidence from home-based skilled-birth-attendant
programmes in Bangladesh. Bulletin of the World Health Organization 2008, 86:252-
259.
67. Babalola S, Fatusi A: Determinants of use of maternal health services in Nigeria-
looking beyond individual and household factors. BMC pregnancy and childbirth
2009, 9(1):43.
68. Dahiru T, Oche OM: Determinants of antenatal care, institutional delivery and
postnatal care services utilization in Nigeria. Pan African medical journal 2015, 21(1).
69. Adu J, Tenkorang E, Banchani E, Allison J, Mulay S: The effects of individual and
community-level factors on maternal health outcomes in Ghana. PloS one 2018,
13(11):e0207942.
70. Moyer CA, McLaren ZM, Adanu RM, Lantz PM: Understanding the relationship
between access to care and facility-based delivery through analysis of the 2008
Ghana Demographic Health Survey. International Journal of Gynecology & Obstetrics
2013, 122(3):224-229.

38
71. Smith ME, Tawiah EO, Badasu DM: Why some women deliver in health institutions
and others do not: A cross sectional study of married women in Ghana, 2008.
African journal of reproductive health 2012, 16(3).
72. Speizer IS, Story WT, Singh K: Factors associated with institutional delivery in
Ghana: the role of decision-making autonomy and community norms. BMC
pregnancy and childbirth 2014, 14(1):398.
73. Chubike NE, Constance I: Demographic characteristics of women on the utilization of
Maternal Health Services at Abakaliki Urban. International Journal of Nursing and
Midwifery 2013, 5(8):139-144.
74. Mpembeni RN, Killewo JZ, Leshabari MT, Massawe SN, Jahn A, Mushi D, Mwakipa H:
Use pattern of maternal health services and determinants of skilled care during
delivery in Southern Tanzania: implications for achievement of MDG-5 targets.
BMC pregnancy and childbirth 2007, 7(1):29.
75. Byford-Richardson L, Walker M, Muckle W, Sprague A, Fergus S, White RR, Dick B:
Barriers to access of maternity care in Kenya: a social perspective. Journal of
Obstetrics and Gynaecology Canada 2013, 35(2):125-130.
76. Anyait A, Mukanga D, Oundo GB, Nuwaha F: Predictors for health facility delivery in
Busia district of Uganda: a cross sectional study. BMC pregnancy and childbirth 2012,
12(1):132.
77. Gitonga E, Muiruri F: Determinants of health facility delivery among women in
Tharaka Nithi county, Kenya. The Pan African Medical Journal 2016, 25(Suppl 2).
78. Envuladu E, Agbo H, Lassa S, Kigbu J, Zoakah A: Factors determining the choice of a
place of delivery among pregnant women in Russia village of Jos North, Nigeria:

39
achieving the MDGs 4 and 5. International Journal of Medicine and Biomedical
Research 2013, 2(1):23-27.
79. Kawakatsu Y, Sugishita T, Oruenjo K, Wakhule S, Kibosia K, Were E, Honda S:
Determinants of health facility utilization for childbirth in rural western Kenya:
cross-sectional study. BMC pregnancy and childbirth 2014, 14(1):265.
80. Kowalewski M, Mujinja P, Jahn A: Can mothers afford maternal health care costs?
User costs of maternity services in rural Tanzania. African journal of reproductive
health 2002:65-73.
81. Borghi J, Ensor T, Neupane BD, Tiwari S: Financial implications of skilled attendance
at delivery in Nepal. Tropical Medicine & International Health 2006, 11(2):228-237.
82. Kitui J, Lewis S, Davey G: Factors influencing place of delivery for women in Kenya:
an analysis of the Kenya demographic and health survey, 2008/2009. BMC pregnancy
and childbirth 2013, 13(1):40.
83. Thaddeus S, Maine D: Too far to walk: maternal mortality in context. Social science
& medicine 1994, 38(8):1091-1110.
84. Lerberg PM, Sundby J, Jammeh A, Fretheim A: Barriers to skilled birth attendance: a
survey among mothers in rural Gambia. African journal of reproductive health 2014,
18(1):35-43.
85. Crissman HP, Engmann CE, Adanu RM, Nimako D, Crespo K, Moyer CA: Shifting
norms: pregnant women’s perspectives on skilled birth attendance and facility–
based delivery in rural Ghana. African journal of reproductive health 2013, 17(1):15-
26.

40
86. Kesterton AJ, Cleland J, Sloggett A, Ronsmans C: Institutional delivery in rural India:
the relative importance of accessibility and economic status. BMC pregnancy and
childbirth 2010, 10(1):30.
87. Ononokpono DN, Odimegwu CO: Determinants of maternal health care utilization in
Nigeria: a multilevel approach. The Pan African Medical Journal 2014, 17(Suppl 1).
88. Apanga PA, Awoonor-Williams JK: Predictors of caesarean section in Northern
Ghana: a case-control study. Pan African Medical Journal 2018, 29(1):1-11.
89. Khawaja M, Jurdi R, Kabakian‐Khasholian T: Rising trends in cesarean section rates
in Egypt. Birth 2004, 31(1):12-16.
90. Saoji A, Nayse J, Deoke A, Mitra A: Maternal risk factors of caesarean delivery in a
tertiary care hospital in Central India: A case control study. People’s Journal of
Scientific Research 2016, 9(2):18-23.
91. Fairley L, Dundas R, Leyland AH: The influence of both individual and area based
socioeconomic status on temporal trends in Caesarean sections in Scotland 1980-
2000. BMC Public Health 2011, 11(1):330.
92. Alimohammadian M, Shariat M, Mahmoodi M, Ramezanzadeh F: Choice of delivery in
Tehran and some related factors. Journal of Family and Reproductive Health 2007:79-
84.
93. Ghosh S: Increasing trend in caesarean section delivery in India: Role of
medicalisation of maternal health: Institute for Social and Economic Change
Bangalore; 2010.
94. Yaya S, Uthman OA, Ekholuenetale M, Bishwajit G: Socioeconomic inequalities in the
risk factors of noncommunicable diseases among women of reproductive age in sub-

41
Saharan Africa: A multi-country analysis of survey data. Frontiers in public health
2018, 6.
95. Rajabi A, Maharlouei N, Rezaianzadeh A, Rajaeefard A, Gholami A: Risk factors for C-
section delivery and population attributable risk for C-section risk factors in
Southwest of Iran: a prospective cohort study. Medical journal of the Islamic Republic
of Iran 2015, 29:294.
96. Braveman P, Egerter S, Edmonston F, Verdon M: Racial/ethnic differences in the
likelihood of cesarean delivery, California. American Journal of Public Health 1995,
85(5):625-630.
97. Long Q KT, Madede T, Klemetti R, Hemminki E: Caesarean section rates in
Mozambique. BMC pregnancy and childbirth 2015, 15(1):253.
98. Yassin K, Saida G: Levels and determinants of caesarean deliveries in Egypt:
Pathways to rationalization. The Internet Journal of World Health and Societal Politics
2012, 7(2):1-7.
99. Rebelo F DRC, Cortes TR, Dutra CL, Kac G High cesarean prevalence in a national
population- based study in Brazil: the role of private practice Acta obstetricia et
gynecologica Scandinavica 2010, 89(7):903-908.
100. Begum T, Rahman A, Nababan H, Hoque DME, Khan AF, Ali T, Anwar I: Indications
and determinants of caesarean section delivery: Evidence from a population-based
study in Matlab, Bangladesh. PloS one 2017, 12(11):e0188074.
101. Hou X. RNS, Iunes R: Factors associated with high Cesarean deliveries in China and
Brazil-A Call for reducing elective surgeries in moving towards Universal Health
Coverage. Journal of Hospital Administration 2014, 3:67.

42
102. Kamal SM: Preference for institutional delivery and caesarean sections in
Bangladesh. Journal of health, population, and nutrition 2013, 31(1):96.
103. Ravit M PA, Tourigny C, Traore M, Coulibaly A, Dumont A, Fournier P: The Hidden
costs of a free caesarean section policy in West Africa (Kayes Region, Mali) Maternal
and child health journal 2015, 19(8):1734-1743.
104. Lange IL KL, Goufodji S, Ronsmans C, Filippi V: The costs of ‘free’: Experiences of
facility-based childbirth after Benin's caesarean section exemption policy. Social
science & medicine 2016, 168:53-62.
105. Jisun TF, Kabir MR: A Comparative Study on the Preference for Delivery Process in
Bangladesh. ABC Journal Of Advanced Research 2014, 3(1):24-28.
106. Mukherjee S: Rising cesarean section rate. J Obstet Gynecol India 2006, 56(4):298-
300.
107. Robson S, Carey A, Mishra R, Dear K: Elective caesarean delivery at maternal
request: A preliminary study of motivations influencing women's decision‐making.
Australian and New Zealand Journal of Obstetrics and Gynaecology 2008, 48(4):415-
420.
108. Nuamah GB, Agyei-Baffour P, Mensah KA, Boateng D, Quansah DY, Dobin D, Addai-
Donkor K: Access and utilization of maternal healthcare in a rural district in the
forest belt of Ghana. BMC pregnancy and childbirth 2019, 19(1):6.
109. Sakeah E, Aborigo R, Sakeah JK, Dalaba M, Kanyomse E, Azongo D, Anaseba D,
Oladokun S, Oduro AR: The role of community-based health services in influencing
postnatal care visits in the Builsa and the West Mamprusi districts in rural Ghana.
BMC pregnancy and childbirth 2018, 18(1):295.

43
110. Workineh YG, Hailu DA: Factors affecting utilization of postnatal care service in
Jabitena district, Amhara region, Ethiopia. Sci J Public Health 2014, 23:169-176.
111. Ononokpono DN, Odimegwu CO, Imasiku EN, Adedini SA: Does it really matter
where women live? A multilevel analysis of the determinants of postnatal care in
Nigeria. Maternal and child health journal 2014, 18(4):950-959.
112. Dhakal S, Chapman GN, Simkhada PP, Van Teijlingen ER, Stephens J, Raja AE:
Utilisation of postnatal care among rural women in Nepal. BMC pregnancy and
childbirth 2007, 7(1):19.
113. Agho KE, Ezeh OK, Issaka AI, Enoma AI, Baines S, Renzaho A: Population
attributable risk estimates for factors associated with non-use of postnatal care
services among women in Nigeria. BMJ open 2016, 6(7):e010493.
114. GSS: 2010 Population & Housing Census: National Analytical Report. In.: Ghana
Statistical Service (GSS); 2013.
115. UNICEF: World population prospects: The 2015 revision, key findings and advance
tables. United Nations (UN) 2015, Rep No. ESA/P/WP. 241.
116. Schieber G, Cashin C, Saleh K, Lavado R: Health financing in Ghana: The World
Bank; 2012.
117. GSS: Revised 2014 Annual Gross Domestic Product. In. Accra, Ghana Ghana
Statistical Service (GSS) 2015.
118. GSS: Ghana Living Standards Survey Round 6. In. Accra, Ghana: Ghana Statistical
Service (GSS); 2014.
119. Akyeampong K: Revisiting free compulsory universal basic education (FCUBE) in
Ghana. Comparative Education 2009, 45(2):175-195.

44
120. Abdul-Rahaman N, Rahaman ABA, Ming W, Ahmed A-R, Salma A-RS: The Free
Senior High Policy: An Appropriate Replacement to The Progressive Free Senior
High Policy. International Journal of Education and Literacy Studies 2018, 6(2):26-33.
121. NPC: National Population Policy. In. Ghana: National Population Council (NPC);
1994.
122. UNICEF: Evaluation of the free maternal health care initiative in Ghana. 2012.
123. Nyonator FK, Awoonor-Williams JK, Phillips JF, Jones TC, Miller RA: The Ghana
community-based health planning and services initiative for scaling up service
delivery innovation. Health policy and planning 2005, 20(1):25-34.
124. Phillips JF, Awoonor-Williams JK, Bawah AA, Nimako BA, Kanlisi NS, Sheff MC,
Asuming PO, Kyei PE, Biney A, Jackson EF: What do you do with success? The
science of scaling up a health systems strengthening intervention in Ghana. BMC
health services research 2018, 18(1):1-10.
125. Kweku M, Amu H, Awolu A, Adjuik M, Ayanore MA, Manu E, Tarkang EE, Komesuor
J, Asalu GA, Aku FY: Community-Based Health Planning and Services Plus
programme in Ghana: A qualitative study with stakeholders in two Systems
Learning Districts on improving the implementation of primary health care. Plos
one 2020, 15(1):e0226808.
126. Ghana Go: National health insurance act, 2003 (Act 650). In. Accra: Ghana Publishing
Corporation; 2003.
127. (NHIA) NHIA: National Health Insurance Authority 2012 annual report. In. Accra:
National Health Insurance Authority; 2012.

45
128. Bosu W, Bell J, Armar-Klemesu M, Tornui J: Effect of delivery care user fee
exemption policy on institutional maternal deaths in the Central and Volta Regions
of Ghana. Ghana medical journal 2007, 41(3).
129. Crawley J: Reducing the burden of anemia in infants and young children in malaria-
endemic countries of Africa: from evidence to action. The American journal of
tropical medicine and hygiene 2004, 71(2_suppl):25-34.

46
Chapter 2 explores the socioeconomic and demographic factors contributing to the inequalities
in the usage of health facility delivery. Chapter 2 addresses the research gaps identified in
chapter 1 by employing conditional regression model to adjust for the impacts of confounding
and interactions, an attempt to address some methodological limitations of earlier studies in
Ghana.
Chapter 2 has been published in BMC Reproductive Health “Dankwah, E., Zeng, W., Feng, C.,
Kirychuk, S., & Farag, M. (2019). The social determinants of health facility delivery in Ghana.
Reproductive health, 16(1), 101. doi: 10.1186/s12978-019-0753-2” (Journal Impact Factor:
2.29). In chapter 2, I conceptualized, reviewed the literature, cleaned and analyzed the data,
interpreted the findings and wrote the chapter.

47
Chapter 2. The Social Determinants of Health Facility Delivery Among Reproductive Aged
Women in Ghana
2.1. INTRODUCTION
Every year, there are over 200 million conceptions [1]. However, about forty-percent of
these conceptions result in pregnancy-related problems among women around the world [1].
Childbirths in health facilities have been recognized as one of the best strategies to avoid
maternal mortalities and morbidities and to improve the health of newborns [2-4]. Despite this
recognition, a significant percentage of childbirths occur outside health facilities in low-income
countries [3, 5]. One of the tragic consequences of this underutilization is the 830 maternal
deaths that occur each day because of pregnancy and labour-related complications [6]. If this
consequence is not tragic enough, delivery outside a health facility also has ramifications for
infants. Delivery outside of health facilities contributed to annual neonatal mortalities of 3
million [7] and 2.65 million stillbirths globally in 2008 [8]. Further, home delivery is linked with
increased risk of third stage delivery issues including retained placenta, postpartum haemorrhage
[9].
Ghana has a population of about 28 million and a population density of 124. Females
account for about fifty-one percent of the population with an estimated total fertility rate of 4 [6].
According to the Ghana Demographic and Health Survey report [10], inhabitants reside almost
equally in urban and rural areas. In Ghana, health facilities administer health care through
maternity homes, Community-based Health Planning and Services (CHPS) health post, public,
private and mission hospitals. The distribution of health care facilities is skewed in favour of
urban areas.
48
Maternal deaths continue to be unjustifiably high, though the number of deaths has
almost been halved from 634 per 100,000 live births in 1990 to 319 per 100,000 live births in
2015 [6]. This reduction is thought to be the result of the introduction of free maternal care
policy, antenatal care (ANC) services and increased institutional deliveries [11-13]. However,
even though most pregnant Ghanaian women seem to use ANC services, a large percentage of
deliveries still take place outside a health facility. This trend is supported by data collected in the
2008 Ghana Demographic and Health Survey (GDHS): 95 percent of pregnant women reported
utilizing ANC services from skilled personnel, including medical doctors, midwives, and nurses.
Nonetheless, only 59% delivered at a health facility in the presence of a health professional in
2008 [14]. The Government of Ghana has introduced initiatives such as free maternal health care
services, Community-based Health Planning and Services (CHPS), and improved antenatal care
and education in an effort to improve access to health facility delivery; these initiatives have
been successful in increasing the use of health facility delivery but it remains inequitably
distributed [15, 16]. According to a 2011 survey, 37 percent of childbirths occurred at health
facility in Northern Ghana, and 52.7 percent of deliveries occurred at health facility in rural
Ghana [17]. Both of these percentages were well below the national health facility delivery rate
of 67.4 percent in 2011 [17]. Thus, more efforts are needed to ensure equitable access to this
potentially life-saving service.
Understanding the determinants of health facility delivery is important for targeting
policies and interventions. A body of literature has found that socioeconomic and demographic
dynamics affect women’s choice of birthplace [18-27], however, inconsistency about how these
factors influence women’s decisions remains a major concern. In Ghana, some studies have
investigated the effect of sociodemographic characteristics on health facility delivery [18, 23, 28,

49
29]. Notwithstanding, these studies were not exhaustive, and highlight the need for further
research. For example, none of the studies considered the effect of ‘need’ on the use of health
facilities as a place for delivery. Also, previous studies did not use nationwide data making it
inaccurate to generalize findings to the entire population. The present study aims to examine
socio-demographic determinants influencing the use of health facility delivery among Ghanaian
women of reproductive age.
2.2. METHODS
2.2.1. Study Data
The 2014 Ghana Demographic and Health Survey (GDHS) dataset was used in this study
after permission from the MEASURE DHS. The 2014 GDHS was carried out by the Ghana
Statistical Service (GSS) in collaboration with Inner City Fund (ICF) International and Ghana
Health Service (GHS). The survey used two-stage systematic sampling to select participants
from households nested in clusters (enumeration areas) across all the 10 regions of Ghana. The
survey interviewed 9,396 women aged 15-49 years with a response rate of 97% [10]. Women’s
information including socio-demographic characteristics and reproductive health records were
collected. Detailed information on the sampling techniques and the questionnaires have been
reported elsewhere [10].
2.2.2. A conceptual framework for health facility delivery
This research adopted and modified the Andersen’s healthcare utilization model to study
obstetric services use (place of delivery). Andersen’s model considers three types of factors as

50
drivers of health services use: predisposing, enabling and need factors [30-32]. First,
predisposing factors refer to characteristics that exert influence prior to the occurrence of the
given health behavior, by encouraging or inhibiting the uptake of health facility delivery in this
case. Predisposing characteristics include all characteristics that might condition an individual’s
perceptions of need and use of health facility delivery. These predisposing factors can take the
form of demographic factors (age, ethnicity), reproductive history (parity), cultural beliefs
(religion), civil status (marital status), and social structure/factors (education) among other
factors [31, 32]. Second, enabling factors are related to the resources that facilitate or impede the
utilization of health services which include financial status, employment status, resources in the
community and other factors[31, 32]. Third, Andersen’s model proposes that “Need” for care is
important for influencing behavior [31]. Andersen’s model was used as a framework to guide
selection of potential factors associated with health facility delivery. The explanatory predictors
considered in the study were grouped into predisposing factors (age, marital status, religion,
ethnicity, parity, maternal education), enabling factors (financial status, employment status and
place of residence) and perceived need as shown in Figure 2-1. Ethnic groups are representative
of the regions in Ghana. To prevent multicollinearity issues in the analysis of the data, ethnicity
was studied in lieu of region of residence. Since this dataset does not include a variable
representing actual medical need for health facility delivery, the variable ‘told about pregnancy
complications’ was used as a proxy for perceived need for health facility delivery; the choice of
this variable as a proxy for need is based on another study that used a similar variable [33].

51
Figure 2-1: Theoretical framework adapted from Andersen’s health utilization model for health
facility delivery
2.2.3. Study variables
The study sample included 4,293 women of reproductive age (15 to 49 years) who
responded to the question asking about place of delivery. Birth outside a health facility
hereinafter was referred to as home delivery. The outcome variables were coded as follows:
health facility delivery = ‘1’ and, home delivery = ‘0’. Ten explanatory variables were used: (1)
maternal age, (2) marital status, (3) religion, (4) ethnicity(5) parity, (6) place of residence, (7)
Age
Marital status
Religion
Ethnicity
Parity
Maternal
education
Financial
status
Place of
residence
Employment
status
Told about
pregnancy
complication
Predisposing
factors
Enabling
factors
Need Use of a
health
facility for
delivery
Population characteristics

52
education, (8) financial status, (9) employment status and (10) having been told about pregnancy
complications.
Maternal age violated the linearity assumption when a quadratic term was imposed (p-
value = 0.001) and hence was categorized. As shown in Table 2-1, explanatory variables were
categorized based on an extensive review of empirical literature [18, 23, 25, 26], and were
grouped as follows: (1) Maternal age was classified as 15-24 years, 25-34 years, and 35-49
years; (2) marital status (married, unmarried); (3) religion (Christian, Islam, Traditional and
Others); ethnicity (Akan, Northern tribes, Ewe, Ga and other); (5) parity (1 birth, 2 births, 3
births or more); (6) place of residence (urban, rural); (7) Education was classified into no
education, primary (grade 1-6), at least secondary (above grade 6); (8) The Financial status
variable was created from the Wealth index variable that was available in GDHS dataset. The
GDHS generated the Wealth index based on information on household assets using principal
component analysis (PCA). The Wealth index variable was comprised of 5 categories namely
poorest, poorer, middle, richer and richest. The Financial status variable used in this study is
comprised of 3 categories: poor (poorer, poorest), middle, and rich (richer, richest) as reported in
similar studies[25, 34]; (9) employment status (not working and working); and (10) told about
pregnancy complications (yes, no).
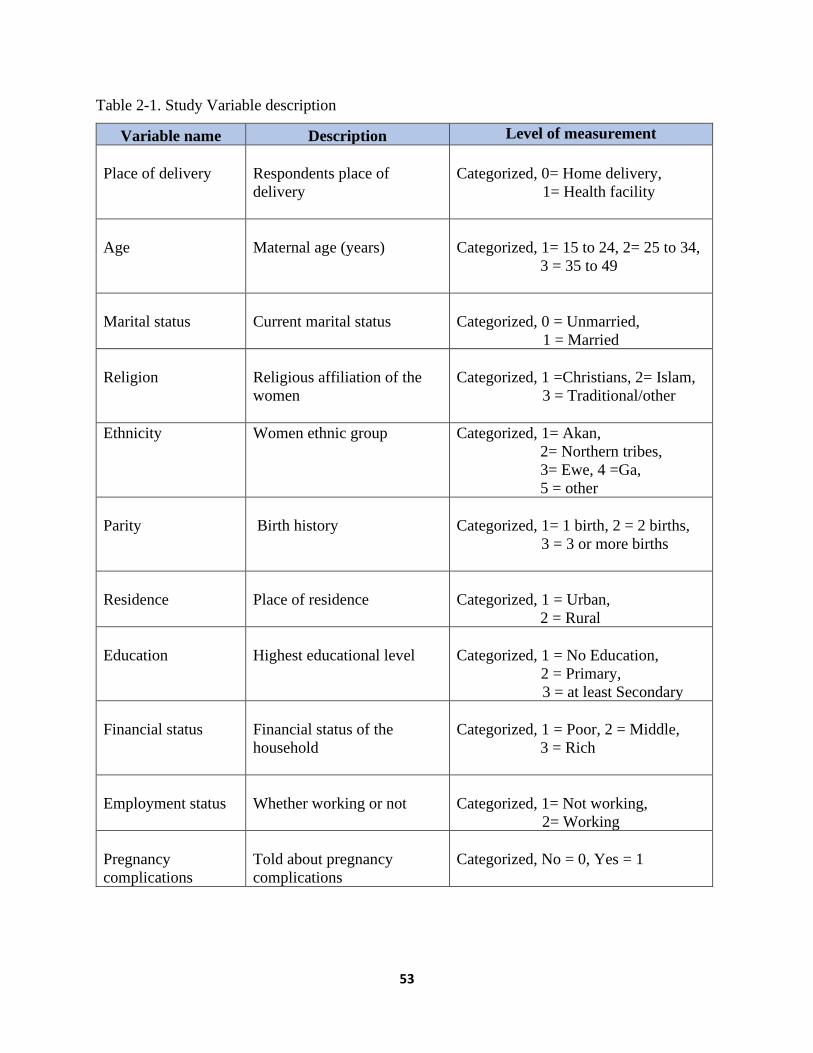
53
Table 2-1. Study Variable description
Variable name Description Level of measurement
Place of delivery
Respondents place of
delivery
Categorized, 0= Home delivery,
1= Health facility
Age
Maternal age (years)
Categorized, 1= 15 to 24, 2= 25 to 34,
3 = 35 to 49
Marital status
Current marital status
Categorized, 0 = Unmarried,
1 = Married
Religion
Religious affiliation of the
women
Categorized, 1 =Christians, 2= Islam,
3 = Traditional/other
Ethnicity
Women ethnic group
Categorized, 1= Akan,
2= Northern tribes,
3= Ewe, 4 =Ga,
5 = other
Parity
Birth history
Categorized, 1= 1 birth, 2 = 2 births,
3 = 3 or more births
Residence
Place of residence
Categorized, 1 = Urban,
2 = Rural
Education
Highest educational level
Categorized, 1 = No Education,
2 = Primary,
3 = at least Secondary
Financial status
Financial status of the
household
Categorized, 1 = Poor, 2 = Middle,
3 = Rich
Employment status
Whether working or not
Categorized, 1= Not working,
2= Working
Pregnancy
complications
Told about pregnancy
complications
Categorized, No = 0, Yes = 1
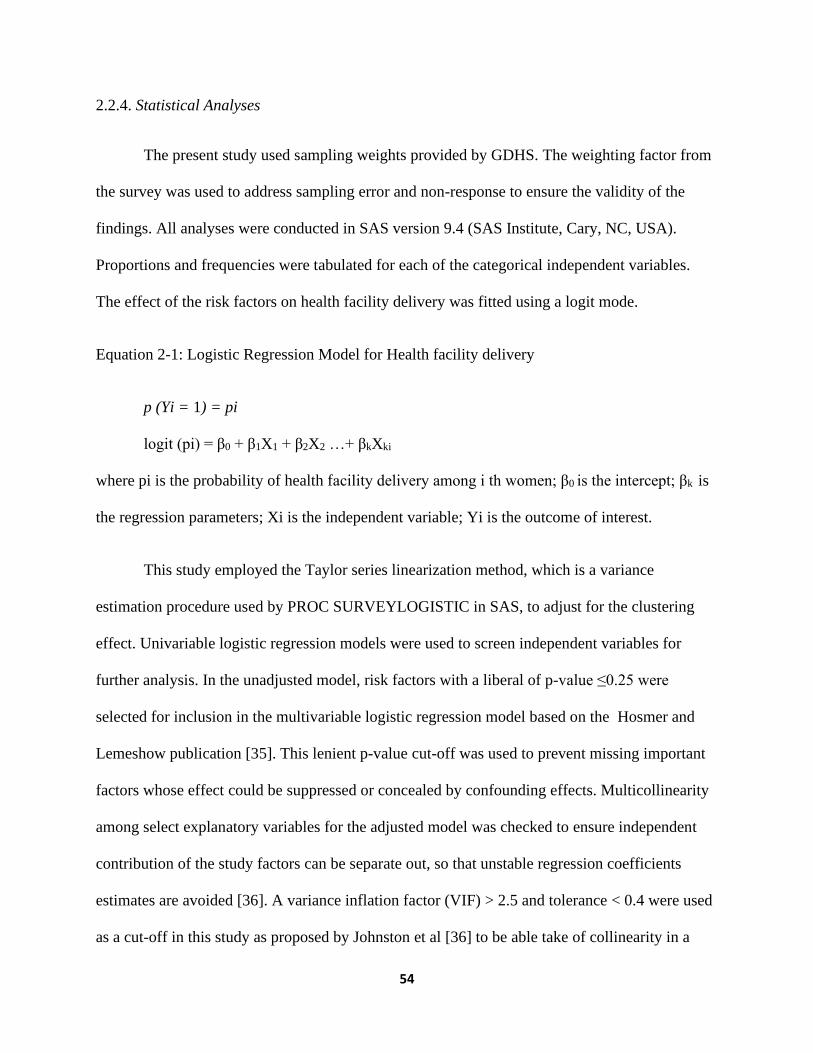
54
2.2.4. Statistical Analyses
The present study used sampling weights provided by GDHS. The weighting factor from
the survey was used to address sampling error and non-response to ensure the validity of the
findings. All analyses were conducted in SAS version 9.4 (SAS Institute, Cary, NC, USA).
Proportions and frequencies were tabulated for each of the categorical independent variables.
The effect of the risk factors on health facility delivery was fitted using a logit mode.
Equation 2-1: Logistic Regression Model for Health facility delivery
p (Yi = 1) = pi
logit (pi) = β0 + β1X1 + β2X2 …+ βkXki
where pi is the probability of health facility delivery among i th women; β0 is the intercept; βk is
the regression parameters; Xi is the independent variable; Yi is the outcome of interest.
This study employed the Taylor series linearization method, which is a variance
estimation procedure used by PROC SURVEYLOGISTIC in SAS, to adjust for the clustering
effect. Univariable logistic regression models were used to screen independent variables for
further analysis. In the unadjusted model, risk factors with a liberal of p-value ≤0.25 were
selected for inclusion in the multivariable logistic regression model based on the Hosmer and
Lemeshow publication [35]. This lenient p-value cut-off was used to prevent missing important
factors whose effect could be suppressed or concealed by confounding effects. Multicollinearity
among select explanatory variables for the adjusted model was checked to ensure independent
contribution of the study factors can be separate out, so that unstable regression coefficients
estimates are avoided [36]. A variance inflation factor (VIF) > 2.5 and tolerance < 0.4 were used
as a cut-off in this study as proposed by Johnston et al [36] to be able take of collinearity in a

55
model with difficulty of drawing causal inference such as logistic regression from cross-sectional
studies. A multivariate logistic regression model was fitted to examine the link between health
facility delivery and explanatory factors. The manual backward elimination technique was
employed for model building in this research [37]. First, all factors that were selected for the
adjusted model were included. Factors with the highest p-values and widest 95% confidence
intervals were selected for elimination from the model one at a time until all the predictors in the
model were significant at p-value ≤0.05. The odds ratios and corresponding 95% confidence
intervals were computed for all the significant variables in the adjusted model. Confounding was
assessed and greater than 20% change in the parameter estimate (beta coefficient) was the upper
limit [37]. Two-way interactions among significant factors in the adjusted model were tested
[37]. Also, the model with the smallest Akaike’s Information Criterion (AIC) was selected as a
parsimonious model. Further, the area under the Receiver Operating Characteristic (ROC) was
used for model diagnostics to assess the discriminatory power of the model on the study
outcome. Finally, regression model specification link test was done to detect model specification
errors and Hosmer-Lemeshow goodness of fit test was conducted [35, 38, 39].
2.3. RESULTS
Descriptive Results
In this research, 4,293 women within the ages of 15 and 49 years birthed within five
years prior to the 2014 GDHS and responded to the place of delivery question (Table 2-2). The
study population average age was 29.7 years (SD=9.71). About 72% of women reported health
facility delivery, while 28% used home delivery.
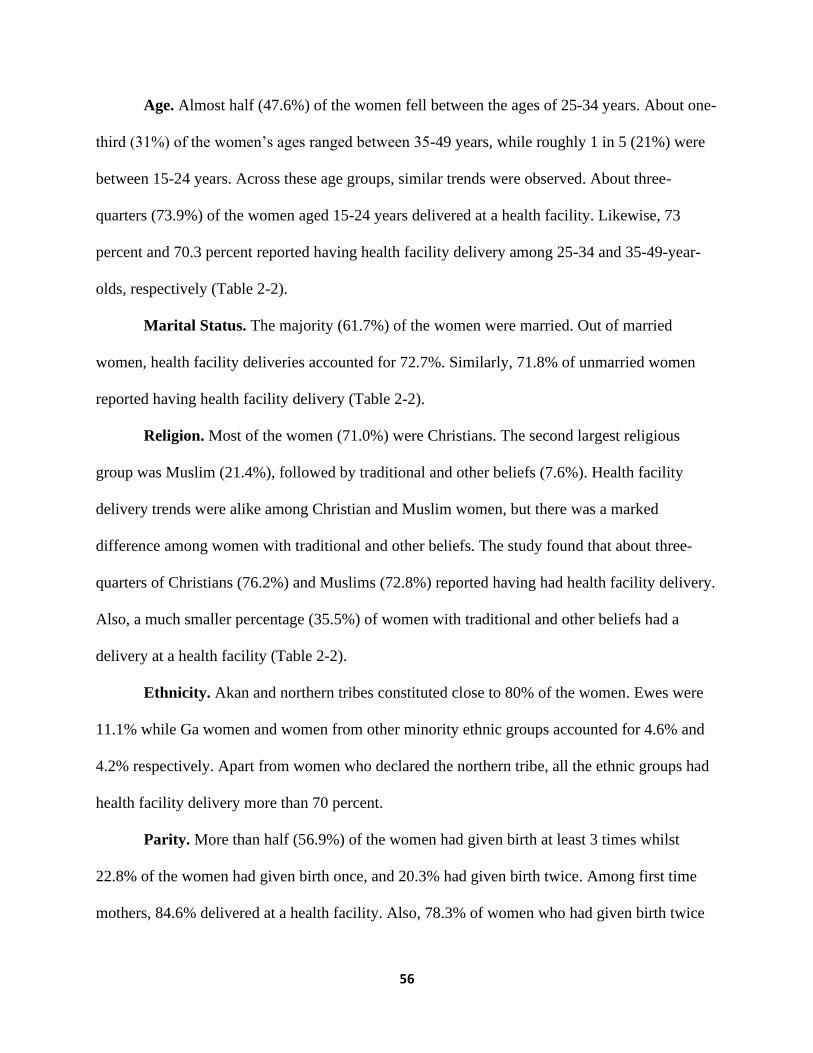
56
Age. Almost half (47.6%) of the women fell between the ages of 25-34 years. About one-
third (31%) of the women’s ages ranged between 35-49 years, while roughly 1 in 5 (21%) were
between 15-24 years. Across these age groups, similar trends were observed. About three-
quarters (73.9%) of the women aged 15-24 years delivered at a health facility. Likewise, 73
percent and 70.3 percent reported having health facility delivery among 25-34 and 35-49-year-
olds, respectively (Table 2-2).
Marital Status. The majority (61.7%) of the women were married. Out of married
women, health facility deliveries accounted for 72.7%. Similarly, 71.8% of unmarried women
reported having health facility delivery (Table 2-2).
Religion. Most of the women (71.0%) were Christians. The second largest religious
group was Muslim (21.4%), followed by traditional and other beliefs (7.6%). Health facility
delivery trends were alike among Christian and Muslim women, but there was a marked
difference among women with traditional and other beliefs. The study found that about three-
quarters of Christians (76.2%) and Muslims (72.8%) reported having had health facility delivery.
Also, a much smaller percentage (35.5%) of women with traditional and other beliefs had a
delivery at a health facility (Table 2-2).
Ethnicity. Akan and northern tribes constituted close to 80% of the women. Ewes were
11.1% while Ga women and women from other minority ethnic groups accounted for 4.6% and
4.2% respectively. Apart from women who declared the northern tribe, all the ethnic groups had
health facility delivery more than 70 percent.
Parity. More than half (56.9%) of the women had given birth at least 3 times whilst
22.8% of the women had given birth once, and 20.3% had given birth twice. Among first time
mothers, 84.6% delivered at a health facility. Also, 78.3% of women who had given birth twice

57
used health facility for deliveries. Lastly, among mothers with three or more children, 65.9% of
deliveries took place at a health facility (Table 2-2).
Residence. More than half (53.8%) of the women lived in rural areas. Among these rural
dwellers, about two-thirds (60%) used health facility for delivery whereas approximately 9 in 10
(89.8%) urban dwellers delivered at a health facility (Table 2-2).
Education. Over a half (54.3%) of the women had attained at least secondary education.
About a quarter (26.1%) of the women had no formal education, and nearly one-fifth (19.6%)
had attained primary education. Regarding health facility delivery, more than half (54%) of the
women with no education reported having had a delivery at a health facility. For women with
primary and at least secondary education, health facility delivery was 69.3% and 86.7%
respectively (Table 2-2).
Financial Status. The “poor” category included about 41.3% of the population while the
“middle” income group included about 20%, and more than one-third (38.7%) of the women
were in the “rich” group. Concerning the use of health facility delivery, roughly three-fifths
(57.4%) of the poor women reported having had health facility delivery. Among middle-class
and rich women, 78% and 95.6% births respectively occurred at a health facility (Table 2-2).
Employment status. Approximately 4 out of 5 (79.4%) women were working. For health
facility delivery, 75% of women who did not work and 71% of those that were working birthed
at a health facility (Table 2-2).
Perceived need. Women who were informed about pregnancy complications had health
facility delivery higher than their counterparts who were not aware of pregnancy complications
(75.3% vs. 68.5%).
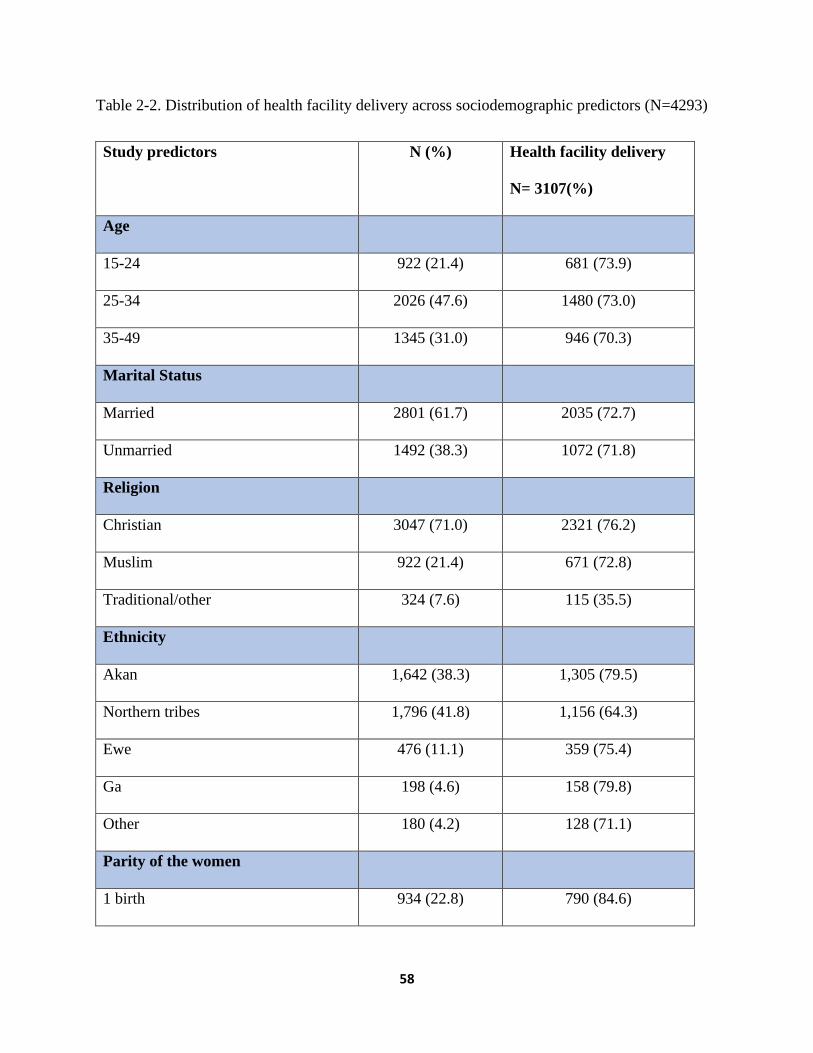
58
Table 2-2. Distribution of health facility delivery across sociodemographic predictors (N=4293)
Study predictors N (%) Health facility delivery
N= 3107(%)
Age
15-24 922 (21.4) 681 (73.9)
25-34 2026 (47.6) 1480 (73.0)
35-49 1345 (31.0) 946 (70.3)
Marital Status
Married 2801 (61.7) 2035 (72.7)
Unmarried 1492 (38.3) 1072 (71.8)
Religion
Christian 3047 (71.0) 2321 (76.2)
Muslim 922 (21.4) 671 (72.8)
Traditional/other 324 (7.6) 115 (35.5)
Ethnicity
Akan 1,642 (38.3) 1,305 (79.5)
Northern tribes 1,796 (41.8) 1,156 (64.3)
Ewe 476 (11.1) 359 (75.4)
Ga 198 (4.6) 158 (79.8)
Other 180 (4.2) 128 (71.1)
Parity of the women
1 birth 934 (22.8) 790 (84.6)

59
2 births 839 (20.3) 657 (78.3)
3 or more births 2520 (56.9) 1660 (65.9)
Place of Residence
Urban 1777 (46.2) 1595 (89.8)
Rural 2516 (53.8) 1512 (60.0)
Education
No Education 1419 (26.1) 766 (54.0)
Primary 869 (19.6) 602 (69.3)
Secondary and above 2005 (54.3) 1739 (86.7)
Financial status
Poor 2241 (41.3) 1287 (57.4)
Middle 812 (20.0) 634 (78.0)
Rich 1240 (38.7) 1186 (95.6)
Employment status^
Not working 885 (20.6) 668 (75.5)
Working 3,405 (79.4) 2,436 (71.5)
Perceived need (Told about
pregnancy complications) ᶲ
Yes 3,423 (82.5) 2,579 (75.3)
No 724 (17.5) 496 (68.5)
N, number of observations; %, percent; SD, standard deviation; ᶲ N=4,147, ^N= 4290, due to missing
observations; 2014 GDHS data

60
Univariable Analysis Results
The associations between select social determinants and health facility delivery were
tested (Table 2-3). Unadjusted analyses revealed the following associations:
Age. The study found a weak association between the age of a woman and health facility
delivery. The univariable analysis produced point estimates a little over one for women aged 25-
34 years (Unadjusted OR (UOR)=1.09; 95%CI= 0.91-1.30) and those aged 35-49 years
(UOR=1.03; 95%CI= 0.81-1.31) relative to women aged 15-24 years. Additionally, the overall
p-value (0.6) was greater than 0.25 and hence was not selected for the multivariable logistic
regression model (Table 2-3).
Marital Status. The relationship between marital status and health facility delivery in
this study was not significant (UOR= 1.05; 95%CI=0.85-1.28). Further, p-value (0.7) higher than
0.25 was identified. In view of that, marital status was not considered for further analysis in the
adjusted model (Table 2-3).
Religion. Muslims and Christians were 4.20 (95%CI = 2.43–7.26) times and 5.85
(95%CI = 3.79–9.0) times respectively, more likely to deliver at health facility as compared to
traditional and other believers (Table 2-3).
Ethnicity. Except for women from other minority ethnic groups that had no significant
difference in health facility delivery when compared to women of northern descents (UOR=1.67;
95%CI: 0.98-2.83). Akans (UOR=2.61; 95%CI:1.85-3.71), Ewes (UOR=2.14; 95%CI:1.29-3.51)
and Ga women (UOR=2.80; 95%CI:1.59-4.94) had a greater likelihood of birthing at a health
facility than northern women (Table 2-3).
Parity. The higher the number of times a woman give birth, the less likely to resort to
health facility delivery in subsequent births. The results revealed that women who had given

61
birth twice were 1.73 (95%CI = 1.35-2.21) times more likely to deliver at health facility than
mothers with three or more births. First-time mothers were 2.77 (95%CI = 2.19-3.50) times more
likely to have health facility delivery than women who had given birth three or more times
(Table 2-3).
Residence. Women living in urban areas were 6.71 (95%CI = 4.76-9.44) times more
likely to deliver at health facility than rural residents (Table 2-3).
Education. Compared to women with no education, secondary or higher educated
women 5.92 (95%CI = 4.43-7.90) times more likely to deliver at health facility. Women with
primary education were 1.89 (95%CI = 1.40-2.55) times more likely to report having health
facility delivery than women with no education (Table 2-3).
Financial Status. The odds of having health facility delivery among rich women were
about 18.55 (95%CI=12.54-27.44) times when compared to the poor. Moreover, middle class
women were 2.69 (95%CI = 2.03-3.59) times more likely to deliver at health facility than poor
women (Table 2-3).
Employment status. As demonstrated in Table 2-3, no significant difference was
detected between women who were working and those who were not working (UOR= 0.88;
95%CI=0.69-1.13).
Perceived need. From Table 2-3, women who were aware of pregnancy complications
had a higher likelihood of using health facility for delivery relative to women who were not
informed about pregnancy complications (UOR =1.65; 95%CI=1.29-2.11).

62
Table 2-3. Unadjusted Odds ratio and 95% Confidence interval of having health facility delivery
by sociodemographic risk factors in the bivariate logistic regression analyses
Predictors UOR (95% Confidence Interval) P-value
Age (Ref: 15-24)
25-34 1.09 (0.91, 1.30)
0.6 35-49 1.03 (0.81, 1.31)
Marital status (Ref: Unmarried)
Married 1.05 (0.85, 1.28) 0.7
Religion (Ref: Traditional/other)
Muslim 4.20 (2.43, 7.26)
<0.0001 Christian 5.85 (3.79, 9.0)
Ethnicity (Ref: Northern tribes)
Akan 2.61 (1.85,3.71)
<0.0001 Ewe 2.14 (1.29, 3.51)
Ga 2.80 (1.59, 4.94)
Other 1.67(0.98, 2.83)
Parity of the women (Ref: 3 or more births)
1 birth 2.77 (2.19, 3.50)
<0.0001 2 births 1.73 (1.35, 2.21)
Residence (Ref: Rural)
Urban 6.71 (4.76, 9.44) <0.0001
Highest Education Level (Ref: No education)
Primary 1.89 (1.40, 2.55)
<0.0001 Secondary and above 5.92 (4.43, 7.90)
Financial status (Ref: Poor)

63
Middle 2.69 (2.03, 3.59)
<0.0001 Rich 18.55 (12.54, 27.44)
Employment status (Ref: Not working)
Working 0.88 (0.69, 1.13) 0.33
Told about pregnancy complications (Ref: No)
Yes 1.65 (1.29, 2.11) <0.0001
Ref, reference; %, percent; UOR, Unadjusted odds ratio; 2014 GDHS data
Multivariable Analysis Results
Women’s age, marital status, and employment status were study variables with a p-value
above 2.5 in the unadjusted model were not considered as a candidate in the multivariable model
and so they were not assessed for multicollinearity.
As shown in Table 2-4, mean VIF of 1.38 suggests a global stability among the study
variables and hence collinearity was dispelled. Also, all the study predictors had VIF less than
2.5 and tolerance more than 0.4.
Table 2-4. Results of the multicollinearity test
Study Predictors VIF Tolerance
Religion 1.16 0.86
Ethnicity 1.03 0.97
Parity 1.11 0.90
Place of residence 1.75 0.57
Education 1.50 0.67
Financial status 2.07 0.48
Told about pregnancy complication 1.01 0.98
Mean VIF 1.38

64
VIF, variance inflation factor
Moreover, the influence of ethnicity in the unconditional model was diminished in the
adjusted model. Women’s ethnicity did not have significant association with health facility
delivery as shown in Table 2-5.
The final model with only significant predictors was selected as a parsimonious model
because of lower AIC (3877.8) when compared to the empty model (AIC=5062.5). The receiver
operating characteristic (ROC) curve displayed in Figure 2-2 and the area under ROC curve of
0.78 (95%CI=0.76, 0.79) from the final model shows a better model fit. Furthermore, the results
from the link test infer that the model have greater explanatory power and is specified correctly
(p-value=0.44). Also, the insignificant p-value of 0.3978 from the Hosmer-Lemeshow goodness
of fit test indicates the model is appropriate for the data.
0.0
00
.25
0.5
00
.75
1.0
0
Se
nsitiv
ity
0.00 0.25 0.50 0.75 1.001 - Specificity
Area under ROC curve = 0.7825

65
Figure 2-2. The receiver operating characteristic (ROC) curve of the final model
In this study, no confounding and significant interaction term was identified. Table 2-5
present the significant factors associated with health facility delivery in the multivariable logistic
regression analysis.
Religion. The likelihood of health facility delivery among Christians was 2.53
(95%CI=1.67-3.84) times higher than traditional and other believers. Likewise, Muslims were
2.75 (95%CI=1.61- 4.69) times more likely to deliver at a health facility than traditional and
other believers (Table 2-5).
Parity. Odds of having health facility delivery among women who had given birth once
were 1.58 (95%CI = 1.18-2.12) times higher than mothers with 3 or more births. Conversely, no
significant difference was detected between women who had given birth twice and those with
three or more childbirth experience (Adjusted Odds ratio (AOR) =1.07; 95%CI=0.82-1.39)
(Table 2-5).
Residence. Women living in urban areas were 2.21 (95%CI = 1.53-3.19) times more
likely to use health facilities for delivery than their rural counterparts (Table 2-5).
Education. Women who attained at least secondary education were 2.04 (95%CI = 1.57-
2.64) times more likely to deliver at a health facility than uneducated women. Likewise, women
who had a primary education were 1.39 (95% CI = 1.02-1.92) times more likely to have health
facility delivery relative to those without education (Table 2-5).
Financial Status. The odds of having health facility delivery were 6.91 (95%CI= 4.12-
11.59) times higher among the rich than poor women. Compared to poor women, middle-level
women were 1.57 (95%CI= 1.18-2.08) times more likely to deliver at a health facility (Table 2-
5).

66
Perceived need. The analysis revealed that women who were aware of pregnancy
complications were 1.32 (95%CI: 1.02-1.70) times more likely to deliver at a health facility
when compared with women who were not informed about pregnancy-related issues (Table 2-5).
Table 2-5. Adjusted Odds ratio and 95% Confidence interval of having health facility delivery by
sociodemographic risk factors in the multivariable logistic regression analyses
Predictors AOR (95% Confidence Interval) P-value
Religion (Ref: Traditional/Other religion)
Muslim 2.75 (1.61, 4.69) <0.0001*
Christian 2.53 (1.67, 3.84) <0.0001*
Ethnicity (Ref: Northern tribes)
Akan 0.96 (0.68, 1.35) 0.82
Ewe 1.01 (0.59, 1.74) 0.96
Ga 1.00 (0.63, 1.61) 0.96
Other 0.82 (0.47, 1.40) 0.46
Parity of the women (Ref: 3 or more births)
1 birth 1.58 (1.18, 2.12) 0.002 *
2 births 1.07 (0.82, 1.39) 0.6
Residence (Ref: Rural)
Urban 2.21 (1.53, 3.19) <0.0001*
Highest Education Level (Ref: No education)
Primary 1.39 (1.02, 1.92) 0.04*
Secondary and above 2.04 (1.57, 2.64) <0.0001*
Financial status (Ref: Poor)
Middle 1.57 (1.18, 2.08) 0.002*
Rich 6.91 (4.12, 11.59) <0.0001*
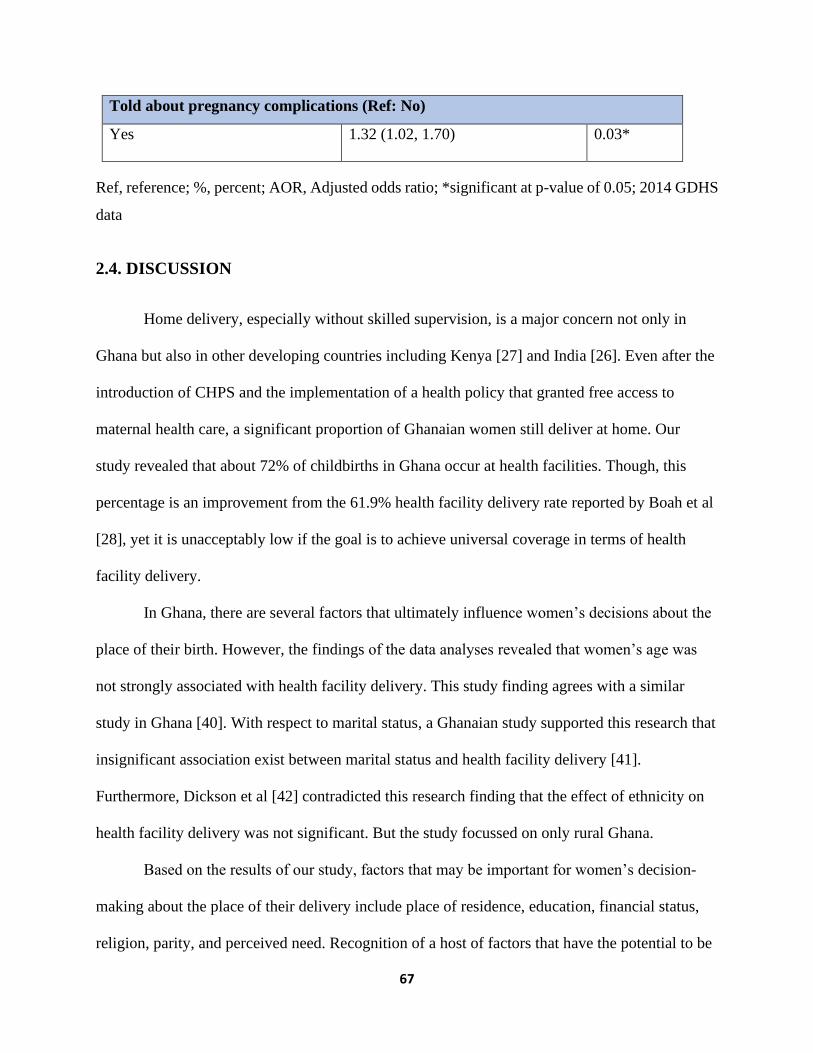
67
Told about pregnancy complications (Ref: No)
Yes 1.32 (1.02, 1.70) 0.03*
Ref, reference; %, percent; AOR, Adjusted odds ratio; *significant at p-value of 0.05; 2014 GDHS
data
2.4. DISCUSSION
Home delivery, especially without skilled supervision, is a major concern not only in
Ghana but also in other developing countries including Kenya [27] and India [26]. Even after the
introduction of CHPS and the implementation of a health policy that granted free access to
maternal health care, a significant proportion of Ghanaian women still deliver at home. Our
study revealed that about 72% of childbirths in Ghana occur at health facilities. Though, this
percentage is an improvement from the 61.9% health facility delivery rate reported by Boah et al
[28], yet it is unacceptably low if the goal is to achieve universal coverage in terms of health
facility delivery.
In Ghana, there are several factors that ultimately influence women’s decisions about the
place of their birth. However, the findings of the data analyses revealed that women’s age was
not strongly associated with health facility delivery. This study finding agrees with a similar
study in Ghana [40]. With respect to marital status, a Ghanaian study supported this research that
insignificant association exist between marital status and health facility delivery [41].
Furthermore, Dickson et al [42] contradicted this research finding that the effect of ethnicity on
health facility delivery was not significant. But the study focussed on only rural Ghana.
Based on the results of our study, factors that may be important for women’s decision-
making about the place of their delivery include place of residence, education, financial status,
religion, parity, and perceived need. Recognition of a host of factors that have the potential to be

68
predictive of women’s decision-making reflects the need to take a public health approach that
emphasizes the social determinants of health when examining health facility deliveries. A social
determinants approach recognizes that health extends far beyond the medical model. Using a
social determinants’ lens to improve health facility deliveries has the potential to transform
Ghanaian women’s birthing experiences, health outcomes, and their children’s wellbeing.
However, the relevance of each of our study’s factors must be assessed in light of the literature.
Residence. Place of residence tends to influence the choice women make about place of
delivery [43]. In our study, only about half of births among women living in rural areas occurred
at a health facility, and this is consistent with statistics reported by Ghana Health Service [44].
Women living in urban areas were more likely to deliver at a health facility than rural dwellers in
the multivariate regression model controlling for other important factors. These findings are
consistent with the results reported in other African countries, including Ethiopia [45], Nigeria
[46], and Kenya [24]. The disparity between rural and urban women may be a consequence of
the physical location of health facilities. That is, more maternal health facilities are located in
urban areas, meaning that those facilities are more accessible to the women that live there. Urban
women do not face the same barriers to physical access that rural women do; poor roads and the
remoteness of some communities mean that health facility delivery may not be a viable option
for some rural women. Further, the proximity of health facilities in urban areas means there is a
more concrete network between various health services, and urban women may be able to
receive referrals and make use of multidisciplinary teams to a greater extent than rural women.
Given the strong association between place of residence and home delivery, efforts directed at
improving rural health services in Ghana may be warranted.
69
Education. A woman’s choice regarding where she delivers her child and her education
level are closely linked [27]. Upon holding everything else constant, as the level of education
increased, the likelihood of health facility delivery increased. This finding is consistent with
other studies [19, 23, 34, 47, 48]. This trend is thought to be a function of improved health
literacy among educated women. That is, educated women are better able to understand and
become informed about health care issues. As a result, their health care decisions reflect this
awareness [49]. This finding indicates that creating public health programming that targets
women with lower levels of education may be an effective way to increase the number of health
facility deliveries.
Financial Status. In our study, the poorer the woman, the less likely it is that she delivers
at a health facility. This trend is mirrored in studies conducted in Kenya [27, 49], Ghana [25],
and Nigeria [48]. Given that Ghana’s maternal health care is free, our results suggest that, aside
from the cost of health services, other economic factors influence women’s decision-making
when it comes to the choice of delivery place. This nuanced interpretation draws a crucial
distinction between the Ghanaian context and other jurisdictions and must be explored. This
interpretation is affirmed in some literature, where a women’s inability to purchase maternal
health services was not the sole reason for opting to deliver outside of a health facility [24].
Other contributing factors may include: the cost of transportation, time spent traveling, and
miscellaneous fees associated with receiving care in health facilities [50, 51]. This broad
interpretation of the costs associated with health facility deliveries is crucial for gaining a deeper
understanding of how financial status influences women’s decisions to resort to home delivery.
Religion. Women who were Christians or Muslims were more likely to deliver at a health
facility than those who had traditional and other beliefs. This result is supported by other

70
research conducted in Ghana [18], but contrary to the results from a research study conducted in
Uganda [19]. Given the differences in socio-demographics between Uganda and Ghana, the
discrepancy may be a function of the different religious make-ups. The reason why women with
traditional and other beliefs are less likely to deliver at health facilities may be because of their
opposition to modern health services. These women may perceive pregnancy and labour as
natural occurrences that should be free of medical intervention, except in the case of an
emergency [5, 52]. Considering that religion is highly personal, public health interventions
aimed at connecting these women with maternal health services must be developed with the
utmost cultural competence to help discourage home deliveries and its associated consequences.
Parity. The number of times a woman had given birth was strongly associated with
health facility delivery. As birthing times decreased, the likelihood of health facility delivery
increased. In a similar study conducted in rural south Ghana, first-time mothers were more likely
to have health facility delivery than women who had previously given birth more than twice [23].
This direct association is consistent with findings from the literature [24, 27, 47]. One possible
explanation for this finding could be that if a woman received poor health services during her
previous deliveries, she may be less likely to access those services again [24, 53, 54]. Apart from
these negative experiences, self-confidence from previous labours [19], lower complications
from a previous pregnancy, and the notion that home delivery is a sign of bravery [5] tend to
aggravate the likelihood of delivering at home. Unpacking this trend is important because if the
quality of maternal health services is detracting women from using them, then improvements
must be made. Further investigation is needed to examine the association between the quality of
maternal health care and health facility delivery among multiparous. Given the data source, this
was not possible in the current study. However, such an investigation would provide important

71
insights about the quality of maternal health care services, and their ability to adequately meet
expectant mothers’ needs. Eventually, it would assist in improving health facility deliveries
among multiparous women.
Perceived need. The study identified that health facility delivery was significantly
associated with the perceived need of the mothers, but the association was not strong. Perceived
need i.e. knowledge about pregnancy complications was associated with health facility delivery
in this study. The study result is consistent with some earlier studies in the African sub-region
[28, 33, 55] that found greater use of health facility delivery among mothers who were informed
about pregnancy and delivery issues. This result exposes the quality of health information
mothers received during antenatal care (ANC) since the rate of ANC uptake has been reported to
be very high in Ghana by other studies [10, 28]. This finding points to the need to give increased
attention to health education about potential delivery associated complications as part of ANC in
Ghana.
Study strength and limitations
This study used a large nationally representative Demographic and Health Survey data to
examine the social determinants of health facility delivery use. The results from the present study
contribute to the body literature on the social determinants of health and highlight the need for
targeted maternal health programming especially in developing economies. However, this
research was characterized by some limitations which should be recognized in the interpretation
of the findings. Information on recent delivery within five years prior to the survey were
collected to minimise recall bias since the survey relied on self-report. Also, as a result of a lack
of data on actual medical needs, the variable “told about pregnancy complications” was used as a

72
proxy for perceived need and hence conclusions based on this variable should be drawn with
caution.
2.5. CONCLUSION
This study adds to the body of international literature on the social determinants of health as it
finds that there is a host of factors that influences Ghanaian women’s decision about health
facility delivery. This study found that women who were at a higher risk of delivering outside
health facilities were less educated, rural dwellers, and have previously given birth. Also, in spite
of Ghana’s free maternal health care policy, poorer women were much less likely to have a
health facility delivery, which raises the issue of other indirect financial barriers to access and the
importance of tackling these barriers. Many of these factors are demand-side factors and so
targeted policies and effective maternal health programmes should be developed to increase
health facility delivery among Ghanaian women and improve equitable access to it. Finally, this
research further recommends examining how community-level characteristics such as levels of
unemployment, education and poverty exert influence on health facility delivery.
References
1. Yanagisawa S, Oum S, Wakai S: Determinants of skilled birth attendance in rural
Cambodia. Tropical Medicine & International Health 2006, 11(2):238-251.
2. Filippi V, Ronsmans C, Campbell OM, Graham WJ, Mills A, Borghi J, Koblinsky M,
Osrin D: Maternal health in poor countries: the broader context and a call for
action. The Lancet 2006, 368(9546):1535-1541.

73
3. Koblinsky M, Matthews Z, Hussein J, Mavalankar D, Mridha MK, Anwar I, Achadi E,
Adjei S, Padmanabhan P, van Lerberghe W: Going to scale with professional skilled
care. The Lancet 2006, 368(9544):1377-1386.
4. Adegoke A, Van Den Broek N: Skilled birth attendance‐lessons learnt. BJOG: An
International Journal of Obstetrics & Gynaecology 2009, 116(s1):33-40.
5. Montagu D, Yamey G, Visconti A, Harding A, Yoong J: Where do poor women in
developing countries give birth? A multi-country analysis of demographic and
health survey data. PloS one 2011, 6(2):e17155.
6. WHO: Trends in maternal mortality: 1990-2015: estimates from WHO, UNICEF,
UNFPA, World Bank Group and the United Nations Population Division: executive
summary. In.: World Health Organization; 2015.
7. WHO WHO: Neonatal and perinatal mortality: country, regional and global
estimates. In.; 2006.
8. Lawn JE, Blencowe H, Pattinson R, Cousens S, Kumar R, Ibiebele I, Gardosi J, Day LT,
Stanton C, Committee LsSSS: Stillbirths: Where? When? Why? How to make the
data count? The Lancet 2011, 377(9775):1448-1463.
9. Tuladhar H, Dali S, Pradhanang V: Complications of home delivery: a retrospective
analysis. Journal of the Nepal Medical Association 2005, 44(159).
10. GSS: Ghana Demographic and Health Survey 2014. In.: Ghana Statistical Service
(GSS), Ghana Health Service (GHS), and ICF International; 2015.
11. Magoma M, Requejo J, Campbell OM, Cousens S, Filippi V: High ANC coverage and
low skilled attendance in a rural Tanzanian district: a case for implementing a birth
plan intervention. BMC pregnancy and childbirth 2010, 10(1):13.

74
12. Bhutta ZA, Lassi ZS, Mansoor N: Systematic review on human resources for health
interventions to improve maternal health outcomes: evidence from developing
countries: World health organization (WHO); 2010.
13. Abera M, Belachew T: Predictors of safe delivery service utilization in Arsi Zone,
South-East Ethiopia. Ethiopian journal of health sciences 2011, 21(3).
14. Ghana Statistical Service GHS, MacroInternational: Ghana Demographic and Health
Survey. Accra Ghana. In.; 2008.
15. Penfold S, Harrison E, Bell J, Fitzmaurice A: Evaluation of the delivery fee exemption
policy in Ghana: population estimates of changes in delivery service utilization in
two regions. Ghana medical journal 2007, 41(3):100.
16. Mensah J, Oppong JR, Schmidt CM: Ghana's National Health Insurance Scheme in
the context of the health MDGs: An empirical evaluation using propensity score
matching. Health economics 2010, 19(S1):95-106.
17. GSS: Ghana multiple indicator cluster survey with an enhanced malaria module
and biomarker with enhanced module biomarker. In.: Ghana Statistical Service
(GSS); 2011.
18. Amoakoh-Coleman M, Ansah EK, Agyepong IA, Grobbee DE, Kayode GA, Klipstein-
Grobusch K: Predictors of skilled attendance at delivery among antenatal clinic
attendants in Ghana: a cross-sectional study of population data. BMJ open 2015,
5(5):e007810.
19. Anyait A, Mukanga D, Oundo GB, Nuwaha F: Predictors for health facility delivery in
Busia district of Uganda: a cross sectional study. BMC pregnancy and childbirth 2012,
12(1):132.
75
20. Fotso J-C, Ezeh AC, Essendi H: Maternal health in resource-poor urban settings:
how does women's autonomy influence the utilization of obstetric care services?
Reproductive Health 2009, 6(1):9.
21. Van Eijk AM, Bles HM, Odhiambo F, Ayisi JG, Blokland IE, Rosen DH, Adazu K,
Slutsker L, Lindblade KA: Use of antenatal services and delivery care among women
in rural western Kenya: a community based survey. Reproductive health 2006, 3(1):2.
22. Ochako R, Fotso J-C, Ikamari L, Khasakhala A: Utilization of maternal health services
among young women in Kenya: insights from the Kenya Demographic and Health
Survey, 2003. BMC pregnancy and childbirth 2011, 11(1):1.
23. Manyeh AK, Akpakli DE, Kukula V, Ekey RA, Narh-Bana S, Adjei A, Gyapong M:
Socio-demographic determinants of skilled birth attendant at delivery in rural
southern Ghana. BMC research notes 2017, 10(1):268.
24. Kitui J, Lewis S, Davey G: Factors influencing place of delivery for women in Kenya:
an analysis of the Kenya demographic and health survey, 2008/2009. BMC pregnancy
and childbirth 2013, 13(1):40.
25. Ameyaw EK, Tanle A, Kissah-Korsah K, Amo-Adjei J: Women’s health decision-
making autonomy and skilled birth attendance in Ghana. International journal of
reproductive medicine 2016, 2016.
26. Bhattacharyya S, Srivastava A, Roy R, Avan BI: Factors influencing women’s
preference for health facility deliveries in Jharkhand state, India: a cross sectional
analysis. BMC pregnancy and childbirth 2016, 16(1):50.
27. Gitonga E, Muiruri F: Determinants of health facility delivery among women in
Tharaka Nithi county, Kenya. The Pan African Medical Journal 2016, 25(Suppl 2).

76
28. Boah M, Mahama AB, Ayamga EA: They receive antenatal care in health facilities,
yet do not deliver there: predictors of health facility delivery by women in rural
Ghana. BMC pregnancy and childbirth 2018, 18(1):125.
29. Esena RK, Sappor M-M: Factors associated with the utilization of skilled delivery
services in the Ga East Municipality of Ghana Part 2: barriers to skilled delivery.
Int J Sci Tech Res 2013, 2(8):195-207.
30. Andersen RM, McCutcheon A, Aday LA, Chiu GY, Bell R: Exploring dimensions of
access to medical care. Health services research 1983, 18(1):49.
31. Andersen RM: Revisiting the behavioral model and access to medical care: does it
matter? Journal of health and social behavior 1995:1-10.
32. Andersen R, Newman JF: Societal and individual determinants of medical care
utilization in the United States. The Milbank Memorial Fund Quarterly Health and
Society 1973:95-124.
33. Gabrysch S, Campbell OM: Still too far to walk: literature review of the determinants
of delivery service use. BMC pregnancy and childbirth 2009, 9(1):34.
34. Tebekaw Y, James Mashalla Y, Thupayagale-Tshweneagae G: Factors Influencing
Women’s Preferences for Places to Give Birth in Addis Ababa, Ethiopia. Obstetrics
and gynecology international 2015, 2015.
35. Hosmer DW LS: Applied logistic regression New York: Wiley; 2000.
36. Johnston R, Jones K, Manley D: Confounding and collinearity in regression analysis:
a cautionary tale and an alternative procedure, illustrated by studies of British
voting behaviour. Quality & quantity 2018, 52(4):1957-1976.

77
37. Bursac Z, Gauss CH, Williams DK, Hosmer DW: Purposeful selection of variables in
logistic regression. Source code for biology and medicine 2008, 3(1):17.
38. Long JS, Freese J: Regression models for categorical dependent variables using
Stata, 2nd edition edn: Stata press; 2006.
39. Hilbe JM: Logistic regression models, 1st edition edn: CRC press; 2009.
40. Speizer IS, Story WT, Singh K: Factors associated with institutional delivery in
Ghana: the role of decision-making autonomy and community norms. BMC
pregnancy and childbirth 2014, 14(1):398.
41. Enuameh YAK, Okawa S, Asante KP, Kikuchi K, Mahama E, Ansah E, Tawiah C, Adjei
K, Shibanuma A, Nanishi K: Factors influencing health facility delivery in
predominantly rural communities across the three ecological zones in Ghana: A
cross-sectional study. PloS one 2016, 11(3):e0152235.
42. Dickson KS, Adde KS, Amu H: What Influences Where They Give Birth?
Determinants of Place of Delivery among Women in Rural Ghana. International
journal of reproductive medicine 2016, 2016.
43. Azimi MD, Najafizada SAM, Khaing IK, Hamajima N: Factors influencing Non-
institutional deliveries in Afghanistan: secondary analysis of the Afghanistan
mortality survey 2010. Nagoya journal of medical science 2015, 77(1-2):133.
44. GHS GHS: 2011 Annual Report. Accra, Ghana. In.; 2011.
45. Alemayehu M, Mekonnen W: The prevalence of skilled birth attendant utilization
and its correlates in North West Ethiopia. BioMed research international 2015, 2015.
78
46. Onah HE, Ikeako LC, Iloabachie GC: Factors associated with the use of maternity
services in Enugu, southeastern Nigeria. Social science & medicine 2006, 63(7):1870-
1878.
47. Baral Y, Lyons K, Skinner J, Van Teijlingen E: Determinants of skilled birth
attendants for delivery in Nepal. Kathmandu University Medical Journal 2012,
8(3):325-332.
48. Envuladu E, Agbo H, Lassa S, Kigbu J, Zoakah A: Factors determining the choice of a
place of delivery among pregnant women in Russia village of Jos North, Nigeria:
achieving the MDGs 4 and 5. International Journal of Medicine and Biomedical
Research 2013, 2(1):23-27.
49. Kawakatsu Y, Sugishita T, Oruenjo K, Wakhule S, Kibosia K, Were E, Honda S:
Determinants of health facility utilization for childbirth in rural western Kenya:
cross-sectional study. BMC pregnancy and childbirth 2014, 14(1):265.
50. Borghi J, Ensor T, Neupane BD, Tiwari S: Financial implications of skilled attendance
at delivery in Nepal. Tropical Medicine & International Health 2006, 11(2):228-237.
51. Kowalewski M, Mujinja P, Jahn A: Can mothers afford maternal health care costs?
User costs of maternity services in rural Tanzania. African journal of reproductive
health 2002:65-73.
52. Barnes L: Women's experience of childbirth in rural Jharkhand. Economic and
Political Weekly 2007:62-70.
53. Mrisho M, Schellenberg JA, Mushi AK, Obrist B, Mshinda H, Tanner M, Schellenberg
D: Factors affecting home delivery in rural Tanzania. Tropical Medicine &
International Health 2007, 12(7):862-872.

79
54. Osubor K, Fatusi AO, Chiwuzie J: Maternal health-seeking behavior and associated
factors in a rural Nigerian community. Maternal and Child Health Journal 2006,
10(2):159.
55. Hailu D, Berhe H: Determinants of institutional childbirth service utilisation among
women of childbearing age in urban and rural areas of Tsegedie district, Ethiopia.
Midwifery 2014, 30(11):1109-1117.
80
The disproportionate use of Caesarean Section (CS) delivery highlighted in chapter 1 and the
disparities in health facility delivery discussed in chapter 2, necessitated chapter 3 to elucidate
socioeconomic discrepancies in the caesarean delivery beyond just place of delivery.
Chapter 3 is published in the International Journal for Equity in Health “Dankwah, E.,
Kirychuk, S., Zeng, W., Feng, C., & Farag, M. (2019). Socioeconomic inequalities in the use of
caesarean section delivery in Ghana: a cross-sectional study using nationally representative data.
International journal for equity in health, 18(1), 162. doi:10.1186/s12978-019-0753-2” (2-year
Impact Factor -2.473). In chapter 3, I conceptualized, reviewed the literature, cleaned and
analyzed the data, interpreted the findings and wrote the chapter.

81
Chapter 3. Socioeconomic inequalities in the use of Caesarean Section Delivery in Ghana: a
cross-sectional study using nationally representative data
3.1. INTRODUCTION
Caesarean Section (CS) is a life-saving obstetric surgical intervention for mothers and
babies [1, 2]. This vital clinical procedure is often needed as a result of several medical
conditions including macrosomia, pregnancy-induced hypertension, maternal weight, among
others [3-5]. Yearly, about 18.5 million CS births are recorded worldwide,[6] this CS rate
constitutes an average 19.1 percent of total births with great variations across geographic regions
[7-9].
This CS disparity represents underuse or possibly medically unjustified overuse [7, 10-13].
Studies have posited that unlike higher-income countries that have adequate or even overuse, C-
Sections in lower-income regions of the world are persistently underutilized [11, 14, 15] though
developing countries represent 60% of global births,[6]. Irani and Deering[16] reported a 3.6%
CS rate in sub-Saharan Africa.
Globally, inequities in the use of CS for delivery have seriously affected maternal and
newborn health outcomes [11, 14]. However, most studies have linked inadequate access to CS
delivery to maternal and newborn deaths and morbidities especially in resource limited settings
[11, 14, 15]. Further, Ahmed and Tuncalp [17] related poor maternal and perinatal health
outcomes to delay or lack of timely caesarean intervention; which has consequences such as
stillbirth, ruptured uterine, obstetric fistula and many other obstetric conditions.
Recent studies have found that out of the 3.2 million extra CS that would be required every year
in low-income settings to avoid maternal and neonatal deaths, approximately 68.5% would be
needed in Africa [6].

82
Like many developing countries, Ghana’s maternal mortality rate is high; by the end of
2015, the estimated rate was 319 maternal deaths per 100,000 live births [18]. According to the
2014 mortality report, 9% of all female deaths in Ghana were pregnancy-related, [19]. Available
data declared a CS rate of 6.9 in 2008 [20] with an unmet C-sections of about 23,467 per year in
Ghana [6]. Though the association between CS birth and socio-economic predictors have been
well-established in the literature, [21-27] the inconsistent findings underpin the need for this
study. Specifically, a small number of studies have been conducted in Ghana to examine CS
delivery use [28-30]. However, the magnitude and direction of the socioeconomic effects on CS
birth remain unclear. For example, while no significant association between CS delivery and
parity was reported by Pra et al [29]. Manye et al [30] found that parity of the women was a
strong predictor of CS delivery use. Likewise, older women (>34 years) were more likely to use
CS delivery than younger women according to Manye et al [30] and yet the reverse is the case in
the study by Prah et al [29].
Moreover, most of the existing Ghanaian studies on CS births are hospital-based and
some failed to sample participants randomly which has the potential to bias the study estimates.
For instance, Danso et al [28] used a convenience sampling technique to select 154 women who
used CS delivery from two teaching hospitals in Ghana. Similarly, Prah et al [29] reviewed
medical records from a health facility and reported a CS delivery rate of 26.9%. Further, the only
existing population-based study on CS delivery focused on small geographical area of the
country [30], that was in just two rural districts out of the 216 districts in Ghana and therefore
restricts making inference about the entire population [30]. Also, none of the studies quantified
the extent of inequality using concentration index and curve. This study aims to contribute to a
growing international policy-relevant body of literature examining the effect of socioeconomic
83
factors on CS delivery [31-33]. The goal of this study is to investigate the association between
CS delivery and socio-economic factors using nationally representative data from Ghana.
3.2. METHODS
3.2.1. Study data and variables
The data for this study were drawn from the 2014 Ghana Demographic and Health
Survey (GDHS), a nationwide population-based survey. The subset of data used for this study
includes only females between 15 and 49 years old residing in Ghana. Participants were selected
into the survey in two stages as described by the Ghana Statistical Service (GSS) and its
collaborators: Inner city fund (ICF) International and Ghana Health Service (GHS) [34]. Firstly,
427 clusters were selected and subsequently, 30 households from each cluster were randomly
selected. In total, 12,831 households were selected for the survey; actual interviews were
conducted in 11,835 households out of the 12,010 households that were occupied representing a
response rate of 98.5%. Trained interviewers used a structured questionnaire that was pretested
to collect data from 9,396 women on the socio-demographic background, reproductive, family
planning history and other aspects of women’s health. Among eligible women, the interviewed
women in GDHS recorded a 3% non-response rate. Weighted cluster sampling was applied in
the survey [34].
The 2014 GDHS gathered data on recent births in the five years preceding the survey.
The study outcome was whether the delivery was a CS or not. Women who reported having used
CS delivery were classified as “1 = CS delivery” otherwise, they were classified as “0 = not CS
delivery”. Based on the Andersen health behavioral model, the following self-reported variables
from the survey were selected and studied to assess the inequities in use of CS delivery: maternal

84
age, marital status, religion, ethnicity, parity, place of residence, education, financial status, and
working status. To prevent redundancy of the region of residence variable and be able
disaggregate the extent of inequality in CS delivery at a lower level, ethnicity was included in
this study instead region of residence because a region is composed of ethnic groups.
For the analysis conducted in this study, categorization of the variables was guided by
prior studies [24, 25, 30, 35]. As demonstrated in Table 3-1, maternal age was categorized into
three groups (15-24, 25-34, 35-49) due to the violation of the assumption of linearity (p-value
<0.0001). Regarding marital status, it was grouped into single, married, cohabitating and
widowed or separated or divorced. For the religious affiliation of the women, it was classified
into three groups (Christians, Islam and Traditional/other). The categories used for the variable
Ethnic group of the woman were Northern tribes, Akan, Ewe, Ga, and others. The parity of the
women which is the birth order was categorized into three cohorts (One birth, 2 births, and ≥3
births). With respect to education, women were categorized into four groups: no education,
primary, secondary, and higher. Women’s place of residence was grouped into rural and urban.
The wealth quintile of the women was ascertained using principal component analysis of assets
and household factors and hence classified into the poorest, poorer, middle, richer, and richest as
present in other studies [36]. Finally, the working status of the women was classified into
employed and unemployed.
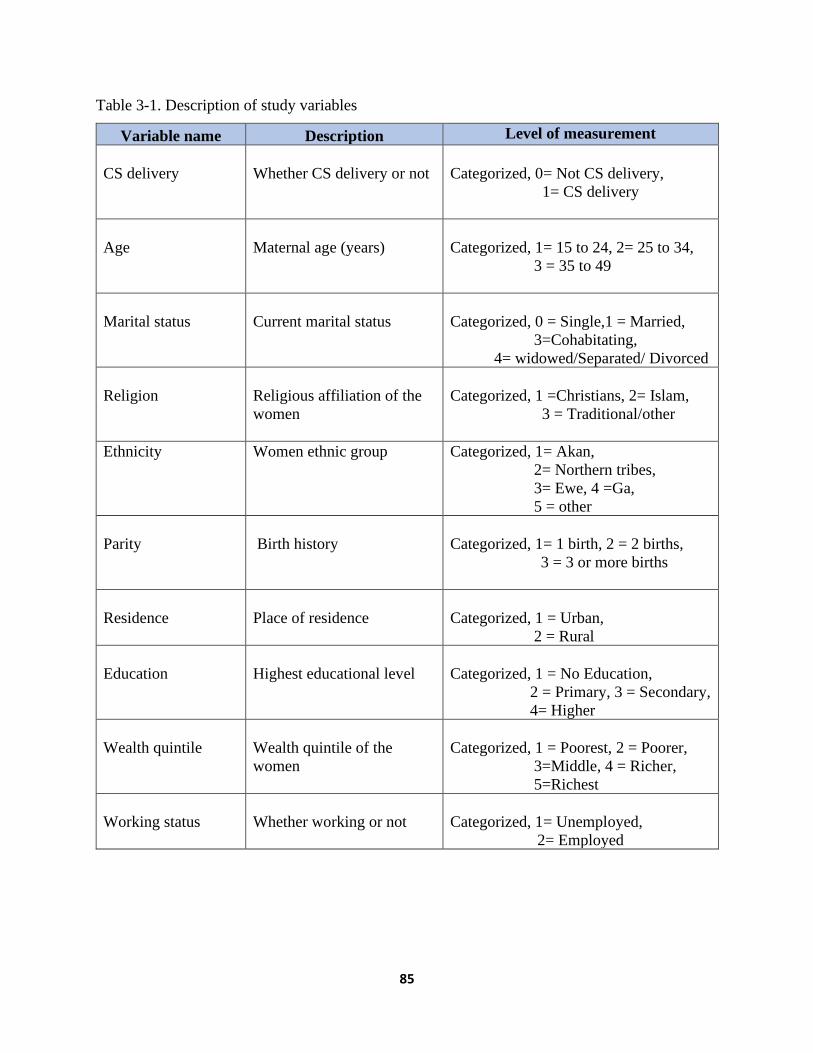
85
Table 3-1. Description of study variables
Variable name Description Level of measurement
CS delivery
Whether CS delivery or not
Categorized, 0= Not CS delivery,
1= CS delivery
Age
Maternal age (years)
Categorized, 1= 15 to 24, 2= 25 to 34,
3 = 35 to 49
Marital status
Current marital status
Categorized, 0 = Single,1 = Married,
3=Cohabitating,
4= widowed/Separated/ Divorced
Religion
Religious affiliation of the
women
Categorized, 1 =Christians, 2= Islam,
3 = Traditional/other
Ethnicity
Women ethnic group
Categorized, 1= Akan,
2= Northern tribes,
3= Ewe, 4 =Ga,
5 = other
Parity
Birth history
Categorized, 1= 1 birth, 2 = 2 births,
3 = 3 or more births
Residence
Place of residence
Categorized, 1 = Urban,
2 = Rural
Education
Highest educational level
Categorized, 1 = No Education,
2 = Primary, 3 = Secondary,
4= Higher
Wealth quintile
Wealth quintile of the
women
Categorized, 1 = Poorest, 2 = Poorer,
3=Middle, 4 = Richer,
5=Richest
Working status
Whether working or not
Categorized, 1= Unemployed,
2= Employed

86
3.2.2. Statistical Analyses
Frequencies and percentages were calculated for categorical variables included in this
study using the Pearson Chi-square test. To examine the determinants of CS delivery, a
regression model with a logit link function was fitted. The logistic regression model used in this
study was premised on this equation:
Equation 3-1: Logistic Regression model for CS delivery
P (Yi = 1) = pi
Logit (pi)=𝛽0+𝛽1𝑥𝑖1+𝛽2𝑥𝑖2+⋯+𝛽𝑘𝑥𝑖𝑘
where pi is the probability of CS delivery among i th respondents, 𝛽0 was the intercept, 𝛽𝑘
represented regression coefficients of the predictors, 𝑥𝑖𝑘 was the study predictors
Univariable and multivariable analyses were conducted to estimate the odds ratio (OR)
and 95% confidence interval. A lenient p-value of 0.25 was adopted to select potential predictors
into the adjusted model, mainly to avoid missing important factors in the multivariable analysis
whose effect could be masked, suppressed or inflated by other controlling variables [37, 38].
Multicollinearity was tested for risk factors selected for the multivariable model. Variance
inflation factor (VIF) greater than 2.5 or tolerance of less than 0.4 was set as the limit because
beyond this cut-off, it may cause correlations among study factors in the logistic regression
model as suggested by Johnston et al [39]. A manual backward elimination selection method was
used to estimate the adjusted odds ratio (AOR) for CS births. In the adjusted model, explanatory
variables were considered significant at p-value ≤0.05. Confounding and interaction effects of
predictors in the adjusted model were checked. In this study, explanatory variables were included

87
in the multivariate regression analysis if the percentage change in the regression coefficient
between the crude and the adjusted model was greater than 20%. Also, two-way interactions
were examined between significant explanatory variables in the adjusted model. Sample
weighting adjustment was applied for the unequal proportion of samples from the population and
differential nonresponse rate. Moreover, the model incorporated a robust variance estimation
method to ensure accurate points and intervals were computed after adjusting for design
characteristics. In addition, the area under the curve (AUC) of the receiver operating
characteristics (ROC) was computed, and a parsimonious model was selected using Akaike’s
Information Criterion (AIC). Smaller AIC was chosen as a better model [40]. Lastly, to ascertain
the model was specified correctly, link test was performed to check specification errors and a
post estimation Hosmer-Lemeshow goodness-of-fit test was done [38, 41, 42].
To estimate the inequality in CS birth based on wealth quintile, the following health
equity metrics were used: rate-ratios, concentration curves and concentration indices [43-46]. To
compute rate-ratio, the percentage of CS delivery among the richest group was divided by the
proportion of CS delivery among the poorest group. Furthermore, the degree of inequality was
displayed graphically using the concentration curve; this was done by plotting the cumulative
proportion of the population ranked by the wealth quintile of the women on the x-axis against
the cumulative proportion of CS delivery on the y-axis. The diagonal line on the graph is the
equality line of caesarean delivery based on wealth quintile. A concentration curve that is above
the equality line indicates that CS births are concentrated among economically disadvantaged
groups whereas a curve below the equality line suggests more CS delivery among the wealthier
groups. The Concentration index was used to quantify the level of inequities in the use of CS
delivery. The scale of concentration index ranges from -1 to +1, zero signifies equality in CS

88
delivery whereas negative and positive values represent a greater concentration of CS births
among the lower-class and affluent groups respectively [43-45]. For clarity in the interpretation
of concentration of index, Koolman and Doorslaer redistribution scheme [47] was adopted in this
study to estimate the percentage redistribution of CS delivery use required to achieve a
concentration index equal to zero. All the data analyses were conducted in STATA version 14.0
(Stata Corp., College Station, Texas: StataCorp LP, USA) and Microsoft Excel version 16. The
equation for the concentration index was adopted from some studies [44, 45]:
Equation 3-2: Concentration index
Concentration index = (p1L2 − p2L1) + (p2L3 − p3L2) + ... + (pT −1LT − pTLT −1)
pT: the cumulative percent of the sample ranked by the socioeconomic groups
LT: the corresponding concentration curve ordinate; and
T: the number of wealth groups
3.3. RESULTS
3.3.1. Descriptive results
Out of the 4294 women that were asked whether the delivery was by CS or not in the GDHS,
11.4% reported using CS for delivery. The distribution of women across predictors and the
mode of delivery is detailed in Table 3-2.
Age. The ages of the mothers were between 15-49 years with an average age of 29.7
years. Most (47.2%) of the mothers were aged 25-34 years. CS births among women aged 25-34
years were nearly double of those aged 15-24 years (11.5% versus 6.6%). CS delivery rate was
14.3% in older women (35-49 years), compared with 6.6% among younger women (15-24 years)
(Table 3-2).

89
Marital status. A majority (65.2%) of the women were married. Women cohabitating
had the lowest proportion (8.9%) of CS births whereas women who were either widowed or
divorced or separated had a CS rate little above 12% (Table 3-2).
Religion. Nearly three-quarters of women (71.8%) were Christians. CS births for
Christians were about twice that of the traditional and other believers (12.4% versus 5.6%). On
the other hand, the proportion of Muslim women who reported having had a CS was 9.9% (Table
3-2).
Ethnicity. With respect to ethnic orientation, Northern women were 41.8% while Akans
were 38.3%. Minority groups constituted about 20% of the women; they were Ewe (11.1%), Ga
(4.6%) and other ethnic groups. CS delivery ranged from a lowest rate of 7.5% among northern
tribes to 16.2% in Ga women (Table 3-2).
Parity. Around 58.7% of the mothers had at least 3 births. Parity of the women had an
inverse relationship with CS delivery. CS rate decreases as birth order increases: CS delivery
among mothers with one birth reduced from 16.6% to 12.2% (2 births) and 9.2% (3 or more
births).
Education. One-third (33.0%) of the women had no formal education whilst only 4.0%
attained post-secondary education. For women with no education, the proportion of women who
had a CS delivery was 6.1% whereas the CS prevalence among women with primary education
was 8.5%, 14% among women with secondary education, and 33.1% among women with higher
education (Table 3-2).
Place of residence. More than half (58.6%) of the women resided in the rural settings of
Ghana. The results show that the CS delivery rate was more than two-fold higher in urban
dwellers than women living in rural communities (17.1% versus 7.3%).
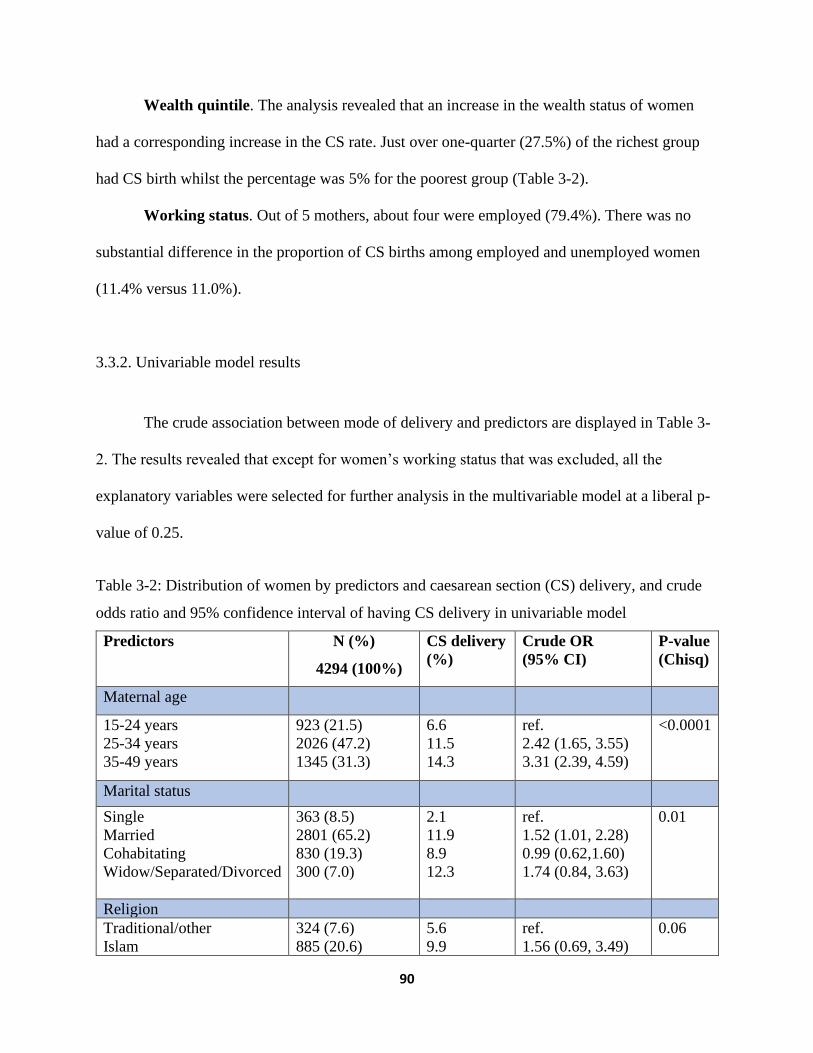
90
Wealth quintile. The analysis revealed that an increase in the wealth status of women
had a corresponding increase in the CS rate. Just over one-quarter (27.5%) of the richest group
had CS birth whilst the percentage was 5% for the poorest group (Table 3-2).
Working status. Out of 5 mothers, about four were employed (79.4%). There was no
substantial difference in the proportion of CS births among employed and unemployed women
(11.4% versus 11.0%).
3.3.2. Univariable model results
The crude association between mode of delivery and predictors are displayed in Table 3-
2. The results revealed that except for women’s working status that was excluded, all the
explanatory variables were selected for further analysis in the multivariable model at a liberal p-
value of 0.25.
Table 3-2: Distribution of women by predictors and caesarean section (CS) delivery, and crude
odds ratio and 95% confidence interval of having CS delivery in univariable model
Predictors N (%)
4294 (100%)
CS delivery
(%)
Crude OR
(95% CI)
P-value
(Chisq)
Maternal age
15-24 years
25-34 years
35-49 years
923 (21.5)
2026 (47.2)
1345 (31.3)
6.6
11.5
14.3
ref.
2.42 (1.65, 3.55)
3.31 (2.39, 4.59)
<0.0001
Marital status
Single
Married
Cohabitating
Widow/Separated/Divorced
363 (8.5)
2801 (65.2)
830 (19.3)
300 (7.0)
2.1
11.9
8.9
12.3
ref.
1.52 (1.01, 2.28)
0.99 (0.62,1.60)
1.74 (0.84, 3.63)
0.01
Religion
Traditional/other
Islam
324 (7.6)
885 (20.6)
5.6
9.9
ref.
1.56 (0.69, 3.49)
0.06

91
Christian
3085 (71.8)
12.4 1.97 (0.98, 3.96)
Ethnicity*
Northern tribes
Akan
Ewe
Ga
Other
1,796 (41.8)
1,643 (38.3)
476 (11.1)
198 (4.6)
180 (4.2)
7.5
15.2
11.3
16.2
10.0
ref.
2.19 (1.62, 2.96)
1.50 (0.99, 2.27)
2.93 (1.68, 5.14)
1.65 (0.85, 3.21)
<0.0001
Parity
1birth
2 births
≥3 births
935 (21.8)
839 (19.5)
2520 (58.7)
16.6
12.2
9.2
ref.
0.68 (0.51, 0.91)
0.54 (0.41, 0.71)
<0.0001
Education
No education
Primary
Secondary
Higher
1419 (33.0)
869 (20.2)
1837 (42.8)
169 (4.0)
6.1
8.5
14.8
33.1
ref.
1.88 (1.15, 3.07)
3.10 (2.25, 4.27)
8.28 (5.11, 13.41)
<0.0001
Place of residence
Rural
Urban
2516 (58.6)
1778 (41.4)
7.3
17.1
ref.
2.55 (1.89, 3.43)
<0.0001
Wealth quintile
Poorest
Poorer
Middle
Richer
Richest
1318 (30.6)
923 (21.5)
812 (18.9)
685 (16.0)
556 (13.0)
5.0
7.2
11.1
16.5
27.5
ref.
1.56 (1.01, 2.41)
2.67 (1.82, 3.92)
4.21 (2.81, 6.30)
8.12 (5.52, 11.94)
<0.0001
Working status
Unemployed
Employed
886 (20.6)
3408 (79.4)
11.0
11.4
ref.
1.03 (0.75, 1.43)
0.8
Abbreviations: N, number of observations; %, percent; *N=4293, due to missing values; CI,
confidence interval; OR, odds ratio; ref., reference; SD, standard deviation.
3.3.3. Multivariable model results
As demonstrated in Table 3-3, none of the study predictors had higher VIF and lower
tolerance than the threshold of 2.5 and 0.4 respectively.

92
Table 3-3. Results of the multicollinearity test
Predictors VIF Tolerance
Age 1.93 0.52
Marital status 1.19 0.84
Religion 1.17 0.85
Ethnicity 1.03 0.97
Parity 2.48 0.40
Place of residence 1.76 0.57
Education 1.68 0.60
Wealth quintile 2.36 0.42
*VIF > 2.5 or tolerance <0.40
The final model had lower AIC than the empty model (without study predictors)
(2.90e+09 vs 3.29e+09) and was chosen. The model specification link test shows that the final
model was correctly specified (p-value=0.28), and the p-value of 0.64 generated from the
Hosmer-Lemeshow postestimation test suggests the model properly fit the data. Besides, the area
under the ROC curve of 0.72 (95%CI: 0.70, 0.75) as well as the ROC curve (Figure 3-1)
indicates the model have sufficient discriminatory power on the dichotomous outcome of
interest.

93
Figure 3-1. Receiver Operator Characteristics curve of the final model
The multivariable associations between mode of delivery and associated factors are
presented in Table 3-4. In the adjusted model, women’s religion, ethnicity, place of residence
and marital status were not statistically significant at a p-value of 0.05 when all factors were
controlled (Table 3-4). Predictors that had significant effect on CS delivery were maternal age,
parity, education level, and wealth quintile. The analysis did not find confounders and
significant interaction among the predictors in the multivariable model.
Age. This study detected a positive association between CS birth and maternal age.
Mothers aged 25-34 years were 3.15 (95% CI= 2.11- 4.71) times more likely to have had a CS
delivery relative to women with ages 15 to 24 years. Similarly, older women aged 35-49 years
were 7.53 (95% CI = 5.11-11.08) times more likely to have had a CS birth than younger women
(15-24 years).
0.0
00
.25
0.5
00
.75
1.0
0
Se
nsitiv
ity
0.00 0.25 0.50 0.75 1.001 - Specificity
Area under ROC curve = 0.7247

94
Parity. The analysis revealed that parity had a direct relationship with CS delivery.
Women who had two births and at least 3 births were 0.53 (95%CI= 0.38-0.73) and 0.31
(95%CI=0.22-0.43) times, respectively less likely to have a CS delivery than women with one
birth.
Education. Regarding education, secondary educated and higher educated mothers were
about 1.65 (95%CI=1.15-2.36) and 2.17 (95%CI=1.26- 3.74) times, respectively, more likely
to have a CS birth relative to uneducated women. CS delivery among women with primary
education was not significantly different from uneducated women (AOR=1.59, 95% CI=0.98-
2.59).
Wealth quintile. Concerning the wealth quintile of women, the odds of having a CS
delivery was 2.76 (95%CI=1.77- 4.28) times and 4.38 (95%CI=2.83- 6.77) times higher
among richer and richest women respectively, than the poorest women. Likewise, middle-class
mothers were 2.13 (95%CI=1.43- 3.18) times more likely to have CS delivery relative to the
poorest mothers. No statistically significant difference in the likelihood of CS delivery was found
between poorer and poorest women (AOR=1.36, 95%CI=0.89- 2.06).

95
Table 3-4. AORs and corresponding 95% CIs of having a caesarean delivery by predictors in the
multivariable logistic regression model
Predictors AOR (95% CI) P-value
Maternal age (ref. 15-24 years)
25-34 years
35-49 years
3.15 (2.11, 4.71)*
7.53 (5.11,11.08)*
<0.0001
<0.0001
Marital status (ref. Single)
Married
Cohabitating
Widow/Separated/Divorced
1.34 (0.85, 2.09)
1.14 (0.69, 1.91)
1.74 (0.82, 3.67)
0.20
0.60
0.15
Religion (ref. Traditional/other)
Islam
Christian
1.12 (0.57, 2.21)
0.85 (0.48, 1.48)
0.73
0.57
Ethnicity (ref. Northern tribes)
Akan
Ewe
Ga
Other
1.11 (0.80, 1.52)
0.86 (0.57, 1.29)
1.36 (0.77, 2.42)
1.01 (0.50, 2.04)
0.50
0.46
0.29
0.97
Parity (ref. one birth)
2 births
≥3 births
0.52 (0.38, 0.73)*
0.31 (0.22, 0.43)*
<0.0001
<0.0001
Education (ref.no education)
Primary
Secondary
Higher
1.59 (0.98, 2.59)
1.65 (1.15, 2.36)*
2.17 (1.26, 3.74)*
0.06
0.006
0.005
Place of residence (ref. rural)
Urban
0.99 (0.73,1.35) 0.95
Wealth quintile (ref. poorest)
Poorer
Middle
Richer
Richest
1.36 (0.89, 2.06)
2.13 (1.43, 3.18)*
2.76 (1.77, 4.28)*
4.38 (2.83, 6.77)*
0.2
<0.0001
<0.0001
<0.0001
Abbreviations: CI, confidence interval; AOR, adjusted odds ratio; %, percent; ref., reference, *
Significant at p-value =0.05.
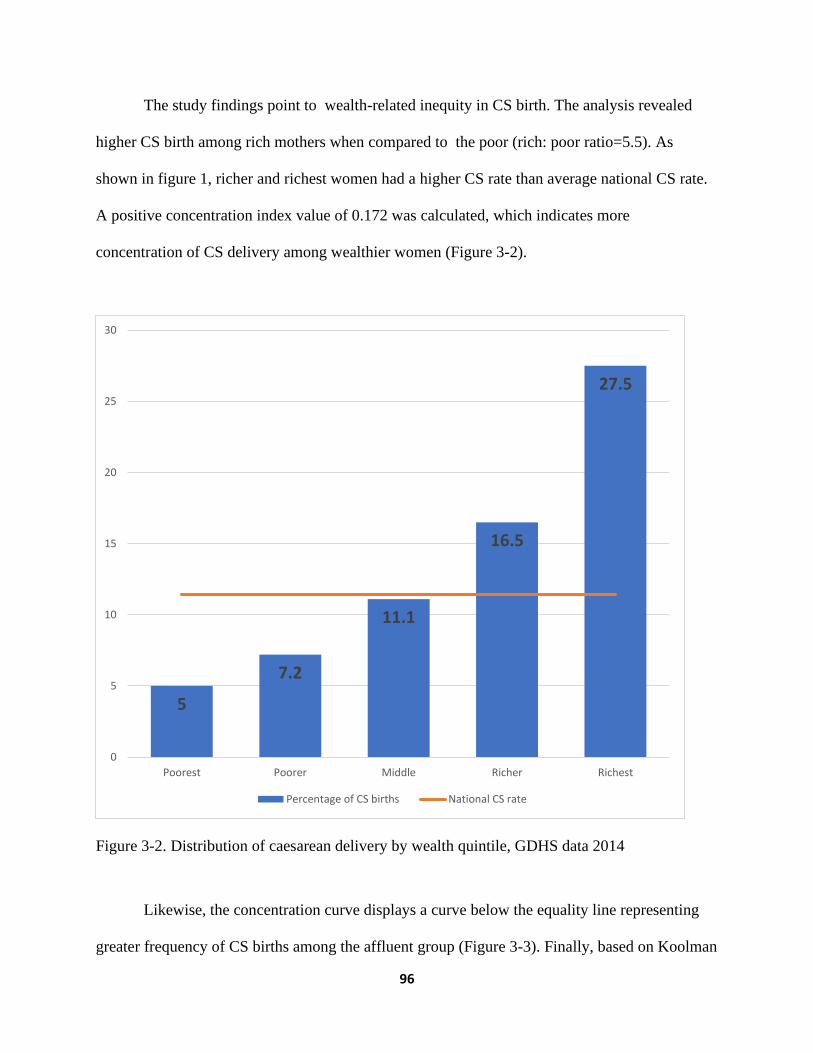
96
The study findings point to wealth-related inequity in CS birth. The analysis revealed
higher CS birth among rich mothers when compared to the poor (rich: poor ratio=5.5). As
shown in figure 1, richer and richest women had a higher CS rate than average national CS rate.
A positive concentration index value of 0.172 was calculated, which indicates more
concentration of CS delivery among wealthier women (Figure 3-2).
Figure 3-2. Distribution of caesarean delivery by wealth quintile, GDHS data 2014
Likewise, the concentration curve displays a curve below the equality line representing
greater frequency of CS births among the affluent group (Figure 3-3). Finally, based on Koolman
5
7.2
11.1
16.5
27.5
0
5
10
15
20
25
30
Poorest Poorer Middle Richer Richest
Percentage of CS births National CS rate

97
and Van Doorslaer’s methodology, 12.9% of CS deliveries should be shifted away from the
richer group to address the unmet CS delivery needs among less privileged women to achieve a
concentration index of zero. The use of the concentration curve and index is only to illustrate the
extent of income-based inequalities in utilization. However, more research is needed to
determine how inequitable this utilization pattern is. The goal is not necessarily to reach a
concentration index of zero. If CS acted as a luxury good in an economic sense, then it would be
expected that richer women would use more of it. More affluent women having higher rates of
CS is not necessarily a problem in terms of equity if these CS surgeries are not paid for using
public money and if poorer women have access to needed CS deliveries.
Figure 3-3. Concentration curve for caesarean delivery, GDHS data 2014
0%
10%
20%
30%
40%
50%
60%
70%
80%
90%
100%
0% 20% 40% 60% 80% 100%
Cu
mm
ula
tive
% o
f C
S d
eliv
ery
Cummulative % of women ranked by wealth quintile
Concentration curve
Equality line
CS delivery
98
3.4. DISCUSSION
In this study, the total CS delivery level of 11. 4% was higher than 6.59% reported in a
similar study in Ghana [30] but falls within the WHO recommended levels of 5-15% [6, 15]. In
addition, the CS delivery prevalence from this study was higher relative to the 7.3% and 3% CS
rate estimated for Africa and West Africa respectively [14].
The study shows strong associations between CS birth and some predictors including
mother’s age, parity, education level, and wealth quintile. In this current study, marital status of
the women was not significantly associated with CS birth, this result is consistent with a similar
study in Ghana [30]. Also, religion was not a significant predictor for CS delivery in this study;
this is in contrast with the results of similar studies in Bangladesh [48] and India [49] that found
a strong association, perhaps due to limited covariables, different cultural and geographical
context. For instance, in the Indian study [49] most of the women were Hindus but in Ghana they
are in the minority religious group. Similar to the findings of this research, a study in Ethiopia
reported that ethnicity of women was not significantly related to CS delivery [22]. Furthermore,
this research found a strong relationship between place of residence and CS birth at univariable
stage, but the effect was not significant in the adjusted model. This finding is consistent with
similar studies elsewhere [49, 50].
Age: The relationship between CS birth and age has been studied extensively in the
literature with considerable mixed findings. A study conducted in Egypt found that younger (30
years and below) women were more likely to have a CS birth [25] whilst other authors observed
higher likelihood for CS delivery among older women [24, 26, 51-53]. The latter finding is
consistent with the results of this study. This result could be explained by natural physiological
and anatomical changes accompanying aging which expose older mothers to an elevated risk of
99
pregnancy and delivery related complications [54-56]. These physical changes coupled with a
higher rate of request for CS delivery by these mothers [54] could be the main reasons for the
higher rate. Also, the older women may perceive caesarean section as a safe delivery option to
protect their fetus after a long period of conception difficulty, and the fear of delivery pains and
losing of baby [57]. Alternatively, perhaps uneasiness and fear associated with CS delivery could
deter particularly younger mothers as reported in similar studies in Nigeria [58] and Tanzania
[59]. Also, young mothers may refuse CS delivery because of the risk of repeated CS births and
the complications associated with more than 3 repeated CS as reported in a study [60].
Moreover, young women probably might prefer vaginal delivery because of perceived immediate
recovery after childbirth as indicated in a study related study [57].
Parity: The association between woman’s parity and the likelihood to have a CS delivery
has been long-established in body literature. Conventionally, mothers with higher birth order are
less likely to have a CS [24, 25, 33]. The results of the current study are consistent with previous
research in this area. First time mothers have a higher likelihood of having a CS delivery [26]
probably due to fear of labor pain [28]. On the other hand, mothers who had given birth before
have a lower likelihood of having a CS delivery until the fifth birth [61]. This lower CS delivery
among multiparous women could be explained by their previous delivery type as well as level of
satisfaction of the obstetric care received. Supporting this possible explanation, a study in
Burkina Faso [62] reported that mothers with a normal delivery experience might reject CS
delivery even when it is medically recommended because of the guilt of not delivering naturally
and the risk of possible future caesarean sections. Also, other studies have found that women
with previous caesarean delivery have a higher likelihood of repeated CS [32, 63].
100
Education: Earlier studies which examined the association between maternal education
level and CS delivery have had mixed findings. Though a study found no statistically significant
association between the likelihood of CS delivery and education level of the mother [25] other
studies have also revealed that education level of mothers was strongly linked to the likelihood
of CS delivery. Moreover, a study conducted with a smaller sample size at northern Ghana
reported lower risk of CS delivery among women with secondary or higher education [64].
Conversely, this study’s findings are consistent with previous studies in Bangladesh[24], Brazil
[53], Thailand [27], Pakistan [26] and China [65] which found that highly educated (secondary
and postsecondary) women were more likely to have a CS delivery than women with no formal
education. This finding could be explained by the enhanced ability of women with secondary and
postsecondary to better access obstetric care due to their autonomy and ability to take decisions
about their health [66] and knowledge about risks and benefits of CS interventions [67]. On the
other hand, women with no or limited education may have limited knowledge [68] and/or
misconceptions about CS which could discourage use [69], and even may not report to health
facilities amidst delivery complication for the CS procedure [70].
Wealth quintile: Research into the relationship between wealth quintile and CS
delivery has been well established in literature. Some studies have reported that the likelihood of
CS delivery increases with better wealth quintile [11, 26, 49, 65, 71-73], the results of this study
is consistent with the overall literature in general and with similar studies such as the study from
Mozambique that reported underuse of CS delivery in less affluent mothers [74] and another
study from Bangladesh that revealed about 2.5 times likelihood of CS delivery among wealthier
women relative to the poorest [24]. This study’s finding of higher likelihood of CS delivery
among richest, richer and middle-class women could be the result of the costs associated with CS
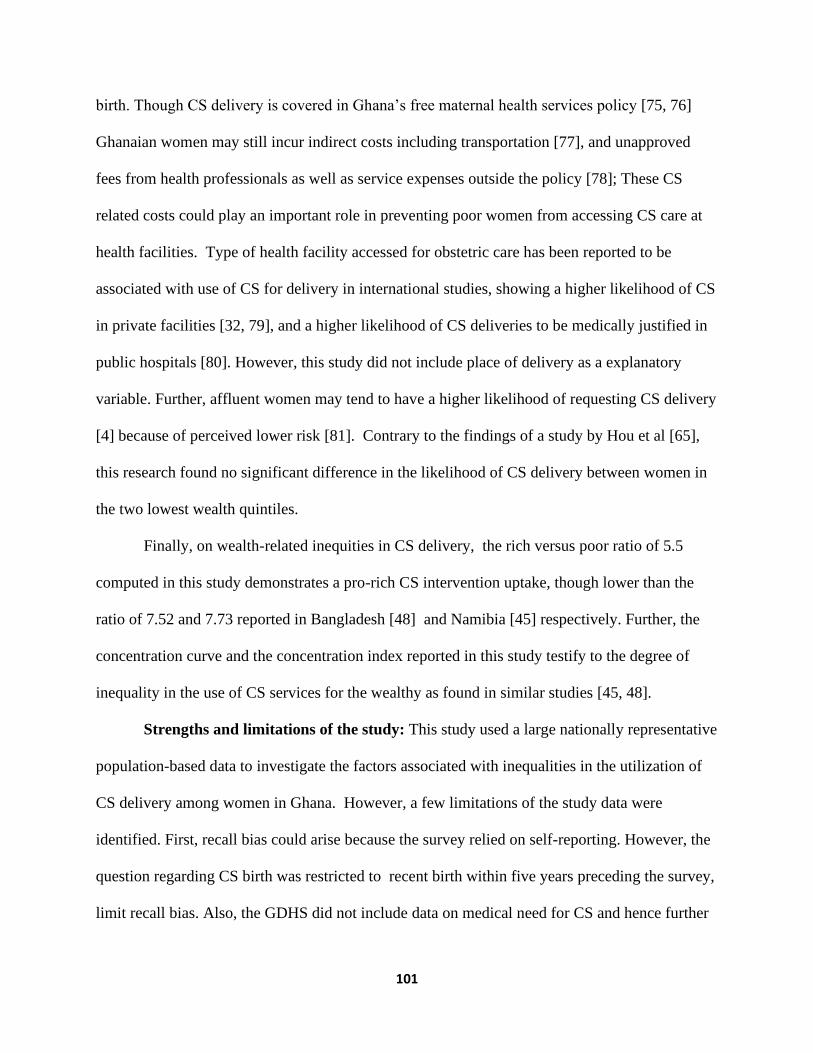
101
birth. Though CS delivery is covered in Ghana’s free maternal health services policy [75, 76]
Ghanaian women may still incur indirect costs including transportation [77], and unapproved
fees from health professionals as well as service expenses outside the policy [78]; These CS
related costs could play an important role in preventing poor women from accessing CS care at
health facilities. Type of health facility accessed for obstetric care has been reported to be
associated with use of CS for delivery in international studies, showing a higher likelihood of CS
in private facilities [32, 79], and a higher likelihood of CS deliveries to be medically justified in
public hospitals [80]. However, this study did not include place of delivery as a explanatory
variable. Further, affluent women may tend to have a higher likelihood of requesting CS delivery
[4] because of perceived lower risk [81]. Contrary to the findings of a study by Hou et al [65],
this research found no significant difference in the likelihood of CS delivery between women in
the two lowest wealth quintiles.
Finally, on wealth-related inequities in CS delivery, the rich versus poor ratio of 5.5
computed in this study demonstrates a pro-rich CS intervention uptake, though lower than the
ratio of 7.52 and 7.73 reported in Bangladesh [48] and Namibia [45] respectively. Further, the
concentration curve and the concentration index reported in this study testify to the degree of
inequality in the use of CS services for the wealthy as found in similar studies [45, 48].
Strengths and limitations of the study: This study used a large nationally representative
population-based data to investigate the factors associated with inequalities in the utilization of
CS delivery among women in Ghana. However, a few limitations of the study data were
identified. First, recall bias could arise because the survey relied on self-reporting. However, the
question regarding CS birth was restricted to recent birth within five years preceding the survey,
limit recall bias. Also, the GDHS did not include data on medical need for CS and hence further

102
population-based studies are required to investigate association between CS delivery and medical
need factors. Finally, as a result of lack of data on type of CS and place of birth, the study could
not distinguish between elective and emergency CS and whether CS delivery occurred at a
public or private facility.
3.5. CONCLUSION
Even though Ghana has achieved a CS prevalence of 11.4%, which is consistent with WHO
recommendations, this study’s finding of large inequalities in the use of CS based on wealth and
education helps provide evidence for policy intervention. The importance of generating evidence
for the presence of socioeconomic inequalities in the use of CS in Ghana is that it directs public
policy to go beyond aggregate level indicators and critically examine caesarean delivery
distribution. Moreover, despite Ghana’s free maternal healthcare interventions, poorer women
had much lower use of CS holding everything else constant which indicates that removing fees
alone may not be sufficient to adequately improve access to CS for poor women. This policy
implication is similar to that proposed by other researchers who have proposed paying utmost
attention to socially disadvantaged women to minimize inequalities in the use of CS delivery.
On the other hand, while, the underuse of CS among poorer and lower educated women raises
serious concerns about access to CS delivery services, the possible medically unjustified overuse
of CS delivery as income and education increases raises a different set of concerns, which
require targeted health policy interventions to ensure medically appropriate use of CS delivery
among richer and more educated women.

103
References
1. Essendi H, Mills S, Fotso J-C: Barriers to formal emergency obstetric care services’
utilization. Journal of Urban Health 2011, 88(2):356-369.
2. WHO U, UNICEF, AMDD: Monitoring emergency obstetric care: a handbook. .
World Health Organization 2009.
3. Gholami A, Salarilak S: Why do some pregnant women prefer cesarean delivery in
first pregnancy? Iranian journal of reproductive medicine 2013, 11(4):301.
4. Aminu M, Utz B, Halim A, Van Den Broek N: Reasons for performing a caesarean
section in public hospitals in rural Bangladesh. BMC pregnancy and childbirth 2014,
14(1):130.
5. Räisänen S, Gissler M, Kramer MR, Heinonen S: Influence of delivery characteristics
and socioeconomic status on giving birth by caesarean section–a cross sectional
study during 2000–2010 in Finland. BMC pregnancy and childbirth 2014, 14(1):120.
6. Gibbons L, Belizán JM, Lauer JA, Betrán AP, Merialdi M, Althabe F: The global
numbers and costs of additionally needed and unnecessary caesarean sections
performed per year: overuse as a barrier to universal coverage. World health report
2010, 30:1-31.
7. Betrán AP, Torloni MR, Zhang J-J, Gülmezoglu A, Section WWGoC, Aleem H, Althabe
F, Bergholt T, de Bernis L, Carroli G: WHO statement on caesarean section rates.
BJOG: An International Journal of Obstetrics & Gynaecology 2016, 123(5):667-670.
8. Boatin AA, Schlotheuber A, Betran AP, Moller A-B, Barros AJ, Boerma T, Torloni MR,
Victora CG, Hosseinpoor AR: Within country inequalities in caesarean section rates:
observational study of 72 low and middle income countries. bmj 2018, 360:k55.

104
9. Khan M. N IMM, Rahman M. M: Inequality in utilization of cesarean delivery in
Bangladesh: a decomposition analysis using nationally representative data. Public
health 2018, 157:111-120.
10. Dumont A, De Bernis L, Bouvier-olle M-H, Bréart G, Group MS: Caesarean section
rate for maternal indication in sub-Saharan Africa: a systematic review. The Lancet
2001, 358(9290):1328-1333.
11. Ronsmans C HS, Stanton C: Socioeconomic differentials in caesarean rates in
developing countries: a retrospective analysis. Lancet 2006, 368(9546):1516–1523.
12. Ye J BA, Guerrero Vela M, Souza JP, Zhang J: Searching for the optimal rate of
medically necessary cesarean delivery. Birth 2014(41):237-244
13. Molina G WT, Lipsitz SR: Relationship between cesarean delivery rate and maternal
and neonatal mortality JAMA 2015, 314:2263-2270.
14. Betrán AP, Merialdi M, Lauer JA, Bing‐Shun W, Thomas J, Van Look P, Wagner M:
Rates of caesarean section: analysis of global, regional and national estimates.
Paediatric and perinatal epidemiology 2007, 21(2):98-113.
15. Althabe F, Belizán JM: Caesarean section: the paradox. The Lancet 2006,
368(9546):1472-1473.
16. Irani M, Deering S: Challenges affecting access to cesarean delivery and strategies to
overcome them in low‐income countries. International Journal of Gynecology &
Obstetrics 2015, 131(1):30-34.
17. Ahmed S, Tunçalp Ö: Burden of obstetric fistula: from measurement to action. The
Lancet Global Health 2015, 3(5):e243-e244.

105
18. WHO: Trends in maternal mortality: 1990-2015: estimates from WHO, UNICEF,
UNFPA, World Bank Group and the United Nations Population Division: executive
summary. In.: World Health Organization; 2015.
19. GSS: Ghana 2010 Population and Housing Census, Mortality Report. Ghana
Statistical Service 2014.
20. GSS G, and ICF Macro: Ghana Demographic and Health Survey 2008. Accra,
Ghana:. Ghana Statistical Service , Ghana Health Service , and ICF Macro 2009.
21. Bragg F, Cromwell DA, Edozien LC, Gurol-Urganci I, Mahmood TA, Templeton A, van
der Meulen JH: Variation in rates of caesarean section among English NHS trusts
after accounting for maternal and clinical risk: cross sectional study. Bmj 2010,
341:c5065.
22. Kahsay S BG, Gebremariam A, Betel Birhane B: Determinants of caesarean deliveries
and its major indications in Adigrat hospital, northern Ethiopia: a case control
study. Epidemiology (sunnyvale) 2015(5):192.
23. Bayou YT, Mashalla YJ, Thupayagale-Tshweneagae G: Patterns of caesarean-section
delivery in Addis Ababa, Ethiopia. African journal of primary health care & family
medicine 2016, 8(2):1-6.
24. Begum T, Rahman A, Nababan H, Hoque DME, Khan AF, Ali T, Anwar I: Indications
and determinants of caesarean section delivery: Evidence from a population-based
study in Matlab, Bangladesh. PloS one 2017, 12(11):e0188074.
25. Yassin K SG: Levels and Determinants of Caesarean Deliveries in Egypt: Pathways
to Rationalization. The Internet Journal of World Health and Societal Politics 2012,
7(2).

106
26. S N: Determinants of Cesarean Deliveries in Pakistan. Pakistan Institute of
Development Economics 2015.
27. Rachatapantanakorn O TP: Demographic Determinants for Cesarean Delivery in
Pattani Hospital Southeast Asian Journal of Tropical Medicine and Public Health 2009,
40(3):602–611.
28. Danso K, Schwandt H, Turpin C, Seffah J, Samba A, Hindin M: Preference of
Ghanaian women for vaginal or caesarean delivery postpartum. Ghana medical
journal 2009, 43(1):29.
29. Prah J KA, Afrifa A, Abdulai M, Sirikyi I, Abu E: Caesarean section in a primary
health facility in Ghana: Clinical indications and feto-maternal outcomes. Journal of
public health in Africa 2017, 8(2).
30. Manyeh AK AA, Akpakli DE, Williams J, Gyapong M: Socioeconomic and
demographic factors associated with caesarean section delivery in Southern Ghana:
evidence from INDEPTH Network member site. BMC pregnancy and childbirth 2018,
18(1):405.
31. Cavallaro FL, Cresswell JA, França GV, Victora CG, Barros AJ, Ronsmans C: Trends in
caesarean delivery by country and wealth quintile: cross-sectional surveys in
southern Asia and sub-Saharan Africa. Bulletin of the World Health Organization
2013, 91:914-922D.
32. Rahman M, Shariff AA, Shafie A, Saaid R, Tahir RM: Caesarean delivery and its
correlates in Northern Region of Bangladesh: application of logistic regression and
cox proportional hazard model. Journal of Health, Population and Nutrition 2015,
33(1):8.

107
33. Solanke BL: Individual and community factors associated with indications of
caesarean delivery in Southern Nigeria: Pooled analyses of 2003–2013 Nigeria
demographic and health surveys. Health care for women international 2018,
39(6):697-716.
34. GSS: Ghana Demographic and Health Survey 2014. In.: Ghana Statistical Service
(GSS), Ghana Health Service (GHS), and ICF International; 2015.
35. Dankwah E, Zeng W, Feng C, Kirychuk S, Farag M: The social determinants of health
facility delivery in Ghana. Reproductive health 2019, 16(1):101.
36. Vyas S KL: Constructing socio-economic status indices: how to use principal
components analysis Health Policy Plan 2006, 21:459-468.
37. Bursac Z, Gauss CH, Williams DK, Hosmer DW: Purposeful selection of variables in
logistic regression. Source code for biology and medicine 2008, 3(1):17.
38. Hosmer DW LS: Applied logistic regression New York: Wiley; 2000.
39. Johnston R, Jones K, Manley D: Confounding and collinearity in regression analysis:
a cautionary tale and an alternative procedure, illustrated by studies of British
voting behaviour. Quality & quantity 2018, 52(4):1957-1976.
40. Akaike H: A new look at the statistical model identification. In: Selected Papers of
Hirotugu Akaike. edn.: Springer; 1974: 215-222.
41. Hilbe JM: Logistic regression models, 1st edition edn: CRC press; 2009.
42. Long JS, Freese J: Regression models for categorical dependent variables using
Stata, 2nd edition edn: Stata press; 2006.
43. Bobo FT, Yesuf EA, Woldie M: Inequities in utilization of reproductive and maternal
health services in Ethiopia. International journal for equity in health 2017, 16(1):105.

108
44. O'Donnell O VDE, Wagstaff A, Lindelow M: Analyzing health equity using household
survey data: a guide to techniques and their implementation. The World Bank 2007.
45. Zere E TP, Walker O, Kirigia J, Mwikisa C, Mbeeli T: Inequities in utilization of
maternal health interventions in Namibia: implications for progress towards MDG
5 targets. Int J Equity Health 2010(9):16.
46. Barros AJ, Victora CG: Measuring coverage in MNCH: determining and interpreting
inequalities in coverage of maternal, newborn, and child health interventions. PLoS
medicine 2013, 10(5):e1001390.
47. Koolman X VDE: On the interpretation of a concentration index of inequality
Health Economics 2004(13):649-656.
48. Anwar I SM, Akhtar N, Chowdhury ME, Salma U, Rahman M, Koblinsky M.: Inequity
in maternal health-care services: evidence from home-based skilled-birth-attendant
programmes in Bangladesh. Bulletin of the World Health Organization 2008, 86:252-
259.
49. Ghosh S: Increasing trend in caesarean section delivery in India: Role of
medicalisation of maternal health: Institute for Social and Economic Change
Bangalore; 2010.
50. Saoji A, Nayse J, Deoke A, Mitra A: Maternal risk factors of caesarean delivery in a
tertiary care hospital in Central India: A case control study. People’s Journal of
Scientific Research 2016, 9(2):18-23.
51. Rebelo F DRC, Cortes TR, Dutra CL, Kac G High cesarean prevalence in a national
population- based study in Brazil: the role of private practice Acta obstetricia et
gynecologica Scandinavica 2010, 89(7):903-908.

109
52. Sakae TM FP, d'Orsi E: Factors associated with cesarean section rates in a university
hospital Revista de saude publica 2009, 43(3):472-480.
53. Freitas PF, Drachler MdL, Leite JCdC, Marshall T: Inequalities in cesarean delivery
rates by ethnicity and hospital accessibility in Brazil. International Journal of
Gynecology & Obstetrics 2009, 107(3):198-201.
54. Ecker JL, Chen KT, Cohen AP, Riley LE, Lieberman ES: Increased risk of cesarean
delivery with advancing maternal age: indications and associated factors in
nulliparous women. American journal of obstetrics and gynecology 2001, 185(4):883-
887.
55. Luke B BM: Elevated risks of pregnancy complications and adverse outcomes with
increasing maternal age. Human reproduction 2007, 22(5):1264-1272.
56. Zgheib SM KM, Kostev K: Prevalence of and risk factors associated with cesarean
section in Lebanon - A retrospective study based on a sample of 29,270 women.
Women Birth 2017, 30(6):e265 –e271.
57. Yilmaz SD, Bal MD, Beji NK, Uludag S: Women’s preferences of method of delivery
and influencing factors. Iranian Red Crescent Medical Journal 2013, 15(8):683.
58. Ugwu NU, de Kok B: Socio-cultural factors, gender roles and religious ideologies
contributing to Caesarian-section refusal in Nigeria. Reproductive health 2015,
12(1):70.
59. Litorp H, Mgaya A, Kidanto HL, Johnsdotter S, Essén B: ‘What about the
mother?’Women׳ s and caregivers׳ perspectives on caesarean birth in a low-
resource setting with rising caesarean section rates. Midwifery 2015, 31(7):713-720.

110
60. Hyginus E, Eric N-I, Lawrence I, Sylvester N: Morbidity and mortality following high
order caesarean section in a developing country. J Pak Med Assoc 2012, 62(10):1016-
1019.
61. Mgaya AH MS, Kidanto HL, Mgaya HN: Grand multiparity: is it still a risk in
pregnancy?. . BMC pregnancy and childbirth 2013, 13(1):241.
62. Richard F, Zongo S, Ouattara F: Fear, guilt, and debt: an exploration of women’s
experience and perception of cesarean birth in Burkina Faso, West Africa.
International journal of women's health 2014, 6:469.
63. Faisal-Cury A, Menezes PR: Factors associated with preference for cesarean delivery.
Revista de saude publica 2006, 40(2):226-232.
64. Apanga PA, Awoonor-Williams JK: Predictors of caesarean section in Northern
Ghana: a case-control study. Pan African Medical Journal 2018, 29(1):1-11.
65. Hou X. RNS, Iunes R: Factors associated with high Cesarean deliveries in China and
Brazil-A Call for reducing elective surgeries in moving towards Universal Health
Coverage. Journal of Hospital Administration 2014, 3:67.
66. Kamal S: Childbearing and the use of contraceptive methods among married
adolescents in Bangladesh. EUROPEAN JOURNAL OF CONTRACEPTION AND
REPRODUCTIVE HEALTH CARE 2012, 17(2):144-154.
67. Mungrue K, Nixon C, David Y, Dookwah D, Durga S, Greene K, Mohammed H:
Trinidadian women’s knowledge, perceptions, and preferences regarding cesarean
section: How do they make choices? International journal of women's health 2010,
2:387.
111
68. Dursun P, Yanik FB, Zeyneloglu HB, Baser E, Kuscu E, Ayhan A: Why women request
cesarean section without medical indication? The Journal of Maternal-Fetal &
Neonatal Medicine 2011, 24(9):1133-1137.
69. Owonikoko K, Akinola S, Adeniji O, Bankole A: Women’s perception and experience
of caesarean delivery in Ogbomoso, southwest Nigeria. Journal of Pregnancy and
Child Health 2015, 2(3):1-6.
70. Khan R BLS, Sultana M, Bilkis S, KoblinskyM: An examination of women
experiencing obstetric complications requiring emergency care: perceptions and
sociocultural consequences of caesarean sections in Bangladesh Journal of Health,
Population and Nutrition 2012: 159-171.
71. SM K: Preference for institutional delivery and caesarean sections in Bangladesh
Journal of health, population, and nutrition 2013, 31(1):96.
72. Leone T PS, Matthews Z: Community factors affecting rising caesarean section rates
in developing countries: an analysis of six countries. Social science & medicine 2008,
67(8):1236-1246.
73. Feng XL, Xu L, Guo Y, Ronsmans C: Factors influencing rising caesarean section
rates in China between 1988 and 2008. Bulletin of the World Health Organization
2012, 90:30-39A.
74. Long Q KT, Madede T, Klemetti R, Hemminki E: Caesarean section rates in
Mozambique. BMC pregnancy and childbirth 2015, 15(1):253.
75. Asante FA, Chikwama C, Daniels A, Armar-Klemesu M: Evaluating the economic
outcomes of the policy of fee exemption for maternal delivery care in Ghana. Ghana
medical journal 2007, 41(3).

112
76. Witter S AK, Kusi A, Zakariah-Akoto S: The experiences of Ghana in implementing a
user fee exemption policy to provide free delivery care. Reprod Health Matter 2007,
15(30):61–71.
77. Ravit M PA, Tourigny C, Traore M, Coulibaly A, Dumont A, Fournier P: The Hidden
costs of a free caesarean section policy in West Africa (Kayes Region, Mali) Maternal
and child health journal 2015, 19(8):1734-1743.
78. Lange IL KL, Goufodji S, Ronsmans C, Filippi V: The costs of ‘free’: Experiences of
facility-based childbirth after Benin's caesarean section exemption policy. Social
science & medicine 2016, 168:53-62.
79. Khawaja M, Jurdi R, Kabakian‐Khasholian T: Rising trends in cesarean section rates
in Egypt. Birth 2004, 31(1):12-16.
80. Faisal-Cury A, Menezes PR, Quayle J, Santiago K, Matijasevich A: The relationship
between indicators of socioeconomic status and cesarean section in public hospitals.
Revista de saude publica 2017, 51:14.
81. Jisun T. F KMR: A Comparative Study on the Preference for Delivery Process in
Bangladesh. ABC Journal Of Advanced Research 2014, 3: 24-28.

113
Chapter 4 builds on chapter 2 and chapter 3 by quantifying the proportion of obstetric care
services utilization in the study population attributable to certain socio-demographic factors.
Unlike past studies that used the classical methodological techniques, chapter 4 fitted a
Generalised estimating equation (GEE) on the 2014 GDHS data to generate parameters for the
computation of population attributable risk of women’s sociodemographic factors on PNC
services use.
Chapter 4 has been submitted to the Journal of Biosocial Science “Dankwah, E., Feng, C.,
Lepnurm, R., Kirychuk, S., Zeng, W., & Farag, M. (2020). Sociodemographic correlates of
postnatal care services utilization among Ghanaian mothers: a population attributable risk
approach. Journal of Biosocial Science, JBS-5102” (Impact Factor (2019) – 1.207). In this
chapter, I conceptualized, reviewed the literature, cleaned and analysed the data, and also did the
interpretation of the findings and the write up of chapter 4.

114
Chapter 4. Sociodemographic correlates of postnatal care services utilization among
Ghanaian mothers: a population attributable risk approach
4.1. INTRODUCTION
Pregnancy related medical complications that result in morbidities and loss of life of
mothers and babies have received global attention [1, 2]. Yet, these complications still occur
during antepartum (prenatal), intrapartum (childbirth) and postpartum (postnatal) periods,
especially in developing countries [1, 2]. Of the three phases of reproductive life, it appears that
the majority of the life-threatening conditions and deaths occur post-delivery [3-5]. It has been
reported that approximately 40% of newborn mortality and half of maternal deaths happen
within a day after birthing [6]. There vast discrepancies in maternal and child health across
continents and even within countries. On newborn mortalities, every year approximately 3
million deaths occur in low-income nations [7]. The African region persistently suffers the
highest maternal mortality ratios contributing 57 percent of all pregnancy-related deaths globally
translating into a maternal death of 1 in 39 [8]. These deaths occur as a result of short as well as
prolonged sickness and disability including postpartum conditions [9].
Globally, there is a concerted effort to promote the use of obstetric services because they
are associated with dramatic reductions in maternal and newborn deaths [10, 11]. Improving
obstetric services utilization rates in developing countries [12-14] is critical towards achieving
the world health organization’s (WHO) sustainable development goals (SDGs) on maternal and
child morbidity as well as mortality [15]. Therefore, it is important to understand the disparities
in the usage of obstetric care services including postnatal care (PNC) services to provide more
targeted policy approaches. Observational studies can generate relevant evidence to tackle this

115
underutilization of PNC services, but findings from previous studies [12, 13, 16-19] about the
association between sociodemographic factors and the use of PNC services remains uncertain.
According to Ganle et al [20], Ghana has PNC services utilization coverage of 76%. In
Ghana discrepancies in the use of PNC services have been observed [21], but past studies that
examined the association between PNC services use and sociodemographic factors in Ghana
have documented conflicting conclusions [22, 23]. However, these studies may differ in their
findings due to methodological issues including: the use of different definitions for PNC
services utilization; hospital-based designs limiting the drawing of inference to the entire
population; limited geographical scope; small sample sizes; and deficient control of confounding.
Most importantly, none of the studies in Ghana computed the population attributable risk (PAR)
of sociodemographic characteristics associated with the usage of PNC services. Using a PAR
quantifies the proportion of PNC services utilization attributable to sociodemographic risk
factors in the study population and will be important to guide policymaking.
This study aims to estimate the PAR of sociodemographic factors to determine their
attributable impact on the uptake of PNC services.
4.2. METHODS
4.2.1. Study data
De-identified secondary data from the 2014 Ghana Demographic and Health Survey
(GDHS) was used in this study. Ghana Statistical Service, Inner City Fund (ICF) International
and Ghana Health Services conducted the 2014 GDHS [21]. The GDHS enrolled respondents
based on two-levels: (1) 427 clusters (hereinafter communities) (2) 12,831 households. Overall,

116
9396 women aged between 15 to 49 years with episode of childbirths in the past five years were
selected from the households and interviewed using a pretested questionnaire. The response rate
for the survey was 97 percent. The respondents answered questions on socio-demographic and
reproductive health issues, [21].
4.2.2. Study variables
Outcome variables: The outcome of interest in this study was the use of PNC services.
From the 2014 GDHS, women that were checked by skilled professionals after delivery within
41 days postdelivery were classified as using PNC services whilst those who did not receive
post-delivery checkup within 41 days after live birth were considered non-users of PNC services
in this study. The dependent variable used for analyses in this study was measured as a binary
variable.
Independent variables: Sociodemographic factors that were considered in this study
were chosen based on Andersen’s behavioral model [24, 25]. The study sociodemographic
characteristics were predisposing characteristics (women’s age, marital status, religion, ethnicity,
educational level) and enabling factors (wealth status, employment status, place of residence) .
Region of residence which is represented by the ethnic groups in Ghana was not examined in this
research.
The predisposing variable, age was examined as a continuous predictor because the
linearity assumption was met when a quadratic term was tested (p-value=0.41). The rest of the
independent variables were analyzed as categorical variables as reported in similar studies [26,
27].
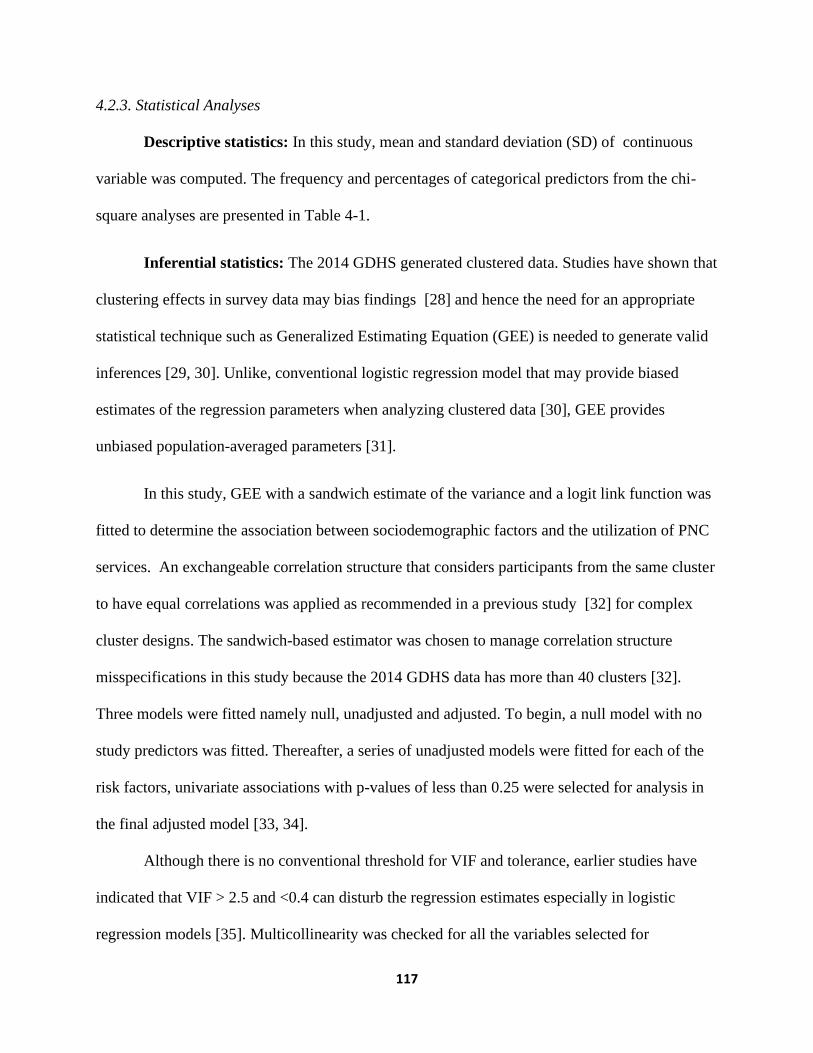
117
4.2.3. Statistical Analyses
Descriptive statistics: In this study, mean and standard deviation (SD) of continuous
variable was computed. The frequency and percentages of categorical predictors from the chi-
square analyses are presented in Table 4-1.
Inferential statistics: The 2014 GDHS generated clustered data. Studies have shown that
clustering effects in survey data may bias findings [28] and hence the need for an appropriate
statistical technique such as Generalized Estimating Equation (GEE) is needed to generate valid
inferences [29, 30]. Unlike, conventional logistic regression model that may provide biased
estimates of the regression parameters when analyzing clustered data [30], GEE provides
unbiased population-averaged parameters [31].
In this study, GEE with a sandwich estimate of the variance and a logit link function was
fitted to determine the association between sociodemographic factors and the utilization of PNC
services. An exchangeable correlation structure that considers participants from the same cluster
to have equal correlations was applied as recommended in a previous study [32] for complex
cluster designs. The sandwich-based estimator was chosen to manage correlation structure
misspecifications in this study because the 2014 GDHS data has more than 40 clusters [32].
Three models were fitted namely null, unadjusted and adjusted. To begin, a null model with no
study predictors was fitted. Thereafter, a series of unadjusted models were fitted for each of the
risk factors, univariate associations with p-values of less than 0.25 were selected for analysis in
the final adjusted model [33, 34].
Although there is no conventional threshold for VIF and tolerance, earlier studies have
indicated that VIF > 2.5 and <0.4 can disturb the regression estimates especially in logistic
regression models [35]. Multicollinearity was checked for all the variables selected for
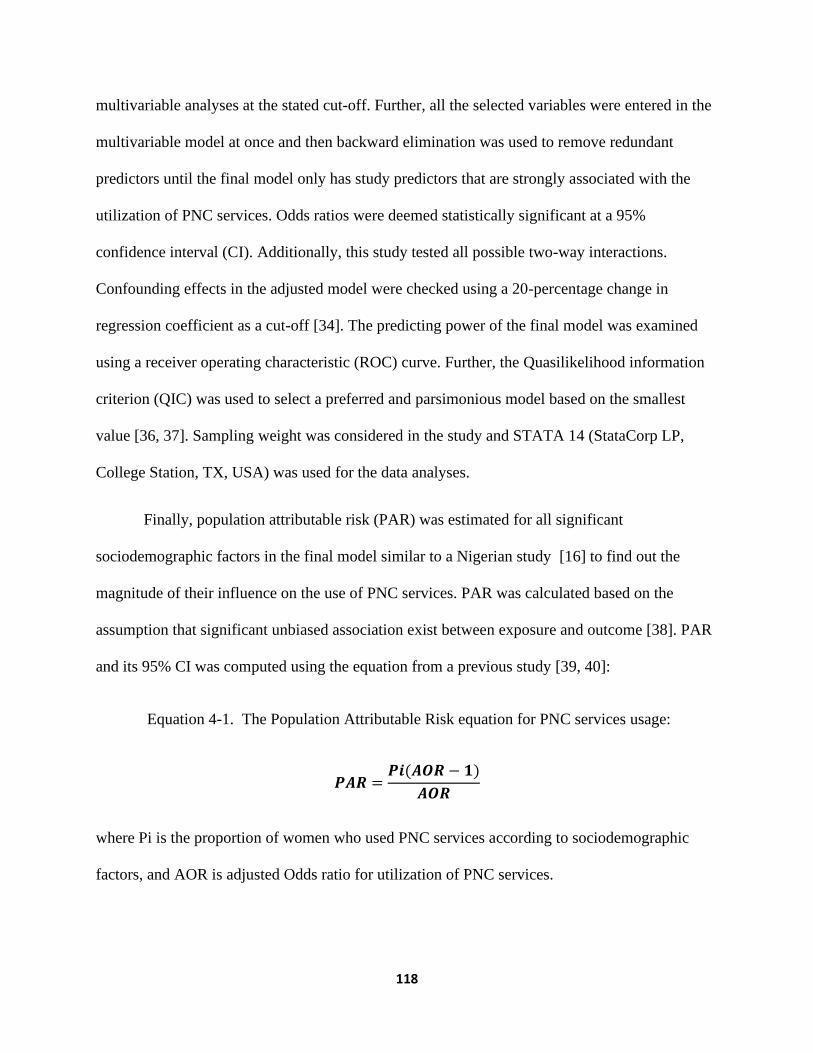
118
multivariable analyses at the stated cut-off. Further, all the selected variables were entered in the
multivariable model at once and then backward elimination was used to remove redundant
predictors until the final model only has study predictors that are strongly associated with the
utilization of PNC services. Odds ratios were deemed statistically significant at a 95%
confidence interval (CI). Additionally, this study tested all possible two-way interactions.
Confounding effects in the adjusted model were checked using a 20-percentage change in
regression coefficient as a cut-off [34]. The predicting power of the final model was examined
using a receiver operating characteristic (ROC) curve. Further, the Quasilikelihood information
criterion (QIC) was used to select a preferred and parsimonious model based on the smallest
value [36, 37]. Sampling weight was considered in the study and STATA 14 (StataCorp LP,
College Station, TX, USA) was used for the data analyses.
Finally, population attributable risk (PAR) was estimated for all significant
sociodemographic factors in the final model similar to a Nigerian study [16] to find out the
magnitude of their influence on the use of PNC services. PAR was calculated based on the
assumption that significant unbiased association exist between exposure and outcome [38]. PAR
and its 95% CI was computed using the equation from a previous study [39, 40]:
Equation 4-1. The Population Attributable Risk equation for PNC services usage:
𝑷𝑨𝑹 =𝑷𝒊(𝑨𝑶𝑹 − 𝟏)
𝑨𝑶𝑹
where Pi is the proportion of women who used PNC services according to sociodemographic
factors, and AOR is adjusted Odds ratio for utilization of PNC services.

119
4.3. RESULTS
4.3.1. Descriptive statistics
A total of 4292 women were studied in this research. The study found that about 8 in 10
(84 percent) women used PNC services.
As shown in Table 4-1, the average age of women in this present study was 30.9
(SD=7.33) years. Close to half (46.7%) of the women had at least secondary education. Women
without formal education used PNC services (74.1%) less than women with secondary or higher
education (91.2%). The majority (52.2%) of the women were considered poor and of these, 76%
used PNC services while rich women had the highest utilization rate of PNC services, at 95.2%.
With respect to place of residence, 58.6% of the women resided in rural areas. Among urban
dwellers, 92.0% used PNC services whereas 78.4% of rural residents utilized PNC services.
Single women had the highest (87.3%) use of PNC services, though most (65.2%) of the women
in the study were married. Among women who were not working, 85.8% received PNC
services. Concerning religion, traditional or other believers represented the smallest group
(7.5%) and they had lower PNC services utilization rate when compared to Muslims and
Christians (Table 4-1). Women who had more than two birthing experiences were the majority
(58.7%) and 81.1% of them used PNC services. Akan and northern tribe women constituted
about 80 percent of the study respondents (Table 4-1).
4.3.2. Inferential statistics
Univariate model: Table 4-1 presents the study analyses results of the unadjusted
associations between sociodemographic factors and the utilization of PNC services. Women’s

120
age, education, wealth status, place of residence, religion, parity, and ethnicity all had p-values of
less than 0.25 in the univariable model and were subsequently retained in the multivariable
analyses.
Table 4-1. Distribution of PNC services utilization across sociodemographic factors (N=4,292),
and Unadjusted odds ratio (UOR) and 95% confidence interval (CI) for socio-demographic
factors of utilization of PNC services in the unadjusted GEE model, Ghana, 2014.
Study Predictors Overall
N (%)
Used postnatal care
N (%)
UOR (95% CI) P-value
Age (Mean ± SD) 30.9 ± 7.33 30.6 ± 7.03 0.98 (0.96, 1.00) 0.1*
Educational attainment
No education
Primary
Secondary/Higher
1,418 (33.0)
869 (20.3)
2,005 (46.7)
1,051(74.1)
725 (83.4)
1,829 (91.2)
Reference
1.11 (0.84, 1.48)
2.12 (1.40, 3.20)
<0.0002*
Wealth status
Poor
Middle
Rich
2,241 (52.2)
811 (18.9)
1,240 (28.9)
1,703 (76.0)
751 (89.0)
1,180 (95.2)
Reference
2.01 (1.54, 2.61)
4.74 (2.87, 7.86)
<0.0001*
Place of residence
Urban
Rural
1777 (41.4)
2515 (58.6)
1,634 (92.0)
1,971(78.4)
3.06 (2.15, 4.35)
Reference
<0.0001*
Marital status
Cohabitating
Widow/divorced/separated
Married
Single
830 (19.3)
300 (7.0)
2,799 (65.2)
363 (8.5)
672 (81.0)
254 (84.7)
2,362 (84.4)
317 (87.3)
1.00 (0.65, 1.51)
1.07 (0.67, 1.71)
1.19 (0.85, 1.67)
Reference
0.5
Employment statusᶲ
Working
Not working
3,403 (79.3)
886 (20.7)
2,842 (83.5)
760 (85.8)
0.93 (0.72, 1.20)
Reference
0.6
Religion

121
Muslim
Christians
Traditional/other
922 (21.5)
3,046 (71.0)
324 (7.5)
801(86.9)
2,621(86.0)
183 (56.5)
2.09 (1.35, 3.22)
2.51 (1.54, 4.08)
Reference
0.0008*
Parity
One birth
Two births
Three or more births
935 (21.8)
838 (19.5)
2,519 (58.7)
826 (88.3)
737 (88.0)
2,042 (81.1)
1.36 (1.07, 1.73)
1.22 (0.94, 1.58)
Reference
0.02*
Ethnicityᶺ
Akan
Northern tribes
Ga
Other
Ewe
1,642 (38.3)
1,795 (41.8)
198 (4.6)
180 (4.2)
476 (11.1)
1,473 (89.7)
1,411 (78.6)
179 (90.4)
150 (83.3)
391 (82.1)
1.96 (1.20, 3.21)
1.31 (0.82, 2.09)
3.29 (1.67, 6.47)
1.18 (0.66, 2.10)
Reference
0.002*
N, number of observations; SD, standard deviation; %, percent; ᶲN= 4289 and ᶺN=4291 , due to missing values; CI,
confidence interval; UOR, Unadjusted odds ratio; *, p-value <0.25.
Multivariable model: Multicollinearity tests were conducted on all the independent
variables that were selected for the adjusted model. The mean VIF value of 1.49 suggests low
collinearity. All the study predictors had VIF less than 2.5. and tolerances above 0.40, a cut-off
for models that are weak, and so adjustments for collinearity was not necessary.
Also, the area under the ROC of 0.73 (95%CI: 0.71-0.75) for the final model was
moderately high indicating the model was a good binary classifier for the use of PNC services.
In the multivariable GEE model, no significant two-way interaction terms or confounding
effects were identified. The final adjusted model had the smallest QIC (3451.3) relative to the
null model (QIC=3797.9) and hence was selected as the best and most parsimonious model.
From the multivariable model, strong associations were found between the use of PNC services
and the study variables: wealth status, education, place of residence, religion, and ethnicity.

122
However, women’s age and marital status were not significantly associated with the use of PNC
services. The analysis revealed that middle-class and rich women were 1.65 (95%CI: 1.23-2.20)
and 3.22 (95%CI: 1.99-5.20) times respectively more likely to receive PNC services when
compared to poor women. Although no significant difference in the use of PNC services was
found between primary educated women and those without formal education (p-value= 0.3),
odds of receiving PNC services among women who had secondary or higher education were1.52
(95%CI:1.09-2.11) times more than women with no education. Also, urban dwellers had a higher
propensity of using PNC services relative to rural dwellers (AOR=1.48, 95%CI: 1.02-2.15).
Concerning religion, the likelihood of using PNC services was greater among Muslims (AOR=
2.26, 95%CI:1.53-3.34) and Christians (AOR=2.21, 95%CI:1.52-3.22) when compared to
traditional or other believers. Lastly, Akan (AOR=1.79, 95%CI: 1.13-2.83) and Ga women
(AOR=2.80, 95%CI: 1.31- 5.97) had a higher likelihood of using PNC services than Ewe women
while PNC services usage among northern tribes (p-value= 0.1) and other ethnic groups (p-
value=0.8) were not significantly different from the Ewes.
Population Attributable Risk: As displayed in Table 4-2, the PAR calculated for
significant study predictors showed that 17% (95%CI:16.0-19.0) of the PNC services utilization
in the study population was attributable to secondary or higher education. Regarding wealth, 8%
(95%CI: 6.0-10.0) and 23% (95%CI: 22.0-24.0) of the utilization of PNC services in the study
population were attributable to middle and rich wealth status respectively. Moreover, in the study
population, 15% (95%CI: 14.0-16.0) of PNC services uptake was attributed to dwelling in urban
areas whereas 40% (95%CI: 39.0-41.0) and 12% (95%CI: 11.0-13.0) of the PNC services
utilization in the study population was attributable to being a Christian and a Muslim
respectively. Finally, an estimated 18% (95%CI: 17.0-19.0) and 14% (95%CI: 13.0-15.0) of

123
PNC service utilization in the study population was attributed to being an Akan and a member of
the northern tribes respectively.
Table 4-2. Adjusted odds ratio (AOR) and PAR with 95% confidence interval (CI) and p-value
for sociodemographic factors of utilization of PNC services in the multivariable GEE model,
Ghana, 2014
Predictors AOR (95%CI) P-value PAR (95%CI) % PAR (95%CI)
Age (years) 0.99 (0.97, 1.02) 0.6 -
Educational attainment
No education
Primary
Secondary/Higher
Reference
1.03 (0.79, 1.33)
1.52 (1.09, 2.11)**
0.9
0.01
-
0.17 (0.16, 0.19)
-
-
17.0 (16.0, 19.0)
Wealth status
Poor
Middle
Rich
Reference
1.65 (1.23, 2.20)**
3.22 (1.99, 5.20)**
0.001
<0.0001
0.08 (0.06, 0.10)
0.23 (0.22, 0.24)
-
8.0 (6.0, 10.0)
23.0 (22.0, 24.0)
Place of residence
Urban
Rural
1.48 (1.02, 2.15)**
Reference
0.04 0.15 (0.14, 0.16)
15.0 (14.0, 16.0)
-
Religion
Muslim
Christians
Traditional/other
2.26 (1.53, 3.34)**
2.21 (1.52, 3.22)**
Reference
<0.0001
<0.0001
0.12 (0.11, 0.13)
0.40 (0.39, 0.41)
12.0 (11.0, 13.0)
40.0 (39.0, 41.0)
-
Parity
One birth
Two births
Three or more births
1.10 (0.86, 1.40)
1.04 (0.79, 1.36)
Reference
0.4
0.8
-
-
-
Ethnicity
Akan
Northern tribes
Ga
1.79 (1.13, 2.83)**
1.58 (0.84, 2.97)
2.80 (1.31, 5.97)**
0.01
0.2
0.008
0.18 (0.17, 0.19)
-
0.03 (0.02, 0.04)
18.0 (17.0,19.0)
-
3.0 (2.0, 4.0)

124
Other
Ewe
1.26 (0.63, 2.53)
Reference
0.5 -
-
-
CI, confidence interval; AOR, Adjusted odds ratio; PAR, Population Attributable Risk; Ref, Reference; %, percent;
** Significant at p-value = 0.05; GDHS data 2014
4.4. DISCUSSION
This study reported higher (84%) uptake of PNC services compared to past studies in
Ghana that reported uptake of 76% [20] and 43.8 percent [41]. These studies did not use recent
GDHS data leading to disparities in the prevalence of PNC services usage [20, 41]. For example,
a study [41] utilized 2003 GDHS data for their investigation.
Previous studies have found an insignificant association between use of PNC services
and maternal age [16, 23], marital status [16, 18], employment status [23, 42] and parity [12]
similar to this study. Besides, using a GEE model with a sandwich-based estimator of variance,
this study estimated independently the significant impact of education, wealth status, place of
residence, religion, and parity on the use of PNC services.
Furthermore, the link between maternal education and utilization of PNC services has
been extensively studied [12, 16, 17]. The significant effect of women’s education identified in
this study is consistent with results reported by earlier research [12, 16, 17]. This finding can be
explained by the observation that early health education intervention given after delivery tends to
improve the use of PNC services [43, 44] but more educated women may benefit more from
health education than uneducated women [18]. Also, women with advanced education may be
knowledgeably informed about the availability of obstetric services as well as birth-related
complications which could stimulate uptake of PNC services when necessary [5, 12, 45, 46].
Finally, well-educated women are likely to be familiar enough with technology [47], to navigate

125
through electronic media for maternal health messages [16] and the health information gained
could make women confident and autonomous in seeking PNC services [12, 17, 48].
Additionally, the results from this research revealed that a substantial proportion of
utilization of PNC services in the study population was attributed to women’s wealth status
which concurs with earlier studies [5, 16, 19]. Compared to the poor women, rich and middle-
class women had increased likelihood of receiving PNC services and this may be because
wealthier women can afford the expenses associated with seeking PNC services in spite of the
free maternal health policy in Ghana as stated in an analogous study [49]. Other studies have
supported the assertion that affluent women have abundant resources to enable them to allocate a
substantial amount towards healthcare charges including PNC services [19, 50]. Also, financial
hardship among poor women could restrict their access to information on obstetric services
benefits and availability through the different media channels due to the inability to procure
electronics such as radio, television, and computers [5, 51, 52]. Moreover, extra costs such as
travel costs for PNC visit [51], informal tariffs at health institutions [53] may deter less
privileged women from receiving PNC services.
The influence of place of residence on the utilization of PNC services has been well documented
in other developing countries [43, 54, 55]. The PAR of residence derived in this research is
comparable to a similar study[16], and the usage of PNC services was greater in urban relative
to rural women, as observed in similar studies [54-57] This urban privilege could possibly be
explained by the disproportionate distribution of health facilities being concentrated in urban
settings and hence easier access to obstetric services in urban communities [58]. Due to the
skewed distribution of health facilities, women in rural areas may have problems with distance to
a health facility and longer travel time that could affect maternal health-seeking behavior [59,

126
60]. Reliable transport has also been found to improve the utilization of PNC services [19, 51].
This finding may be relevant to this present study because most rural areas in Ghana have poor
transportation systems that make it difficult for mothers to travel long distances to a health
facility to receive PNC services [61]. Also, health facilities in rural areas are generally limited by
poor infrastructure and a shortage of qualified staff to provide quality obstetric services. The
inadequacies of health facilities in rural areas may be a consequence of poor living conditions in
rural communities which can serve as barriers to recruit trained health professionals [62, 63].
Perhaps, concerns about the quality of obstetric care services in rural areas may also deter
women from seeking maternal care there [51, 64-66]. Moreover, unlike rural communities, urban
communities tend to be more diverse with people from different cultural and socioeconomic
backgrounds which promotes sharing of ideas and practices that can influence the uptake of
obstetric care services including postnatal care services [17]. Lastly, women living in an urban
area may be knowledgeable about obstetric services relative to those in rural areas because of
their connectivity to social media, the influx of radio and television in urban areas that serve as a
powerful tool to broadcast information on mother and baby’s health and hence facilitates the
uptake of these essential obstetric services as reported elsewhere [16].
In this study, religion played a significant role in the usage of PNC services similar to
some previous studies However, findings from this research are not consistent with some studies
that used smaller samples size to investigate PNC services use in some parts of Ghana [22, 23].
Previous studies indicated that religion and cultural customs are intertwined and affect maternal
health services utilization [17, 51, 67]. Moreover, the underutilization of PNC services among
traditional and other believers could be linked to the cultural practice of keeping babies in the
house away from the public longer than the post-delivery period stated in similar studies [67,

127
68]. This finding highlights the need to engage religious leaders in establishing community and
home-based PNC programs to enhance the use of PNC services as recommended in a Nepalese
study [69].
Finally, this current study was consistent with earlier studies [17, 41, 70] that revealed a
significant association between ethnicity and the use of PNC services. This study results
established that Akan and Ga women had greater propensity of using PNC services. Also, the
PAR of ethnicity generated in this study could be explained by the fact that ethnic groups have
disparate cultural beliefs and practices during a postnatal period that tend to modify perceived
need and utilization of PNC services as reported in comparable studies [71, 72].
Study strengths and limitations
This study used data from a population-based national survey with a large sample size
and a non-response rate of just 3%. Moreover, GEE with a sandwich-based estimator, a robust
model, was fitted on the clustered data that was used in this study to identify sociodemographic
factors that have a significant association with PNC services usage for the computation of PAR.
The study findings have contributed meaningfully to knowledge on obstetric service utilization
and serve as a reference point for policy formulation and implementation in Ghana as well as
other low-income countries. However, the study also suffers from some limitations. First, the
data relied on self-reporting, which means that there may be a risk of information bias. Second,
this study relied on the 2014 GDHS dataset that utilized a cross-sectional study design and so
causality cannot be estimated.

128
4.5. CONCLUSION
This research confirmed that significant proportion of PNC services use was attributable
to religion and ethnicity of the mothers . In addition, urban women who were affluent and well
educated contributed significantly in the variation of PNC services utilization in the study
population. Moreover, to ensure equitable use of PNC services, policies and programs need to
be directed to the rural poorly educated women. Also, policies that are developed with religious
leaders may assist in PNC uptake in certain religious populations. Lastly, subsequent studies
should examine cultural factors and investigate community-level factors influencing PNC
services utilization. .
References
1. UNIGME: Levels and trends in child mortality: Report 2018. United Nations Inter-
agency Group for Child Mortality Estimation: UNIGME, New York 2018.
2. WHO: Trends in maternal mortality 2000 to 2017: estimates by WHO, UNICEF. In.:
World Health Organization, UNFPA, World Bank Group and the United Nations
Population Division; 2019.
3. Ronsmans C, Graham WJ, group LMSSs: Maternal mortality: who, when, where, and
why. The lancet 2006, 368(9542):1189-1200.
4. Dhaher E, Mikolajczyk RT, Maxwell AE, Krämer A: Factors associated with lack of
postnatal care among Palestinian women: a cross-sectional study of three clinics in
the West Bank. BMC pregnancy and childbirth 2008, 8(1):26.
5. Mosiur Rahman M, Haque SE, Sarwar Zahan M: Factors affecting the utilisation of
postpartum care among young mothers in Bangladesh. Health & Social Care in the
Community 2011, 19(2):138-147.

129
6. WHO: World Health Organization technical consultation on postpartum and
postnatal care. In.: Geneva: World Health Organization; 2010.
7. WHO: World Health Organization, UNICEF. Building a future for women and
children: the 2012 report. New York: United Nations International Children’s
Emergency Fund 2012.
8. WHO: Trends in maternal mortality: 1990 to 2010: WHO, UNICEF, UNFPA and
The World Bank estimates. 2012.
9. Singh S, Darroch JE, Ashford LS, Vlassoff M: Adding it up: the costs and benefits of
investing in family planning and maternal and new born health. In.: Citeseer; 2009.
10. Filippi V, Ronsmans C, Campbell OM, Graham WJ, Mills A, Borghi J, Koblinsky M,
Osrin D: Maternal health in poor countries: the broader context and a call for
action. The Lancet 2006, 368(9546):1535-1541.
11. Koblinsky M, Matthews Z, Hussein J, Mavalankar D, Mridha MK, Anwar I, Achadi E,
Adjei S, Padmanabhan P, van Lerberghe W: Going to scale with professional skilled
care. The Lancet 2006, 368(9544):1377-1386.
12. Mohan D, Gupta S, LeFevre A, Bazant E, Killewo J, Baqui AH: Determinants of
postnatal care use at health facilities in rural Tanzania: multilevel analysis of a
household survey. BMC pregnancy and childbirth 2015, 15(1):282.
13. Jacobs C, Moshabela M, Maswenyeho S, Lambo N, Michelo C: Predictors of antenatal
care, skilled birth attendance, and postnatal care utilization among the remote and
poorest rural communities of Zambia: a multilevel analysis. Frontiers in Public
Health 2017, 5:11.

130
14. Dhakal S, Chapman GN, Simkhada PP, Van Teijlingen ER, Stephens J, Raja AE:
Utilisation of postnatal care among rural women in Nepal. BMC pregnancy and
childbirth 2007, 7(1):19.
15. WHO: World health statistics 2016: monitoring health for the SDGs sustainable
development goals: World Health Organization; 2016.
16. Agho KE, Ezeh OK, Issaka AI, Enoma AI, Baines S, Renzaho A: Population
attributable risk estimates for factors associated with non-use of postnatal care
services among women in Nigeria. BMJ open 2016, 6(7):e010493.
17. Ononokpono DN, Odimegwu CO, Imasiku EN, Adedini SA: Does it really matter
where women live? A multilevel analysis of the determinants of postnatal care in
Nigeria. Maternal and child health journal 2014, 18(4):950-959.
18. Somefun OD, Ibisomi L: Determinants of postnatal care non-utilization among
women in Nigeria. BMC research notes 2016, 9(1):21.
19. Singh L, Rai RK, Singh PK: Assessing the utilization of maternal and child health
care among married adolescent women: evidence from India. Journal of biosocial
science 2012, 44(1):1-26.
20. Ganle JK, Parker M, Fitzpatrick R, Otupiri E: Inequities in accessibility to and
utilisation of maternal health services in Ghana after user-fee exemption: a
descriptive study. International journal for equity in health 2014, 13(1):89.
21. GSS: Ghana Demographic and Health Survey 2014. In.: Ghana Statistical Service
(GSS), Ghana Health Service (GHS), and ICF International; 2015.
22. Sakeah E, Aborigo R, Sakeah JK, Dalaba M, Kanyomse E, Azongo D, Anaseba D,
Oladokun S, Oduro AR: The role of community-based health services in influencing

131
postnatal care visits in the Builsa and the West Mamprusi districts in rural Ghana.
BMC pregnancy and childbirth 2018, 18(1):295.
23. Nuamah GB, Agyei-Baffour P, Mensah KA, Boateng D, Quansah DY, Dobin D, Addai-
Donkor K: Access and utilization of maternal healthcare in a rural district in the
forest belt of Ghana. BMC pregnancy and childbirth 2019, 19(1):6.
24. Andersen R, Newman JF: Societal and individual determinants of medical care
utilization in the United States. The Milbank Memorial Fund Quarterly Health and
Society 1973:95-124.
25. Andersen RM: Revisiting the behavioral model and access to medical care: does it
matter? Journal of health and social behavior 1995:1-10.
26. Dankwah E, Zeng W, Feng C, Kirychuk S, Farag M: The social determinants of health
facility delivery in Ghana. Reproductive health 2019, 16(1):101.
27. Dankwah E, Kirychuk S, Zeng W, Feng C, Farag M: Socioeconomic inequalities in the
use of caesarean section delivery in Ghana: a cross-sectional study using nationally
representative data. International journal for equity in health 2019, 18(1):162.
28. Diggle P, Diggle PJ, Heagerty P, Liang K-Y, Heagerty PJ, Zeger S: Analysis of
longitudinal data: Oxford University Press; 2002.
29. Babineau K, Taylor K, Clancy L: Electronic cigarette use among Irish youth: a cross
sectional study of prevalence and associated factors. PLoS One 2015, 10(5).
30. Akter T, Sarker EB, Rahman S: A tutorial on GEE with applications to diabetes and
hypertension data from a complex survey. Journal of Biomedical Analytics 2018,
1(1):37-50.

132
31. Lee Y, Nelder JA: Conditional and marginal models: another view. Statistical Science
2004, 19(2):219-238.
32. Horton NJ, Lipsitz SR: Review of software to fit generalized estimating equation
regression models. The American Statistician 1999, 53(2):160-169.
33. Hosmer DW LS: Applied logistic regression New York: Wiley; 2000.
34. Bursac Z, Gauss CH, Williams DK, Hosmer DW: Purposeful selection of variables in
logistic regression. Source code for biology and medicine 2008, 3(1):17.
35. Johnston R, Jones K, Manley D: Confounding and collinearity in regression analysis:
a cautionary tale and an alternative procedure, illustrated by studies of British
voting behaviour. Quality & quantity 2018, 52(4):1957-1976.
36. Cui J: QIC program and model selection in GEE analyses. The Stata Journal 2007,
7(2):209-220.
37. Pan W: Akaike's information criterion in generalized estimating equations.
Biometrics 2001, 57(1):120-125.
38. Rockhill B, Newman B, Weinberg C: Use and misuse of population attributable
fractions. American journal of public health 1998, 88(1):15-19.
39. Bruzzi P, Green SB, Byar DP, Brinton LA, Schairer C: Estimating the population
attributable risk for multiple risk factors using case-control data. American journal
of epidemiology 1985, 122(5):904-914.
40. Stafford RJ, Schluter PJ, Wilson AJ, Kirk MD, Hall G, Unicomb L, Group OW:
Population-attributable risk estimates for risk factors associated with
Campylobacter infection, Australia. Emerging infectious diseases 2008, 14(6):895.

133
41. Aseweh Abor P, Abekah-Nkrumah G, Sakyi K, Adjasi CK, Abor J: The socio-economic
determinants of maternal health care utilization in Ghana. International Journal of
Social Economics 2011, 38(7):628-648.
42. Jat TR, Ng N, San Sebastian M: Factors affecting the use of maternal health services
in Madhya Pradesh state of India: a multilevel analysis. International journal for
equity in health 2011, 10(1):59.
43. Titaley CR, Dibley MJ, Roberts CL: Factors associated with non-utilisation of
postnatal care services in Indonesia. Journal of Epidemiology & Community Health
2009, 63(10):827-831.
44. Kabakyenga JK, Östergren P-O, Turyakira E, Pettersson KO: Knowledge of obstetric
danger signs and birth preparedness practices among women in rural Uganda.
Reproductive health 2011, 8(1):33.
45. Babalola S, Fatusi A: Determinants of use of maternal health services in Nigeria-
looking beyond individual and household factors. BMC pregnancy and childbirth
2009, 9(1):43.
46. Limenih MA, Endale ZM, Dachew BA: Postnatal care service utilization and
associated factors among women who gave birth in the last 12 months prior to the
study in Debre Markos town, Northwestern Ethiopia: a community-based cross-
sectional study. International journal of reproductive medicine 2016, 2016.
47. Workineh YG, Hailu DA: Factors affecting utilization of postnatal care service in
Jabitena district, Amhara region, Ethiopia. Sci J Public Health 2014, 23:169-176.
134
48. Chakraborty N, Islam MA, Chowdhury RI, Bari W, Akhter HH: Determinants of the
use of maternal health services in rural Bangladesh. Health promotion international
2003, 18(4):327-337.
49. Liabsuetrakul T, Oumudee N: Effect of health insurance on delivery care utilization
and perceived delays and barriers among southern Thai women. BMC public health
2011, 11(1):510.
50. Amin R, Shah NM, Becker S: Socioeconomic factors differentiating maternal and
child health-seeking behavior in rural Bangladesh: A cross-sectional analysis.
International journal for equity in health 2010, 9(1):9.
51. Khanal V, Adhikari M, Karkee R, Gavidia T: Factors associated with the utilisation of
postnatal care services among the mothers of Nepal: analysis of Nepal demographic
and health survey 2011. BMC women's health 2014, 14(1):19.
52. Sagna ML, Sunil T: Effects of individual and neighborhood factors on maternal care
in Cambodia. Health & place 2012, 18(2):415-423.
53. Witter S, Garshong B, Ridde V: An exploratory study of the policy process and early
implementation of the free NHIS coverage for pregnant women in Ghana.
International journal for equity in health 2013, 12(1):16.
54. Chaka EE, Abdurahman AA, Nedjat S, Majdzadeh R: Utilization and Determinants of
Postnatal Care Services in Ethiopia: A Systematic Review and Meta-Analysis.
Ethiopian journal of health sciences 2019, 29(1):935.
55. Tesfahun F, Worku W, Mazengiya F, Kifle M: Knowledge, perception and utilization
of postnatal care of mothers in Gondar Zuria District, Ethiopia: a cross-sectional
study. Maternal and child health journal 2014, 18(10):2341-2351.

135
56. Tarekegn SM, Lieberman LS, Giedraitis V: Determinants of maternal health service
utilization in Ethiopia: analysis of the 2011 Ethiopian Demographic and Health
Survey. BMC pregnancy and childbirth 2014, 14(1):161.
57. Singh PK, Kumar C, Rai RK, Singh L: Factors associated with maternal healthcare
services utilization in nine high focus states in India: a multilevel analysis based on
14 385 communities in 292 districts. Health policy and planning 2013, 29(5):542-559.
58. Murthy M, Vinayaka Murthy P, Hari M, Kumar V, Rajasekhar K: Place of birth: why
urban women still prefer home deliveries? Journal of Human Ecology 2007,
21(2):149-154.
59. Abraha TH, Gebrezgiabher BB, Aregawi BG, Belay DS, Tikue LT, Reda EB: Factors
Associated with Compliance with the Recommended Frequency of Postnatal Care
Services in Four Rural Districts of Tigray Region, North Ethiopia. Korean journal of
family medicine 2019, 40(5):329.
60. Lakew Y, Tessema F, Hailu C: Birth preparedness and its association with skilled
birth attendance and postpartum checkups among mothers in Gibe Wereda, Hadiya
Zone, South Ethiopia. Journal of environmental and public health 2016, 2016.
61. Doku D, Neupane S, Doku PN: Factors associated with reproductive health care
utilization among Ghanaian women. BMC international health and human rights 2012,
12(1):29.
62. Kwamie A, Asiamah M, Schaaf M, Agyepong IA: Postings and transfers in the
Ghanaian health system: a study of health workforce governance. International
journal for equity in health 2017, 16(1):85.

136
63. Ageyi-Baffour P, Rominski S, Nakua E, Gyakobo M, Lori JR: Factors that influence
midwifery students in Ghana when deciding where to practice: a discrete choice
experiment. BMC medical education 2013, 13(1):64.
64. Onah HE, Ikeako LC, Iloabachie GC: Factors associated with the use of maternity
services in Enugu, southeastern Nigeria. Social science & medicine 2006, 63(7):1870-
1878.
65. Birmeta K, Dibaba Y, Woldeyohannes D: Determinants of maternal health care
utilization in Holeta town, central Ethiopia. BMC health services research 2013,
13(1):256.
66. Ali AAA, Osman MM, Abbaker AO, Adam I: Use of antenatal care services in
Kassala, eastern Sudan. BMC pregnancy and childbirth 2010, 10(1):67.
67. Bandyopadhyay M: Impact of ritual pollution on lactation and breastfeeding
practices in rural West Bengal, India. International Breastfeeding Journal 2009,
4(1):2.
68. Winch PJ, Alam MA, Akther A, Afroz D, Ali NA, Ellis AA, Baqui AH, Darmstadt GL,
El Arifeen S, Seraji MHR: Local understandings of vulnerability and protection
during the neonatal period in Sylhet District, Bangladesh: a qualitative study. The
Lancet 2005, 366(9484):478-485.
69. Pradhan Y, Upreti SR, Pratap KC N, Kc A, Khadka N, Syed U, Kinney MV, Adhikari
RK, Shrestha PR, Thapa K: Newborn survival in Nepal: a decade of change and
future implications. Health policy and planning 2012, 27(suppl_3):iii57-iii71.

137
70. Adu J, Tenkorang E, Banchani E, Allison J, Mulay S: The effects of individual and
community-level factors on maternal health outcomes in Ghana. PloS one 2018,
13(11):e0207942.
71. Magadi M, Diamond I, Rodrigues RN: The determinants of delivery care in Kenya.
Social Biology 2000, 47(3-4):164-188.
72. Kanté AM, Chung CE, Larsen AM, Exavery A, Tani K, Phillips JF: Factors associated
with compliance with the recommended frequency of postnatal care services in
three rural districts of Tanzania. BMC pregnancy and childbirth 2015, 15(1):341.
138
The socioeconomic and demographic determinants identified from chapter 2 to chapter 4 as
well as the recognition that a substantial part of the disparities in obstetric care services use could
be linked to women’s community, has warranted this follow up chapter. Chapter 5 build on the
earlier chapters to identify high-risk communities and community-level predictors of postnatal
care (PNC) services utilization independent of individual-level factors using a multilevel mixed
logistic regression model.
Preprint of chapter 5 is available online DOI: https://doi.org/10.21203/rs.3.rs-31656/v1
“(PDF) Assessing the Contextual Effect of Community in the Utilization of Postnatal Care
Services in Ghana”. Available from:
https://www.researchgate.net/publication/342023764_Assessing_the_Contextual_Effect_of_Co
mmunity_in_the_Utilization_of_Postnatal_Care_Services_in_Ghana [accessed Jul 21 2020].
Also, chapter 5 has been submitted to the BMC Health Services Research “Dankwah, E., Zeng,
W., Feng, C., Kirychuck, S., Lepnrum, R. & Farag, M. (2020). Assessing the Contextual Effect
of Community in the Utilization of Postnatal Care Services in Ghana, BHSR-D-20-01224”
(1.932 - 2-year Impact Factor). I conceptualized, reviewed the literature, cleaned and analyzed
the dataset, and also did the interpretation of the findings and wrote the chapter 5.

139
Chapter 5. Assessing the Contextual Effect of Community in the Utilization of Postnatal
Care Services in Ghana
5.1. INTRODUCTION
The post-natal period is a critical stage in the obstetric cycle, especially, the first 24 hours
and early days following childbirth [1, 2]. Women and babies need special attention during this
period because most deaths occur in that time [3]. Moreover, studies have found that adequate
care during the post-partum period is vital for maternal and child survival, especially in poorer
regions of the world with high maternal and neonatal mortalities [4, 5]. Researchers contend that
achieving a post-natal care (PNC) services utilization rate of 90% in Africa could save between
10 to 27 percent of neonatal deaths [2].
Despite the benefits derived from PNC services, a large proportion of sub-Saharan Africa
mothers and babies especially those that delivered outside health facility do not use post-natal
services [6]. Ghana is a western African country that spans a land area of 238,535 km² [7] and
shares boundary with Burkina Faso to the north, Cote d’Ivoire to the west, Togo to the east and
the Gulf of Guinea on the south (Figure 5-1). Ghana had 10 administrative regions during the
2014 Ghana Demographic and Health Survey (GDHS) namely Western, Central, Greater-Accra,
Volta, Eastern, Ashanti, Brong Ahafo, Northern, Upper East and Upper West (Figure 5-1). The
situation is not different in Ghana, a nation with a fertility rate of 4 and approximately 76%
livebirths from all pregnancies [7]. A critical mass of mothers and newborns lack needed PNC
services [7, 8]. A previous study conducted in one administrative region of Ghana reported that
PNC services covered 43.8% of mothers [8] whereas another study revealed that 56% of
neonates immediately received PNC services within 48 hours after their birth [9] in Ghana. Such
underutilization and discrepancies in the usage of postdelivery services exposes mother and
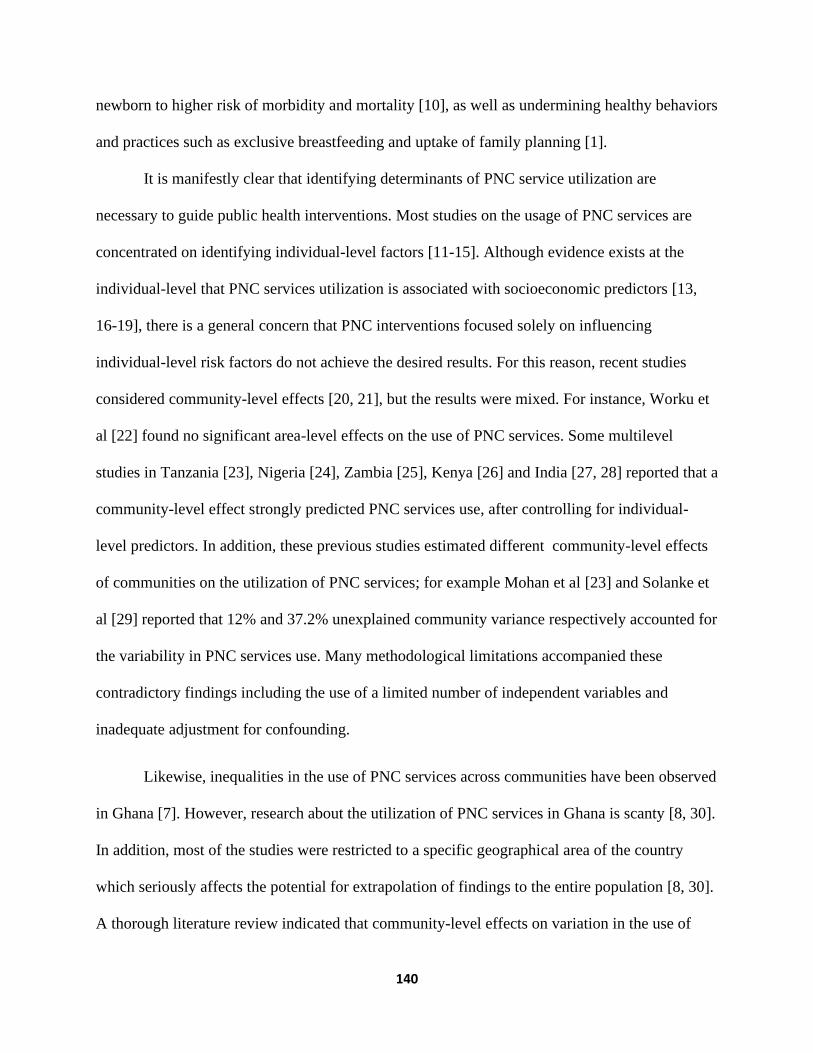
140
newborn to higher risk of morbidity and mortality [10], as well as undermining healthy behaviors
and practices such as exclusive breastfeeding and uptake of family planning [1].
It is manifestly clear that identifying determinants of PNC service utilization are
necessary to guide public health interventions. Most studies on the usage of PNC services are
concentrated on identifying individual-level factors [11-15]. Although evidence exists at the
individual-level that PNC services utilization is associated with socioeconomic predictors [13,
16-19], there is a general concern that PNC interventions focused solely on influencing
individual-level risk factors do not achieve the desired results. For this reason, recent studies
considered community-level effects [20, 21], but the results were mixed. For instance, Worku et
al [22] found no significant area-level effects on the use of PNC services. Some multilevel
studies in Tanzania [23], Nigeria [24], Zambia [25], Kenya [26] and India [27, 28] reported that a
community-level effect strongly predicted PNC services use, after controlling for individual-
level predictors. In addition, these previous studies estimated different community-level effects
of communities on the utilization of PNC services; for example Mohan et al [23] and Solanke et
al [29] reported that 12% and 37.2% unexplained community variance respectively accounted for
the variability in PNC services use. Many methodological limitations accompanied these
contradictory findings including the use of a limited number of independent variables and
inadequate adjustment for confounding.
Likewise, inequalities in the use of PNC services across communities have been observed
in Ghana [7]. However, research about the utilization of PNC services in Ghana is scanty [8, 30].
In addition, most of the studies were restricted to a specific geographical area of the country
which seriously affects the potential for extrapolation of findings to the entire population [8, 30].
A thorough literature review indicated that community-level effects on variation in the use of

141
PNC services in Ghana remain uncertain. The review showed that the majority of studies
conducted in Ghana used only individual-level data [12]. Hence, there is a dearth of evidence
measuring the association between community-level risk factors and the utilization of PNC
services specific to Ghana. This study intends to assess (1) the community-level effect on the
utilization of PNC services in Ghana using a multilevel regression model with a logit link
function and (2) explore the spatial pattern of non-use of PNC services across Ghanaian
communities. The findings from this study could be used to inform equity-based interventions to
improve the use of PNC services across communities in Ghana and other low-income countries.
Figure 5-1: Map of Ghana and its location in Africa. Source: http://www.mapsopensource.com.

142
5.2. METHODS
5.2.1. Study sampling and data source
This research used the 2014 Ghana Demographic and Health Survey (GDHS) dataset. As
described by Ghana Statistical Service (GSS) [7], the participants of this survey were sampled
nationwide from 427 clusters (hereinafter community) using a two-stage sampling technique.
Overall, 9,396 women aged 15-49 years were chosen and interviewed after consenting to
participate [7]. The 2014 GDHS response rate was 97 percent. This nationwide survey captured
information including women’s reproductive health, health-seeking behavior, socioeconomic,
and demographic background as well as geo-reference data. The Global Positioning System
(GPS) data were collected for all the 427 communities in Ghana. Out of the interviewed women,
4292 gave birth in the previous 5 years before the survey and responded to the interview question
about whether they received skilled care after delivery (Figure 5-2), which constituted the study
sample for this study. Detailed information on the sampling procedure and data is published in
the Ghana Demographic and Health Survey of 2014 [7].
143
Figure 5-2. Hierarchical structure of the 2014 GDHS data.
5.2.2. Study factors
The dependent variable was whether the mother received PNC services from a health
care provider after delivery within 41 days or not. The outcome measure was coded ‘yes or no’
depending on the response to the questionnaire. The questions in the survey regarding PNC
services were restricted to last delivery in the past five years hitherto the 2014 GDHS to limit
recall bias. The coding structure for the outcome variable has been detailed in Table 1.
The community-level and individual-level factors employed in this study were chosen
using the Andersen health utilization model as displayed in Figure 5-3. Community-level factors
describe the characteristics of the community while the individual-level factors focus on
women’s attributes. Andersen’s behavioral model highlights the health system and community
characteristics as well as predisposing and enabling factors as facilitating and inhibitory factors
for health care utilization [31, 32].
Communities
(427)
Women
interviewed
(9,396) Women who birthed 5 years
ahead of the survey and were
asked whether they used
postnatal care within 41 days
after live birth (4,292)
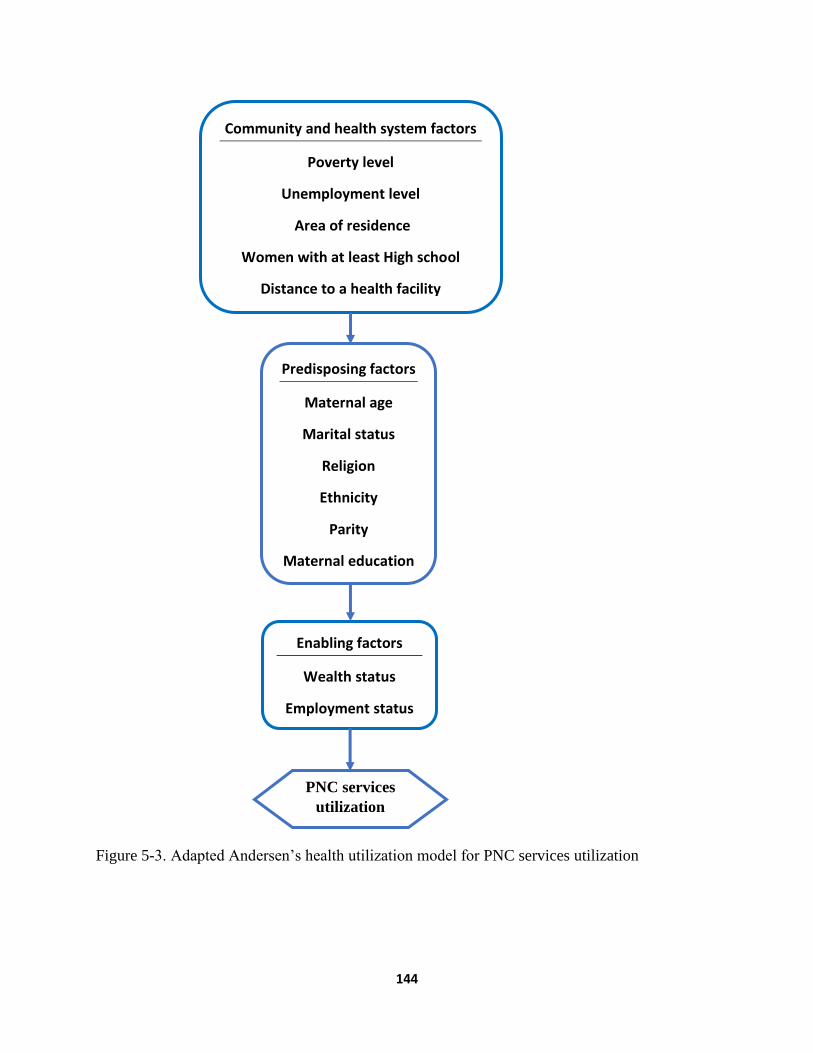
144
Figure 5-3. Adapted Andersen’s health utilization model for PNC services utilization
Community and health system factors
Poverty level
Unemployment level
Area of residence
Women with at least High school
Distance to a health facility
Predisposing factors
Maternal age
Marital status
Religion
Ethnicity
Parity
Maternal education
Enabling factors
Wealth status
Employment status
PNC services
utilization

145
According to the 2014 GDHS, information about the usual community the women lived
in, whether rural or urban was captured and was termed as area of residence in this study. Also,
the 2014 GDHS collected information about whether women had an issue with distance to a
health facility when seeking medical attention. This survey question captured self-reported
information on women’s perceived distance to a health facility in their community and was
referred hereinafter in this study as community-level problem with distance to a health facility.
The 2014 GDHS created two dummy variables for distance to a health facility: a big problem
(indicating longer distance) and not a big problem (suggesting shorter distance). This variable
was used as a proxy to measure the effect of community-level problem with distance to a health
facility on the dependent variable as done in an analogous study in Nigeria [46].
On the other hand, the community poverty level was categorized into two groups as
reported in a similar study [33]. The community poverty level variable was created from the
wealth index in the survey data. The GDHS wealth index was made from information on
possession of household assets and dwelling factors including means of transport, refrigerator,
toilet facilities among others [24]. The survey employed Principal component analysis to create
wealth index [24] that was categorized into quintiles: poorest, poorer, middle, richer and richest.
In this study, the poorest and poorer groups were merged to represent the poor category. The
percentage of women who were poor per community was estimated. Community’s level of
poverty was coded as high ‘1’ when above 50% otherwise was coded low ‘0’ (Table 5-1).
The community level of education was generated from women’s responses to the
question “highest education attended” in the survey. The survey data categorized the highest
education attended into 4 groups namely no education, primary (1-6 years), Secondary (7-12
years) and higher. For this study, the higher education attended variable was created by

146
combining secondary and higher education. The percentage of women with at least secondary
education was computed for each community. Also, the community unemployment level was
generated from the responses of women on either they were working or not. The survey data
created two dummy variables of employment: working ‘1’ and not working ‘0’. The percentage
of unemployment per community was calculated. The study variables such as community level
of education (p-value=0.67) and community unemployment level (p-value= 0.29) did not fail the
linearity test and were examined as a continuous variable. The community-level factors that were
analyzed to explain the discrepancies in the utilization of PNC services include the area of
residence, community-level problem with distance to a health facility, community poverty level,
community education level, and community unemployment level.
Individual-level variables that were studied in this research were maternal age, marital
status, religion, ethnicity, parity, education, wealth status, and employment status. As exhibited
in Table 5-1 of this study, maternal age was examined as a continuous variable. Marital status
was grouped as single, cohabitating, widow/divorced/separated and married. In terms of religion,
this study classified women into traditionalist or other, Muslim, and Christian. Also, this study
considered ethnicity instead of region of residence to prevent multicollinearity issues and to
comprehensively understand the level of inequalities in the use of PNC services especially
among minority ethnic groups which will not be possible at the regional level (aggregate level).
In this study, ethnicity was classified as Akan, Northern tribes, Ewe, Ga, and other groupings.
For this research, the parity of the women was grouped into 1 birth, 2 births, and ≤ 3 births.
Women’s highest education level was classified into no education, primary, secondary or higher.
This study grouped women’s wealth status into poor, middle, and rich classifications. Finally,
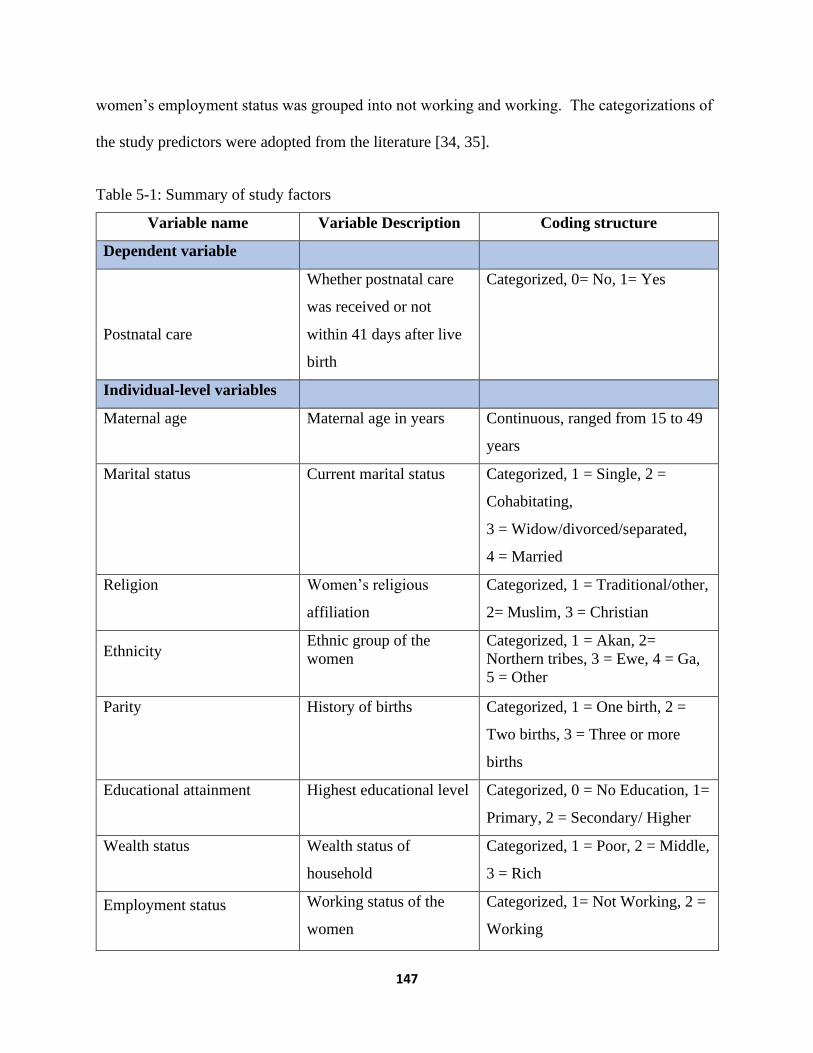
147
women’s employment status was grouped into not working and working. The categorizations of
the study predictors were adopted from the literature [34, 35].
Table 5-1: Summary of study factors
Variable name Variable Description Coding structure
Dependent variable
Postnatal care
Whether postnatal care
was received or not
within 41 days after live
birth
Categorized, 0= No, 1= Yes
Individual-level variables
Maternal age
Maternal age in years Continuous, ranged from 15 to 49
years
Marital status
Current marital status Categorized, 1 = Single, 2 =
Cohabitating,
3 = Widow/divorced/separated,
4 = Married
Religion
Women’s religious
affiliation
Categorized, 1 = Traditional/other,
2= Muslim, 3 = Christian
Ethnicity
Ethnic group of the
women
Categorized, 1 = Akan, 2=
Northern tribes, 3 = Ewe, 4 = Ga,
5 = Other
Parity
History of births Categorized, 1 = One birth, 2 =
Two births, 3 = Three or more
births
Educational attainment
Highest educational level Categorized, 0 = No Education, 1=
Primary, 2 = Secondary/ Higher
Wealth status
Wealth status of
household
Categorized, 1 = Poor, 2 = Middle,
3 = Rich
Employment status
Working status of the
women
Categorized, 1= Not Working, 2 =
Working
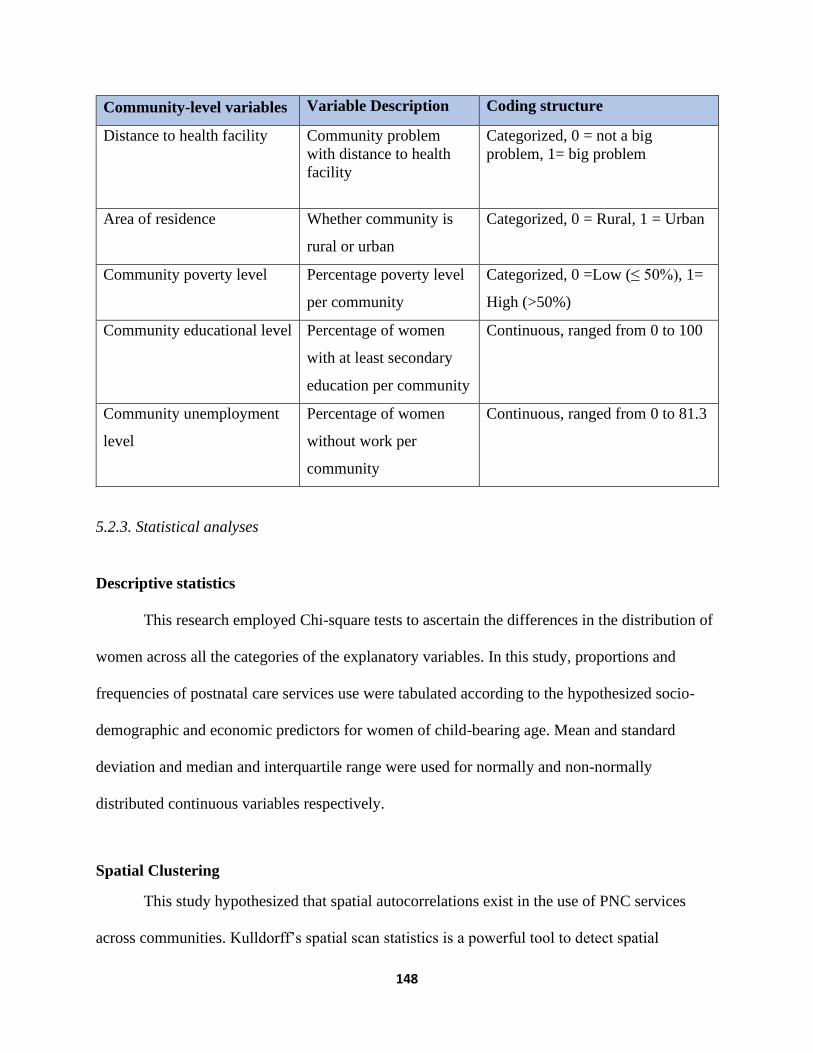
148
Community-level variables Variable Description Coding structure
Distance to health facility
Community problem
with distance to health
facility
Categorized, 0 = not a big
problem, 1= big problem
Area of residence
Whether community is
rural or urban
Categorized, 0 = Rural, 1 = Urban
Community poverty level
Percentage poverty level
per community
Categorized, 0 =Low (≤ 50%), 1=
High (>50%)
Community educational level
Percentage of women
with at least secondary
education per community
Continuous, ranged from 0 to 100
Community unemployment
level
Percentage of women
without work per
community
Continuous, ranged from 0 to 81.3
5.2.3. Statistical analyses
Descriptive statistics
This research employed Chi-square tests to ascertain the differences in the distribution of
women across all the categories of the explanatory variables. In this study, proportions and
frequencies of postnatal care services use were tabulated according to the hypothesized socio-
demographic and economic predictors for women of child-bearing age. Mean and standard
deviation and median and interquartile range were used for normally and non-normally
distributed continuous variables respectively.
Spatial Clustering
This study hypothesized that spatial autocorrelations exist in the use of PNC services
across communities. Kulldorff’s spatial scan statistics is a powerful tool to detect spatial

149
autocorrelations based on geographic positioning [36]. This technique was employed in this
study to identify local clusters of PNC services across the communities. For analyses, this study
used the GDHS spatial data that only allows a set of coordinates per community. A purely spatial
analysis was conducted using a discrete binomial model to scan for communities with high rates
of non-utilization of PNC services in Ghana. SaTScan technique used in this study hypothesized
that the risk of non-use of PNC services was likely different between the inner and outer parts of
a circular window. The circular- shape spatial window scan communities to identify areas with a
maximum spatial cluster size of 50 percent of the population at risk. The probability model relied
on Monte Carlo simulation with replication of 999 and 50 percent of the population at risk was
considered the maximum size of a spatial cluster [37]. The analyses were conducted using
SaTScan software, version 9.6.0. The outputs generated from SaTScan analyses were displayed
on Google Maps to highlight the spatial patterns of non-use of PNC services.
Multilevel regression model
Given the sampling technique and the hierarchical nature of the weighted 2014 GDHS
data, a 2-level mixed logistic regression model was specified for the dichotomous outcome [20,
38] using mean-variance adaptive Gauss–Hermite quadrature at an integration point of 12. The
components of the model were level one (individuals) nested in level two (communities). This
study considers the error in the second level as a random effect to check for disparities in the
likelihood of PNC services usage across the communities. The two-level mixed model used is
stated below.
Equation 5-1: Multilevel logistic regression model
p (Yi = 1) = pi

150
Logit (pi) = β0 + β1X1 + β2X2 …+ βkXki + μgroup(i)
where μj ~ N (0, σ2 group); β0, intercept; βk, regression coefficient of the variables; Xki,
study predictors; σ2 group, community-level variance
Three models were estimated in this study. A null model was first fitted with no
covariates. Second, unconditional mixed logistic regression analyses were conducted between
the use of PNC services and each individual-level as well as community-level predictors.
Unadjusted odds ratios were generated and correlations with liberal p-values of 0.25 or less were
selected as candidates for the multivariate 2-level mixed modeling [39]. This unconventional cut-
off was used to avoid the elimination of important predictors that could be masked or suppressed
by other control variables [39, 40]. Lastly, as proposed by Hosmer and Lemeshow [40], a
selection method that manually eliminates insignificant factors was utilized in the final model.
This backward technique sequentially removes less relevant characteristics, beginning with the
highest p-value and eventually retaining just significant predictors with a p-value less than or
equal to 0.05.
A complete case analysis was used in this study to remove subjects with missing values.
A polynomial model was used to test the assumption of linearity for age by introducing a
quadratic term. Multicollinearity test for selected individual-level predictors was done to ensure
inflated standard errors due to many predictors measuring the same characteristics are controlled.
In this research, the parameters for variance inflation factor (VIF) ≤ 2.5 and tolerance ≥ 0.4 were
set as recommended by Johnston et al [41]for the logistic regression model to identify potentially
redundant variables due to collinearity.

151
Type-3 likelihood ratio test was used to examine categorical explanatory variables that
have classifications greater than two. Predictors were considered confounders if the difference in
the regression coefficient in the unconditional and conditional model was > 20% [39]. This study
tested interactions among predictors that were significant in the multivariable model.
The final model had both fixed and random effects, which were reported as odds ratios
and intraclass correlation coefficients (ICC) respectively. To compare the effect on individuals
across the communities, this study manually calculated population-averaged odds ratios (ORs)
and 95% confidence intervals from the subject-specific coefficients from the final model using
the following equation:
Equation 5-2: Population-averaged Odds Ratios
βPA =β/(√ (1 + 0.346σ2group) )
where 𝜎2group is community-level variance, β is the subject-specific regression coefficient.
Based on the latent response variable approach [42], the variance partition coefficient
(VPC) which is also referred to as Intraclass Correlation Coefficient (ICC) was calculated for the
community in both the null and final model, which measures the variability in the dependent
variable attributable to the contextual level [43]. The VPC was computed from this formula
below.
Equation 5-3: Variance Partition Coefficient (VPC)
VPC =σ2group/((σ2group+π2/3) where 𝜎2group is community-level variance.

152
This study computed “design effect (deff)”, the quotient of the variance in a clustered
data structure relative to that in an independent structure. Due to the fact that the variation within
or between clusters for discrete data is not always constant, deff is an approximation [44].
Equation 5-4: Design effect
deff ≈ 1 + (C - 1) x ICC,
where C is average cluster size and ICC represents intraclass correlation coefficient.
The final model in this study was compared with the null model, and a smaller value of
Akaike’s Information Criterion (AIC) and Bayesian Information Criterion (BIC) was regarded
as a parsimonious model [45]. Also, model diagnostics was done using the area under the curve
(AUC) of the receiver-operating characteristic (ROC). Alpha level of 0.05 was used to gauge the
association that was statistically significant in this current research. STATA 14 (Stata Corp. Inc.,
TX, USA) was employed in this study.
5.3. RESULTS
5.3.1. Descriptive statistics
In this study, a total of 427 communities were examined and within all these communities
84% of the mothers utilized PNC services whilst 16% did not use with significant inequities in
the utilization of this essential service (Figure 5-4).

153
Figure 5-4. Distribution of postnatal care service utilization among reproductive aged Ghanaian
women, 2014 GDHS data.
Spatial Autocorrelation
The median number of women per community that reported non-use of PNC services was
1 (Interquartile range (IQR): 0-2). Regarding clusters with high rates of non-utilization of PNC
services, this study found significant spatial autocorrelations of non-use of PNC services in
Ghana (Figure 5-5). The spatial scan statistic output identified 4 significant clusters with
disproportionately higher non-usage of PNC services than their neighboring communities. The
biggest cluster composed of 13 communities in the northern region and three communities in the
Volta region, covering a diameter of 123.9 kilometers. This cluster had a relative risk of 3.97 (p-
value <0.00001) which indicates that women who dwell in the area were 3.97 times more likely
to miss PNC services than surrounding communities. Also, a second cluster was detected among
ten northern communities covering a diameter of 80.1 kilometers. The risk of not receiving PNC
services among women who resided in this cluster area was 3.93 times more when compared to
those outside that locality. Furthermore, this study detected another significant cluster that

154
comprised of 15 communities: Volta region (8 communities), Brong Ahafo (2 communities) and
Northern region (5 communities). The cluster diameter was 78.8 kilometers and the relative risk
of not using PNC services in the clustered area was 2.36 (p-value < 0.000003). This revealed that
women who live in this locality were 2.36 times more likely not to utilize PNC services relative
to bordering communities (Figure 5-5). Lastly, a cluster was identified in the Eastern region of
Ghana which was made up of five communities covering a diameter of 40.78 kilometers; women
living in this clustered locality had a likelihood of not using PNC services which was 3.51 times
higher than dwellers in the surrounding communities (Figure 5-5).
Figure 5-5: Map of Ghana showing significant clusters of non-utilization of PNC services

155
Community-level characteristics
The distribution of study predictors by the community has been outlined in Table 5-2.
Concerning the community-level problem with distance to a health facility, 69.3% of the
communities did not have a big problem with distance to a health facility while 30.7 percent had
a big problem with distance to a health facility. In terms of PNC services utilization, 87.5% and
76.0% utilization rates were found in communities that did not have a big problem with distance
to a health facility and communities with a big problem with distance to a health facility
respectively.
Regarding area of residence, about 58.6 percent of the communities were in rural areas
whereas about two-fifth (41.6%) of the communities were situated in the urban areas. The
utilization rate of PNC services in urban communities was 98.0% whilst 78.4% occurred in
rural communities (Table 5-2).
With respect to poverty levels of communities, PNC services utilization rate was 71
percent in communities with a high poverty level whereas it was 89.3 percent in communities
with a low poverty level (Table 5-2). This implies that women residing in poorer communities
have lower utilization of PNC services. The average community-level percentage of women with
at least secondary education was 45.1±26.02. Community unemployment level variable met the
linearity assumption (p-value=0.29). The average percentage of communities’ unemployment
was 26.4±13.01 (Table 5-2).
Individual-level characteristics
Table 2 displays the distribution of individual-level socioeconomic control variables by
PNC services use. Regarding age, the linearity assumption was not violated (p-value= 0.148) and

156
hence was analyzed as a continuous variable. Overall, 4292 women were included in the study,
their ages were from 15 to 49 years with a mean age of 30.9±7.3 years. Among women who
received PNC services, the average age was 30.6±7.0 year (Table 5-2).
Regarding marital status, 65.2% of the women were married, 19.3% were cohabitating,
8.5% were single while 7.0% were divorced or widowed or separated. Comparison in the use of
PNC services by marital status showed that 87.3% of single women received PNC services,
84.7% of divorced or widowed or separated, 84.4% of married and 81.0% of cohabitating
women used PNC services (Table 5-2).
Concerning religion, Christians represented 71 percent of the study respondents.
Muslims accounted for 21.5% of women whilst 7.5% were traditional or other believers. In
connection with PNC services, 56.5% of women who were traditional or other believers used
PNC services. Most Christians (86.0%) and Muslims (86.9%) received PNC services (Table 5-
2).
Northern tribes constituted 41.8% of the study population followed by Akans (38.3%)
while other ethnic groupings were the least represented (4.2%) among the study participants
corresponding with their percentage in the population. The highest utilization of PNC services
was found among Ga women (90.4%) whereas northern tribe women had the highest non-
utilization of PNC services (21.4%)(Table 5-2).
Considering parity, 58.7% of women had at least 3 births whereas 21.8% and 19.5% of
the women had given birth once and twice respectively. Further, 81.1% of women who had
given birth thrice or more used PNC services. Among women who had one birth and two births,
88.3% and 88.0% respectively received PNC services (Table 5-2).

157
Concerning education, 33.0% of women had no education and 46.7% had at least
secondary education. In terms of the use of PNC services, 83.4% of women who attained
primary education and 91.2% of women who had secondary or higher education received PNC
services. Among women with no education, 74.1% used PNC services (Table 5-2).
As for wealth status, more than half (52.2%) of the women were considered poor, 28.9%
were rich, and the remaining18.9% were middle-class. Regarding uptake of PNC services, 76%
of poor women received PNC service whereas 81.4% and 95.2% of middle-class and rich women
used PNC services respectively (Table 5-2). Referring to women’s employment status, 79.3%
were working and 83.5% of those working received PNC services compared to 85.8% of women
who were not working (Table 5-2).
Table 5-2: Distribution of women by predictors and PNC services utilization, and unadjusted
odds ratios (UOR), 95%CI, and p-values for predictors of using PNC services among Ghanaian
women from the univariable 2-level logistic regression model.
Predictors Overall
(N=4,292)%
Used postnatal
care (N =3,605)%
No postnatal care
(N = 687)%
Individual-level characteristics N (%) N (%) N (%)
Age (Mean ± SD) 30.9 ± 7.33 30.6 ± 7.03 31.3 ± 7.62
Marital status
Single
Cohabitating
Widow/divorced/separated
Married
363 (8.5)
830 (19.3)
300 (7.0)
2,799 (65.2)
317 (87.3)
672 (81.0)
254 (84.7)
2,362 (84.4)
46 (12.7)
158 (19.0)
46 (15.3)
437 (15.6)
Religion
Traditional/other
Islam
Christians
324 (7.5)
922 (21.5)
3,046 (71.0)
183 (56.5)
801(86.9)
2,621(86.0)
141(43.5)
121(13.1)
425(14.0)

158
Ethnicityᶺ Overall
(N=4,292)%
Used postnatal
care (N =3,605)%
No postnatal care
(N = 687)%
Akan
Northern tribes
Ewe
Ga
Other
1,642 (38.3)
1,795 (41.8)
476 (11.1)
198 (4.6)
180 (4.2)
1,473 (89.7)
1,411 (78.6)
391 (82.1)
179 (90.4)
150 (83.3)
169 (10.3)
384 (21.4)
85 (17.9)
19 (9.6)
30 (16.7)
Parity
One birth
Two births
Three or more births
935 (21.8)
838 (19.5)
2,519 (58.7)
826 (88.3)
737 (88.0)
2,042 (81.1)
109 (11.7)
101 (12.1)
477 (18.9)
Educational attainment
No education
Primary
Secondary/Higher
1,418 (33.0)
869 (20.3)
2,005 (46.7)
1,051(74.1)
725 (83.4)
1,829 (91.2)
367 (25.9)
144 (16.6)
176 (8.8)
Wealth status
Poor
Middle
Rich
2,241 (52.2)
811 (18.9)
1,240 (28.9)
1,703 (76.0)
751 (89.0)
1,180 (95.2)
538 (24.0)
89 (11.0)
60 (4.8)
Employment statusᶲ
Not working
Working
886 (20.7)
3,403 (79.3)
760 (85.8)
2,842 (83.5)
126 (14.2)
561(16.5)
Community-level characteristics
Community Problem with distance
to health facility
Not a big problem
Big problem
2,973 (69.3)
1,319 (30.7)
2,603 (87.5)
1,002 (76.0)
370 (12.5)
317 (24,0)
Area of residence
Urban 1777 (41.4) 1,634 (92.0) 143 (8.0)

159
Rural 2515 (58.6) 1,971(78.4) 544 (21.6)
Community Poverty level
Low
High
3,046 (71.0)
1,246 (29.0)
2,720 (89.3)
885 (71.0)
326 (10.7)
361 (29.0)
Community Education level
Percentage of women with at least
secondary education per
community (Mean ± SD)
45.1 ± 26.02 54.6 ± 26.11 35.6 ± 26.20
Community unemployment level
Percentage of women without work
per community (Mean ± SD)
26.4 ± 13.01 27.6 ± 12.95 25.2 ± 13.06
N, number of observations; SD, standard deviation; %, percent; ᶲN= 4289 and ᶺN=4291 , due to
missing values; CI, confidence in; GDHS data 2014
Inferential statistics
Univariable analysis results: Two-level mixed models were fitted to account for
community-level variance. Most communities had more than one woman who participated in the
2014 GDHS, and this has the tendency to cause clustering in the dataset. The number of women
in the community ranged from 1 to 33 with an average of about 10 women per community. The
design effect of 4.3 computed in this study suggested a clustered data structure and hence
justified the use of multilevel analysis as proposed by Maas and Hox [44]. In the univariate
model, only women’s marital (p-value=0.4) and employment (p-value=0.8) status had p-values
greater than 0.25 and were excluded from the study (Table 5-3).

160
Table 5-3: Distribution of women by predictors and PNC services utilization, and unadjusted
odds ratios (UOR), 95%CI, and p-values for predictors of using PNC services among Ghanaian
women from the univariable 2-level mixed logistic regression model.
Predictors UOR (95% CI) P-value
Individual-level characteristics
Age (years) 0.98 (0.97, 0.99) 0.02
Marital status
Cohabitating
Widow/divorced/separated
Married
Single
0.84 (0.55, 1.27)
0.94 (0.56, 1.57)
1.05 (0.72, 1.53)
Reference
0.4
Religion
Islam
Christians
Traditional/other
3.03 (1.98, 4.65)
3.04 (2.18, 4.22)
Reference
<0.0001
Ethnicity
Akan
Northern tribes
Ga
Other
Ewe
1.88 (1.26, 2.81)
1.07 (0.71, 1.62)
2.69 (1.35, 5.33)
0.85 (0.49, 1.66)
Reference
0.0001
Parity
Three or more births
Two births
One birth
0.65 (0.50, 0.85)
0.96 (0.69, 1.33)
Reference
0.0005
Educational attainment
No education
Primary
0.41 (0.31, 0.52)
0.52 (0.40, 0.69)
<0.0001

161
Secondary/Higher Reference
Wealth status
Poor
Middle
Rich
0.18 (0.13, 0.26)
0.39 (0.27, 0.58)
Reference
<0.0001
Employment status
Working
Not working
0.97 (0.76, 1.24)
Reference
0.8
Community-level characteristics
Community Problem with distance to health
facility
Not a big problem
Big problem
1.39 (1.11, 1.73)
Reference
0.004
Area of residence
Urban
Rural
3.32 (2.35, 4.68)
Reference
<0.0001
Community Poverty level
High
Low
0.28 (0.20, 0.41)
Reference
<0.0001
Community Education level
Percentage of women with at least secondary
education per community
1.03 (1.02, 1.04) <0.0001
Community unemployment level
Percentage of women without employment per
community
1.01 (0.99, 1.02) 0.22
CI, confidence interval; UOR, unadjusted odds ratio; GDHS data 2014

162
Multivariable analysis results: Apart from marital status and employment status
variables that were not considered in the adjusted model, the rest of the study variables were
tested for multicollinearity. All risk factors that were selected for the adjusted model had VIF ≤
2.5 and tolerance ≥ 0.4. In addition, the overall mean VIF of 1.58 indicated that multicollinearity
was not considered problematic (Table 5-4).
Table 5-4: Results of multicollinearity test for selected predictors for the multivariable model
Predictors VIF Tolerance
Individual-level characteristics
Age 1.66 0.60
Religion 1.21 0.83
Ethnicity 1.03 0.97
Parity 1.73 0.58
Education 1.86 0.54
Wealth status 2.42 0.41
Community-level characteristics
Community Problem with distance to health
facility
1.33 0.75
Area of residence 1.82 0.55
Community Education level 2.50 0.40
Community Poverty level 1.52 0.66
Community unemployment level 1.05 0.95
Mean VIF 1.58
As shown in Table 5-5, the final model had smaller AIC and BIC; therefore, was selected
as a more parsimonious model (AIC= 3146.7 ; BIC=3235.8 ) than the model without risk factors

163
(AIC=3304.9, BIC=3317.6). The AUC of 0.86 (95%CI: 0.85-0.87) from the ROC curve
demonstrates the model is a good binary classifier of PNC service use or not (Figure 5-6).
Figure 5-6. Receiver Operating Characteristics curve of the final model
The results from the multivariable 2-level mixed model with logit link function are
shown in Table 5-5. In this study, potential confounders were maintained in the model. No
interaction term was found beyond the significant main effects of the predictors in the
multivariable model.
Community-level effect (Random effects)
In this study, intraclass correlation coefficients (ICC) computed from the 2-level mixed
logistic regression models were used to measure the degree of heterogeneity in PNC services use
accounted for by the differences between communities. The ICCs showed significant proportions
of variability in PNC utilization in this study. The intercept only model (without study variables)
0.0
00
.25
0.5
00
.75
1.0
0
Se
nsi
tivity
0.00 0.25 0.50 0.75 1.001 - Specificity
Area under ROC curve = 0.8599

164
examined in this study reported significant variation in PNC services utilization across the
communities ( ICC =0.36 (95% CI: 0.30-0.42). The variation in the use of PNC services across
the community continued to be significant after including individual-level study predictors. The
result from the final model showed that 24% (95% CI: 0.18-0.30) of the unobserved variation in
PNC services utilization could be explained by community heterogeneity (Table 5-5).
Moreover, the results of the association between community-level predictors and
receiving PNC services are shown in Table 5. This analysis indicate that the likelihood of using
PNC services by a woman, who resided in a community with a higher poverty level was 0.60
(95%CI:0.44-0.81 ) times less likely than a woman who lived in a community with a lower
poverty level. Also, a moderate association between community-level secondary or higher
education and the use of PNC services was identified. For a one percentage change in the level of
community secondary or higher education, the odds of using PNC services increases by 1.01
(95%CI:1.01-1.02) times. However, the analyses indicate that the effect of a community-level
problem with distance to a health facility, area of residence and community-level unemployment
on the utilization of PNC services in the crude model were diminished in the multivariable model
after controlling for other explanatory factors. The use of PNC services did not have an
independently significant association with community problem with distance to a health facility
(AOR=1.08, 95%CI: 0.89, 1.32), area of residence (AOR=1.05, 95%CI: 0.75-1.46) and
community-level unemployment (AOR=0.99, 95%CI: 0.98-1.00).
Individual-level effect
Based on Table 5-5, the findings of this study show that religion, ethnicity, education,
and wealth status emerged as significantly associated with services uptake. The study results
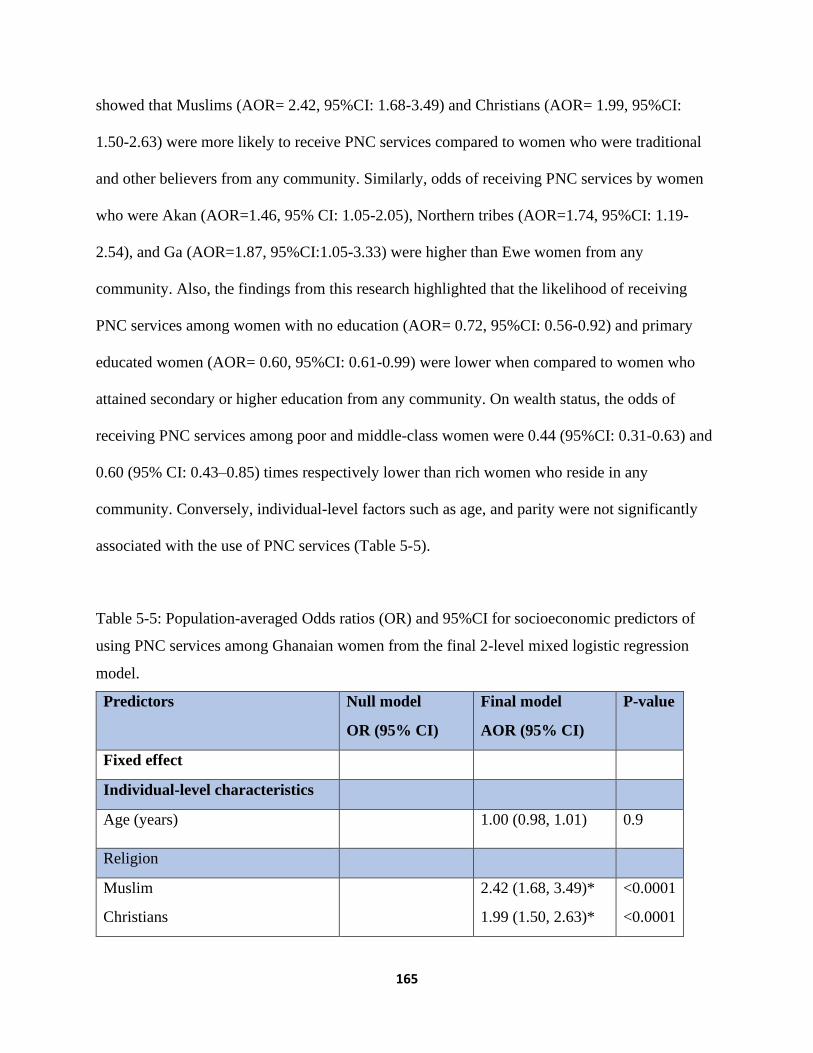
165
showed that Muslims (AOR= 2.42, 95%CI: 1.68-3.49) and Christians (AOR= 1.99, 95%CI:
1.50-2.63) were more likely to receive PNC services compared to women who were traditional
and other believers from any community. Similarly, odds of receiving PNC services by women
who were Akan (AOR=1.46, 95% CI: 1.05-2.05), Northern tribes (AOR=1.74, 95%CI: 1.19-
2.54), and Ga (AOR=1.87, 95%CI:1.05-3.33) were higher than Ewe women from any
community. Also, the findings from this research highlighted that the likelihood of receiving
PNC services among women with no education (AOR= 0.72, 95%CI: 0.56-0.92) and primary
educated women (AOR= 0.60, 95%CI: 0.61-0.99) were lower when compared to women who
attained secondary or higher education from any community. On wealth status, the odds of
receiving PNC services among poor and middle-class women were 0.44 (95%CI: 0.31-0.63) and
0.60 (95% CI: 0.43–0.85) times respectively lower than rich women who reside in any
community. Conversely, individual-level factors such as age, and parity were not significantly
associated with the use of PNC services (Table 5-5).
Table 5-5: Population-averaged Odds ratios (OR) and 95%CI for socioeconomic predictors of
using PNC services among Ghanaian women from the final 2-level mixed logistic regression
model.
Predictors Null model
OR (95% CI)
Final model
AOR (95% CI)
P-value
Fixed effect
Individual-level characteristics
Age (years) 1.00 (0.98, 1.01) 0.9
Religion
Muslim
Christians
2.42 (1.68, 3.49)*
1.99 (1.50, 2.63)*
<0.0001
<0.0001
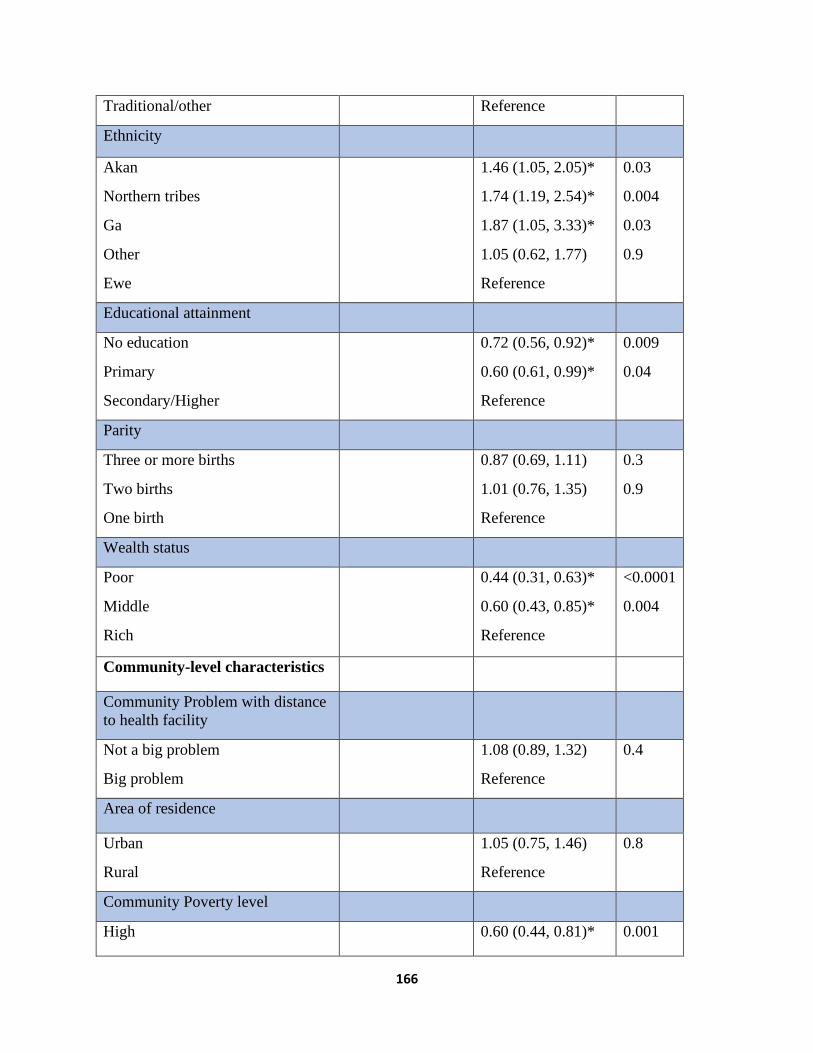
166
Traditional/other Reference
Ethnicity
Akan
Northern tribes
Ga
Other
Ewe
1.46 (1.05, 2.05)*
1.74 (1.19, 2.54)*
1.87 (1.05, 3.33)*
1.05 (0.62, 1.77)
Reference
0.03
0.004
0.03
0.9
Educational attainment
No education
Primary
Secondary/Higher
0.72 (0.56, 0.92)*
0.60 (0.61, 0.99)*
Reference
0.009
0.04
Parity
Three or more births
Two births
One birth
0.87 (0.69, 1.11)
1.01 (0.76, 1.35)
Reference
0.3
0.9
Wealth status
Poor
Middle
Rich
0.44 (0.31, 0.63)*
0.60 (0.43, 0.85)*
Reference
<0.0001
0.004
Community-level characteristics
Community Problem with distance
to health facility
Not a big problem
Big problem
1.08 (0.89, 1.32)
Reference
0.4
Area of residence
Urban
Rural
1.05 (0.75, 1.46)
Reference
0.8
Community Poverty level
High 0.60 (0.44, 0.81)* 0.001

167
Low Reference
Community Education level
Percentage of women with at least
secondary education per
community
1.01 (1.01, 1.02)* 0.001
Community unemployment level
Percentage of women without
employment per community
0.99 (0.98, 1.00) 0.5
Random effects Null model Final model
Community level variance ( 95%
CI))
1.84** ( 1.40,
2.42)
1.02 (0.73, 1.42)*
ICC (95% CI) 0.36 (0.30, 0.42) 0.24 (0.18, 0.30)*
Model fit statistics
AIC 3304.9 3146.7
BIC 3317.7 3235.8
CI, confidence interval; OR, Odds ratio; SE, Standard error; ICC, Intraclass Correlation
Coefficient; AIC, Akaike Information Criterion; BIC, Bayesian Information Criterion;
*significant at p<0.05; GDHS data 2014
5.4. DISCUSSION
This study reported a higher utilization rate of PNC services across communities than
findings of the Sakeah study team in Ghana; this discrepancy may have arisen because they
studied only two rural districts with a smaller sample size [12].
Also, this research found that the community-level variables: problems with distance to a
health facility; area of residence; and community-level unemployment level were not
significantly associated with the use of PNC services. In agreement with this research, Mohan et
al [23] reported no significant association between community-level distance to a health facility
and PNC services utilization. Also similar to this study, some researchers reported that the
168
association between use of PNC services and area of residence was not significant [25, 46]. In
addition, a study by Darega et al [47] found no significant association between employment
status and the use of PNC services. However, the results of this study are not consistent with
other studies conducted in other developing countries which found a significant association
between the use of PNC services and employment status [13]. This might be explained by the
fact that contrary to these previous studies, which were carried out at the individual level, this
study assessed community-level unemployment independent of individual level characteristics so
there is a difference in the level of analysis.
Most importantly, this study found significant variability in use of PNC services
utilization at the community level independent of individual-level characteristics. The
association between community-level poverty and use of obstetric care services has long been
established in the literature [33, 47-49]. Nonetheless, the evidence is somewhat mixed as the
results from a previous study that was conducted in the rural part of Tanzania found no
substantial association between community-level poverty and utilization of PNC services [23].
This current study adds to the body of evidence indicating that poverty at the community level
matters over and above poverty at the individual level; this finding may be explained by women
in poorer communities inability to afford indirect costs such as transportation, illegal fees being
demanded at health facilities among other costs that are often required for accessing obstetric
services [50], even though postdelivery care itself is free. Also, women from poorer communities
might suffer discrimination from health workers [51, 52], which could make them avoid further
contact with the health system including PNC services. Lastly, as expected evidence confirms
that women from richer communities face lower barriers to receiving needed maternal healthcare
[53].

169
Contrary to a study that found no significant effect of community-level education on the
utilization of PNC services [23, 49], this research identified a significant association between the
use of postnatal services and community-level education. The limited number of explanatory
variables that were used in the previous studies could explain the discrepancies in the findings
because confounding variables can potentially alter the results when they are insufficiently
controlled. The findings of this study highlight the importance of community-level education, in
that higher education means better access to health information and hence better understanding
of the benefits of maternity services, and often more autonomy to choose evidence-based
obstetric services rather than potentially harmful cultural practices [54].
Additionally, this study identified that most of the significant clusters of non-utilization
of PNC services were found in the Northern region. This result affirms the long-held notion of
spatial disparities in the utilization of obstetric care services between northern and southern
regions of Ghana [48, 55]. Similar trends have been observed by other studies on maternal health
services utilization [51, 52]. Also, this study revealed that a significant portion of the variation in
PNC services use was attributed to unobserved community-level variance like other studies
elsewhere [23, 49]. Specifically, this study found that about 24% of variability in the usage of
PNC services could be explained by unmeasured community-level characteristics.
Apart from women’s community poverty and educational level that may partially explain
the inequalities in the use of PNC services as identified in this study, this spatial and unexplained
variation in the utilization of PNC could be as a result of some potentially relevant community-
level factors for which data are not available. The geographical variation in the non-utilization
PNC services may be attributed to inadequate number of health facilities and health
professionals in the northern region as suggested the earlier Addai study [55]. Also, media

170
exposure tends to influence the community’s uptake of maternal health services including PNC
services based on previous studies [24, 33]. The differential usage of PNC services perhaps may
be due to the influential role of cultural values and practices as reported in other studies [56].
However, the GDHS data lacks variables which could be used as proxies for cultural variables
that influence maternal health-seeking behavior, and so further studies are required to unravel the
influence of community’s cultural underpinnings on the use of PNC services. Future research is
warranted to identify further community-level characteristics that could explain the unmeasured
community heterogeneity in PNC services uptake in Ghana. Notwithstanding, the link between
the community where women reside, and the use of PNC services established in this study is of
importance since it provides insight into the community-level influence to help address the
inequalities in PNC services use.
Concerning individual-level predictors, some past studies did not find significant
association between PNC services utilization and women’s age [23, 49], marital status [25],
employment status [14, 15], and parity [23] similar to the findings of this present study. In this
current research, wealth status of women was found to be significantly associated with the use of
PNC services. The odds of receiving PNC services were lower among the poor and middle-class
women than rich women. This result is consistent with findings of studies conducted in Nigeria
[20], India [28] and Bangladesh [57]. The literature seems to unequivocally suggest that
wealthier women have better access to maternal health services in general since they can afford
the ancillary costs that are related to accessing PNC services [58].
Also, some comparable studies in other developing countries reported that maternal
education significantly influences PNC service utilization [20, 23, 59]. Consistent with these
studies, this research found that lower education was negatively associated with uptake of PNC

171
services. Specifically, this study identified a lower likelihood of PNC service use among women
with no education and women with primary education relative to women with at least secondary
education. This is an expected finding and can be explained by an educated women’s higher
likelihood to be more informed about health risks and benefits which is then translated into
demand for PNC services [11]. On the other hand, less educated women may not be
knowledgeable about availability and accessibility of PNC services as well as how the health
system operates [49]. Also, these lower educated women could have less influence in decision
making about their health and this eventually affects PNC services uptake [59].
Moreover, this research revealed that religion is significantly associated with the use of
PNC services with traditional and other believers having significantly lower levels of PNC
utilization, which is consistent with the findings of a study by Ononokpono et al [20]. This study
finding may be explained by previous research’s findings that reported on the traditional cultural
practice of keeping newborns from the public due to fear of harm in the first month after their
birth [56]. To increase the uptake of PNC services among this group, the involvement of
religious leaders and home visits have been proposed by earlier studies [56, 60]. This study
suggests that the effect of religion on postnatal care use should be further investigated to better
understand the underpinnings.
Finally, some sub Saharan African studies are consistent with this research that ethnicity
is a significant predictor of PNC services utilization [20, 61]. Ethnic groups are predominantly
made up of people who share similar characteristics, and this has the potential to influence their
perception about health and ultimately women’s health seeking behavior [20, 62].
172
Study strengths and limitations
This study contributes to the growing literature on the effect of community-level factors
on the uptake of PNC services. Multilevel mixed modeling was used to ascertain the impact of
community-level factors on the use of PNC services, which is a more advanced approach to
estimating the relationships than much of the available literature. Also, this study highlighted
communities with a higher risk of not receiving PNC services for targeted interventions. Another
significant strength of this research is the use of a large nationwide population-based dataset with
a very high (97%) response rate. Despite these strengths, there are limitations in interpreting the
results. First, self-reported data can lead to information bias, which could affect accurate
classification. Recall bias could be a concern; however, information on the women’s PNC
services use was restricted to 5 years preceding the survey and hence recall bias is probably not a
major concern in this study. Also, medical need and information on quality of service received as
well as cultural variables were not available in the secondary dataset of the 2014 GDHS. This
study considered enumeration areas as communities, which may not necessary be representative
of the actual communities because they have arbitrary boundaries. The 2014 GDHS lacked
variables to examine the effect of travel time, quality of care, transportation system and cost of
travel on the use of obstetric care services [24]. For this reason, only distance to a health facility
was used in this research; relying on the response to the question of whether the distance to a
health facility was either a “big problem or not a big problem” in the survey. Also, the GPS
points taken in the 2014 GDHS were deliberately displaced randomly at a maximum of 2
kilometers and 5 kilometers in urban and rural communities respectively and seldom
repositioning at random one GPS point by 12 kilometers to ensure confidentiality and to conceal
the identity of the respondents; so it is not probable that the findings from this study would be
173
affected. Lastly, causality of the association cannot be inferred because a cross-sectional study
design was used.
5.5. CONCLUSIONS
This study generated important findings that could be used to inform policies and
programs targeted at improving uptake of PNC services and reducing inequities in utilization.
First and foremost, this research demonstrated the spatial pattern of PNC services utilization
across communities. Hotspots of non-use of PNC services were identified in this research to
guide planning and resource allocation to reduce health inequities. Though non-use of PNC
services in Ghana occurred across communities, this study revealed that this problem is more
serious in communities in the Northern region, which is an issue that requires more research to
understand and address better. The issue of geographical disparities is common in many
countries around the world and this is why the approach to understanding geographical inequities
used in this paper is relevant beyond Ghana.
Secondly, the results of this study identified community-level factors that potentially
influence women’s health-seeking behaviors. Principally, this study revealed that women who
dwell in a community with a high level of poverty have lower odds of using PNC services,
controlling for the effect of poverty at the individual level. The study findings imply that
reducing the inequality gaps in the use of PNC services require strategies beyond focusing on
individual women because there are community level effects that need to be tackled with
community-specific strategies.
174
References
1. Sines E, Syed U, Wall S, Worley H: Postnatal care: A critical opportunity to save
mothers and newborns. Policy Perspectives on Newborn Health 2007:1-7.
2. Warren C, Daly P, Toure L, Mongi P: Postnatal care opportunities for Africa
newborn. In.: Oxford: Oxford University; 2005.
3. Ronsmans C HS, Stanton C: Socioeconomic differentials in caesarean rates in
developing countries: a retrospective analysis. Lancet 2006, 368(9546):1516–1523.
4. Shaw E, Levitt C, Wong S, Kaczorowski J, Group MUPR: Systematic review of the
literature on postpartum care: effectiveness of postpartum support to improve
maternal parenting, mental health, quality of life, and physical health. Birth 2006,
33(3):210-220.
5. You D, Hug L, Ejdemyr S, Beise J: Levels and trends in child mortality. Estimates
developed by the UN Inter-agency Group for Child Mortality Estimation (IGME).
Report 2015. 2015.
6. WHO: Postnatal care for mothers and newborns. Highlights from the World Health
Organization 2013 guidelines. 2015, 4.
7. GSS: Ghana Demographic and Health Survey 2014. In.: Ghana Statistical Service
(GSS), Ghana Health Service (GHS), and ICF International; 2015.
8. Aseweh Abor P, Abekah-Nkrumah G, Sakyi K, Adjasi CK, Abor J: The socio-economic
determinants of maternal health care utilization in Ghana. International Journal of
Social Economics 2011, 38(7):628-648.

175
9. GSS: Ghana multiple indicator cluster survey with an enhanced malaria module
and biomarker with enhanced module biomarker. In.: Ghana Statistical Service
(GSS); 2011.
10. Kerber KJ, de Graft-Johnson JE, Bhutta ZA, Okong P, Starrs A, Lawn JE: Continuum of
care for maternal, newborn, and child health: from slogan to service delivery. The
Lancet 2007, 370(9595):1358-1369.
11. Titaley CR, Dibley MJ, Roberts CL: Factors associated with non-utilisation of
postnatal care services in Indonesia. Journal of Epidemiology & Community Health
2009, 63(10):827-831.
12. Sakeah E, Aborigo R, Sakeah JK, Dalaba M, Kanyomse E, Azongo D, Anaseba D,
Oladokun S, Oduro AR: The role of community-based health services in influencing
postnatal care visits in the Builsa and the West Mamprusi districts in rural Ghana.
BMC pregnancy and childbirth 2018, 18(1):295.
13. Agho KE, Ezeh OK, Issaka AI, Enoma AI, Baines S, Renzaho A: Population
attributable risk estimates for factors associated with non-use of postnatal care
services among women in Nigeria. BMJ open 2016, 6(7):e010493.
14. Nuamah GB, Agyei-Baffour P, Mensah KA, Boateng D, Quansah DY, Dobin D, Addai-
Donkor K: Access and utilization of maternal healthcare in a rural district in the
forest belt of Ghana. BMC pregnancy and childbirth 2019, 19(1):6.
15. Workineh YG, Hailu DA: Factors affecting utilization of postnatal care service in
Jabitena district, Amhara region, Ethiopia. Sci J Public Health 2014, 23:169-176.
16. Prusty RK, Buoy S, Kumar P, Pradhan MR: Factors associated with utilization of
antenatal care services in Cambodia. Journal of public health 2015, 23(5):297-310.

176
17. Kurniati A, Chen C-M, Efendi F, Berliana SM: Factors influencing Indonesian
women's use of maternal health care services. Health care for women international
2018, 39(1):3-18.
18. Fan X, Zhou Z, Dang S, Xu Y, Gao J, Zhou Z, Su M, Wang D, Chen G: Exploring
status and determinants of prenatal and postnatal visits in western China: in the
background of the new health system reform. BMC public health 2018, 18(1):39.
19. Bobo FT, Yesuf EA, Woldie M: Inequities in utilization of reproductive and maternal
health services in Ethiopia. International journal for equity in health 2017, 16(1):105.
20. Ononokpono DN, Odimegwu CO, Imasiku EN, Adedini SA: Does it really matter
where women live? A multilevel analysis of the determinants of postnatal care in
Nigeria. Maternal and child health journal 2014, 18(4):950-959.
21. Solanke BL, Amoo EO, Idowu AE: Improving postnatal checkups for mothers in
West Africa: A multilevel analysis. Women & health 2018, 58(2):221-245.
22. Worku AG, Yalew AW, Afework MF: Factors affecting utilization of skilled maternal
care in Northwest Ethiopia: a multilevel analysis. BMC international health and
human rights 2013, 13(1):20.
23. Mohan D, Gupta S, LeFevre A, Bazant E, Killewo J, Baqui AH: Determinants of
postnatal care use at health facilities in rural Tanzania: multilevel analysis of a
household survey. BMC pregnancy and childbirth 2015, 15(1):282.
24. Babalola S, Fatusi A: Determinants of use of maternal health services in Nigeria-
looking beyond individual and household factors. BMC pregnancy and childbirth
2009, 9(1):43.
177
25. Jacobs C, Moshabela M, Maswenyeho S, Lambo N, Michelo C: Predictors of antenatal
care, skilled birth attendance, and postnatal care utilization among the remote and
poorest rural communities of Zambia: a multilevel analysis. Frontiers in Public
Health 2017, 5:11.
26. Achia TN, Mageto LE: Individual and contextual determinants of adequate maternal
health care services in Kenya. Women & health 2015, 55(2):203-226.
27. Jat TR, Ng N, San Sebastian M: Factors affecting the use of maternal health services
in Madhya Pradesh state of India: a multilevel analysis. International journal for
equity in health 2011, 10(1):59.
28. Yadav A, Kesarwani R: Effect of individual and community factors on maternal
health care service use in India: a multilevel approach. Journal of biosocial science
2016, 48(1):1-19.
29. Solanke BL: Individual and community factors associated with indications of
caesarean delivery in Southern Nigeria: Pooled analyses of 2003–2013 Nigeria
demographic and health surveys. Health care for women international 2018,
39(6):697-716.
30. Ganle JK, Parker M, Fitzpatrick R, Otupiri E: Inequities in accessibility to and
utilisation of maternal health services in Ghana after user-fee exemption: a
descriptive study. International journal for equity in health 2014, 13(1):89.
31. Andersen R, Newman JF: Societal and individual determinants of medical care
utilization in the United States. The Milbank Memorial Fund Quarterly Health and
Society 1973:95-124.

178
32. Andersen RM: Revisiting the behavioral model and access to medical care: does it
matter? Journal of health and social behavior 1995:1-10.
33. Huda TM, Chowdhury M, El Arifeen S, Dibley MJ: Individual and community level
factors associated with health facility delivery: A cross sectional multilevel analysis
in Bangladesh. PloS one 2019, 14(2):e0211113.
34. Dankwah E, Kirychuk S, Zeng W, Feng C, Farag M: Socioeconomic inequalities in the
use of caesarean section delivery in Ghana: a cross-sectional study using nationally
representative data. International journal for equity in health 2019, 18(1):162.
35. Dankwah E, Zeng W, Feng C, Kirychuk S, Farag M: The social determinants of health
facility delivery in Ghana. Reproductive health 2019, 16(1):101.
36. Kulldorff M, Nagarwalla N: Spatial disease clusters: detection and inference. Statistics
in medicine 1995, 14(8):799-810.
37. Kulldorff M: Geographic information systems (GIS) and community health: some
statistical issues. Journal of Public Health Management and Practice 1999, 5(2):100-
106.
38. Aremu O, Lawoko S, Dalal K: Neighborhood socioeconomic disadvantage, individual
wealth status and patterns of delivery care utilization in Nigeria: a multilevel
discrete choice analysis. International journal of women's health 2011, 3:167.
39. Bursac Z, Gauss CH, Williams DK, Hosmer DW: Purposeful selection of variables in
logistic regression. Source code for biology and medicine 2008, 3(1):17.
40. Hosmer DW LS: Applied logistic regression New York: Wiley; 2000.

179
41. Johnston R, Jones K, Manley D: Confounding and collinearity in regression analysis:
a cautionary tale and an alternative procedure, illustrated by studies of British
voting behaviour. Quality & quantity 2018, 52(4):1957-1976.
42. Browne WJ, Subramanian SV, Jones K, Goldstein H: Variance partitioning in
multilevel logistic models that exhibit overdispersion. Journal of the Royal Statistical
Society: Series A (Statistics in Society) 2005, 168(3):599-613.
43. Merlo J, Chaix B, Ohlsson H, Beckman A, Johnell K, Hjerpe P, Råstam L, Larsen K: A
brief conceptual tutorial of multilevel analysis in social epidemiology: using
measures of clustering in multilevel logistic regression to investigate contextual
phenomena. Journal of Epidemiology & Community Health 2006, 60(4):290-297.
44. Maas CJ, Hox JJ: Sufficient sample sizes for multilevel modeling. Methodology 2005,
1(3):86-92.
45. Akaike H: A new look at the statistical model identification. In: Selected Papers of
Hirotugu Akaike. edn.: Springer; 1974: 215-222.
46. Somefun OD, Ibisomi L: Determinants of postnatal care non-utilization among
women in Nigeria. BMC research notes 2016, 9(1):21.
47. Darega B, Dida N, Tafese F, Ololo S: Institutional delivery and postnatal care services
utilizations in Abuna Gindeberet District, West Shewa, Oromiya Region, Central
Ethiopia: A Community-based cross sectional study. BMC pregnancy and childbirth
2016, 16(1):149.
48. Gayawan E: Spatial analysis of choice of place of delivery in Nigeria. Sexual &
Reproductive Healthcare 2014, 5(2):59-67.
180
49. Singh PK, Kumar C, Rai RK, Singh L: Factors associated with maternal healthcare
services utilization in nine high focus states in India: a multilevel analysis based on
14 385 communities in 292 districts. Health policy and planning 2013, 29(5):542-559.
50. Tey N-P, Lai S-l: Correlates of and barriers to the utilization of health services for
delivery in South Asia and Sub-Saharan Africa. The Scientific World Journal 2013,
2013.
51. Onah HE, Ikeako LC, Iloabachie GC: Factors associated with the use of maternity
services in Enugu, southeastern Nigeria. Social science & medicine 2006, 63(7):1870-
1878.
52. Ali AAA, Osman MM, Abbaker AO, Adam I: Use of antenatal care services in
Kassala, eastern Sudan. BMC pregnancy and childbirth 2010, 10(1):67.
53. Chama-Chiliba CM, Koch SF: Utilization of focused antenatal care in Zambia:
examining individual-and community-level factors using a multilevel analysis.
Health policy and planning 2013, 30(1):78-87.
54. Mezmur M, Navaneetham K, Letamo G, Bariagaber H: Individual, household and
contextual factors associated with skilled delivery care in Ethiopia: Evidence from
Ethiopian demographic and health surveys. PLoS One 2017, 12(9):e0184688.
55. Addai I: Determinants of use of maternal–child health services in rural Ghana.
Journal of biosocial science 2000, 32(1):1-15.
56. Winch PJ, Alam MA, Akther A, Afroz D, Ali NA, Ellis AA, Baqui AH, Darmstadt GL,
El Arifeen S, Seraji MHR: Local understandings of vulnerability and protection
during the neonatal period in Sylhet District, Bangladesh: a qualitative study. The
Lancet 2005, 366(9484):478-485.

181
57. Anwar I SM, Akhtar N, Chowdhury ME, Salma U, Rahman M, Koblinsky M.: Inequity
in maternal health-care services: evidence from home-based skilled-birth-attendant
programmes in Bangladesh. Bulletin of the World Health Organization 2008, 86:252-
259.
58. Singh L, Rai RK, Singh PK: Assessing the utilization of maternal and child health
care among married adolescent women: evidence from India. Journal of biosocial
science 2012, 44(1):1-26.
59. Mosiur Rahman M, Haque SE, Sarwar Zahan M: Factors affecting the utilisation of
postpartum care among young mothers in Bangladesh. Health & Social Care in the
Community 2011, 19(2):138-147.
60. Pradhan Y, Upreti SR, Pratap KC N, Kc A, Khadka N, Syed U, Kinney MV, Adhikari
RK, Shrestha PR, Thapa K: Newborn survival in Nepal: a decade of change and
future implications. Health policy and planning 2012, 27(suppl_3):iii57-iii71.
61. Adu J, Tenkorang E, Banchani E, Allison J, Mulay S: The effects of individual and
community-level factors on maternal health outcomes in Ghana. PloS one 2018,
13(11):e0207942.
62. Ekman B, Axelson H, Ha DA, Nguyen LT: Use of maternal health care services and
ethnicity: a cross-sectional analysis of Vietnam. Available at SSRN 993713 2007.

182
Chapter 6. Conclusions
Unraveling the socioeconomic and demographic characteristics influencing normal
delivery or by caesarean at a health facility followed by postnatal care (PNC) utilization for
reproductive-aged women [1, 2] is critical in identifying inequities in the use of obstetric services
and forming policies and interventions to improve the utilization of quality maternal healthcare
to help reduce poor maternal health outcomes. The main aim of this thesis is to examine the
inequities in the usage of obstetric care services in Ghana. Chapter 2 focused on understanding
the role of socioeconomic and demographic factors in health facility delivery. Chapter 3
examined the socioeconomic inequalities in caesarean delivery. Chapter 4 assessed the
population attributable risk (PAR) of sociodemographic factors on PNC services utilization.
Finally, in chapter 5 clusters of non-use of PNC services were identified and the impact of
community-level characteristics on the usage of PNC services was explored. This chapter
retraces the flow of thesis research, summarizes the key findings, the relevance of the findings,
limitations of the research and identifies issues for future research.
6.1. The Flow of the Research work
This research pursued four objectives that yielded four manuscript-based chapters.
Chapter 2 employed a model with a logit link function to identify individual-level
characteristics associated with delivery at a health facility. Chapter 3 used a logistic regression
model to examine the socio-economic factors that were linked to CS delivery and computed a
concentration index as a measure of the degree of inequality of CS delivery. Chapter 4 utilized a
Generalized estimating equation (GEE) with a logit link function to identify sociodemographics
that had an effect on PNC services use and estimated PAR. Chapter 5 employed spatial scan
statistics to ascertain spatial autocorrelation in the non-use of PNC services across communities
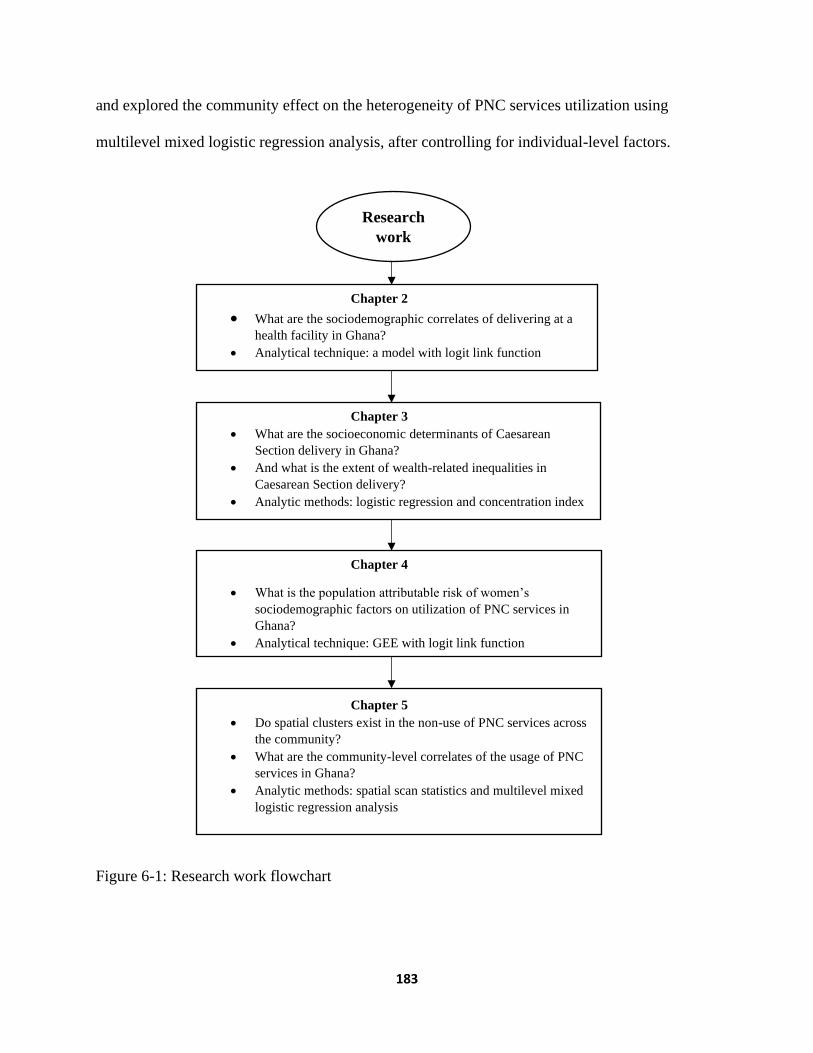
183
and explored the community effect on the heterogeneity of PNC services utilization using
multilevel mixed logistic regression analysis, after controlling for individual-level factors.
Figure 6-1: Research work flowchart
Chapter 2
• What are the sociodemographic correlates of delivering at a
health facility in Ghana? • Analytical technique: a model with logit link function
Chapter 3
• What are the socioeconomic determinants of Caesarean
Section delivery in Ghana?
• And what is the extent of wealth-related inequalities in
Caesarean Section delivery?
• Analytic methods: logistic regression and concentration index
Chapter 5
• Do spatial clusters exist in the non-use of PNC services across
the community?
• What are the community-level correlates of the usage of PNC
services in Ghana?
• Analytic methods: spatial scan statistics and multilevel mixed
logistic regression analysis
Chapter 4
• What is the population attributable risk of women’s
sociodemographic factors on utilization of PNC services in
Ghana?
• Analytical technique: GEE with logit link function
Research
work

184
6.2. Methodological Considerations
The 2014 Ghana Demographic and Health Survey dataset was analyzed and presented in all four
manuscripts comprising this dissertation. The data was obtained from the internationally
renowned Demographic and Health Survey program. The data were collected by the Ghana
Statistical Service, Ghana Health Service and the National Public Health Reference laboratory
with technical assistance from ICF international. The 2014 GDHS was funded by USAID, donor
partners and government of Ghana [3]. The 2014 GDHS had a 97% response rate and is a large
nationally representative population-based dataset. Notwithstanding, the data lacked variables on
quality of care and culture [3].
Andersen’s health behavioral model was used in this dissertation instead of other
theoretical frameworks because of the consideration of community resources and health system
characteristics in the model, in addition to the individual-level characteristics [4]. This
dissertation studied numerous socioeconomic and demographic factors. The individual-level
characteristics considered were maternal age, education level, wealth status, marital status,
religion, parity, place of residence, employment status and ethnicity. Region mostly reflects the
ethnic composition of Ghana, where different ethnic groups inhabit different regions. Hence, to
avoid collinearity issues and to ensure policy interventions are relevant; this research focuses on
the community level. Community poverty level, community high school level, community
problem with distance to a health facility, area of residence and community unemployment level
were examined.
With the permission and release of the 2014 GDHS dataset by the MEASURE DHS, this
dissertation utilized several methods: (1) multivariable logistic regression model, (2)
computation of concentration index, (3) generalised estimating equation (GEE) model, (4)

185
estimation of population attributable risk, (5) spatial scan statistics, and (6) multilevel mixed
effect regression model. To ascertain the accuracy of the parameter estimates, model diagnostics
were done including Link test, Hosmer-Lemeshow goodness of fit test, quasilikelihood (QIC)
among many others. Finally, sampling weight was applied and adjustment for clustering effect
was considered.
6.3. Summary of Findings
This thesis discusses the socioeconomic and demographic inequalities in the utilization of
obstetric services in Ghana.
Chapter 2 investigated the social determinants of birthing at a health facility [2]. The
study reports that 72% of birthing happened at a health facility in Ghana which is lower than
73.1% reported in the 2014 GDHS report [3] because this manuscript used complete case
analysis for missing data which excludes respondents with missing observations from the
analysis. The results show that place of residence, wealth status, education, religion, parity and
knowledge about pregnancy complications had significant effect on delivering at a health
facility. First, the probability of having health facility delivery was higher among urban dwellers
when compared with rural women. Second, delivery at a health facility was greater among
middle-class and rich women than the poor. Third, women who were educated were more
probable to give birth at a health facility relative to women with no education. Also, the
likelihood of first-time mothers delivering at a health facility was higher than mothers with at
least three birth experiences. Finally, the research showed that odds of delivering at a health
facility was greater among women who had knowledge of pregnancy complications than those
who were not.

186
In chapter 3, the socioeconomic characteristics of women associated with CS delivery
were examined using a large nationwide population-based dataset with enough confounding and
covariables [1]. This study has been an effort to address the methodological flaws such as
smaller sample size, small geographical focus and inadequate adjustment for confounders
identified in earlier studies in Ghana [5, 6]. The study found that the prevalence of CS delivery
was 11.4%, a figure less than the 12.8% reported in 2014 GDHS due to the utilization of
complete case analysis for missing data. However, CS delivery was higher among women in the
wealthiest quintile (27.5%) than their counterparts in the poorest quintile (5%). Besides, some
socioeconomic factors were identified to have significant association with CS delivery. This
research revealed that older women, those with secondary or higher education as well as
wealthier had a greater likelihood of having CS birth. Also, mothers with more than one birth
had a greater risk of needing CS delivery. This study found that inequalities in the utilization of
CS delivery persist in Ghana.
Contrary to the conventional methodological approach that was used in past studies
conducted in Ghana [7] to ascertain the effect of sociodemographic attributes of women on the
uptake of PNC services within 41 days after live delivery, the study in Chapter 4 recognized the
possibility of clustering in the study outcome because of the likeness of the survey answers
within a community, and so generalized estimating equation (GEE) procedure was employed.
The 2014 GDHS report [3] stated 81.1% of respondents utilized PNC services within two days
after live birth which is lower than the 84% prevalence of PNC service usage within 41 days
prior to live delivery documented in this thesis. In this study, it was observed that significant
proportion of PNC services use was attributable to sociodemographic factors including religion,
ethnicity, place of residence, wealth status, and education attainment of women. This chapter

187
reported that a significant proportion of uptake of PNC services by the study population was
independently attributable to sociodemographic factors that included Christian or Muslim faith,
wealth, residing in an urban setting, and being well educated.
Chapter 5 considered the contextual impact of women’s community on the use of PNC
services which is an extension of chapter 4. This research utilized structured methodologies: (1)
spatial scan statistics identified communities with higher risk of non-utilization of PNC services
and stated that communities with elevated levels of non-use of PNC services were
predominantly spotted in the Northern region of Ghana; and (2) two-level hierarchical model
was specified to ascertain the community-level characteristics that influence PNC services
utilization. The study findings reported a strong effect of community levels of poverty and
secondary education on the use of PNC services. Specifically, this study found that living in a
community with a substantial proportion of mothers who are poor increases the chance of not
using PNC services. Twenty-four percent of the differences in the use of PNC services due to
unexplained community variability.
Finally, two attributes among women remained significant in all 4 studies on obstetric
care utilization. Wealth status and education level were consistent predictors of inequities in the
usage of obstetric services in Ghana.
6.4. Implications of the Findings
The studies in the earlier chapters sufficiently controlled for confounders and interactions
using multivariable regression models, an important step that was lacking in previous Ghanaian
research. The new evidence from the four studies shows that the socio-economic and
demographic characteristics associated with obstetric care service use in Ghana will help tackle
the maternal and newborn health inequities at local as well as national levels [8-10]. The research

188
findings are expected to support targeted interventions to improve obstetric services utilization
and thus contribute to decreasing maternal and newborn deaths and morbidity. The results of this
study could help institute deliberate programs to promote health-seeking behavior and
community demand for obstetric care services. Moreover, the study findings could be vital for
effective monitoring and evaluation of current obstetric service interventions. Also, the study
could guide the allocation of limited resources for equitable distribution and access to maternal
health services for marginalized groups as well as underserved communities. The implications
for the studies in this thesis were articulated in chapters two through five.
In chapter 2, poorer women had lower likelihoods of having a health facility delivery,
which calls for measures to deal with the ancillary costs discouraging women from delivering at
a health facility. Second, many of the study predictors drive demand for health facility delivery
and thus projecting the importance of sociodemographic determinants of obstetric services usage
alongside improving physical accessibility.
Chapter 3 reports the discriminate use of CS delivery among both privileged and
socially disadvantaged women. The underuse of CS delivery among less privileged and the
overuse of CS delivery among women of high socioeconomic status suggest the need for equity-
oriented policies and programs, to encourage the use of this essential surgical intervention among
the vulnerable group and concurrently discouraging overuse among the advantaged group.
The significant individual-level characteristics associated with PNC services uptake
found in chapter 4 make immense contributions to the body of literature, with important
implications for policy and programs in Ghana and other developing countries. Specifically, the
findings from this research provide evidence for initiatives that focus on rural dwellers,
189
incorporate religious leaders and support poorly educated women as means to improve the
uptake of PNC services.
Chapter 5 found community-level factors that influence use of PNC services among
women of childbearing age. These community characteristics can direct allocation of resources
to minimize the inequalities in PNC usage. Furthermore, the insignificant association between
community perceived distance to a health facility and the usage of PNC services, perhaps
suggests the CHPS initiative has improved access but the spatial disparities of non-use of PNC
services particularly between communities in northern and Southern Ghana point to other
modifiable factors that could guide community-targeted interventions that can lead to all-
inclusive use of PNC services..
Ghana has achieved a marked increase in the use obstetric care services according to
findings from this dissertation when compared with previous national surveys. In addition,
modifiable factors were identified that can serve as a basis to policy formulation. This
dissertation found that maternal age had a significant effect on only CS delivery and not on place
of delivery or use of PNC. The findings are consistent with the evidence in the academic
literature indicating that age is significantly positively associated with CS delivery. Place of
residence had a strong influence on health facility delivery and PNC services use but not CS
delivery; this may be attributed to the fact that CS is at least partly driven by medical need.
Religion was also significantly associated with obstetric services use except CS delivery, which
is likely to also be driven by the fact that CS is a life saving medical intervention in many cases,
compared to receiving obstetric care services. Disparities in the use of PNC services based on
ethnicity were significant but ethnicity was not a significant factor for health facility delivery and
CS delivery; this could be attributed to some cultural practices and norms, particularly among

190
Akan and Ga people. Overall, wealth status and education of mothers were the major
determinants of obstetric care services usage (health facility delivery, CS, and PNC). Large
gradients of inequality in use of the three maternal health services based on a women’s wealth
and education levels were identified. The free universal basic education and free senior high
school policies, which were recently introduced in Ghana, should especially target girls to help
improve uptake of obstetric care services. The free maternal health services policy has been
successful in achieving huge progress and hence should be continued; however, special attention
should be given to unapproved fees that are being demanded by heath care providers, which
could be one of the reasons behind the persistent association of wealth with use of all maternal
health care services, in spite of the free health services policy. Finally, since wealth matters for
women’s health, the livelihood empowerment program that is mandated to support the poor
should be strengthen by improving its benefit package and expanding coverage.
6.5. Strengths and Limitations
This dissertation applied several robust statistical and spatial analyses methods on large
nationwide de-identified secondary dataset (2014 GDHS) to uncover the inequities in the usage
of obstetric care services in Ghana. But the study factors were captured during the survey period,
and not at the time of utilization of the obstetric care services which could lead to
misclassification bias. However, the 2014 GDHS used international standard protocols to collect
data using well-trained interviewers and hence interviewer bias was limited. As well selection
bias was not a concern in the voluntary survey because random sampling was utilized. Self-
reporting used in the survey could lead to recall bias. However, the study participants were
restricted to women with current birth within five years prior to the 2014 GDHS to limit recall

191
bias. Information bias arising from social desirability of sensitive survey questions may be a
source of worry, but privacy and confidentiality were assured for the survey participants.
Moreover, the 2014 GDHS lack data on actual medical needs, the research work in
chapter 3 used a proxy for perceived need (told about pregnancy complications) and therefore
inferences should be drawn with caution. Furthermore, whether the CS delivery was elective or
emergency and whether the caesarean section was performed at a public or private facility was
not specified in the 2014 GDHS data. Also, because of GDHS data limitations, some cultural and
quality of care factors were not studied. Only live births were considered in this dissertation due
to lack of data on stillbirths in the 2014 GDHS. This research used cluster as a community in
chapter 5 for the spatial autocorrelation identification and the multilevel mixed modeling, but this
community may not necessarily depict the actual communities in Ghana. Errors resulting from
the displacement of some of the 2014 GDHS GPS coordinates could not be excluded. This
dissertation could not assess district of residence to support targeted policies and programs
because district data were not available. Finally, causal inferences cannot be claimed because
cross-sectional data was used for this research.
6.6. Direction for future research
Further research could expand the findings on the utilization of obstetric care services in
Ghana discussed in this thesis. Future research should employ qualitative studies to investigate
cultural characteristics influencing the use of obstetric care services. In addition, culturally
sensitive studies that focus on specific groups identified in this thesis should be done to find
possible modifiable factors that are peculiar to the cohorts. Also, further studies should consider
the quality of health care variables to explain the inequalities in obstetric care services.

192
Moreover, future studies should use actual distance to provide further insight on their effect on
the use of obstetric care services because most studies including this thesis used perceived
distance to a health facility. Further research is needed to test whether delivery at public or
private health facility influence CS delivery when data becomes available. Research involving
whether the CS delivery was elective or emergency is warranted to support policy interventions
on unmet CS delivery and medically unjustified CS use. Finally, future studies could employ
longitudinal studies to elucidate the study characteristics associated with the utilization of
obstetric care services to strengthen the findings from this thesis and limit misclassification due
to self-reporting.
References
1. Dankwah E, Kirychuk S, Zeng W, Feng C, Farag M: Socioeconomic inequalities in the
use of caesarean section delivery in Ghana: a cross-sectional study using nationally
representative data. International journal for equity in health 2019, 18(1):162.
2. Dankwah E, Zeng W, Feng C, Kirychuk S, Farag M: The social determinants of health
facility delivery in Ghana. Reproductive health 2019, 16(1):101.
3. GSS: Ghana Demographic and Health Survey 2014. In.: Ghana Statistical Service
(GSS), Ghana Health Service (GHS), and ICF International; 2015.
4. Andersen RM: Revisiting the behavioral model and access to medical care: does it
matter? Journal of health and social behavior 1995:1-10.
5. Apanga PA, Awoonor-Williams JK: Predictors of caesarean section in Northern
Ghana: a case-control study. Pan African Medical Journal 2018, 29(1):1-11.
6. Manyeh AK AA, Akpakli DE, Williams J, Gyapong M: Socioeconomic and
demographic factors associated with caesarean section delivery in Southern Ghana:

193
evidence from INDEPTH Network member site BMC pregnancy and childbirth 2018,
18(1):405.
7. Sakeah E, Aborigo R, Sakeah JK, Dalaba M, Kanyomse E, Azongo D, Anaseba D,
Oladokun S, Oduro AR: The role of community-based health services in influencing
postnatal care visits in the Builsa and the West Mamprusi districts in rural Ghana.
BMC pregnancy and childbirth 2018, 18(1):295.
8. Filippi V, Ronsmans C, Campbell OM, Graham WJ, Mills A, Borghi J, Koblinsky M,
Osrin D: Maternal health in poor countries: the broader context and a call for
action. The Lancet 2006, 368(9546):1535-1541.
9. Koblinsky M, Matthews Z, Hussein J, Mavalankar D, Mridha MK, Anwar I, Achadi E,
Adjei S, Padmanabhan P, van Lerberghe W: Going to scale with professional skilled
care. The Lancet 2006, 368(9544):1377-1386.
10. Ronsmans C, Graham WJ, group LMSSs: Maternal mortality: who, when, where, and
why. The lancet 2006, 368(9542):1189-1200.
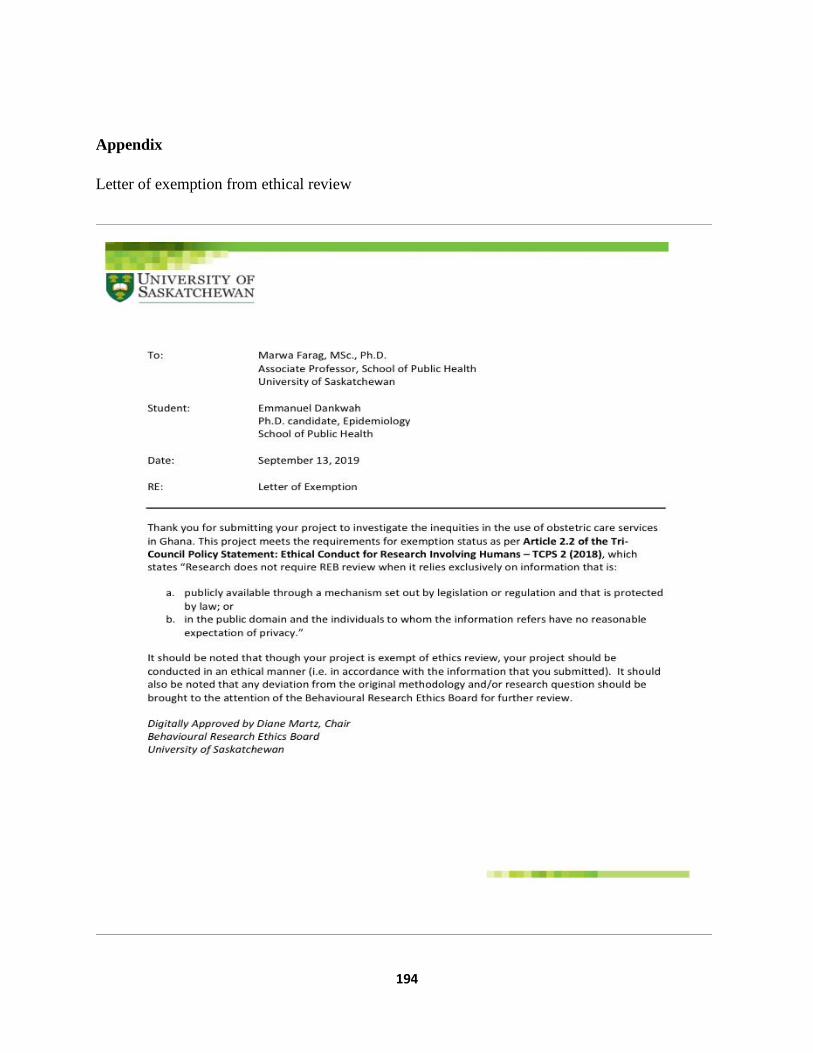
194
Appendix
Letter of exemption from ethical review