inequalities - macmillan/mcgraw-hill much money each friend collected. the mean amount earned was...
TRANSCRIPT

690

691
5.02b Inequalities (Use after Lesson 6-6)
4.01d Mean (Use after Lesson 7-1)
4.01b Stem-and-Leaf Plots (Use after Lesson 7-7)
4.01b Select an Appropriate Display (Use after Lesson 7-7)
2.03 Elapsed Time (Use after Lesson 11-7)
ContentsNC SCS

692
Recall that an equation is a number sentence containing an equals sign, showing that two expressions are equal. An inequality is a number sentence containing an inequality symbol showing that two expressions may not be equal. These inequality symbols are �, �, �, and �.
In Lesson 1-2, you used �, �, and � to compare whole numbers. Inequalities can also be used to compare a number to a variable such as x � 7 or a � 5.
Rashid used a number line to graph his four math scores. Then he wrote the following statements comparing his test scores.
79 � 82 84 � 82 90 � 84
Inequalities
Key ConceptInequalities
Words is less than is greater than is less than or equal to
is greater than or equal to
Symbols � � � �
MAIN IDEAI will write inequalities and determine if a number is a solution of an inequality.
5.02 b) Demonstrate an understanding of equality and inequality.
New Vocabulary inequality
macmillanmh.com• Extra Examples• Personal Tutor• Self-Check Quiz
EXAMPLES Write an Inequality
Use a variable to write an inequality for each sentence.
Daria’s age is less than 10. Let the variable d represent Daria’s age. Choose the symbol � to represent the phrase is less than.
An inequality is d � 10.
Jason’s biking speed is greater than or equal to 8 miles per hour. Let the variable s represent Jason’s biking speed. Choose the symbol � to represent the phrase is greater than or equal to.
An inequality is s � 8.
1
2
78 80 82 84 86 88 90
79 82 84 90
NC Math Online
NC SCS

3
Inequalities 693
EXAMPLE Solution of an Inequality
Given the inequality x > 11, determine whether x = 9 is a solution.
x � 11 Write the inequality.
9 � 11 Replace x with 9.
9 ≯ 11 Determine if the inequality is true or false. Nine is not greater than 11.
The sentence is false, so 9 is not a solution of the inequality.
A balance scale can be used to demonstrate an inequality. On the balance scale below, a cup containing an unkown number of counters is placed on the left scale. Three postive counters are placed on the right scale.
Note that the left side of the scale weighs more than the right scale. So, x�� 3. The number of counters in the cup is greater than 3.
Check possible values of x.
x � 3 Write the inequality.
2 � 3 No
3 � 3 No
4 � 3 Yes
5 � 3 Yes
6 � 3 Yes
So, the solution of the ineqality is any number greater than 3.
If two postive counters are added to each side of the balance scale, note that the left scale still weighs more than the right scale. So, x � 2 � 5.
Check possible values of x.
x � 2 � 5 Write the inequality.
2 � 2 � 5 No
3 � 2 � 5 No
4 � 2 � 5 Yes
5 � 2 � 5 Yes
6 � 2 � 5 Yes
Possible values of x include 4, 5, and 6 but do not include 2 and 3. So, the solution of the inequality x � 2�� 5 is x � 3.
Note that the possible values of x did not change when the same number of counters are added to each side.
You can use substitution to determine if a certain value is a solution of an inequality.
x ���
x �������

4
694
EXAMPLE Solution of an Addition Inequality
Given the inequality a � 3 � 5, determine whether a � 2 is a solution.a � 3 � 5 Write the inequality.
2 � 3 � 5 Replace a with 2.
5 � 5 Simplify. Determine if the inequality is true or false.
Although the inequality 5 � 5 is false, the equation 5 � 5 is true. So, 2 is a solution of the inequality.
Use a variable to write an inequality for each sentence. See Examples 1–2 (p. 692)
1. Your height is greater than 4 feet.
2. The car’s speed is less than 50 miles per hour.
3. Children under the age of 3 are admitted free.
4. A package must be less than or equal to 20 pounds.
Determine whether the given value of the variable is a solution of each inequality. Write yes or no. See Examples 3–4 (pp. 693–694)
5. x � 7; x � 5 6. b > 3; b � 2 7. w � 13; w � 10
8. b � 1 � 6; b � 7 9. s � 4 � 1; s � 5 10. 5x � 15; x � 2
11. You must be 36 inches or taller to ride a certain ride at an amusement park. Use the symbol � to write an inequality for this situation.
Use a variable to write an inequality for each sentence. See Examples 1–2 (p. 692)
12. Your age is greater than 9.
13. The runner’s speed is less than 6 miles per hour.
14. A package must be less than or equal to 5 pounds.
15. The cost must be less than $15.
16. The test score must be greater than or equal to 85%.
17. The baker must bake 200 or more muffins.

Inequalities 695
Determine whether the given value of the variable is a solution of each inequality. Write yes or no. See Examples 3–4 (pp. 693–694)
18. c � 2; c � 1 19. h � 8; h � 7 20. p � 9; p � 9
21. x � 2; c � 1 22. b � 5; b � 4 23. t � 20; t � 22
24. n � 2 � 5; n � 5 25. d � 1 � 10; d � 10 26. 2y � 13; y � 7
27. h � 7 ��18; h���8 28. 4s � 8; s � 2 29. x � 5 ����; x � 20
30. A first class letter must be less than or equal to 1 ounce in weight for a single first class stamp to be required. Use the symbol � to write an inequality for this situation.
31. Over the summer, Kayla must spend at least 60 minutes a week reading. Use the symbol � to write an inequality representing the time Kayla must spend reading each week.
32. An elevator has a sign that the maximum weight is 2,000 pounds. Use the symbol � to write an inequality for this situation.
33. In North Carolina, you can get a driver’s license if you are at least 16 years old. Use the symbol � to write an inequality for the age of drivers in North Carolina.
34. OPEN ENDED Describe a si tuation that could be represented by the inequality x � 10.
35. FIND THE ERROR Sophia and Marvin are writing an inequality for the expression two hours or more of homework. Who is correct? Explain.
������
��–<��Marvin
h >– 2
36. CHALLENGE Write an inequality to represent the following sentence. Then give a number that is a solution of the inequality.
Five more than a number is greater than or equal to eight.
37. Explain the difference in n � 5 and n � 5.

MAIN IDEAI will use the mean to describe a set of data.
4.01 d) Explore the mean as a measure of center and its interpretation as a fair share.
New Vocabulary measures of center
macmillanmh.com• Extra Examples• Personal Tutor• Self-Check Quiz
1
696
Four friends set up lemonade stands in four different locations throughout their neighborhood. The table shows how much money each friend collected. The mean amount earned was $6.
CIVICS Find the mean number of Representaives for the four states shown in the pictograph.
EXAMPLE Find the Mean
Mean
Lemonade Stand EarningsCarter $4
Kasha $7
Madeline $9
Thomas $4
METHOD 1 Move the figures.
2007 Representatives to U.S. Congress���������
��������
��������
��������������
���������
��������
��������
��������������
2007 Representatives to U.S. Congress
In Lesson 7-1, you learned how to find the mean, median, and mode of a data set. These three measures are called measures of center because they describe the center of a data set. The mean is also called the average because it represents the average value of a data set if each data value is distributed equally. Because the mean is the sum of the data values divided by the number of pieces of data, the mean represents a fair share of the data values.
You can find the mean of data represented in a graph to give a fair measure of center of the data.
Move the figures to equally distribute the total number of Representatives among the four states.
NC Math Online
NC SCS

2
Mean 697
Sabrina collected 12 pieces of candy from a piñata. Meagan collected 15 pieces of candy, and Kim collected 18 pieces of candy. The three friends decided to combine their candy and split it evenly among them so that they each had a fair share. How many pieces of candy will each girl receive?
EXAMPLE Distribute Data Fairly
To find the amount candy each girl will receive, find the mean of the data.
12 � 15 � 18 � 45 Find the sum of the data.
45 � 3 � 15 Divide by the number of girls.
So, each girl will receive 15 pieces of candy.
Find the mean of the data represented in each model. See Example 1 (p. 696)
1.
EliseGloriaMaxwellToby
Number of Pairs of Shoes 2. Hours Spent Reading
02468
101214
Aida Dante Nicholas Rosa TylerStudent
Num
ber o
f Hou
rs
METHOD 2 Write and simplify an expression.
������������������������������ ��
� ������������������ Simplify.
������������������������������������������������������
←�sum of the data←�number of data items
Friend PointsAlly 105
Brandon 135
Lucy 170
Miko 120
Ruben 95
3. The table shows the number of points each of five friends received while playing games at an arcade. The points can be redeemed for prizes. The friends decided to combine the points and then split them equally amongst themselves. How many points will each friend receive to use for prizes?

698
Find the mean of the data represented in each model. See Example 1 (p. 696)
4. Number of Siblings
Elise
Juan
Maggie
Patrick
Tyron
5.
Num
ber o
f Boo
ks
02468
StudentCollinJordanNina Brianna Chen
Books Checked Out of Library
For Exercises 6–8, use the table at the right. It lists the greatest depths of the oceans. See Example 2 (p. 697)
6. What is the mean of the data?
7. Which data value is farthest away from the mean than the other data values?
8. Describe how including this data value in the calculation of the mean affects the mean’s interpretation as a fair share of the data.
9. The graphic at the right shows the 5-day forecast as shown on the local news. What is the difference between the mean high and mean low temperatures for the 5-day period? Justify your answer.
10. Refer to Exercise 3. Suppose a sixth friend, Antwon, was included. If Antwon received 155 points, how many points would each friend receive if they split the number of points equally amongst themselves?
11. The table shows the amount of money Quentin earns for mowing 5 different lawns in his neighborhood. His friend asked him the average amount of money he receives for mowing a lawn. What amount should Quentin tell his friend?
Ocean Depth (ft)Pacific 15,215
Atlantic 12,881
Indian 13,002
Arctic 3,953
Southern 14,749
��������������������������
���
�����
���
�����
���
����������������
���
������������
���
�������
Lawn Earnings ($)1 10
2 18
3 13
4 15
4 9

Mean 699
15. FIND THE ERROR The graph at the right shows the number of songs that five students downloaded from the Internet. Byron and Dimitri both found the mean of the data in the bar graph. Who is correct? Explain.
�����
���+ ���+ ��+ ��+ �������
� �= �������
Dimitri
10�+ 14�+ 10�+ 6�+ 8�����5
� �= 9.6 songs
16. The table shows the number of students in each fifth grade homeroom at Dartwell Elementary. For the school field day, the teachers want each homeroom to have the same number of students. Explain what the teachers can do so that each homeroom has a fair number of students participating in the events.
Number of Students in Fifth Grade Homerooms
24 28 25
27 26 26
�������� The table at the right shows the monthly average high temperatures in Greensboro, North Carolina.
12. What temperature could describe the average high during the summer (June, July, and August) in Greensboro?
13. What temperature could describe the average high temperature during the winter months (December, January, and February)?
14. Daniel’s grandparents spend October through February in Greensboro. What is the average high temperature during these months?
Real-World PROBLEM SOLVING
Average High Temperature, Greensboro, North Carolilna
Month Temperature (°F)January 47
February 52
March 60
April 70
May 77
June 84
July 88
August 86
September 79
October 70
November 60
December 51
Number of Songs Downloaded
02468
101214
Alvin Claire Nate Parker SallyStudent
Num
ber o
f Son
gs

1
MAIN IDEAI will make and interpret stem-and-leaf plots.
4.01 b) Collect, organize, analyze, and display data using various representations, including stem-and-leaf plots.
New Vocabulary stem-and-leaf plots
stems
leaves
key
You can use a stem-and-leaf plot to organize large data sets so that they are easier to analyze and interpret. In a stem-and-leaf plot, the data are ordered from least to greatest and organized by place value.
• The leaf is the last digit of the number.
• The other digits to the left of the leaf form the stem.
For the numbers 21, 24, 35, and 38, 2 and 3 are the stems. The numbers 1, 4, 5, and 8 are the leaves.
INSTANT MESSAGING Make a stem-and-leaf plot of the data in the table.
Step 1 Order the data from least to greatest.
Step 2 Draw a vertical line and write the tens digits from least to greatest to the left of the line. These digits form the stems. Since the least value is 2 and the greatest value is 45, the stems are 0, 1, 2, 3, and 4.
Step 3 Write the ones digits in order to the right of the line with the corresponding stem. The ones digits form the leaves.
EXAMPLE Construct a Stem-and-Leaf Plot
Stem-and-Leaf Plots
NC SCS
Math Test ScoresStem Leaf
789
10
45 76 60 8 ��5 � 85
Number of Instant MessagesSent Each Day for 21 Days
35 21 14 32 25 10 5
27 12 33 20 45 21 31
17 24 21 27 2 3 7
The stem-and-leaf plot at the right shows scores from a math test. The plot shows that the test scores were 74, 85, 87, 96, 96, and 100. The information can be used to find the mean, median, and mode.
Mean 74 � 85 � 87 � 96 � 96 � 100 � 538 � 6 � 89.7
Median 87 � 96 � 183 � 2 � 91.5
Mode 96
You can construct a stem-and-leaf plot from data given in a table.
700

2
3
Stem-and-leaf plots are useful in analyzing data because you can see all the data values, including the greatest and least.
WATERFALLS The stem-and-leaf plot shows the approximate height of the twenty tallest waterfalls in the world. Write a few sentences that analyze the data.
Real-World EXAMPLEAnalyze Plots
The tallest waterfall in the world is about 980 meters. Two of the waterfalls listed are about 490 meters tall. Half of the waterfalls are at least 610 meters tall.
CHESS The stem-and-leaf plot shows the number of chess matches won by members of the Avery Middle School Chess Team. Find the range, median, and mode of the data. Then a few sentences describing the data.
EXAMPLE Describe Data
range greatest wins � least wins � 61 � 8 or 53
median middle value, or 35 wins
mode most frequent value, 40
The data ranges from 8 wins to 61 wins. The most frequently occurring number of wins was 40. Half of the number of wins was less than 35 and half of the number of wins was greater than 35.
Number of Instant Messages Sent Each Day for 21 Days
Stem Leaf01234
2 3 5 70 2 4 70 1 1 1 4 5 7 71 2 3 55 2 ��7 � 27 text messages
Step 4 Include a key that explains the stems and leaves.
In these data, the tensdigits form the stems. The ones digits of the
data form the leaves.
You can describe the data that is displayed in a stem-and-leaf plot by first finding the range, median, and mode of the data.
Approximate Height of the 20 Tallest World Waterfalls
Stem Leaf456789
6 7 9 90 3 6 80 1 1 5 60 4 6 705 8 4 � 6 � 460 meters
Chess Matches Won
Stem Leaf0 8 8 91 92 0 0 2 4 4 8 93 1 1 2 4 5 5 6 6 7 7 84 0 0 0 3 8 95 2 46 1 3 | 2 = 32 wins
Stem-and-Leaf Plots 701

Make a stem-and-leaf plot of each set of data. See Example 1 (pp. 700–701)
1. minutes spent on homework: 37, 28, 25, 29, 31, 45, 32, 31, 46, 39
2. miles traveled to reach weekend vacation destination: 81, 76, 55, 90, 71, 80, 83, 85, 79, 99, 70, 75, 70, 92
For Exercises 3–5, use the stem-and-leaf at the right. See Examples 1–3 (pp. 700–701)
3. How many snack foods listed have more than 250 Calories?
4. How many Calories are in the snack food listed with the most number of Calories?
5. Write a few sentences that analyze the data.
Make a stem-and-leaf plot of each set of data. See Examples 1–3 (pp. 700–701)
6. bus ride in minutes: 24, 14, 25, 28, 47, 13, 9, 17, 30, 35, 16, 39
7. video game score: 53, 64, 15, 22, 16, 42, 12, 38, 68, 63, 23, 35, 30, 33, 34, 35
8. calories per serving: 62, 65, 67, 67, 62, 67, 51, 73, 72, 70, 63, 72, 78, 61, 54
9. test scores: 76, 82, 70, 93, 71, 80, 63, 73, 90, 92, 74, 79, 82, 91, 95, 93, 75
For Exercises 10 and 11, For Exercises 12 and 13,use the plot below. use the plot below. World’s Longest Tunnels
Stem Leaf6789
101112131415
3 8 9 90 10 7
22
2 6 ��3 � 6.3 mi
Shows Performed by the Top 25 Musical Tours
Stem Leaf23456789
3 4 58 83 3 30 1 2 5 6 6 970 3 3 5 5 70 59 3 ��8 � 38 shows
Number of Calories in Selected Snack Foods
Stem Leaf2425262728
0 4 4 80 0 5 7 84 554 24 � 4 � 244 Calories
702
10. How long is the world’s longest tunnel?
11. Write a few sentences that analyze the data.
12. How many tours performed more than 50 shows?
13. Write a few sentences that analyze the data.

Points ScoredTigers Stem Eagles
8 4 26 5
8 7 4 09 8 6 0
5 ��4 � 54 points
5678
0 3 4 8 82 6 70 2 52 5 ��0 � 50 points
For Exercises 14 and 15, use the back-to-back stem-and-leaf plot at the right and the information below.
A back-to-back stem-and-leaf plot can be used to compare two sets of data. The leaves for one set of data are on one side of the stem and the leaves for the other set of data are on the other side of the stem.
14. How many games were there in which the Tigers scored more than 75 points? the Eagles?
15. Write a few sentences comparing the points scored by each team. Include the median, mode, and range of the points scored by each team in your comparison.
Display each set of data in a stem-and-leaf plot. Then write a few sentences describing each set of data.
16. Quiz Scores (%)
70 96 72 91
80 80 79 93
76 95 73 93
90 93 77 91
17. Low Temperatures (�F)
15 13 28 32 38
30 31 13 36 35
38 32 38 24 20
18. Floats at Annual Parade
151 158 139 103
111 134 133 154
157 142 149 159
19. School Play Attendance
225 227 230 229
246 243 269 269
267 278 278 278
REASONING For Exercises 20–22, use the stem-and-leaf plot at the right which shows the number of Tour de France titles won by eleven countries.
20. Find the range of titles won.
21. Find the median and mode of the data.
22. Which measure of central tendency is most affected by the outlier?
23. OPEN ENDED The scores for 10 girls in a gymnastics event are 9.3, 10.0, 9.9, 8.9, 8.7, 9.0, 8.7, 8.5, 8.8, and 9.3. Analyze a stem-and-leaf plot of the data to draw two conclusions about the scores.
24. Display the height, in inches, of your classmates in a stem-and-leaf plot. Then write a few sentences that analyze the data.
Tour de France Titles Won by Eleven Countries
Stem Leaf0 1 1 1 2 2 4 8 91 0 823 6 0 | 4 � 4 titles
Stem-and-Leaf Plots 703

1
704
EXAMPLE Choose Between Displays
SOCCER Which display allows you to see whether the team’s record of wins has steadily improved since 2001?
The line graph shows the change in games won from season to season, revealing some declines in the number of wins.
Data can often be displayed in several different ways. The display you choose depends on your data and what you want to show.
The displays show the maximum speed of eight animals. In which display is it easier to find the range of the data?
15
20
10
0
5
30
35
40
45
25
Spee
d (m
iles
per h
our)
50
Animal
Cat
Elephan
t ElkRab
bit
Reindee
r
Squirre
l
Wild Tu
rkey
Zebra
�������������������������
Maximum Speed of Animals Maximum Speed of Animals
Stem Leaf1234
2 550 2 50 5 3�0 � 30 mi/h
Select an Appropriate Display
MAIN IDEAI will make and interpret stem-and-leaf plots.
4.01 b) Collect, organize, analyze, and display data using various representations, including stem-and-leaf plots.
macmillanmh.com• Extra Examples• Personal Tutor• Self-Check Quiz
’01 ’02 ’03 ’04 ’05 ’06 ’07 ’08
6
8
Tota
l Gam
es W
on
10
12
16
14
Season
0
Girls Soccer Team
� � �� �� �� �� ��
× × ××
××
××
NC Math Online
NC SCS

Select an Appropriate Display 705
���������������Statistical DisplaysType of Display Best Used to
Bar Graph show the number of items in specific categories
Line Graph show change over a period of time
Line Plot show how many times each number occurs in the dataStem-and-Leaf Plot list all individual numerical data in a condensed form
You can select an appropriate display from the types of displays you have learned: bar graph, line graph, line plot, or stem-and-leaf plot.
Favorite Shampoo Survey
Brand Responses Brand Responses
A 35 D 24
B 12 E 8
C 42 F 11
MARKETING A market researcher conducted a survey to compare different brands of hair shampoo. The table shows the number of first-choice responses for each brand. Select an appropriate type of display to compare the number of responses for each brand of shampoo.
These data show the number of responses for each brand. A bar graph would be the best display to compare the responses.
Real-World EXAMPLE Select an Appropriate Display
2
Once you have selected an appropriate display, you can make that display from the set of data.
The Concept Summary box below summarizes the situations in which it is most appropriate to use various types of displays.
Make the appropriate display of the data from Example 2 above.
Step 1 Draw and label horizontal and vertical axes. An interval of 0 to 45 responses can be used along the vertical axis. Add a title.
Step 2 Draw a bar to represent the number of responses for each brand.
EXAMPLE Make an Appropriate Display
E FDCBA
15
20
10
0
5
30
35
40
25
Num
ber o
f Res
pons
es45
Brand
����������������������������
3
706
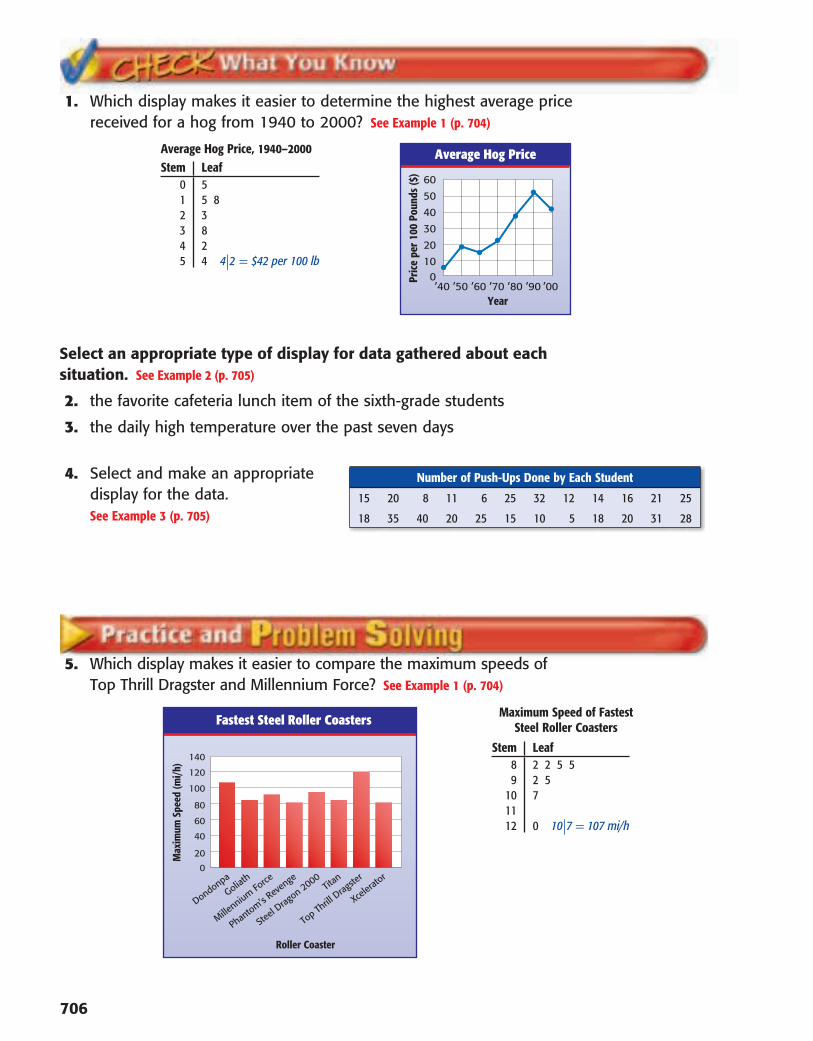
1. Which display makes it easier to determine the highest average price received for a hog from 1940 to 2000? See Example 1 (p. 704)
Average Hog Price, 1940–2000Stem Leaf
012345
55 83824 4�2 � $42 per 100 lb
’40 ’50 ’60 ’70 ’80 ’90 ’00
10
20
30
40
Pric
e pe
r 100
Pou
nds
($)
50
60
Year
0
�����������������
Select an appropriate type of display for data gathered about each situation. See Example 2 (p. 705)
2. the favorite cafeteria lunch item of the sixth-grade students
3. the daily high temperature over the past seven days
4. Select and make an appropriate Number of Push-Ups Done by Each Student
15 20 8 11 6 25 32 12 14 16 21 25
18 35 40 20 25 15 10 5 18 20 31 28
display for the data. See Example 3 (p. 705)
5. Which display makes it easier to compare the maximum speeds of Top Thrill Dragster and Millennium Force? See Example 1 (p. 704)
60
80
40
0
20
120
100
Max
imum
Spe
ed (m
i/h) 140
Roller Coaster
Dondonpa
Goliath
Millennium Fo
rce
Phantom’s R
even
ge
Steel
Dragon 2000
Titan
Top Th
rill D
ragste
r
Xcele
rator
����������������������������� Maximum Speed of Fastest Steel Roller Coasters
Stem Leaf89
101112
2 2 5 52 57
0 10�7 � 107 mi/h

Select an Appropriate Display 707
13. REASONING Determine whether the following statement is true or false. If true, explain your reasoning.
Any set of data can be displayed using a line graph.
14. Write about a real-world situation in which you would have to choose an appropriate display for a set of data.
6. Which display makes it easier to see how many times the winning distance of the javelin throw was 90 meters? See Example 1 (p. 704)
Select an appropriate type of display for data gathered about each situation. See Example 2 (p. 705)
7. the amount of sales a company has for each of the past 6 months
8. the test scores each student had on a language arts test
9. the prices of five different brands of tennis shoes at an athletic store
10. Abigail’s height on her birthday over the past 10 years
11. Display the data in the bar graph at the right
Num
ber o
f Nei
ghbo
rs
0
2
4
6
8
10
12
14
16
Country
Rep. ofCongo
Germany China Sudan
���������������������������������
����������������������������
using another type of display. Compare the advantages of each display.
12. Use the Internet or another source to find a set of data that is displayed in a bar graph, line graph, stem-and-leaf plot, or line plot. Was the most appropriate type of display used? What other ways might these same data be displayed?
84 85 86 87 88 89 90 91 92 93 94 95
× × × ××
××××
× ’68 ’76 ’84 ’92 ’00
82
84
86
88
Gold
Med
al D
ista
nce
(met
ers)
90
9294
96
Year
0
���������������������������

MAIN IDEAI will solve problems involving elapsed time on a calendar.
2.03 Solve problems using the concepts and procedures involving elapsed time.
macmillanmh.com• Extra Examples• Personal Tutor• Self-Check Quiz
Calendars are used to represent the length and divisions of a year. They are separated into 12 months
1. On the calendar at the right, what day of the week is March 12?
2. Suppose you have piano practice on Wednesday afternoons. How many days in March will you have piano practice?
3. What is the date of the second Friday in March?
Elapsed Time
You can use numbers on a calendar to determine elapsed time. If you move down 1 row on a calendar, you can count 1 week, or 7 days.
708
Real-World EXAMPLES Find Elapsed Time
1 Cody’s soccer season begins on September 3 and ends on November 8. How many weeks and days does Cody’s soccer season last?
First count the weeks. Start on Wednesday, September 3, and count the weeks until Wednesday, November 5. This is 9 weeks.
Then count the days until you get to November 8. This is 3 days.
So, Cody’s soccer season lasts for 9 weeks and 3 days.
���
5121926
���
6132027
���
7142128
���
18152229
���
29162330
���
3101724
���
4111825
March
���
5121926
���
6132027
���
7142128
���
18152229
���
29162330
���
3101724
���
4111825
September
���
5121926
���
6132027
���
7142128
���
18152229
���
29162330 31
���
3101724
���
4111825
October
���
5121926
���
6132027
���
7142128
���
18152229
���
29162330
���
3101724
���
4111825
November
NC Math Online
NC SCS

For Exercises 1 and 2, use the calendars below. See Examples 1–3 (pp. 708–709)
1. Sun-Li joined the swim team over the summer. The swim season starts on June 14 and ends on August 6. How many weeks and days does the swim season last?
2. Mateo is working at an ice cream parlor ever Saturday and Sunday over the summer. His first day of work is Saturday, June 5. His last day of work is Sunday, August 23. How many weekends did Mateo work at the ice cream parlor over the summer?
Elapsed Time 709
2 The Maxwell family left on a 9-day vacation on Saturday, June 13. On what date and day of the week will they return?
Add 13 to 9 to determine the date of their return. 9 � 13 � 22
They will return on June 22.
Seven days after the date they left will be another Saturday. So, two more days after that will be a Monday.
So, the Maxwells will return on Monday, June 22.
Real-World EXAMPLE Patterns and Elapsed Time
3 Chen is training to run a race. The table below gives the number of miles he will run in 6 weeks. How many miles will he run in all during his training?
Make a table to show the number of miles Chen runs each week.
Week 1 2 3 4 5 6
Miles 2 4 6 8 10 12
Add the number of miles from each week.
2 � 4 � 6 � 8 � 10 � 12 � 42
So, Chen will run a total of 42 miles during his training.
Sun
5121926
Mon
6132027
Tue
7142128
Wed
18152229
Thu
29162330
Fri
3101724
Sat
4111825
June
Sun
5121926
Mon
6132027
Tue
7142128
Wed
18152229
Thu
29162330
Fri
3101724
Sat
4111825
July
Sun
5121926
Mon
6132027
Tue
7142128
Wed
18152229
Thu
29162330 31
Fri
3101724
Sat
4111825
August

3. Carlos turned 11 years old on Tuesday, February 8. Ten days later, his sister turned 8 years old. What is the date of Carlos’ sister’s birthday? What day of the week is this?
4. Caroline spends 2 minutes reading on Sunday, 4 minutes reading on Monday, and 8 minutes reading on Tuesday. She continues to double the amount of time she spends reading for the next four days of the week. How many minutes will Caroline spend reading during the week?
For Exercises 5–9, use the calendars below. See Examples 1–3 (pp. 708–709)
5. The ski club goes to the local ski slopes every Thursday afternoon from January 8 to March 4. How many times does the ski club go to the slopes?
6. Opening night of the school musical is March 19. Rehearsal begins on January 19. How many weeks and days will the performers have to practice?
7. Adriana’s grandparents left for vacation on January 4. They will be on vacation for 12 days. When will Adriana’s grandparents return from their vacation?
8. Mr. Rollins has to go to physical therapy once a week for 6 weeks. His first appointment is on January 9. What will be the date of his last appointment?
9. The school cookie dough sale starts on March 2 and ends on March 27. How many weeks and days does the cookie dough sale last?
10. The sign at the right shows the dates the school cafeteria will have pizza from a local pizzeria for lunch this quarter. How many weeks pass by between the second and third pizza days of the quarter?
11. In 1927, Babe Ruth hit 60 home runs as a New York Yankee. He hit his first home run of the season on April 15. He hit his second home run of the season 8 days later. What was the date of his second home run of the 1927 season?
710
September 12October 6October 27November 19
���
5121926
���
6132027
���
7142128
���
18152229
���
29162330 31
���
3101724
���
4111825
January
���
5121926
���
6132027
���
7142128
���
181522
���
291623
���
3101724
���
4111825
February
���
5121926
���
6132027
���
7142128
���
18152229
���
29162330 31
���
3101724
���
4111825
March

Elapsed Time 711
12. Alexis was eleven years old on November 13. Her friend was eleven years old on November 27. How many days older is Alexis than her friend? How many weeks older is Alexis?
17. OPEN ENDED Write a beginning date and an ending date so that the elapsed time is 3 weeks 5 days.
18. CHALLENGE Jonah is saving money to buy a new video game. The first week he saves $1, the next week he saves $3, and the following week he saves $5. He is going to continue to save $2 more than he saved the previous week. If the video game he wants to buy costs $50, after how many weeks will Jonah have enough money saved?
19. Use the calendars in Exercises 5-9. Write a problem that can be solved by finding elapsed time on the calendars.
���������� Tomato plants can be started from a seed indoors and then transferred to an outside garden when the weather is appropriate.
13. Sonya planted tomato seeds inside on April 1. Ten days later seedlings emerged. What was the date when the seedlings emerged?
14. Sonya transferred the tomato plants to her outdoor garden 6 weeks after she first planted them inside. What was the date when Sonya transferred the plants?
15. The first tomato was ready to eat on June 29. How many weeks and days was this after Sonya planted the seeds?
16. If Sonya wanted the first tomato to be ready to eat by June 23, when should she have planted the seeds inside?
Real-World PROBLEM SOLVING
���
5121926
���
6132027
���
7142128
���
18152229
���
29162330
���
3101724
���
4111825
April
���
5121926
���
6132027
���
7142128
���
18152229
���
29162330 31
���
3101724
���
4111825
May
���
5121926
���
6132027
���
7142128
���
18152229
���
291623
3130
���
3101724
���
4111825
June