industry surveys - wordpress.com€¦ · · 2014-05-292014-05-29 · industry trends ... global...
TRANSCRIPT

Current Environment ............................................................................................ 1
Industry Profile .................................................................................................... 11
Industry Trends ................................................................................................... 11
How the Industry Operates ............................................................................... 21
Key Industry Ratios and Statistics ................................................................... 30
How to Analyze a Biotechnology Company ................................................... 32
Glossary ................................................................................................................ 37
Industry References ........................................................................................... 39
Comparative Company Analysis ...................................................................... 41
This issue updates the one dated February 2014.
Industry Surveys Biotechnology Jeffrey Loo, CFA, Health Care Sector Equity Analyst
SEPTEMBER 2014
CONTACTS:
INQUIRIES & CLIENT SUPPORT 800.523.4534 clientsupport@ standardandpoors.com
SALES 877.219.1247 [email protected]
MEDIA Michael Privitera 212.438.6679 [email protected]
S&P CAPITAL IQ 55 Water Street New York, NY 10041
Please see General Disclaimers on the last page of this report.
Topics Covered by Industry Surveys
Aerospace & Defense
Airlines
Alcoholic Beverages & Tobacco
Apparel & Footwear: Retailers & Brands
Autos & Auto Parts
Banking
Biotechnology
Broadcasting, Cable & Satellite
Chemicals
Communications Equipment
Computers: Commercial Services
Computers: Consumer Services & the Internet
Computers: Hardware
Computers: Software
Electric Utilities
Environmental & Waste Management
Financial Services: Diversified
Foods & Nonalcoholic Beverages
Healthcare: Facilities
Healthcare: Managed Care
Healthcare: Pharmaceuticals
Healthcare: Products & Supplies
Heavy Equipment & Trucks
Homebuilding
Household Durables
Household Nondurables
Industrial Machinery
Insurance: Life & Health
Insurance: Property-Casualty
Investment Services
Lodging & Gaming
Metals: Industrial
Movies & Entertainment
Natural Gas Distribution
Oil & Gas: Equipment & Services
Oil & Gas: Production & Marketing
Paper & Forest Products
Publishing & Advertising
Real Estate Investment Trusts
Restaurants
Retailing: General
Retailing: Specialty
Semiconductors & Equipment
Supermarkets & Drugstores
Telecommunications
Thrifts & Mortgage Finance
Transportation: Commercial
Global Industry Surveys
Airlines: Asia
Autos & Auto Parts: Europe
Banking: Europe
Food Retail: Europe
Foods & Beverages: Europe
Media: Europe
Oil & Gas: Europe
Pharmaceuticals: Europe
Telecommunications: Asia
Telecommunications: Europe
S&P Capital IQ Industry Surveys 55 Water Street, New York, NY 10041
CLIENT SUPPORT: 1-800-523-4534
VISIT THE S&P CAPITAL IQ WEBSITE: www.spcapitaliq.com
S&P CAPITAL IQ INDUSTRY SURVEYS (ISSN 0196-4666) is published weekly. Redistribution or reproduction in whole or in part (including inputting into a computer) is prohibited without written permission. To learn more about Industry Surveys and the S&P Capital IQ product offering, please contact our Product Specialist team at 1-877-219-1247 or visit getmarketscope.com. Executive and Editorial Office: S&P Capital IQ, 55 Water Street, New York, NY 10041. Officers of McGraw Hill Financial: Douglas L. Peterson, President, and CEO; Jack F. Callahan, Jr., Executive Vice President, Chief Financial Officer; John Berisford, Executive Vice President, Human Resources; D. Edward Smyth, Executive Vice President, Corporate Affairs; and Lucy Fato, Executive Vice President and General Counsel. Information has been obtained by S&P Capital IQ INDUSTRY SURVEYS from sources believed to be reliable. However, because of the possibility of human or mechanical error by our sources, INDUSTRY SURVEYS, or others, INDUSTRY SURVEYS does not guarantee the accuracy, adequacy, or completeness of any information and is not responsible for any errors or omissions or for the results obtained from the use of such information. Copyright © 2014 Standard & Poor's Financial Services LLC, a part of McGraw Hill Financial. All rights reserved. STANDARD & POOR’S, S&P, S&P 500, S&P MIDCAP 400, S&P SMALLCAP 600, and S&P EUROPE 350 are registered trademarks of Standard & Poor’s Financial Services LLC. S&P CAPITAL IQ is a trademark of Standard & Poor’s Financial Services LLC.

CURRENT ENVIRONMENT
Biotech stocks consistently outperform the broader market
Over the past four years, biotechnology stocks have substantially outperformed the broader equity markets. In our view, the industry’s resurgence and consistent outperformance can be attributed to several positive trends that emerged after 2010. First, the FDA picked up its pace of new drug approvals—30 new drugs in 2011, followed by 39 in 2012. Although new drug approvals slipped to 27 in 2013 and 23 in 2014 as of August 8 (latest reading), we note that these levels were still above the 2010 approvals of only 21. In addition, drugs approved in 2013 and 2014 have significant commercial prospects and represent major advances in some therapeutic areas, which, in our view, mitigate the negative sentiment over the lower approval output.
Further, drugs addressing rare diseases continue to represent an increasing portion of new drug approvals, which we see signaling an important shift in the drug development landscape. Rare disease-focused drugs are typically granted orphan drug designation (“orphan status”) by the FDA, and are marked by less competition and increased pricing power. These drugs tend to target smaller patient populations, which can offer quicker clinical timelines and more favorable regulatory paths to market. Recent novel drug approvals were granted for diseases in need of new treatment options, including the Hepatitis C virus, the neurological disease multiple sclerosis (MS), and various cancers. In late 2012, the FDA introduced the “breakthrough therapy” designation to further accelerate the development and approval timeline for programs that represent significant advances over existing treatments. Granting this designation 35 times since 2012, three breakthrough therapy drugs were approved this year as of May 2014. The FDA, in its efforts to streamline the regulatory processes, released its final guidance on expedited drug approvals on May 29, 2014.
Another factor in biotech’s outperformance has been the specter of acquisition of biotech companies by a wider set of companies, which saw an uptick after the subdued first half of 2013. While pharmaceutical companies (“Big Pharma”) have historically been the main acquirers of smaller biotechs, large-cap biotechs, as well as specialty and generic pharmaceutical firms, have also become increasingly active. Despite the pickup in competition for deals, S&P expects Big Pharma to remain active in the merger and acquisition (M&A) landscape, as it addresses the ongoing challenge of replacing revenues from key patent expirations and large-cap biotechs bolstering their product pipelines given their maturing products.
Year-to-date through September 5, 2014, the S&P Biotechnology Index increased 24.1%, compared with the 8.2% increase for the S&P Composite 1500 Index. Last year, the Biotechnology Index increased 74.2%, compared with 30.1% growth for the larger composite stock index. In 2012, the S&P Biotechnology Index increased by 40.5%, versus a 13.7% advance for the S&P 1500 Index. In 2011, the S&P Biotechnology Index increased by 20.0%, versus a 0.3% decline for the S&P 1500. The five-year compound annual growth rate (CAGR) for the biotechnology sub-industry through August 2014 was 29.2%, compared with 14.0% for the S&P 1500 Index. In the underperforming years of 2010 and 2009, the S&P Biotechnology Index declined 2.9% and 5.4%, respectively, versus increases of 14.2% and 24.3% for the S&P 1500.
S&P has a positive fundamental outlook for the biotechnology industry for the next 12 months. We see favorable prospects for commercialization of new and novel therapies amid a strong period of reporting late-stage clinical results, and a more accommodating US FDA for approvals. We also expect long-term research and development (R&D) pipeline productivity to be bolstered by the wider adoption of biomarker research and genetic-targeted clinical studies. Lastly, we see biosimilars advancing at a slower rate than initially anticipated, due to high development costs and a lack of regulatory clarity. Once marketed, we expect biosimilars to sell at more modest price discounts than in the pharmaceutical industry due to higher clinical, manufacturing and marketing costs.
S&P recommends that investors concentrate on established and profitable companies with at least two years of operating capital and multiple value products in the pipeline, as smaller biotechs tend to be more volatile.
INDUSTRY SURVEYS BIOTECHNOLOGY / SEPTEMBER 2014 1

POSITIVE CATALYSTS SUSTAIN SECTOR OUTPERFORMANCE
Large-cap biotech company valuations have significantly compressed in recent years compared with historical premiums. On a price/earnings-to-growth (PEG) basis, the core group of still independent, profitable, and established biotech companies—Amgen Inc., Biogen Idec Inc., Celgene Corp., and Gilead Sciences Inc.—had trading at valuations around an average PEG of 1.2X as of August 2014, while in 2013 the average PEG ratio was 1.3X their earnings. In the past, such companies typically warranted a PEG range between 1.3X and 1.5X, but, in recent years, they have trended toward the lower end of that range and, at times, below it (as the latest data shows).
Price-to-earning (P/E) ratios have also declined. In the 2011 edition of Ernst and Young’s annual Beyond Borders: Global Biotechnology Report, it was noted that the average biotech P/E ratio in 2005 was 55X. However, in 2011, slowing earnings growth among these large-cap players amid a maturing industry led to average P/E ratios in the low mid-teens. Nevertheless, at the end of 2013, these stocks traded at multiples of about 22X our 2014 estimate, which we attribute to accelerating growth prospects. During this time, S&P thinks the PEG ratio of the profitable names have remained reasonable, which underscores an enhanced long-term growth outlook that we see for the industry.
While we expect future industry valuations to remain at recent levels rather than reverting to the levels in 2005, we think that the sector still holds above-average growth prospects compared with the broader market over the next several years, boosted by several catalysts.
Multi-year trend reversed as outlook for new approved drugs improves S&P is encouraged by the higher rate of approvals in recent years. Although new approvals of 23 drugs (as of August 8, 2014) is below the pace of the 39 drugs approved in 2012—the greatest number of approvals
since 1997—the level is still higher than the 14 approvals as of the same period last year, according to the FDA. S&P is also encouraged by the significant promise of these newer drugs. In 2013, total approvals reached 27, still lower than the output in 2012. In contrast, few drugs approved between 2004 and 2009 represented novel treatments with the potential to change prevailing treatment paradigms, in our view. We also note that the 2013 total is consistent with the long-term average for the industry. According to the Novel New Drugs 2013 Summary published by the FDA in January 2014, approvals reached an annual average of 26 new drugs during 2004–2012.
Healthcare market research firm EvaluatePharma published in a June 2014 report entitled World Preview 2014, Outlook to 2020 that fifth-year US sales of drugs approved in 2013 could reach $24.4 billion, which would represent a 43% increase from its forecast of $17.0 billion for drugs approved in 2012. S&P notes that the 2013 figure would represent the best results since 1997, and extends positive performance from last year. Over a multi-year period, as of June 2014, Evaluate’s estimate for fifth-year US sales of drugs approved in 2011–2013 was $17.8 billion, up from $5.0 billion in 2007–2009. We note that the 2007, 2008, and 2009 periods comprise the lowest individual totals over the 10-year period.
S&P sees the new roster of drugs recently approved (which are discussed in more detail below) continuing this positive trend. Evaluate’s projected fifth-year US sales of drugs approved in 2013 includes Sovaldi, the number one approval, accounting for 20.8% of the total. Nine of the drugs approved last year—Sovaldi, Tecfidera, Imbruvica, Kadcyla, Tivicay, Anoro Ellipta, Breo Ellipta, Invokana, and Pomalyst—are all
Chart H09: FDA APPROVALS VS. US PRODUCT SALES
0
10
20
30
40
50
0
4
8
12
16
20
2000 01 02 03 04 05 06 07 08 09 10 11 12 2013
Product sales* (Bil. $, left scale)New drug approvals (right scale)
*In fifth year after launch.Source: Evaluate.
FDA APPROVALS VS. US PRODUCT SALES*
2 BIOTECHNOLOGY / SEPTEMBER 2014 INDUSTRY SURVEYS

expected to sell more than $1 billion by 2018. In our view, the continued flow of new drug approvals that represent major advances over existing treatments will be key to maintaining investor confidence in the biotechnology industry.
New, high profile compounds approved and/or nearing market As mentioned earlier, the FDA has approved 23 new drugs year-to-date through August 2014, which is below the pace of the 39 new drug approvals in 2012. The FDA cited fewer applications received for the drop in approvals. This could be partly attributed to the modest extension of review timelines to eight and 12 months, up from six and 10 months, due to the most recent reauthorized Prescription Drug User Fee Act (referred to as PDUFA V), which took effect on October 1, 2012. Over the long term, however, we think these longer review cycles are likely to foster enhanced communication with the agency, which should boost first-cycle review trends. Overall, we think operations at the agency have improved, following several years of inconsistent practices. We think that this trend will continue as the FDA becomes more focused on the timely approval of new drugs, particularly for those treating rare diseases and life-extending treatments for cancer. Below we discuss several promising drugs.
Tecfidera (BG-12). In March 2013, the FDA approved Tecfidera, an oral treatment for multiple sclerosis (MS), developed by Biogen Idec. Although Tecfidera was not the first oral drug to be approved for MS, its efficacy and safety profile appears to be superior to Novartis AG’s Gilenya, which has been linked to heart-related side effects. As such, Tecfidera has seen a strong launch in the US, surpassing Gilenya as the leading oral treatment for MS in the third quarter of 2013. In May 2013, the drug was approved in Europe as well, but its launch was delayed because of patent issues, which were settled in Biogen Idec’s favor in November 2013. Although we expect the MS market to remain fiercely competitive—for instance, first-half sales in 2014 for Tecfidera amounted to $1.2 billion, while rival pill Gilenya’s sales amounted to $1.15 billion—we expect Tecfidera to achieve sales of about $2.7 billion in 2014 and to hit $6 billion in sales by 2018.
Sovaldi (sofosbuvir). This oral treatment, developed by Gilead Sciences via its January 2012 acquisition of Pharmasset Inc., secured FDA approval in December 2013 for treatment of the Hepatitis C virus. The drug has emerged as a leading candidate to enable treatment of Hepatitis C in an all-oral regimen, without injected interferon. For the first half of 2014, Gilead Sciences generated a staggering $5.7 billion in sales.
Chart B11: UPCOMING BIOTECH PIPELINE CATALYSTS
UPCOMING BIOTECH PIPELINE CATALYSTSCLINICAL ACTION
COMPANY TRADE NAME GENERIC NAME THERAPEUTIC INDICATION STAGE DATEBioMarin Vimizim GALNS MPS IV Filed ApprovedCelgene Otezla apremilast Psoriatic arthritis Filed ApprovedBiogen IDEC Alprolix recombinant factor IX Fc
fusion proteinHemophilia B Filed Approved
Biogen IDEC Eloctate recombinant factor VIII Fc fusion protein
Hemophilia A Filed Approved
Gilead Sciences Idelalisib phosphoinositide 3-kinase (PI3K) delta inhibitor
non-Hodgkin's Lymphoma Filed Approved
NPS Pharmaceuticals Natpara recombinant human parathyroid hormone
hypoparathyroidism Filed 10/24/14
Gilead Sciences Sovaldi/ Ledipasvir
sofosbuvir/ledipasvir Hepatitis C Filed 10/10/14
Abbvie ABT450/ABT267/ABT333
ritonavir/ombitasvir/dasabuvir Hepatitis C Filed Late 2014
Alexion Pharma ENB-040 asfotase alfa Hypophasphatasia Phase III 2015Vertex Pharma Kalydeco/
VX-809ivacaftor/lumacaftor Cystic f ibrosis Phase III 2015
Regeneron/Sanofi REGN 727 Alirocumab Hypercholesterolemia Phase III 2015Amgen AMG 145 Evolocumab Hypercholesterolemia Phase III 2015AbbVie/Neurocrine Biosciences
NBI-56418 elagolix Endometriosis Phase III 2015
Sources: Company reports; US Food & Drug Administration.
INDUSTRY SURVEYS BIOTECHNOLOGY / SEPTEMBER 2014 3

Gilead noted in its earnings call in July that it believes 9,000 people have been cured with this drug so far. The initial approval was in combination with generic drug ribavirin for patients with genotype 2 and 3, and with ribavirin and interferon in the more prevalent genotype 1 population, which represents approximately 75% of US patients. Despite still requiring interferon, the genotype 1 approval is noteworthy as it cut the standard treatment regimen to eight to 12 weeks, from 24 to 48 weeks previously. This longer regimen, combined with interferon’s flu-like side effects, has been a major factor in patients opting to defer treatment until better options reach the market. In February 2014, Gilead filed for FDA approval for its combination oral pill of Sovaldi and Ledipasvir, which does not require interferon. This regimen yielded robust cure rates of 95%–100% in eight- and 12-week regimens. Given these results and the granting of the “breakthrough therapy” designation, we anticipate the approval and launch of this combination oral pill by its FDA action date of October 2014.
However, we expect the competitive landscape for Hepatitis C to remain fierce over the long term, as four candidates for Hepatitis C were among the first programs granted the “breakthrough therapy” designation in 2013. Among these are regimens from AbbVie Inc. (which was spun off from Abbott Laboratories in January 2013), which has emerged as a formidable challenger with a combination therapy that has shown robust cure rates—albeit with a more cumbersome regimen, in our view, and could bring its genotype 1 regimen to market in a similar timeframe to Gilead. Other companies that we expect to maintain a presence in this attractive market include Johnson & Johnson, and Bristol-Myers Squibb. We expect the Hepatitis C market to increase significantly once these new treatments come to market. We see potential for the US market for Hepatitis C drugs to expand from $2 billion in 2011 (before sales plateaued and began to decline while patients wait for improved regimens to come to market) to potentially over $20 billion in the next decade.
Imbruvica (Ibrutinib). In November 2013, Johnson & Johnson and Pharmacyclics received FDA approval for Imbruvica, an oral Bruton’s tyrosine kinase (BTK) inhibitor, for treating patients suffering from mantle cell lymphoma (MCL). The approval was notable, as it occurred just months after a July 2013 submission, well ahead of its February 2014 action date. In July 2014, the FDA expanded the approved use of Imbruvica to treat patients with chronic lymphocytic leukemia (CLL) who carry a deletion in chromosome 17 (17p deletion). Imbruvica received a breakthrough designation for this use. A comparably timed filing for relapsed CLL/small lymphocytic lymphoma (SLL) was not approved early. CLL is a prevalent type of blood cancer that originates from the immune system’s B-cells. MCL is a B-cell non-Hodgkin’s lymphoma (NHL), a type of B-cell malignancy. The application was filed based on the results of Phase II clinical trials, under the “Breakthrough Therapy” Designation pathway.
PCSK9 inhibitors. Proprotein convertase subtilisin-kexin type 9 (PCSK9) is a protein that causes the body to retain low-density lipoprotein (LDL) cholesterol, which carries negative health consequences such as cardiovascular disease (CVD). CVD remains the number one cause of fatality worldwide, with an estimated 23.3 million casualties by 2030. As such, PCSK9 inhibitors, hailed as the most important heart medicines in years, can help lower LDL cholesterol in patients by blocking the PCSK9 protein, and hence possess multibillion-dollar sales potential.
PCSK9 inhibitors has been a major target among drug developers in recent years, seeking to add to the benefits of older statin drugs, and to treat those for whom statin treatment has proven inadequate. Leading candidates in this field include Sanofi/Regeneron Pharmaceuticals’ Alirocumab (REGN727) and Amgen’s Evolocumab (AMG145), which are both in Phase III studies, and began to report positive data in late 2013. In July 2014, Sanofi and Regeneron paid BioMarin $67.5 million for a special priority view voucher granted by the FDA that would enable Alirocumab to expedite the review process to six months instead of the standard 10-month review. Roche Holding and Pfizer also have candidates in development.
The March 2014 American College of Cardiology 2014 Scientific Sessions include the showcase of effectiveness of Evolocumab, Alirocumab, and Bococizumab (by Pfizer) based on multiple studies. The group was volatile in late 2013, as there was some uncertainty over whether these drugs would need to produce long-term cardiovascular benefit outcome data, rather than simply affecting a biomarker such as lowering cholesterol, before they could be approved. However, FDA guidelines ultimately did not include such stringent requirements, which we think would have significantly delayed their regulatory path to market.
4 BIOTECHNOLOGY / SEPTEMBER 2014 INDUSTRY SURVEYS

BIOPHARMA INDUSTRY R&D PRODUCTIVITY STATISTICS REMAIN MIXED
According to the April 2014 Biopharmaceutical Research Industry Profile by the Pharmaceutical Research and Manufacturers of America (PhRMA), member companies have invested more than half a trillion dollars in R&D since 2000, with an estimated $51 billion in 2013 alone. While approvals dipped to 27 in 2013 and 23 as of the August 2014, as mentioned earlier, S&P is encouraged by the quality and market potential of many of these recently approved drugs. After several years that saw approval of drugs that offered modest improvements over existing drugs or were similar to drugs already on the market, S&P sees promise in the prospects for innovation among new drug candidates. Of note, according to the abovementioned report by industry trade group PhRMA, of the total number of neurology, cardiovascular, and cancer drugs in the industry pipeline, 84%, 81%, and 80%, respectively, had the potential to become first-in-class medicines. Psychiatry, immunology, and diabetes drugs all had rates above 70%, as well. Lastly, HIV/AIDS and infection drugs had rates of 69% and 57%, respectively.
Despite these positive trends, S&P notes that the prior few years have been marked by increased R&D spending, but with little progress in clinical success rates and overall R&D productivity. In addition, the cost of developing a new drug continues to rise at the same time. According to the Measuring the return from pharmaceutical innovation 2013 report by Deloitte and Thomson Reuters, although the covered companies managed to successfully commercialize more, the average cost of developing new medicines over the past four years has risen 18% to $1.3 billion, while average internal rates of return (IRR) fell to around 4.8% in 2013 from 10.5% in 2010. We note that although the reported IRR is lower, five of the 12 companies covered achieved a return above 7%. Overall, the adverse impact of terminations and late-stage failures amounted to $243 billion between 2010–2013.
FDA OVERHANG SHOWS SIGNS OF EASING AMONG INVESTORS, BUT CHALLENGES REMAIN
Out of the 36 approved new drugs in 2004, the FDA faced scrutiny in 2005 for its failure to address the safety issues raised about Vioxx, Merck & Co.’s painkiller. In our view, the backlash from this situation sparked a period of conservatism at the agency, which led to a slowing environment for new drug approvals. In subsequent years, the FDA struggled to fulfill its public mandate due to inadequate funding and staffing. A November 2007 study by a subcommittee of the Science Board, an independent advisory group, criticized the agency’s scientific deficiencies, insufficient personnel resources and information technology infrastructure, as well as its reactive regulatory environment, among other concerns. The already overburdened agency was further stressed when, in September 2007, the Prescription Drug User Fee Act (PDUFA) was reauthorized, which expanded the FDA’s powers to require drug companies to further study the safety of medicines and to mandate new label warnings when safety issues arise.
Despite these new responsibilities, the FDA’s budget in 2008 was just 5% above the budget in 2007, amounting to $2.1 billion. The agency continued to miss target review deadlines, even though biopharmaceutical companies were paying into the system in exchange for timely reviews. However, in 2009, operations at the better-funded FDA began to improve. The FDA aggressively expanded its Center for Drug Evaluation and Research (CDER), which reviews and approves new medications and monitors the safety of drugs already on the market. By the end of that year, FDA officials stated that the agency was back on track in terms of meeting its goal of timely drug reviews in 90% of submissions.
Over the past few years, the funding environment for the FDA has been much more stable, and the performance of the agency has followed in step. However, due to sequestration (which began in March 2013 and calls for systemwide 2% budget cuts), the agency is subject to mandatory spending cuts, which could impact its performance goals and cause delays in conducting review programs. In April 2013, the White House proposed a budget for fiscal year 2014 that allocated $4.7 billion to the FDA, an increase of 21% from the 2012 level, of which $338 million would be allocated to biologics. Ultimately, the enacted budget for the FDA amounted to $4.4 billion in 2014. In January 2014, the US House of Representatives voted to restore $85 million in FDA sequestered user fees, enhancing the agency’s capacity to maintain review timeliness goals. For 2015, the requested budget amount increased by 8.1% to $4.7 billion, which is $358 million above the fiscal 2014 enacted level. Biologics will be allocated $343 million.
INDUSTRY SURVEYS BIOTECHNOLOGY / SEPTEMBER 2014 5
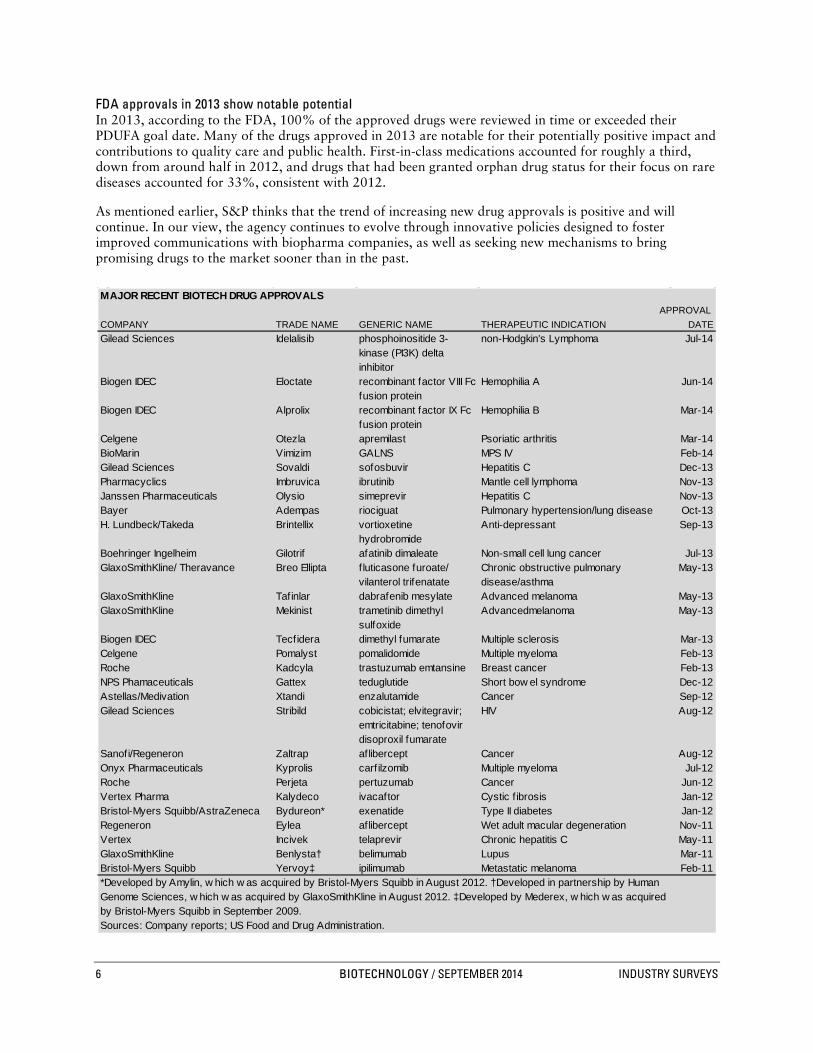
FDA approvals in 2013 show notable potential In 2013, according to the FDA, 100% of the approved drugs were reviewed in time or exceeded their PDUFA goal date. Many of the drugs approved in 2013 are notable for their potentially positive impact and contributions to quality care and public health. First-in-class medications accounted for roughly a third, down from around half in 2012, and drugs that had been granted orphan drug status for their focus on rare diseases accounted for 33%, consistent with 2012.
As mentioned earlier, S&P thinks that the trend of increasing new drug approvals is positive and will continue. In our view, the agency continues to evolve through innovative policies designed to foster improved communications with biopharma companies, as well as seeking new mechanisms to bring promising drugs to the market sooner than in the past.
B01: MAJOR RECENT BIOTECH DRUG APPROVALS
MAJOR RECENT BIOTECH DRUG APPROVALSAPPROVAL
COMPANY TRADE NAME GENERIC NAME THERAPEUTIC INDICATION DATEGilead Sciences Idelalisib phosphoinositide 3-
kinase (PI3K) delta inhibitor
non-Hodgkin's Lymphoma Jul-14
Biogen IDEC Eloctate recombinant factor VIII Fc fusion protein
Hemophilia A Jun-14
Biogen IDEC Alprolix recombinant factor IX Fc fusion protein
Hemophilia B Mar-14
Celgene Otezla apremilast Psoriatic arthritis Mar-14BioMarin Vimizim GALNS MPS IV Feb-14Gilead Sciences Sovaldi sofosbuvir Hepatitis C Dec-13Pharmacyclics Imbruvica ibrutinib Mantle cell lymphoma Nov-13Janssen Pharmaceuticals Olysio simeprevir Hepatitis C Nov-13Bayer Adempas riociguat Pulmonary hypertension/lung disease Oct-13H. Lundbeck/Takeda Brintellix vortioxetine
hydrobromideAnti-depressant Sep-13
Boehringer Ingelheim Gilotrif afatinib dimaleate Non-small cell lung cancer Jul-13GlaxoSmithKline/ Theravance Breo Ellipta fluticasone furoate/
vilanterol trifenatateChronic obstructive pulmonary disease/asthma
May-13
GlaxoSmithKline Tafinlar dabrafenib mesylate Advanced melanoma May-13GlaxoSmithKline Mekinist trametinib dimethyl
sulfoxideAdvancedmelanoma May-13
Biogen IDEC Tecfidera dimethyl fumarate Multiple sclerosis Mar-13Celgene Pomalyst pomalidomide Multiple myeloma Feb-13Roche Kadcyla trastuzumab emtansine Breast cancer Feb-13NPS Phamaceuticals Gattex teduglutide Short bow el syndrome Dec-12Astellas/Medivation Xtandi enzalutamide Cancer Sep-12Gilead Sciences Stribild cobicistat; elvitegravir;
emtricitabine; tenofovir disoproxil fumarate
HIV Aug-12
Sanofi/Regeneron Zaltrap aflibercept Cancer Aug-12Onyx Pharmaceuticals Kyprolis carf ilzomib Multiple myeloma Jul-12Roche Perjeta pertuzumab Cancer Jun-12Vertex Pharma Kalydeco ivacaftor Cystic f ibrosis Jan-12Bristol-Myers Squibb/AstraZeneca Bydureon* exenatide Type II diabetes Jan-12Regeneron Eylea aflibercept Wet adult macular degeneration Nov-11Vertex Incivek telaprevir Chronic hepatitis C May-11GlaxoSmithKline Benlysta† belimumab Lupus Mar-11Bristol-Myers Squibb Yervoy‡ ipilimumab Metastatic melanoma Feb-11*Developed by Amylin, w hich w as acquired by Bristol-Myers Squibb in August 2012. †Developed in partnership by HumanGenome Sciences, w hich w as acquired by GlaxoSmithKline in August 2012. ‡Developed by Mederex, w hich w as acquired by Bristol-Myers Squibb in September 2009.Sources: Company reports; US Food and Drug Administration.
6 BIOTECHNOLOGY / SEPTEMBER 2014 INDUSTRY SURVEYS

Under the PDUFA V, which took effect on October 1, 2012, standard and priority reviews were extended by two months to 12 months and eight months, respectively. While these extensions could slow the rate of new drug approvals modestly, S&P believes that they will likely result in greater communication between the FDA and a submitting company during the review process, which we think should bolster the rate of first-cycle approvals. This improved interaction should also lead to fewer surprises at the decision stage of a drug approval review, as the agency will advise a company earlier about any problem it sees with an application.
Another promising innovation (introduced in the FDA Safety & Innovation Act of 2012) allows the FDA to designate a drug as a “breakthrough therapy,” which permits faster approval of drugs that represent significant advances over existing treatments and in areas of particular need. In early 2013, the FDA granted its first three breakthrough drug designations to two drugs under development by Vertex Pharmaceuticals– its cystic fibrosis (CF) drug Kalydeco, and Kalydeco in combination with investigational agent VX-809— and a third program, cancer drug Imbruvica (ibrutinib), which is being co-developed by small biotech Pharmacyclics Inc. and large pharma Johnson & Johnson. As mentioned earlier in this section, Imbruvica secured its first approval from the FDA in November 2013. As of August 2014, according to the FDA, 60 drugs had been granted the breakthrough designation, among 209 requests (115 were denied), showing that the FDA is being selective in granting this status.
While the impact of such designations on the approval timeline has not yet been determined, the likelihood of a first-cycle approval has increased due to additional interaction within the review process. S&P assumes that such programs would need to be designed to establish their potential benefits over existing therapies earlier in clinical study than is typically seen, and would need to show longer-term benefits in order to maintain such an early approval. We also expect improved clarity over the impact of the designation over time, as earlier-stage programs are granted this status. According to the latest available data from Evaluate, 58.6% of 2013 drugs granted the “breakthrough therapy” designation by FDA were already in Phase III study as the program rolled out, so S&P thinks there were limited opportunities to impact the regulatory path. Phase II drugs accounted for 31%, while Phase I drugs accounted for 3.4%. The three drugs granted the said designation in 2013 were approved on or before the FDA action date. Imbruvica was approved several months prior to its FDA action date, Roche’s Gazyva was approved about 6 weeks early, while Gilead’s Sovaldi was approved on its action date.
Surge in first-cycle approvals FDA’s progress in approving drugs on their first cycle is also encouraging. In 2013, the FDA pegged first-cycle approvals at 89% (24 out of 27, and a 20-year high), besting 77% in 2012, 63% in 2011, and 50% in 2010. S&P Capital IQ thinks that the FDA is benefitting from hiring initiatives made in 2009 and a more stable, though still challenging, funding environment, despite government spending pressures.
S&P also attributes this trend to improved and more thorough application submissions from pharmaceutical and biotechnology companies. Since 2007, companies have increasingly been asked to submit drug risk evaluation and mitigation strategy (REMS) programs as part of their initial applications. Requesting additional information pertaining to REMS was one of the most common reasons for delay in new drug applications. We think that the FDA and the biopharma industry are likely getting more comfortable with the REMS process, spurring the uptick in first-cycle approvals
Statistics suggest favorable FDA approval trends over other regions Despite the overhang of negative sentiment toward the FDA due to its approval practices in recent years, a study published in May 2012 showed some evidence that the FDA has performed better compared with several peer regions. According to the study, which was conducted by researchers at Yale University and the Mayo Clinic and published in the New England Journal of Medicine, the FDA approved new drugs approximately 15% faster than its European and Canadian counterparts between 2001 and 2010.
Further, the study found that more new drugs were approved in the US first, compared with the other regions, over the study period. For instance, in 2013, 74% of the new drug approvals were approved in the US before being approved elsewhere, according to the FDA. Still, inconsistencies remain, as the FDA in January 2014 deferred approval of Lemtrada, a multiple sclerosis drug developed by Sanofi (via its acquisition of Genzyme), despite the drug’s approval in around 30 countries to date. FDA cited
INDUSTRY SURVEYS BIOTECHNOLOGY / SEPTEMBER 2014 7

insufficiently conducted clinical trials as a key factor in its decision. In May 2014, Sanofi resubmitted Lemtrada for FDA approval.
Critics still argue for revamping the pipeline process, despite FDA progress Despite the FDA’s improving reputation over the past few years, in our view, the efficiency and cost-effectiveness of clinical trial rules in place continue to face scrutiny. According to critics, the current regulatory system makes the drug approval process slow and inefficient. At the heart of the issue is the three phases of clinical study required in order to be granted marketing approval. Bringing a new drug to market can cost up to $1.3 billion, according to a 2013 study conducted by Deloitte and Thomson Reuters, and takes 12 to 15 years from the laboratory to the pharmacy, FDA reported. Other studies have suggested much higher costs, when factoring in the cost of other pipeline failures for drug developers. Phase III trials can take several years to complete, even after a drug has shown clinical proof-of-concept in earlier studies.
Because new drugs are required to show statistically significant improvement over existing treatments, increasingly larger study populations are required to produce such data. In the context of a 20-year patent life, this lengthy timeframe can result in shorter patent protection once marketed, reducing incentives for companies to continue to invest in certain projects. According to the Tufts Center for the Study of Drug Development (CSDD), eliminating Phase III trials could help reduce R&D costs by 25%, thus boosting profit margins and spurring innovation to increase significantly the number of new products that reach the market.
FDA has faced perception issues among investors for inconsistent practices In the past, investor skepticism was sparked when the FDA acted against recommendations made by its advisory panel and failed to approve new drugs that seemed to meet approval criteria. Such inconsistent decisions heightened the view of biotechnology companies as risky, and the media has portrayed investing in the sector as akin to casino gambling.
Notably, in October 2010, the FDA failed to approve Bydureon, a weekly-dose version of currently marketed Byetta for treatment of Type 2 diabetes by issuing a complete response letter (CRL). A CRL asks manufacturers to provide more information about the product under review before being granted approval. Bydureon showed superior efficacy and weight loss benefits over many currently marketed diabetes treatments, including the current Byetta formulation. This CRL was notable in that the FDA requested that an additional study be conducted on the drug’s impact on heart rates (which was reported as positive in July 2011), despite an initial CRL issued in March 2010 that made no such request. The drug was finally approved in January 2012, nearly two years after its first review date. In contrast, Bydureon was approved in Europe in June 2011, without regulatory delay.
Patient access groups have also criticized the FDA for delaying the approval of promising new drugs. Notably, in 2007, the agency deferred approval of the prostate cancer drug Provenge, despite a positive advisory panel vote on its efficacy, requesting that an additional study be performed. The drug was finally approved in 2010. In June 2012, patient groups rallied outside the Biotechnology Industry Organization’s (BIO) annual conference to protest the FDA’s refusal to grant accelerated approval of Roche’s T-DM1 for breast cancer in 2010, opting instead to require that a Phase III program be conducted. Finally, in February 2013, the drug, marketed as Kadcyla, was granted FDA approval. Another notable example is a multiple sclerosis drug, Lemtrada, which was rejected by the US FDA in November 2013, although the drug had already been approved in Europe, Canada, Mexico and Australia.
Apart from the apparent delay in approvals by the US FDA compared with its international counterparts, the quality of the approved drugs has also been subject to scrutiny. According to the August 2014 report of Health Affairs, the leading journal of healthy policy thought and research, for all the drugs approved between 1975 and 2009, there is a one-in-three chance that the approved medicine will be subject to safety issues and be withdrawn from the market. After the passage of the PDUFA V in 2012, the report indicated that approved drugs that received black-box warnings (the most severe type of safety issue warning) increased to 26.7 out of 100, from the prior rate of 21.2 out of 100.
8 BIOTECHNOLOGY / SEPTEMBER 2014 INDUSTRY SURVEYS
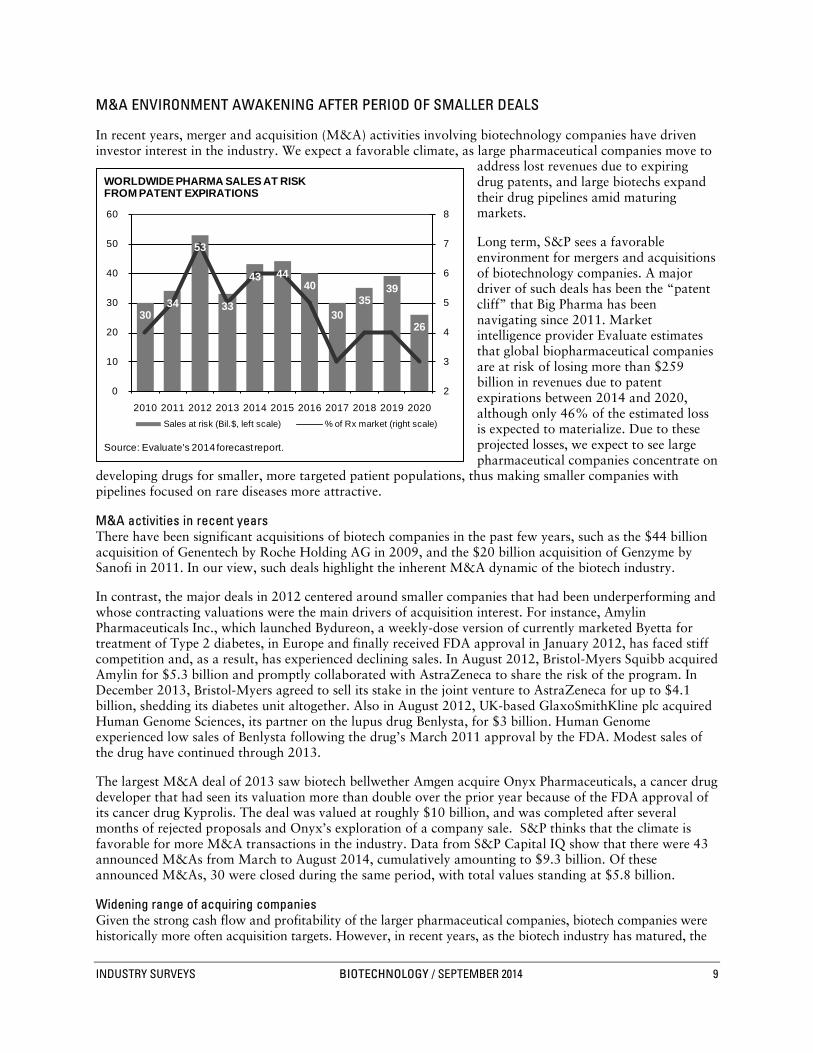
M&A ENVIRONMENT AWAKENING AFTER PERIOD OF SMALLER DEALS
In recent years, merger and acquisition (M&A) activities involving biotechnology companies have driven investor interest in the industry. We expect a favorable climate, as large pharmaceutical companies move to
address lost revenues due to expiring drug patents, and large biotechs expand their drug pipelines amid maturing markets.
Long term, S&P sees a favorable environment for mergers and acquisitions of biotechnology companies. A major driver of such deals has been the “patent cliff” that Big Pharma has been navigating since 2011. Market intelligence provider Evaluate estimates that global biopharmaceutical companies are at risk of losing more than $259 billion in revenues due to patent expirations between 2014 and 2020, although only 46% of the estimated loss is expected to materialize. Due to these projected losses, we expect to see large pharmaceutical companies concentrate on
developing drugs for smaller, more targeted patient populations, thus making smaller companies with pipelines focused on rare diseases more attractive.
M&A activities in recent years There have been significant acquisitions of biotech companies in the past few years, such as the $44 billion acquisition of Genentech by Roche Holding AG in 2009, and the $20 billion acquisition of Genzyme by Sanofi in 2011. In our view, such deals highlight the inherent M&A dynamic of the biotech industry.
In contrast, the major deals in 2012 centered around smaller companies that had been underperforming and whose contracting valuations were the main drivers of acquisition interest. For instance, Amylin Pharmaceuticals Inc., which launched Bydureon, a weekly-dose version of currently marketed Byetta for treatment of Type 2 diabetes, in Europe and finally received FDA approval in January 2012, has faced stiff competition and, as a result, has experienced declining sales. In August 2012, Bristol-Myers Squibb acquired Amylin for $5.3 billion and promptly collaborated with AstraZeneca to share the risk of the program. In December 2013, Bristol-Myers agreed to sell its stake in the joint venture to AstraZeneca for up to $4.1 billion, shedding its diabetes unit altogether. Also in August 2012, UK-based GlaxoSmithKline plc acquired Human Genome Sciences, its partner on the lupus drug Benlysta, for $3 billion. Human Genome experienced low sales of Benlysta following the drug’s March 2011 approval by the FDA. Modest sales of the drug have continued through 2013.
The largest M&A deal of 2013 saw biotech bellwether Amgen acquire Onyx Pharmaceuticals, a cancer drug developer that had seen its valuation more than double over the prior year because of the FDA approval of its cancer drug Kyprolis. The deal was valued at roughly $10 billion, and was completed after several months of rejected proposals and Onyx’s exploration of a company sale. S&P thinks that the climate is favorable for more M&A transactions in the industry. Data from S&P Capital IQ show that there were 43 announced M&As from March to August 2014, cumulatively amounting to $9.3 billion. Of these announced M&As, 30 were closed during the same period, with total values standing at $5.8 billion.
Widening range of acquiring companies Given the strong cash flow and profitability of the larger pharmaceutical companies, biotech companies were historically more often acquisition targets. However, in recent years, as the biotech industry has matured, the
Chart H03: WORLDWIDE PHARMA SAL ES AT RISK FROM PATENT
30
34
53
33
43 44 40
30 35
39
26
2
3
4
5
6
7
8
0
10
20
30
40
50
60
2010 2011 2012 2013 2014 2015 2016 2017 2018 2019 2020Sales at risk (Bil.$, left scale) % of Rx market (right scale)
Source: Evaluate's 2014 forecast report.
WORLDWIDE PHARMA SALES AT RISK FROM PATENT EXPIRATIONS
INDUSTRY SURVEYS BIOTECHNOLOGY / SEPTEMBER 2014 9

industry’s largest players have seen the size of their market capitalizations make their acquisition less attractive, while their financial capacity for deals has increased to the point where several of these firms are now able to rival Big Pharma companies for deals. This trend was evident in the January 2012 acquisition of Pharmasset Inc. by Gilead Sciences for $11 billion. That deal secured rights to Pharmasset’s sofosbuvir, a Hepatitis C drug that received its initial approval in December 2013 under the trade name Sovaldi. In our view, the $10 billion acquisition of Onyx Pharmaceuticals by Amgen also underscores this trend.
According to Burrill & Co., a life sciences industry research and investment company, the market capitalization of big biotech companies rose by 57% from 2009 to 2012 (latest available), while Big Pharma saw 17% growth. In addition, biotech revenues and net income increased by 41% and 22%, respectively, while Big Pharma saw increases of 17% and 1%. As of August 13, 2014, S&P announced that total market capitalization amounted to $535.2 billion for the top 10 biotech companies and $1,643.0 billion for the top 10 pharma.
According to Ernst & Young, big pharmas accounted for 85% of total industry deal-making “firepower” in 2006, but this figure fell to 75% in 2012 and 70% in 2013, with big biotech, specialty pharmas, and generics companies moving in to fill the gap. Additionally, as biotech and specialty pharma valuations have outpaced large pharma, Ernst & Young reported in January 2014 that large pharma’s “firepower” declined by 20% in 2013, continuing a trend seen since 2010, as large biotechs and specialty pharma accounted for more than 80% of M&A activity by announced deal values, consistent with 2012.
Another noticeable theme is M&A based on geography for tax purposes. In recent years, several companies have made deals in order to re-domicile in Ireland to take advantage of lower corporate tax rates in that country. For example, in February 2014, Endo Health Solutions’ acquired Paladin Labs. In September 2011, Alkermes plc acquired Ireland-based Elan’s Drug Technologies unit (the remaining Elan was subsequently acquired by US-based Perrigo in November 2013) to re-domicile in Ireland. Other companies, including Actavis Inc. (via its 2013 acquisition of Warner-Chilcott), have gone this strategic route as well. This M&A trend has been prevalent in the pharmaceutical industry, with several attempted and/or completed transactions so far in 2014, including Pfizer’s failed mega deal to take over Astra Zeneca, Valeant Pharmaceutical’s hostile bid for Allergan, along with successful deals such as Actavis’ acquisition of Forest Labs, among others.
M&A and licensing deals seek to share clinical risk In recent years, deals had been shifting more toward clinical and commercial milestones, with lower upfront payments. New deals are increasingly being structured to ensure that risk is shared among the parties. Typically, licensing pacts consist of upfront cash payments as well as milestones for future program advancement, and sales royalties. S&P Capital IQ thinks that this structure allowed an acquirer more flexibility to walk away from a transaction if its outlook changes. According to BIO, citing data from medical and scientific publisher Elsevier, 11 deals in 2012 (latest available) had more than 50% of the total deal value backloaded through the promise of milestones or other mechanisms. This is in contrast to 2011, when the average upfront payment rose, according to Deloitte Recap LLC, a biopharma research firm.
Risk-mitigating measures, such as contingent value rights (CVRs), are also being seen in company acquisitions. The use of CVRs had been dormant for many years in the biopharma industry, as buyers were aggressive in paying for desired targets, despite the high risks. However, the market downturn and decline in R&D productivity have increased the use of CVRs as a tool to share risk among the parties in acquisition talks.
For example, Sanofi acquired Genzyme in early 2011 by including a CVR that would entitle former Genzyme shareholders to cash payments in the future, based on Lemtrada (a multiple sclerosis drug) achieving ultimate regulatory approval and subsequent sales thresholds. Lemtrada had yet to be approved in the US, though it has been approved in other global markets. CVRs were also used in Celgene Corp.’s 2010 acquisition of Abraxis Biosciences for its lead cancer drug Abraxane, which was approved for breast cancer, but was being studied in several additional indications. Abraxane was subsequently approved in the US and Europe for pancreatic and lung cancers, and has generated positive data in melanoma as well. We expect such deal structures to fluctuate over time, depending on market conditions and the scarcity value of the acquired asset, which in turn reflects ongoing R&D productivity challenges.
10 BIOTECHNOLOGY / SEPTEMBER 2014 INDUSTRY SURVEYS

INDUSTRY PROFILE
Biotech’s presence grows, along with its ties to Big Pharma
The US biotechnology industry is undergoing a major shift, as the number of independent profitable biotech companies is continuing to decline due to industry merger and acquisition (M&A) activity. Global pharmaceuticals have started to acquire major biotech companies. In 2009, Roche Holding AG acquired Genentech Inc. (which generated $13.4 billion in 2008 revenues, accounting for roughly 20% of the
industry’s revenues). In April 2011, France’s Sanofi SA acquired Genzyme Corp. (whose revenues peaked at $4.6 billion in 2008 before experiencing manufacturing issues in 2009). In our view, these deals continue to blur the line of distinction between the pharmaceutical and biotech industries.
However, it is not only pharma firms completing sizable deals. In 2011, Gilead Sciences acquired Pharmasset for $11 billion; and in 2013, Amgen acquired Onyx
Pharmaceuticals for $10.4 billion. Overall, the number of active biotech companies currently trading on US exchanges is now about 300, according to the Biotechnology Industry Organization (BIO), a trade group. In contrast, there were 394 companies actively trading in 2008. According to BIO, 180 were acquired or ceased operations, while 86 new listings were added due to spinoffs and a resurgence in initial public offerings (IPOs), particularly in 2013.
CONSOLIDATION IN THE “DNA” OF THE INDUSTRY
Revenues, profits, and market capitalization of the industry are mostly concentrated in a small number of large-cap, independent drug developers. Driven by new drug approvals and sustained profitability, several companies, including Alexion Pharmaceuticals Inc. and Regeneron Pharmaceuticals Inc., have moved into the industry’s upper ranks. However, these same companies are also mentioned as prime candidates for acquisition by larger firms. Of note, Alexion was the subject of acquisition rumors by Roche in 2013. (For M&A trends, please see the discussion in the “Current Environment” section of this Survey.)
INDUSTRY TRENDS
In addition to the developments discussed earlier in the “Current Environment” section of this Survey, the convergence of the traditional pharmaceutical model with that of biotechnological, a rapidly changing regulatory environment due to higher drug prices and scientific advances, and a rapidly changing competitive landscape among key diseases and treatments, are the key trends faced by the biotechnology industry. We discuss several of these issues in the following sections.
BIOTECH AND BIG PHARMA CONVERGING
In the 1980s through much of the 1990s, big pharmaceutical companies (Big Pharma) shunned biotechnology because of its lack of a track record and predictability. However, Big Pharma is now embracing the technology, expecting that it will provide a wealth of new products to drive future growth. In fact, of the 27 new drugs approved in 2013, a Big Pharma company was the originator of the drug in only three approvals out of a total of 14 Big Pharma drugs that received approvals. The rest were acquired or in-licensed. Overall, about 75% of new drug approvals went to the originating company, highlighting the inherent M&A and licensing environment among drug developers.
B09: US BIOTECHNOLOGY INDUSTRY AT A GLANCE
INDUSTRY SURVEYS BIOTECHNOLOGY / SEPTEMBER 2014 11

While the pharmaceutical industry is using merger and acquisition (M&A) to gain a presence in developing and marketing biotechnology drugs, several leading biotech companies, including Gilead Sciences Inc., Celgene Corp., and Vertex Pharmaceuticals Inc., are relying on “small molecule” technologies more traditionally associated with pharmaceutical companies for their marketed products and key pipeline candidates. These compounds are subject to traditional patent expiration rules and, ultimately, to competition from generics. In contrast, biotech companies such as Amgen, Biogen Idec Inc., and Alexion have built commercial operations and pipelines based on “large molecule” or “biologics,” such as monoclonal antibodies and fusion proteins, which are based on living organisms rather than chemicals. However, these lines of distinction are blurring even further as a result of Biogen Idec’s 2013 approval and launch of Tecfidera (BG-12), a small molecule pill for the treatment of multiple sclerosis (MS), and Gilead’s recent expansion of its pipeline to include its first biologic compound.
Historically, biotech companies have been known for their innovative research-driven activities, a more entrepreneurial focus, and a higher growth trajectory. Firms such as Genentech Inc. and Amgen Inc. pioneered the growth and development of the biotechnology sector, producing drugs based on DNA manipulation of living organisms, and, as a result, enjoyed high returns.
Of note, in its World Preview 2014, Outlook to 2020 report released in June 2014, healthcare intelligence provider Evaluate forecast that nine of the top 10 companies in projected worldwide prescription drug sales from biotechnology in 2020 would be large pharmaceutical companies, with Amgen Inc. (ranked fifth) being the lone exception. Novartis, Pfizer, and Roche occupy the first three ranks.
According to the Tufts Center for the Study of Drug Development (CSDD), a nonprofit academic research group, biotech drugs accounted for 7% of industry revenues among the top 10 selling treatments in 2001, but 71% in 2013 (latest available data). Over the same period, biologics in clinical studies rose 155%, with Big Pharma companies involved in about 40% of all biotech products in development in 2013.
Evaluate forecasts that biotech drugs will account for 52% of the top 100 drugs in 2020, up from 45% in 2013 and 39% in 2006, further highlighting the growth of biologics across the healthcare industry.
Arrival of dividends highlights maturing biotech industry In recent years, large-cap biotech companies have expanded their share repurchase programs in order to boost earnings and deploy excess cash flow. The growth rate for large-cap players has dropped significantly over the years and biotech firms are now employing pharmaceutical-like tactics. These tactics include managing drug lifecycles through enhancing dosing or drug delivery, and developing new drugs. As mentioned earlier, several big biotech firms have also joined the biosimilars fray, as they prepare for a market environment in which they will be subject to patent expiration akin to the issues facing pharmaceutical companies.
As growth slowed among large-cap biotech companies, and the impacts of new stock buyback announcements moderated, the issue of instituting a dividend to return excess cash to shareholders entered the biotech discussion. While the industry at large has resisted the notion to date, Amgen Inc. became the first biotech company to announce a regular dividend policy in April 2011, and has since increased its dividend several times, reflecting the company’s strong and stable cash flows. S&P thinks that slowing long-term growth is likely to lead to similar announcements, but still expects these companies to reserve ample resources to deploy into research programs.
B07: TOP 10 COMPANIES IN GLOBAL PRESCRIPTION DRUG SALES FROM BIOTECHNOLOGY
12 BIOTECHNOLOGY / SEPTEMBER 2014 INDUSTRY SURVEYS

Big Pharma retools with biotech-like R&D platforms and pipelines In recent years, many leading pharmaceuticals companies have bolstered their exposure to biologic drugs and technologies focusing on rare diseases, shifting from a prior focus on developing drugs designed to serve
large patient groups. According to industry trade group Pharmaceutical Research and Manufacturers of America (PhRMA), pharmaceutical and biotech companies are running patient trials for more than 5,400 new medicines, including nearly 1,800 for rare diseases and several hundred for diseases with no available current treatment. Most leading pharmaceutical companies have established new R&D platforms and made significant investments to expand biologic operations in hopes of better replicating the innovative and entrepreneurial structures more prevalent among biotech companies.
BIOSIMILARS NEARING MARKET, BUT STILL NEED CLARITY
The pharmaceutical industry has faced competition from generic drugs since the approval of the Hatch-Waxman Act in 1984. In contrast, the biotech industry has not had a formal regulatory pathway for the approval of biosimilar drugs (also referred to as follow-on biologics or biogenerics), which has enabled several first-generation biotech drugs to be sold without competition long after their patents have expired. The 2010 Patient
Protection and Affordable Care Act (PPACA), also known as the healthcare reform act, included formal Federal Drug Administration (FDA) authorization to establish a regulatory pathway for the approval and marketing of biosimilars.
The exclusivity period granted to originator drugs remains a contentious issue. Despite Congressional and White House leaders seeking a period of five to seven years, the PPACA granted a 12-year exclusivity period for branded companies, on the basis that a shorter period could stifle innovation by preventing drugmakers from recouping drug development costs. While debate over the issue has continued since the law’s passage, the US Supreme Court’s upholding of the law in June 2012 kept the 12-year exclusivity period intact, which we expect to be maintained.
The criteria required to prove similarity is another key issue yet to be fully determined, as biologics are typically far more complex to produce than chemical-based small molecule drugs. Biotechnology industry executives are eager to ensure that biosimilar drugmakers be subject to clinical trials (which are not required for traditional pharmaceutical generics), given their view that copies of such complex molecules could never be identical to the originals. Those favoring generics say these trials would be burdensome, and would significantly raise development costs. S&P expects that biosimilar drugs are unlikely to be widely approved with labels indicating that they are “interchangeable” with their branded counterpart until head-to-head comparisons are performed, and we expect this to be reflected in more modest early adoption and market acceptance.
B06: NOTABLE BIOTECH DRUG US PATENT EXPIRATIONS
NOTABLE BIOTECH DRUG US PATENT EXPIRATIONS2013
GLOBALSALES
BRAND NAME COMPANY INDICATION (BIL. $)2013
Epogen/Procrit Amgen/Johnson & Johnson
Red blood cell enhancement
3.32
Humalog Eli Lilly Type 1 diabetes 2.61Neupogen Amgen White blood cell
enhancement1.40
Rebif Pfizer/Merck Serono Multiple sclerosis 2.48Remicade Johnson & Johnson Rheumatoid arthritis 8.39
2014Aranesp Amgen Red blood cell
enhancement1.91
Copaxone Teva Multiple sclerosis 4.332015
Neulasta Amgen White blood cell enhancement
4.39
Rituxan Roche/Biogen IDEC Rheumatoid arthritis, blood cancer
7.50
2016Humira Abbott Labs Rheumatoid arthritis 11.02
2019Avastin Roche Oncology 6.75Herceptin Roche Oncology 6.56
2020Lucentis Roche/Novartis Wet adult macular
degeneration4.21
Sources: EvaluatePharma; company reports.
INDUSTRY SURVEYS BIOTECHNOLOGY / SEPTEMBER 2014 13

Progress remains slow in the US The FDA has issued draft guidance proposing that drug developers meet with the FDA to present product development plans and establish a schedule of milestones that would serve as landmarks for future discussions with the agency. From there, companies would use a step-wise approach to show biosimilarity to an FDA-approved biologic drug, including conducting clinical studies comparing the biosimilar drug with the original product, as well as performing safety studies. The FDA intends to use a totality-of-evidence approach to reviewing applications. While these guidelines are not yet finalized, several companies have initiated clinical testing of biosimilar drug candidates. The Biotechnology Industry Organization (BIO) trade group is pushing for biosimilars to carry distinct names to differentiate them from the reference drug, which is in contrast to pharmaceutical industry practice.
Toward the end of 2011, biotech bellwethers Amgen Inc. and Biogen Idec Inc., entered into deals to develop and market biosimilars, while preparing to protect the sales of their own drugs that are set to face competition. In both cases, the companies stated that their goal was to leverage their manufacturing expertise, while partners would provide marketing support.
In February 2013, Amgen stated that it expects to launch biosimilar versions of six leading currently marketed cancer and anti-inflammatory drugs in 2017. We partly attribute this lengthening of the timeline to market on challenges in establishing a clear regulatory pathway. Over the past several years, several companies have halted clinical studies on biosimilar versions of Roche’s Rituxan/MabThera, citing uncertainties over regulatory requirements.
Biopharmaceutical company Sandoz, a Novartis subsidiary, announced in July 2014 that the FDA accepted its filing for a biosimilar fligrastim using its 351(k) pathway—the first-ever in the US. On August 8, 2014, Celltrion announced that it completed the filing procedure to obtain US FDA approval for its infliximab biosimilar. If there are no setbacks, Celltrion anticipates obtaining the approval within one year.
Branded drugmakers are expected to retain significant market share upon the introduction of alternatives, as sizable development and manufacturing costs are likely to deter entrants to many markets. According to preclinical contract research organization (CRO), Harlan, (recently bought by Huntingdon Life Sciences), more than $200 billion in biosimilar sales are expected in the US over the next 10 years, if the versions approved in Europe come to market. In our view, the need to recoup sizable development, manufacturing, and marketing costs are likely to limit the price discounts of the biosimilar version. According to industry publication Genetic Engineering & Biotechnology News, the time and cost required to bring a biosimilar to market have ranged from six to nine years and $75 million–$250 million, versus three years and $1 million–$2 million for pharmaceutical generics.
However, as more pharma and biotech companies have stated their intentions to compete in the nascent industry, estimates for price discounts have risen from initial levels, but we do not expect any downward pricing pressure to push prices as low as the 80%–90% discount seen among generic versions of traditional chemical-based pharmaceuticals.
Europe moves on approving biosimilars In Europe, a regulatory pathway has been in place since March 2006, when the European Medicines Agency issued the world’s first guidelines for regulatory pathways for selected groups of biologics. Since then, Sandoz Ltd. (a subsidiary of Novartis AG) received European marketing authorization for Omnitrope, its copy of human growth hormone, and launched the product in Germany at a 20% discount to the branded drug. Omnitrope’s sales have been modest to date, as have generic versions of Amgen’s erythropoietin (EPO) drugs, which carry similar price concessions. In our view, the modest sales of these drugs have not been overly disruptive to the innovator’s market share. With several other countries making progress on defining their biosimilar regulatory frameworks, calls for a consistent, global agreement have increased. In September 2013, European regulators approved two biosimilar versions of the Johnson & Johnson’s blockbuster monoclonal antibody Remicade—Remsima and Inflectra—for the treatment of rheumatoid arthritis. Monoclonal antibodies previously had not faced competition from biosimilars. In 2012, Remicade generated $8.36 billion in global sales. Celltrion Inc. priced its Remsima version 30% lower than Remicade. As of August 2014, 14 biosimilars have been marketed in the European Union since 2006.
14 BIOTECHNOLOGY / SEPTEMBER 2014 INDUSTRY SURVEYS

New patent issuances detract from cost savings On August 8, 2014, Forbes estimated that the potential savings in the US from just 11 biosimilars could be $250 billion between 2014 to 2024. However, despite the promise of biosimilars to replace older medicines with cheaper alternatives, several legacy biologic drugs have been issued new patents that extend product lifecycles and are likely to keep biosimilar competition off the market indefinitely. In 2009, Avonex, a drug for the treatment of multiple sclerosis (2013 sales of $3.0 billion), was granted a new patent, taking the drug to 2026, when the drug had previously been facing expiration in the 2012–2013 timeframe. More recently, Enbrel, a leading treatment for rheumatoid arthritis and psoriasis (2013 sales of $4.55 billion), was issued a new patent in November 2011 that could extend the drug’s protection to as late as 2028. Enbrel had been expected to be subject to biosimilar competition as early as 2013. Although both of these drugs have seen revenue growth slow amid greater competition in their respective markets, such occurrences threaten to undermine the intent of healthcare reform legislation, which was to introduce more biosimilar drugs and lower the costs to the healthcare system.
CONTINUED RISE IN BIOTECH DRUG COSTS DISPROPORTIONATE TO OVERALL DRUG SPENDING
Concerns about rising health expenses are not new, even though prescription drug prices represent only 10% of healthcare expenditures, according to the Centers for Medicare & Medicaid Services (CMS), a division of the US Department of Health and Human Services. In 2014, prescription drug spending is expected to increase sharply to 8.8%, due primarily to the expected increase of prescription drug use by the newly insured under the healthcare reform.
Overall spending bounces back… According to IMS Institute for Healthcare Informatics, overall pharmaceutical prescription drug sales in the US increased by 1.0% in 2013, after decreasing by 1.0% in 2012. According to IMS, US drug sales in 2012 (latest available) were 84% generics, up from 80% in 2011. In contrast, in 2003, generics accounted for only 47% of such sales. With many leading drugs facing patent expiration in the coming years, we expect this shift to generics to continue. However, the price differential between branded and generics continues to widen.
…but specialty drugs outpace inflation Specialty drug spending costs, which include biologic drugs, are growing at a far higher clip. The 2013 Specialty Drug Trend Report (latest available) published by Express Scripts Holding Co., a pharmacy benefits management (PBM) firm, estimated that specialty drugs accounted for 27.7% of plan costs in 2013, up from 24.5% of plan costs in 2012, and 17.6% 2011. Also, the rate of specialty trend growth slowed in 2013 to 14.1%, compared with 18.4% in 2012 and 17.1% in 2011. In 2014, 2015 and 2016, specialty trend is expected to be at 16.8%, 18.0%, and 18.2%, respectively. Of note, three specialty classes—inflammatory conditions, multiple sclerosis, and cancer—accounted for 60% total specialty spending in 2013. Of particular concern is the rising cost of cancer treatments. According to Express Scripts, the cost of respiratory conditions and Hepatitis C drugs is projected to rise by around 103.6% and 205.0% in 2016.
According to Express Scripts, in its 2013 Specialty Drug Trend Report, although specialty drugs accounted for less than 1% of prescriptions filled in 2013, they made up 28% of total prescription drug expenditures. According to Express Scripts’ Prescription Price Index, prices on a market basket of the most highly utilized brand-name medications almost doubled since 2008. In contrast, prices of generic medications were cut roughly in half in the same period. This trend is expected to continue over the next several years, as Express Scripts forecast more than 16.0% growth over the 2014–2016 period for the specialty category, compared with a stable 2.0% decline for traditional categories.
IMPACT OF PERSONALIZED MEDICINE AND COMPARATIVE EFFECTIVENESS STUDIES
Recent healthcare trends have promoted a shift toward the expanded use of two treatment paradigms, with corollary concerns over whether they can coexist. The first paradigm is personalized medicine, which refers to the development and administration of treatments (based on the presence of genetic biomarkers or mutations) to patients who might best respond to an individually tailored treatment. The second—comparative effectiveness studies—seeks to compare outcomes, such as survival across various therapies, to determine the most
INDUSTRY SURVEYS BIOTECHNOLOGY / SEPTEMBER 2014 15

efficacious and cost-effective therapies. S&P thinks that in order to successfully advance both approaches, comparative effectiveness studies will need to adequately reflect outcomes from particular patient groups that might receive maximum benefit from certain treatments, rather than narrowly defining the criteria used to determine a treatment’s effectiveness, and possibly restrict how drugs are prescribed or reimbursed.
Advancement of personalized medicine The premise of personalized medicine is that developing medicines that are closely matched to a patient’s genetic profile is likely to improve the benefits to the patient and minimize adverse reactions. Projects aimed at mapping the human genome have contributed to advances in the use of genetic biomarkers to determine patient response.
These scientific advances have begun to make a commercial impact, as there were 100 prominent examples of personalized medicines, treatments, and diagnostics available in 2014, compared with 13 in 2006. In our view, the premise is deeply rooted in current drug development, as a 2010 survey by the Tufts Center for the Study of Drug Development (CSDD) revealed that 94% of biopharmaceutical companies surveyed reported investing in personalized medicine. S&P expects the migration toward personalized medicine to take time as drugs developed using such information advance through the clinical process. Over time, expansion of personalized medicine should lower R&D costs by reducing the length of biotech development timelines and enabling identification of promising targets earlier in the process, while eliminating those less likely to benefit patients. In addition, S&P expects increasing use of new drugs in combination with companion diagnostics that could help to identify which patients would likely benefit from a particular treatment based on their genetic profile. To that end, the FDA has proposed rules that would require targeted drugs up for review to be reviewed simultaneously, in most cases, with the review of the companion diagnostic on which they rely. Of note, among 11 new drugs approved between mid-2012 and mid-2013, two were approved together with companion diagnostics to ensure that the right patients received the approved drug, according to the American Association for Cancer Research (AACR), a scientific organization dedicated to cancer research.
Comparative effectiveness: how will findings be used? Included in President Obama’s $787 billion stimulus package passed in February 2009 was $1.1 billion for comparative effectiveness studies on currently marketed products, an endeavor that had received only modest funding in the past. According to Congressional Budget Office estimates, up to $2.5 billion could be spent on such studies through 2019. However, absent from this funding was a framework on how to apply the data generated by such studies. The research is expected to draw from sources such as electronic health records, registries, and healthcare claims to derive real-world outcome perspectives rather than relying solely on randomized clinical studies.
Critics have offered a wide range of complaints about comparative effectiveness studies. They suggest that such results may lead to unfavorable reimbursement decisions based on results that could be interpreted differently among physicians; that higher-priced drugs could face a loss of reimbursement at the hands of older drugs, based on price; and that requiring drugmakers to perform comparative studies in order to gain approval will slow an already lengthening industry pipeline. Congress has denied its intention to use comparative effectiveness studies to promote such outcomes, and has admitted that the initiative would be a work in progress and likely to face a “bumpy road.”
Although the uses of comparative effectiveness studies are not yet known, evidence continues to build that support the notion that newer and, typically, more expensive drugs are making more modest advances than their predecessors, which S&P thinks could play into prescribing and reimbursement decisions longer term. According to healthcare journal Prescrire, an analysis of 984 drugs under development since 2001 labeled only 17 as a “real advance” or better.
Similarly, a 2013 study, published in health policy research journal Health Affairs, compared drugs with the use of a placebo or earlier treatment for a particular condition for their efficacy. In the 1980s, drugs were four times more effective than a placebo, but in subsequent decades, the degree of improvement waned. In the 1990s, the improvement was two times more effective and, in the 2000s, it was only 36%. While earlier discovered treatments benefitted from a lack of previous options, S&P notes that more current clinical trial subjects are more likely to be more difficult to treat, having failed prior regimens.
16 BIOTECHNOLOGY / SEPTEMBER 2014 INDUSTRY SURVEYS

S&P thinks that comparative effectiveness studies are likely to have a profound impact on drug prices over the long term, particularly in cancer research, where progress has been incremental and benefits to survival have been modest, despite an explosion in pricing. We believe that many countries are likely to explore similar forms of health-technology assessments to curb the widespread use of high-priced medicines that offer only modest benefits.
DISEASE TRENDS
Biotechnology is driving innovation and growth in oncology, infectious diseases, autoimmune disorders, and diabetes. In the following section, we review biotech advances in these areas.
Cancer Cancer occurs when cells continue to grow and divide, and do not die when they should. Cancer cells damage nearby tissue and can spread to different parts of the body. At the end of the last decade, the World Health Organization noted that cancer was closing in on heart disease as the world’s leading killer. Progress in fighting many leading cancers has been incremental, and the number of global cases is expected to rise from 12.8 million in 2008 to 22.2 million in 2030, according to the AACR. An aging population, compounded by the increased prevalence of obesity and tobacco use, are cited as key contributors to this grim outlook. Meanwhile, drug and related medical costs have risen significantly. According to Express Scripts’ 2013 Specialty Drug Trend Report, expenditures for cancer treatments are projected to display steady year-over-year increases of around 24.3% between 2014 and 2016, representing the highest growth rates among drug categories.
However, prices are coming under scrutiny amid calls for more of an efficacy breakthrough. The National Cancer Institute projects the total cost of cancer treatment in the US to reach $174 billion by 2020, from $125 billion in 2010. In particular, immunotherapy accounts for a large portion of oncology drug sales, and is expected to reach $88 billion by 2016, according to IMS Health.
Cancer treatment is currently one of the most dynamic therapeutic categories in the pharmaceutical sector, and biotechnology companies are at the forefront of many of the ongoing changes. As May 2012 (latest available), America’s biopharmaceutical companies were
testing nearly 900 medicines and vaccines to fight cancer, according to PhRMA. In its annual Beyond Borders: Global Biotechnology Report 2013, Ernst & Young cited that cancer was by far the largest contributor to the overall biotechnology industry pipeline at 43%. Cancer is also the leading target among biologic drugs in development, representing 36% of that pipeline, according to PhRMA. According to healthcare market research company Decision Resources, among the top 25 drug companies, oncology is the focus of 30% of Phase II drugs and 22% of Phase III drugs. (See key trends in cancer therapies below).
Biomarkers are personalizing cancer treatment. As treatments are increasingly tailored to specific genetic subgroups, drugs will be prescribed to those for whom they are most likely to be effective, with the potential for smaller and accelerated clinical trials. Early examples of approved therapies targeted for specific cancer genetic subtypes include Herceptin, Gleevec, Avastin, and Erbitux.
H10: BIOTECHNOLOGY MEDICINES IN DEVELOPMENT, BY THERAPEUTIC CATEGORY
Cancer36%
Infectious disease
19%Autoimmune7%
Cardiovascular6%
Blood Disorders4%
Neurology4%
Respiratory4%
Skin Disorders3%
Digestive Disorders
3%
Other14%
Source: Source: Pharmaceutical Research and Manufacturers of America (PhRMA) 2013 Report: Medicines in Development–Biologics.
BIOTECHNOLOGY MEDICINES IN DEVELOPMENT, BY THERAPEUTIC CATEGORY
INDUSTRY SURVEYS BIOTECHNOLOGY / SEPTEMBER 2014 17

According to a 2012 analysis by researchers at The Institute of Cancer Research, London, and The Royal Marsden NHS Foundation Trust, treating cancer with targeted therapies appeared to be less toxic than chemotherapy. This analysis found the overall risk to patients suffering a life-threatening side effect was seven times less than for traditional cytotoxic agents, and response rates of newer-generation, targeted drugs in early human trials were twice that of non-targeted therapies.
More oncology drugs are being administered orally. Traditional cancer medications were given intravenously, in doctors’ offices, clinics, or hospitals. However, Express Scripts estimates that one-fourth of investigational cancer drugs are taken orally. They consist of small molecules, which can be more easily absorbed into the body than older oncology drugs made up of large proteins that are not easily absorbed.
Combination therapies are standard. Most of the oncology drugs in development are likely to be used in combination with other approved oncology drugs, as scientists realize the importance of a multifaceted approach in treating cancer. As a result, nearly all new oncology drugs are being tested in a variety of settings, for multiple indications, including for use with other biologics and/or chemotherapies. New oncology drugs, therefore, have to be judged not only on the initial indication for which they are approved, but also on their potential for use in other areas and with other drugs. The FDA has also encouraged companies to develop combinations in order to boost effectiveness and drive major advances in treatment paradigms, promising consideration for such combinations before each medicine is evaluated on its own.
Infectious diseases Infectious disease is an area of recent interest, fueled by global concerns about potential epidemics and the rising number of hard-to-treat hospital infections. This field covers a broad range of research on disease-preventing vaccines, new antibiotics to treat drug-resistant infections (a growing problem), and better, cheaper chronic treatments for HIV and AIDS patients. According to PhRMA’s 2013 Report: Biotechnology Medicines in Development, nearly 400 medicines and vaccines were being tested for infectious diseases.
HIV/AIDS. According to the United Nations (UN), the number of people infected with HIV worldwide at the end of 2013 was 35 million, about the same number as in the prior year, with the increase attributable to longer survival as a result of anti-retroviral therapy. Of the 35 million people living with HIV today, 19 million do not know that they have the virus. According to figures released in July 2014, new HIV infections and AIDS-related deaths have declined by 35%, and are at their lowest since the peak in 2005. Still, while UN-backed programs are helping to get new patients on therapy, slightly more than two-thirds of people with HIV globally are not receiving treatment. In late 2009, the World Health Organization updated treatment guidelines, calling for earlier treatment of HIV, which it estimated could add three million to five million patients to the estimated 9.5 million patients who require HIV therapy. The US represents a fraction of the global HIV epidemic, with 4% of the population living with HIV as of 2013.
Hepatitis C. After years with no new therapies, two new drugs were approved in 2011 for the treatment of Hepatitis C, which has infected an estimated 5.3 million people in the US, according to the United States Centers for Disease Control and Prevention (CDC), and 170 million worldwide, according to the Hepatitis Foundation International, although the disease remains widely under-diagnosed. In May 2012, the CDC issued draft guidelines proposing that all baby boomers (the generation of Americans born between 1946 and 1964) be tested for Hepatitis C.
Despite these new drug approvals, particularly Vertex Pharmaceuticals’ Incivek, which represented the fastest US drug launch in history with over $1.5 billion in sales over its first four quarters on the market, their use plateaued and waned since these initial quarters. One reason is development candidates offering the hope of shorter treatment durations and all-oral regimens that will reduce or eliminate the use of interferon or ribavirin as components of standard treatment regimens have made great strides toward late-stage study, and patients have increasingly opted to defer treatment until these new agents come to market.
In December 2013, the FDA approved Gilead Sciences’ Sovaldi, which shortened the treatment regimen to 12 weeks (including ribavirin/interferon) from Incivek’s 24 weeks. All-oral candidates hold the promise of durations as low as eight weeks, or maintain the 12-week regimen (but eliminate the use of ribavirin and interferon), which we think could be approved by late 2014. S&P also notes the likelihood of price scrutiny on
18 BIOTECHNOLOGY / SEPTEMBER 2014 INDUSTRY SURVEYS
these new medicines, as drug benefits manager Express Scripts stated its plans to endorse such treatments based on price. Gilead priced Sovaldi at $84,000 per 12-week regimen.
Autoimmune diseases Rheumatoid arthritis. Rheumatoid arthritis (RA) is one of the most common and serious forms of arthritis, affecting 1.3 million Americans according to the Arthritis Foundation. RA is mainly characterized by inflammation of the lining (synovium) of the joints, which causes swelling that can result in pain, throbbing, and, ultimately, deformity. Rheumatoid arthritis is most common in women and onset typically occurs between the ages of 40 and 60. Primary treatments include nonsteroidal anti-inflammatory drugs (NSAIDs) and disease-modifying drugs called DMARDs, particularly methotrexate. Biologics are typically used in combination with DMARDs to modify the immune system by inhibiting proteins called cytokines, which contribute to inflammation. Drugs approved for treating RA are also used for other inflammatory conditions, such as psoriatic arthritis, Crohn’s disease, and psoriasis.
According to a January 2013 report by GBI Research, the market for rheumatology therapeutics is expected to climb to $23.8 billion by 2018 from $17.1 billion in 2011, representing a compound annual growth rate (CAGR) of 4.8% (compared with a 9.4% CAGR in 2005–2011). We expect new competition over the coming years—ranging from less costly, orally dosed candidates to the introduction of biosimilars over the longer term—to significantly alter the competitive landscape and slow the industry’s revenue growth trajectory.
Multiple sclerosis. Multiple sclerosis (MS) is a chronic, often disabling disease that attacks the central nervous system (CNS)—the brain, spinal cord, and optic nerves. According to the National Multiple Sclerosis Society, there are approximately 400,000 people with multiple sclerosis in the US and more than 2.5 million people worldwide. Currently approved disease-modifying treatments are dosed either through injection or IV infusion and, more recently, several orally dosed medicines. The first orally dosed drug, Gilenya, marketed by Novartis AG, was launched in late 2010. In April 2012, the Committee for Medicinal Products for Human Use (CHMP), part of the European Medicines Agency (EMA), the European regulator, allowed Gilenya to remain on the European Union (EU) market with some additional warnings on cardiovascular effects, after a review following several patient deaths. A second oral drug, Aubagio, marketed by Sanofi, was approved in September 2012. Most recently, Biogen Idec Inc.’s Tecfidera received FDA approval in March 2013 and became the leading oral treatment in the US market in just its second full quarter on the market, driven by solid efficacy and its more favorable safety profile.
MS therapies have expanded significantly in both price and use in recent years. With new drugs coming to the market and several more expected in the next few years, S&P sees the potential for the MS market to rise significantly from our recent estimate of nearly $15 billion annually over the next decade, due to new drugs with enhanced efficacy reaching the market and treatment earlier in the course of the disease. However, we note that the category has faced some scrutiny over its cost-effectiveness, which we think is likely to increase as many global markets face financial challenges and seek to control spending.
Diabetes Diabetes is becoming more prevalent, largely as a result of poor nutrition and a lack of physical activity. According to the American Diabetes Association (ADA) National Diabetes Statistics Report, 2014, there are 29.1 million Americans with diabetes, but more than one quarter have not been diagnosed. According to the CDC, the number of people in the US with diabetes has grown at an alarming rate. In 42 states, the rates increased by 50% or more between 1995 and 2010, doubling in more than 18 states. Further, another 35% of adults fall into the pre-diabetic category, characterized by rising blood glucose levels, raising one’s risk of developing diabetes. Globally, the International Diabetes Foundation estimates the number of adults with diabetes at 385 million, and forecasts that one in 10 of the world’s population will have diabetes by 2035, growing to 592 million people. Several studies in recent years have pegged the economic impact of treating diabetes in medical expenditures and lost productivity as high as $200 billion–$300 billion annually.
Pharmaceutical trade group PhRMA cited 221 new medicines in development to treat diabetes in a November 2012 report. However, we view the competitive landscape to commercialize next-generation diabetes projects as intense and subject to regulatory scrutiny and delays, given the new guidelines requiring manufacturers to
INDUSTRY SURVEYS BIOTECHNOLOGY / SEPTEMBER 2014 19

evaluate cardiovascular risks before approval is granted. We expect this trend to increase clinical trial patient sizes and further slow the drug pipeline.
Neurodegenerative diseases Alzheimer’s disease. Alzheimer’s is a type of dementia that causes problems with memory, thinking, and behavior that worsen over time. According to the Alzheimer’s Disease Association, 5.4 million Americans are living with Alzheimer’s disease, mostly aged 65 and over, and by 2050, as many as 16 million Americans will have this disease, which has no cure. According to a study conducted by a subsidiary of insurer United HealthCare Group for the Alzheimer’s Disease Association, the total cost to the US economy is projected to be $20 trillion through 2050. Current spending is $130 billion annually.
According to a September 2012 report by PhRMA, the FDA has approved only three drugs for Alzheimer’s since 1998, whereas around 100 drugs have failed in clinical trials. This was primarily because the FDA required the drug to show significant improvement in cognition (memory and reasoning) or function of patients. However, the FDA is planning to ease the requirements for approval, and grant drugs that can show improvement in cognition.
In May 2012, the National Institutes of Health (NIH) announced plans for a clinical study using a drug developed by Roche’s Genentech unit to help prevent Alzheimer’s among people who are genetically predisposed to develop the disease, but are not yet showing symptoms. The study is expected to last five years. In July 2014, Roche announced its Phase II clinical results of crenezumab in Alzheimer’s disease. Although the proof-of-concept study in mild-to-moderate Alzheimer’s disease (AD) did not meet its co-primary endpoints, a positive trend in cognition was observed in people with mild AD who received high doses of intravenous crenezumab. Further, Roche announced its commitment to investigating medicines for AD across multiple pathways and disease stages.
Promising technologies As mentioned earlier in this section, the acceptance of biologic drugs among the pharmaceutical industry has increased dramatically in recent decades. Drug classes that were once shunned, like monoclonal antibodies, now comprise some of the fastest growing segments in the biopharma industry. However, such advancements are rarely achieved without setbacks, both in industry R&D support, as well as market acceptance. Below, we briefly highlight several areas of potential industry growth and recent setbacks they have faced.
RNA interference (RNAi). This important new technology involves switching particular genes on or off, and is a natural pathway to control gene expression. Unlike traditional small molecule medicines that target only certain classes of protein, RNAi seeks to design siRNAs (small interfering, or silencing RNA) for every gene/mRNA, to block the production of disease-causing proteins before they are made. This would provide the opportunity to improve disease control and intervention and focus on disease prevention rather than a standard symptom treatment model.
RNAi was the subject of research by the winners of the 2006 Nobel Prize for Medicine and seems to have tremendous potential for the treatment of cancer and infectious diseases. However, despite significant initial investment from leading pharmaceutical companies, interest waned in 2010–2012, before experiencing resurgence in 2013. We attribute the decline to companies such as Roche shuttering RNAi research as part of a corporate-wide restructuring, following a licensing pact with small biotech company and RNAi leader Alnylam Pharmaceuticals.
However, pipeline progress to later-stage development and drug delivery advances have helped to validate the technology, in our view, and have led to renewed interest in the area. In January 2014, Sanofi made a $700 million equity investment in Alnylam (representing a 12% stake), which gave Sanofi the rights to Alnylam’s pipeline candidates outside the US (as well as some in the US). Other companies conducting studies based on RNAi include Isis Pharmaceuticals and Tekmira Inc.
Cancer immunotherapy. Immunotherapy makes use of the immune system to avoid cancer by attacking the tumor cells responsible for development of cancer. This new therapy class has received a lot of attention among drug manufacturers in recent years. Among the most promising programs is Bristol-Myers Squibb’s
20 BIOTECHNOLOGY / SEPTEMBER 2014 INDUSTRY SURVEYS

drug Nivolumab, which showed positive results for treating melanoma in its Phase I trial presented at the American Society of Clinical Oncology (ASCO) conference in May 2013. Around 33% of patients with stage-4 melanoma showed shrinkage in tumor, compared with only 5% to 10% for Bristol-Myers’ Yervoy, which is already available in the market. Following close behind is Merck & Co.’s Lambrolizumb, which has been granted a “breakthrough therapy” designation by the FDA. Amgen has also produced promising clinical results for its T-Vec, an oncolytic virus that assaults the tumor cells and leads them to self-destruct. It also triggers the immune system to attack these cells. However, as noted earlier, we expect the prices of such treatments to face significant scrutiny in coming years.
Stem cells. These cells can be used to repair tissues and grow organs. Although embryonic stem cells are particularly useful because they can transform into any kind of cell in the body, they are also highly controversial because to date, starting a stem cell line has required the destruction of a human embryo and/or therapeutic cloning. In 2001, then-President Bush limited the use of embryonic stem cells in scientific research. In 2009, President Obama lifted the ban on their use as one of his first official actions upon taking office. In September 2010, a federal judge issued a temporary injunction barring the federal government from funding research involving the destruction of human embryos. In April 2011, a US appeals court ruled that government funding of embryonic stem cell research could continue. However, in October 2011, the EU Court of Justice banned the patents of stem cells when their extraction caused the destruction of a human embryo. The decision could threaten the future of stem cell research in Europe, and hinder the EU’s goal of speeding the development of regenerative treatments.
Uncertainty at the regulatory level has affected progress on the clinical front as well. In late 2011, Geron Corp., a leader in developing stem cell therapies, announced its intention to abandon its stem cell programs, citing that stem cell research still has a long way to go before developing real-world products, and the small company faced considerable cash burn should its research continue. A much larger and well financed company, Roche Holding AG, has taken a lead role in rallying nine other large drugmakers and additional stakeholders to build a collection of 1,500 induced pluripotent stem (iPS) cell lines for use in early testing of drugs against a range of neurological ailments, as well as diabetes.
HOW THE INDUSTRY OPERATES
Biotechnology refers to the application of biological and biochemical science to large-scale production of products to modify human health, food supplies, or the environment. Many of biotechnology’s basic principles are thousands of years old. Bacteria, fungi, and other living organisms have long been used to stimulate chemical reactions needed to process certain foods and beverages. Decades before the advent of genetic engineering, medicines made from living organisms were produced on a large scale—such as penicillin in the 1940s. Since the 1970s, however, scientists have learned how to manipulate organisms at the genetic level and reproduce those changes in massive quantities, facilitating the creation of new medical products.
Current advances in biotechnology are indebted to groundbreaking research in genetics and molecular biology conducted since the mid-twentieth century. In 1953, James D. Watson and Francis Crick first described the structure of deoxyribonucleic acid (DNA)—the molecule that carries the genetic code for virtually all forms of life. Then, in 1967, a team of US researchers, led by Arthur Kornberg, synthesized biologically active DNA in a test tube.
COMMERCIAL MILESTONES
In the early 1980s, the US Supreme Court recognized patent rights on genetically altered life forms. This important ruling enabled US biotech firms to invest in costly research projects, knowing that patents would protect their discoveries and ultimately sustain financial incentives.
INDUSTRY SURVEYS BIOTECHNOLOGY / SEPTEMBER 2014 21

In April 2003, the International Human Genome Sequencing Consortium, an international group of scientific centers, completed the sequencing of the human genome. This base of knowledge is enabling medical researchers to run extensive screens of human proteins, giving them the potential to identify thousands of biological targets against which new drugs can be developed.
S&P estimates that over 100 recombinant protein-based drugs have been approved to date. According to Pharmaceutical Research and Manufacturers of America (PhRMA)’s 2013 Report: Biotechnology Medicines in
Development, more than 900 are currently in development. We estimate that annual global sales of such drugs exceed $100 billion.
Key classes of biotech drugs In 1986, the US Food and Drug Administration (FDA) approved the first monoclonal antibody (mAb), Johnson & Johnson’s Orthoclone, for the treatment of transplant rejection. Today, mAbs are the industry’s key growth driver, with leading drugs for the treatment of cancer and inflammatory disease. According to PhRMA’s 2013 Report: Biotechnology Medicines in Development, 338 monoclonal antibodies were in development, accounting for more than a third of all biotech drugs being developed. Leading mAbs for inflammatory diseases include Johnson & Johnson’s Remicade and Abbott Laboratories Humira, with Roche’s Avastin a market leader for cancer. Despite these commercial successes, study on this drug class is at an early stage. The Tufts Center for the Study of Drug Development (CSDD) estimates that most mAbs in clinical trials are only in Phase I or Phase II study.
Other leading groups of biologic drugs are vaccines, growth factors, hormones, fusion proteins, cytokines, and therapeutic enzymes. Growth factor stimulants are proteins that can induce tissue development by affecting genetic switches in cells. Notable examples include Amgen’s Epogen/Aranesp, which stimulate red blood cell production, and Neulasta/Neupogen, which stimulate white blood cell production. Hormones are chemical messengers that travel through the blood stream to other parts of the body to maintain chemical balance. Key drugs in this group are insulin, human growth hormones, and thyroid stimulating hormones.
Table B02: TOP 10 BIOTECHNOLOGY DRUGS
TOP 10 BIOTECHNOLOGY DRUGS(Ranked by 2013 global sales)
SALES (MIL. $) PRODUCT COMPANY INDICATED USE 2012 2013 % CHG.
1. Humira Abbott Labs Rheumatoid and other forms of arthritis 9,616 11,014 14.52. Enbrel Amgen/Pfizer/Takeda Rheumatoid arthritis/psoriatic arthritis 8,496 8,778 3.33. Remicade J&J/Merck Rheumatoid arthritis/Crohn's disease 7,634 8,367 9.64. Seretide/Advair GSK/Almirall/Faes Farma Asthma 8,088 8,341 3.15. Lantus Sanofi-Aventis Diabetes 6,378 7,592 19.06. Rituxan Roche/Biogen IDEC B-cell non-Hodgkin's lymphoma/rheumatoid arthritis 7,155 7,503 4.97. Avastin Roche Oncology 6,149 6,751 9.88. Herceptin Roche Oncology 6,283 6,562 4.49. Januvia/Janumet Merck/Daew oong/Ono/Almirall Diabetes 6,231 6,254 0.4
10. Crestor AstraZeneca/Shinogi High Cholesterol 6,780 6,105 (10.0)Total, top 10 72,810 77,267 6.1
Source: Evaluate.
H11: MEDICINES IN DEVELOPMENT, BY PRODUCT CATEGORY
49
7
10
15
30
46
69
93
250
338
0 100 200 300 400
Other
Growth factors
Interferons
RNA interference
Antisense
Gene therapy
Cell therapy
Recombinant hormones
Vaccines
Monoclonal antibodies
Source: Pharmaceutical Research and Manufacturers of America (PhRMA) 2013 Report: Medicines in Development–Biologics.
BIOTECHNOLOGY MEDICINES IN DEVELOPMENT, BY PRODUCT CATEGORY
22 BIOTECHNOLOGY / SEPTEMBER 2014 INDUSTRY SURVEYS
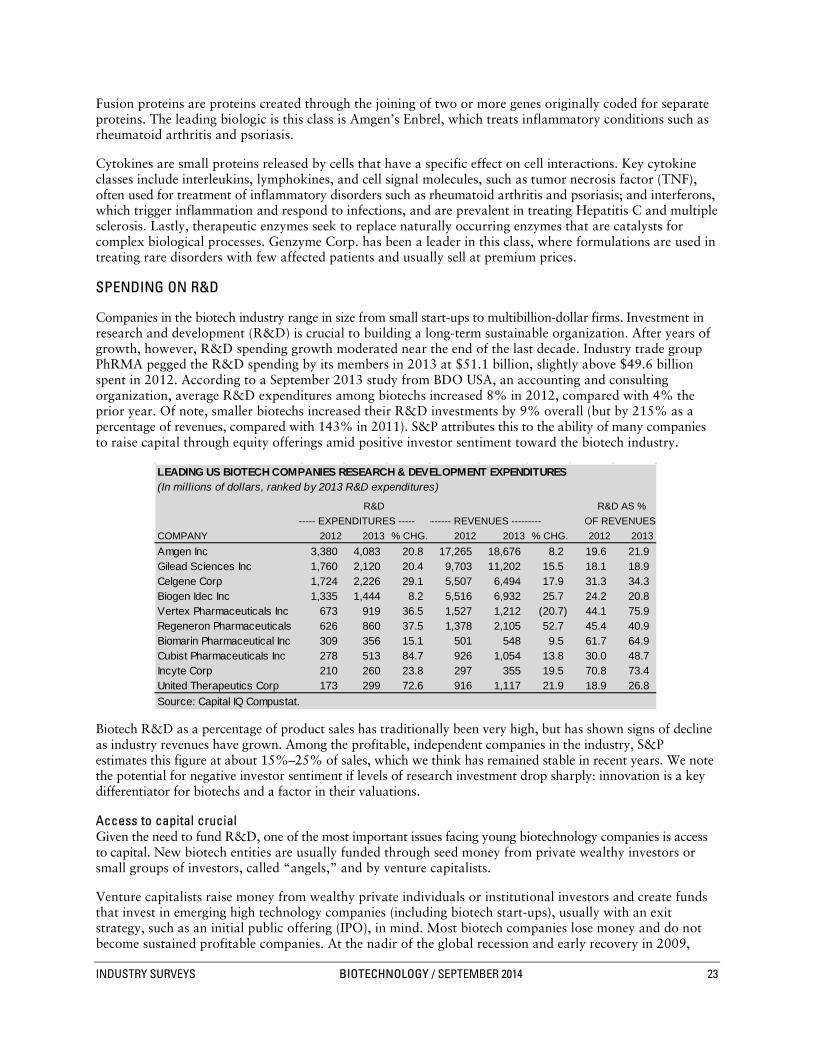
Fusion proteins are proteins created through the joining of two or more genes originally coded for separate proteins. The leading biologic is this class is Amgen’s Enbrel, which treats inflammatory conditions such as rheumatoid arthritis and psoriasis.
Cytokines are small proteins released by cells that have a specific effect on cell interactions. Key cytokine classes include interleukins, lymphokines, and cell signal molecules, such as tumor necrosis factor (TNF), often used for treatment of inflammatory disorders such as rheumatoid arthritis and psoriasis; and interferons, which trigger inflammation and respond to infections, and are prevalent in treating Hepatitis C and multiple sclerosis. Lastly, therapeutic enzymes seek to replace naturally occurring enzymes that are catalysts for complex biological processes. Genzyme Corp. has been a leader in this class, where formulations are used in treating rare disorders with few affected patients and usually sell at premium prices.
SPENDING ON R&D
Companies in the biotech industry range in size from small start-ups to multibillion-dollar firms. Investment in research and development (R&D) is crucial to building a long-term sustainable organization. After years of growth, however, R&D spending growth moderated near the end of the last decade. Industry trade group PhRMA pegged the R&D spending by its members in 2013 at $51.1 billion, slightly above $49.6 billion spent in 2012. According to a September 2013 study from BDO USA, an accounting and consulting organization, average R&D expenditures among biotechs increased 8% in 2012, compared with 4% the prior year. Of note, smaller biotechs increased their R&D investments by 9% overall (but by 215% as a percentage of revenues, compared with 143% in 2011). S&P attributes this to the ability of many companies to raise capital through equity offerings amid positive investor sentiment toward the biotech industry.
Biotech R&D as a percentage of product sales has traditionally been very high, but has shown signs of decline as industry revenues have grown. Among the profitable, independent companies in the industry, S&P estimates this figure at about 15%–25% of sales, which we think has remained stable in recent years. We note the potential for negative investor sentiment if levels of research investment drop sharply: innovation is a key differentiator for biotechs and a factor in their valuations.
Access to capital crucial Given the need to fund R&D, one of the most important issues facing young biotechnology companies is access to capital. New biotech entities are usually funded through seed money from private wealthy investors or small groups of investors, called “angels,” and by venture capitalists.
Venture capitalists raise money from wealthy private individuals or institutional investors and create funds that invest in emerging high technology companies (including biotech start-ups), usually with an exit strategy, such as an initial public offering (IPO), in mind. Most biotech companies lose money and do not become sustained profitable companies. At the nadir of the global recession and early recovery in 2009,
B03: LEADING US BIOTECH COMPANIES RESEARCH & DEVELOPMENT EXPENDITURES
LEADING US BIOTECH COMPANIES RESEARCH & DEVELOPMENT EXPENDITURES(In millions of dollars, ranked by 2013 R&D expenditures)
R&D R&D AS % ----- EXPENDITURES ----- ------- REVENUES --------- OF REVENUES
COMPANY 2012 2013 % CHG. 2012 2013 % CHG. 2012 2013Amgen Inc 3,380 4,083 20.8 17,265 18,676 8.2 19.6 21.9Gilead Sciences Inc 1,760 2,120 20.4 9,703 11,202 15.5 18.1 18.9Celgene Corp 1,724 2,226 29.1 5,507 6,494 17.9 31.3 34.3Biogen Idec Inc 1,335 1,444 8.2 5,516 6,932 25.7 24.2 20.8Vertex Pharmaceuticals Inc 673 919 36.5 1,527 1,212 (20.7) 44.1 75.9Regeneron Pharmaceuticals 626 860 37.5 1,378 2,105 52.7 45.4 40.9Biomarin Pharmaceutical Inc 309 356 15.1 501 548 9.5 61.7 64.9Cubist Pharmaceuticals Inc 278 513 84.7 926 1,054 13.8 30.0 48.7Incyte Corp 210 260 23.8 297 355 19.5 70.8 73.4United Therapeutics Corp 173 299 72.6 916 1,117 21.9 18.9 26.8Source: Capital IQ Compustat.
INDUSTRY SURVEYS BIOTECHNOLOGY / SEPTEMBER 2014 23

many smallcap companies had difficulty in raising capital and the IPO window all but closed for new offerings. However, as financial markets continue to recover from the significant disruption caused by the global recession, the financing environment has significantly improved, driven by positive sentiment toward the biotechnology industry.
According to the MoneyTree Report for the first quarter of 2014, which is compiled by consultancy PricewaterhouseCoopers and the National Venture Capital Association, US biotech companies were the second largest recipients of dollar investments, with $1.1 billion going into 112 deals. This is a 23% decline from the $1.3 billion in venture funding during the fourth quarter of 2013. The annual total amounted to $4.53 billion in 2013 and $4.19 billion in 2012.
One significant beneficiary of the enhanced investor and market sentiment toward the biotech industry throughout 2013, in our view, has been the environment for IPOs. According to financial analytics provider FactSet, 38 companies completed IPOs in the US in 2013, more than the annual total in both 2012 (11) and 2011 (10), and raised more than $3 billion, well ahead of 2012 ($807 million) and 2011 ($857 million), according to consultancy Ernst & Young. The pace of IPOs accelerated during the first half of 2013, before slowing near the end of the year.
Typically, S&P looks for a cash balance that could see a biotech firm through at least two years of operations as a benchmark of staying power.
The importance of partnerships Once a small firm has a promising investigational candidate, it often chooses to team up with a major pharmaceutical or biotech company. The larger company may provide upfront fees, R&D funding, milestone payments, royalties, and possibly co-promotion rights. In addition, the partner often provides needed production facilities and sales organizations for new products.
Many approved biotech products were developed with a collaborative partner, usually a leading pharmaceutical and larger biotech company. Such agreements have become a hallmark of the biopharma industry, and have often led to acquisitions between partnering firms after larger firms gain first-hand insights into a smaller company’s management, breadth of research capabilities, and prospects for pipeline advancement. As mentioned earlier in this Survey, only eight of the 27 new drug approvals in 2013 were secured by the originating company, which we think underscores the collaborative and acquisitive nature of the drug development industry. However, significant restructuring within the pharmaceutical industry in recent years has led to the dissolution of many pharma/small biotech partner deals and the need among biotech companies to seek new transactions in order to advance their clinical assets.
Patents make it happen Patents are among the most important benchmarks of progress in developing new biotechnology products. When a company obtains a patent for a new process or product, competitors are prohibited from commercial use of that discovery. In the biotech industry, patents are critical to raising the capital for R&D.
Among the different types of patents, a “composition of matter” patent, which describes the product’s chemical or biological nature, generally provides the company with the best protection. A “use” patent lets the holder manufacture and market the compound for a specific therapeutic purpose, preventing competitors from using the drug in the same way. A “process” patent describes the manufacturing process of a product.
Since the World Trade Organization (WTO)—the international body that focuses on the rules of trade between nations—established a multilateral trading system on January 1, 1995, many nations that had been lax about protecting patents are changing their laissez-faire approach. WTO regulations include the recognition of pharmaceutical patents, which extend for 20 years from the application date. Still, the ability to obtain and enforce patent protection varies by country, and US pharmaceutical companies have been leery of doing business in countries that fail to recognize international patents. WTO regulations contain an exception known as compulsory licensing, which allows a country to break patents in a national emergency and make copies of an important drug, typically over concerns that their huge, poor populations do not have the money to pay for life-saving, brand-name medications.
24 BIOTECHNOLOGY / SEPTEMBER 2014 INDUSTRY SURVEYS

Developing nations have become increasingly aggressive in fighting Western brand-name drug patents due to high prices. Recently, the Brazilian government declared Gilead Science Inc.’s core HIV compound Tenofovir to be of public interest, signaling the country’s interest in avoiding the drug’s patent and planned to issue a compulsory license. In March 2012, India issued a compulsory license for local generics company Natco Pharmaceuticals to sell cancer drug Nexavar, claiming that Bayer had made no effort to make the drug available, accessible, or affordable to the Indian public.
The issue of patents has become increasingly complex as advances in understanding the human genome have been made. Although US patent law states that what occurs in nature cannot be patented, the US Patent and Trademark Office has granted exclusive patent rights for gene sequences isolated from human chromosomes. According to the American Civil Liberties Union (ACLU), up to 20% of human genes have been granted patents. This practice has drawn criticism from multiple groups on the basis of impeding scientific progress. These groups have argued that companies should be able to patent proprietary drugs and tests derived from knowledge gained from gene sequencing, rather than patenting the natural discovery itself. In October 2010, the US Department of Justice opined that unmodified human DNA should not be eligible for patent. However, in August 2012, a US federal appeals court upheld Myriad Genetics Inc.’s right to patent two genes linked to breast and ovarian cancer. The issue was taken to the US Supreme Court, which, in June 2013, issued a unanimous ruling that naturally occurring DNA cannot be patented, whereas synthetic or complementary DNA can be patented. While S&P expects protracted legal debate over the issue, we note that most drugs in development are not directly affected given their manipulation of DNA to form a patentable invention.
THE DRUG DEVELOPMENT PROCESS
The biopharmaceutical approval process is both costly and lengthy. As of early 2011, the Tufts, a nonprofit academic research group, placed the average cost of developing a new drug at $1.3 billion. In 2013, Deloitte and Thomson Reuters affirmed this figure. In December 2012, the Office of Health Economics (OHE), a UK think tank, pegged the average cost of developing an approved drug at close to $1.9 billion. Other analyses that factor in failures of other pipeline candidates peg new medicine costs anywhere up to $5 billion.
In a 2011 analysis, the Tufts CSDD concluded that it takes 95 months (roughly eight years) to develop a biologic drug and bring it to market, similar to the timeline for a traditional small molecule drug. The study noted that various FDA mechanisms—such as orphan drug designation, fast-track status, and accelerated approvals—have not had a major impact on timelines from initiation to approval between 2000 and 2009. According to a January 2014 report from the Biotechnology Industry Organization (BIO) and intelligence provider BioMedTracker, success rates have declined, dropping from one in five/six in earlier periods to one in 10, using FDA data between 2003 and 2011. However, BIO points out that large molecule biologics are twice as successful in gaining approval compared with small molecule drugs.
These trends have given rise to attempts to uncover new ways to accelerate the development timeline, while reversing the trend of rising costs. An economic study sponsored by the National Institute of Standards and Technology suggests that an improvement in the R&D technology infrastructure, led by the standardization of data collection and quality control for post-market surveillance, would save 25%–48% of R&D expenses for each new biopharmaceutical drug approved by the FDA and would reduce development time significantly. In October 2011, the National Institutes of Health (NIH) compiled a list of approved drugs or drugs previously abandoned in clinical study that it believed could be repurposed for other uses, in an attempt to help the industry get more drugs to market more quickly, easing discovery bottlenecks. In December 2010, the director of the FDA’s Office of Oncology urged companies to design small pivotal, randomized trials powered to show a large cancer survival effect earlier in the process, rather than continuing the recent trend of lengthy programs that show modest and incremental gains over existing treatments. Such advances will be crucial to reverse these alarming trends. Likewise, the FDA’s “breakthrough therapy” designation holds the promise for some drugs to be approved as early as the completion of Phase I study, should these studies be designed to capture efficacy data.
The effort to discover and develop new therapeutics generally consists of several distinct steps: early discovery and preclinical development, clinical trials, and regulatory filing and review.
INDUSTRY SURVEYS BIOTECHNOLOGY / SEPTEMBER 2014 25

Early discovery and preclinical development According to the Tufts CSDD, preclinical work consumes nearly half of the R&D expenditures per biologic. While it is common to focus on a drug company’s clinical development pipeline, industry insiders know that many of the hurdles encountered during drug development occur before the compound enters the clinic. Toxicity has been the most common reason for drug failure in the preclinical phase. Outdated testing methods have proved to be a major bottleneck in the development process. Key steps in the process of developing biological drugs are detailed below.
Target identification. Genes are identified that are thought to be responsible for causing a particular disease. The ultimate goal in this step is to find and isolate potential areas for therapeutic intervention.
Target validation. Once a prospective disease target is uncovered, its role in the disease must be determined. Researchers use various methods, such as differential gene expression, tissue distribution analysis, and protein pathway studies, to verify the target’s significance.
Assay development. Assays, or chemical tests, are developed to determine the activity that potential treatments have on the target. Ideally, a drug development screen should be cost-effective, fast, accurate, easy to perform, quantitative, and amenable to automation. Some screens can be reused for other drug development studies, while many others must be tailored for the specific target and set of therapeutic compounds that will be tested.
Screening. Once the assay is ready for use, tests with a library of chemical compounds are conducted in an attempt to modulate a validated target. Researchers look for a predefined minimum level of activity against the target to advance the compound to secondary screening, which aims to confirm the activity, measuring the potency and assessing the selectivity of hits from the primary screen. This helps the drug developer to identify the most promising drug candidates in terms of their pharmacological characteristics.
Lead optimization. Through rescreening, researchers zero in on candidates with the best chance of safety and therapeutic efficacy. These molecules may demonstrate some activity, but they need to be modified to improve their effectiveness and reduce their potential side effects. This process, known as lead optimization, can include up to 10 or more iterations on previously optimized groups of compounds.
Preclinical studies. Prospective compounds that exhibit the greatest activity with the least chance of toxicity are called leads. Leads undergo years of FDA-mandated testing, which is necessary before human clinical trials can be initiated. These preclinical tests are done on animals to examine the compound’s absorption, metabolism, distribution, and excretion. The preclinical studies must prove a compound’s safety in terms of potential carcinogenicity and other toxic consequences and assess preliminary effectiveness of a compound. A sponsoring drug company must submit the results of preclinical testing to the FDA as part of an investigational new drug application (INDA), which is a formal request for permission to begin human clinical testing.
Clinical trials: putting candidates to the test The US drug approval system is one of the world’s most stringent. Biotechnology medications undergo the same lengthy testing process as any other pharmaceutical product, to demonstrate safety and efficacy.
The clinical testing period in humans usually consists of three phases. During Phase I, the drug is administered to a relatively small number of healthy people in order to test its safety in small doses. If this initial test appears successful, the dosage is slowly increased to determine its safety at higher levels. During Phase II, the drug is given to patients suffering from the disease or a condition that the drug is intended to treat. This round of tests is designed to evaluate the drug’s effectiveness and safety, and generally includes a larger patient population and a lengthier test period than Phase I. According to a September 2013 analysis by the Tufts CSDD, the main reasons for Phase I failures were commercial, while drug efficacy was the key driver of Phase II failures. Thus, determining a drug’s efficacy earlier in the clinical process could boost R&D productivity and allow companies to “fail faster” and devote resources to more promising programs.
Drugs that pass these hurdles then undergo Phase III, in which the most complex and rigorous tests are performed on still larger groups of ill patients to verify the drug’s safety, effectiveness, and optimum dosage
26 BIOTECHNOLOGY / SEPTEMBER 2014 INDUSTRY SURVEYS

regimens. Physicians closely monitor patients to determine efficacy and identify adverse reactions. Usually, Phase III trials (and often those of Phase II as well) employ randomized, double blind tests with placebo control to remove any chance for bias. This means that one group of patients is given the drug and another is given an inert substance; however, if there is already an approved drug for the indication, it will be used instead of the placebo. Neither the patients nor their doctors are aware of which patients are actually receiving the drug being tested.
After the development work is complete, company scientists analyze the data. If the data are positive, the company compiles it into a biologics license application (BLA) or a new drug application (NDA), which is submitted to the FDA for review. The application contains results of the preclinical and clinical research, and includes details of the product’s formula, production, labeling, and intended use. According to the 2014 report by Ernst and Young, 89% of drugs are approved in Phase I, while drugs in Phase III have a high failure rate of 40%. FDA approval is a rigorous process, and out of the 5,000 compounds discovered in the preclinical stage, only about five will make it through the entire approval process.
Regulatory filing and review The FDA’s Center for Drug Evaluation and Research (CDER) is responsible for reviewing therapeutic biological products and chemical-based drugs. The Center for Biologics Evaluation and Research reviews blood products, vaccines, and tissue-based products.
BLAs and NDAs are typically voluminous documents, sometimes exceeding 100,000 pages. Once an NDA or BLA is approved, the FDA determines the drug’s official labeling, including a detailed description of the drug and its composition, indications, contraindications, and side effects. This information is included in a drug’s package insert.
Following approval, the FDA continues to monitor the drug, because side effects or other unexpected developments sometimes become known after the drug is widely used. The FDA may require additional post-market studies (Phase IV) in order to evaluate long-term effects. Such studies are becoming more common. Often, after marketing has begun, the manufacturer submits supplemental applications requesting approval to use the drug for additional indications. For their initial applications of a new drug, manufacturers tend to seek narrow indications affecting well-defined sets of patients. Added approvals can greatly expand the market size and commercial potential of a biologic.
Shortage of clinical trial candidates slows industry pipeline According to the US National Institutions of Health (NIH), the number of registered clinical studies totaled 173,025 as of August 2014, compared with 159,318 in 2013. However, drugmakers are increasingly struggling to recruit a sufficient number of patients to participate in clinical studies. According to the Michael J. Fox Foundation for Parkinson’s Research, 85% of clinical trials face delays due to limited participation. S&P attributes this situation to several factors. First, the number of drugs under development has risen significantly. However, as discussed earlier in this Survey, the industry pipeline has been pared somewhat as a result of industry consolidation and pharmaceutical focus on novel medicines and, increasingly, rare diseases with smaller patient populations. Second, demands to show efficacy and safety over existing treatments have been growing. As more drugs are on the market for a given indication, new drugs face larger and more expensive studies to reach statistically significant results.
Cancer research has been particularly challenged by trial enrollment concerns. According to the American Association for Cancer Research (AACR), the majority of patients don’t know about the cancer clinical trials available to them. In recent years, various industry sources, including the AACR and National Cancer Institute (NCI), have pegged participation among cancer patients at around 3-5%. The Journal of the National Cancer Institute reported that 75% of cancer patients said they were unaware that they could take part in clinical trials as part of their treatment, while 10% were unsure. Of the people with cancer who were aware of clinical trials as an option, 25% reported participation, while 71% said they would not. Of those who did not participate, 57% said they considered participating, while 40% said they did not.
According to a January 2013 (latest available) Impact Report released by the Tufts CSDD, 89% of all clinical trials ultimately meet enrollment goals, though these rates of enrollment vary widely across
INDUSTRY SURVEYS BIOTECHNOLOGY / SEPTEMBER 2014 27

geographies. However, the study found that 11% of sites in a given trial typically fail to enroll a single patient and 37% under-enroll, accounting for nearly half of the total number. On the encouraging side, 13% exceeded enrollment targets.
Expedited processes for life-and-death treatments The FDA can allow for experimental drugs to be made available to seriously ill patients through its investigational new drug (IND) treatment policy. This provision lets manufacturers sell drugs (on a cost-recovery basis), provided that Phase I trials for the drug have been successfully completed. This policy was enacted in 1987.
Since 1997, drugs targeting life-threatening diseases that are not effectively treated by existing drugs can receive “fast-track” or expedited review by the FDA. Use of this designation has had a significant effect on speeding access to drugs that treat AIDS and various cancers. Another mechanism available is an accelerated approval pathway, initiated in 1992, in which a drug can be approved on clinical data that suggests that a drug has a meaningful benefit, with the promise of confirmatory data to support a full approval designation.
Some recent approvals granted under the accelerated approval program include Pomalyst and Kyprolis, by Celgene and Amgen (via its 2013 acquisition of Onyx), respectively. These were approved based on completed Phase II studies and approved earlier than their action dates. However, accelerated approval does not always result in the granting of full approval. In November 2011, the FDA revoked the accelerated approval status granted to Roche (via its acquisition of Genentech) in 2008 for advanced breast cancer. The approval was based on mid-stage studies that showed a progression-free survival (PFS) benefit. However, late-stage studies ultimately showed a more modest average PFS benefit, while exposing patients to side-effect risks that the FDA determined outweighed the benefit.
Most recently, the FDA Safety and Innovation Act 2012 introduced the “Breakthrough Therapy” designation, which offered the potential for a company to secure marketing approval as early as Phase I study, if a trial is designed to capture efficacy early on, rather than in later studies, as has been the case historically in the industry. A key distinguishing factor between the “breakthrough therapy” designation and other programs cited above is that the former promotes interaction and collaboration between the developing company and the FDA throughout the clinical process.
ORPHAN DRUGS
Enacted in 1983, the Orphan Drug Act was designed to encourage companies to develop drugs to treat rare diseases afflicting fewer than 200,000 Americans by providing research grants, tax breaks, and seven years of exclusive marketing rights to manufacturers of drugs aimed at patient markets that would otherwise be too small to justify commercial development.
An estimated 30 million Americans have one of the 7,000 rare conditions that have been identified by the National Institutes of Health (NIH). S&P thinks that momentum has been building for drugmakers to increase study of rare diseases. The latest data from PhRMA show that pharmaceutical and biotech companies are running patient tests of more than 5,400 potential new medicines, of which 70% are potential first-in-class medicines. The proportions of projects in development which could become first-in-class are particularly high in neurology (84%), cancer (80%), and psychiatry (79%). In addition, nine of the 39 new molecular entities approved in 2012 were orphan drugs, the highest percentage on record since the FDA launched the Orphan Drug Act, according to the Associated Press. According to PhRMA, in the 30 years since the Orphan Drug Act was established, more than 450 orphan drugs have been approved. Additionally, nearly half of the approved drugs fell under the FDA’s “fast-track” program. S&P expects that the favorable regulatory climate for rare disease drugs is likely to continue.
Historically, the FDA had struggled to entice drugmakers to research many neglected diseases. In June 2010, the FDA established a database for rare disease repurposing, listing currently approved treatments that have received orphan drug designation for an unapproved indication, in the hopes that it would spark interest among drug developers due to a potentially less onerous development path than studying an untested therapy compound. Past efforts that offered priority review vouchers were met with little response. Still, in early
28 BIOTECHNOLOGY / SEPTEMBER 2014 INDUSTRY SURVEYS

2011, the US Senate introduced the Creating Hope Act, which would offer vouchers promising fast FDA review for companies studying rare diseases that disproportionately affect children. In December 2011, the US Senate introduced another measure, the Unlocking Lifesaving Treatments for Rare-Diseases Act (ULTRA), which would allow the FDA to grant fast-track approval using a surrogate endpoint, without mandating the use of clinical treatment data or other historical clinical data.
Despite these efforts, patient advocate groups have pushed for additional policies that allow greater flexibility in how the agency reviews these drugs. The agency has been called upon to accelerate development timelines for conditions of serious unmet needs, as well as to raise the exclusivity period to ten years, to match levels set in Europe, from the current seven.
Orphan drugs becoming increasingly prevalent in industry pipeline According to the PhRMA, there were 452 medicines for rare diseases in US clinical study, as of October 2013 (latest available). According to Evaluate, the orphan drug market is set to grow at a compound annual
growth rate (CAGR) of 7.7% from 2012 to 2018, which is double the rate projected for the overall prescription market. Further, the return on investment expected from orphan drugs currently in their Phase III trials is 10.3X, compared with 6.0X for non-orphan drugs. This is primarily because the trials for orphan drugs are less expensive as they require fewer patients. In addition, orphan drugs receive a 50% R&D tax credit, which bolsters the return on investment.
Given this potential for higher returns, Evaluate forecasts an increased presence of pharmaceutical companies in rare diseases, with Novartis expected to be the top selling orphan drug company through 2018. In addition, Bristol-Myers Squibb, GlaxoSmithKline, and Sanofi are expected to increase their market share by 2018.
PRICING CONSIDERATIONS
To date, US biotechnology drug pricing has minimal regulatory scrutiny, as most approved treatments are used for hard-to-treat, potentially fatal diseases, where the cost benefit equation has been supported by the high value that society places on human life. As such, new biopharmaceuticals are typically very lucrative, and manufacturers have had wide discretion in pricing them. Many factors go into the pricing decision, including the relative efficacy of a given drug versus its rivals, the size of the target market(s), the price of competing therapeutics, and costs incurred in development.
In addition, a lack of alternative therapies for some conditions can leave doctors little choice in making prescription decisions. However, the exemption from cost pressures is eroding, as pharmaceutical costs rise, new biotech products come to market, and the biotechnology field grows increasingly competitive.
Although most drugs are priced near other established drugs in their class, breakthrough therapies for life-threatening conditions are usually priced exceptionally high. For example, in 2007, Alexion Pharmaceuticals Inc. launched Soliris for the treatment of paroxysmal nocturnal hemoglobinuria (PNH), a rare blood disorder; the cost of a year’s treatment with Soliris is more than $400,000. Specialty drugs, according to the Centers for Medicare & Medicaid Services (CMS), accounted for 9.4% ($263.3 billion) of US drug spending in 2012, despite representing only 0.5% of prescriptions in 2013, according to BioCentury, a leading provider of information, analysis, and data on the biotechnology and pharmaceutical industries.
Chart H04: WORLDWIDE ORPHAN DRUG SALES
0
2
4
6
8
10
12
14
16
18
0
20
40
60
80
100
120
140
160
180
2004 05 06 07 08 09 10 11 12 13 14 15 16 17 2018
Orphan drug sales (Bil.$, left scale)
Orphan sales as a % of total prescriptions (right scale)
Source: Evaluate.
WORLDWIDE ORPHAN DRUG SALES
INDUSTRY SURVEYS BIOTECHNOLOGY / SEPTEMBER 2014 29

Europe has taken a leading position on judging a drug’s cost-effectiveness. A growing number of drugs, particularly cancer drugs, have been approved by the European Medicines Agency (EMEA) but have not been made available because they have been deemed as not cost-effective by local governments. Such rulings can be made in each European Union (EU) member country because the EU’s regulatory system is not harmonized. The UK’s National Institute for Health and Clinical Excellence (NICE) has led the way.
KEY INDUSTRY RATIOS AND STATISTICS
R&D as a percentage of sales. New drugs represent the lifeblood of the biotechnology industry, so changes in this industrywide statistic can have an important impact on future trends in sales and earnings. According to Ernst & Young, research and development (R&D) expenditures as a percentage of total revenues were 29.5% for publicly held biotech companies in 2013, lower than 30.2% in 2012, and up from 29.3% in 2011 and 28.2% in 2010. For most money-losing operations, R&D expense typically far outpaces revenues. At present, the biotech industry devotes a higher percentage of its sales to R&D than any other major US industry. This ratio should decline as the industry matures and more products are commercialized, leading to ratios more comparable to those of the pharmaceutical industry.
Annual budget of the National Institutes of Health (NIH). The NIH, a division of the US Department of Health and Human Services (HHS), plays a vital role in drug discovery by funding basic research on the fundamental mechanisms of disease. The budget is usually disclosed in the early part of the year as part of the president’s total proposed federal budget for the fiscal year beginning October 1. The first and largest NIH institute is the National Cancer Institute (NCI), established in 1937.
About 40% of the NIH’s budget supports basic research, 40% is for transitional research, and 20% is for high-risk projects. The NIH receives approximately 50,000 research and training applications per year. From these applications, the division uses a peer review system to select the most qualified proposals for funding. For fiscal 2012, the NIH budget was finalized at $30.7 billion, up $299 million over the previous year. Due to the impact of sequestration in March 2013, which mandated a 2% spending cut in all government spending, the NIH’s budget for fiscal 2013 was roughly $29.2 billion. In January 2014, Congress approved a NIH budget of $29.93 for fiscal 2014. For fiscal year 2015, the NIH is requesting a $30.4 billion budget, 0.7% above the 2014 level.
National healthcare expenditures. The Centers for Medicare & Medicaid Services (CMS) a division of HHS, releases annual estimates of all healthcare spending in the United States. The data have a full-year lag and are structured according to type of expenditure, such as hospital care, physician care, and drugs and other medical nondurables.
Table B10: MOST EXPENSIVE BIOTECH DRUGS
MOST EXPENSIVE BIOTECH DRUGS
ANNUALDRUG INDICATION COST* ($) COMPANYSoliris Paroxysmal nocturnal hemoglobinuria 536,629 Alexion PharmaceuticalsNaglazyme Maroteaux-Lamy syndrome 485,747 BioMarin PharmaceuticalsKalydeco Cystic f ibrosis 299,592 Vertex PharmaceuticalsCinryze Hereditary angioedema 230,826 ViroPharmaH.P. Acthar Gel Infantile Spasms 205,681 Questcor PharmaceuticalsSprycel Chronic myeloid leukemia and Acute
lymphoblastic leukemia149,762 Bristol-Myers Squibb
Pomalyst Multiple myeloma 147,302 CelgeneXyrem Nacrolepsy 143,604 Jazz PharmaceuticalsErbitux Colorectal cancer, Head and neck cancer 137,953 Bristol-Myers SquibbRevlimid Multiple Myeloma, Mantle Cell Lymphoma
(MCL), transfusion-dependent myelodysplastic syndrome (MDS)
128,666 Celgene
*Dosage may vary based on a patients' w eight and other factors. Sources: EP Vantage
30 BIOTECHNOLOGY / SEPTEMBER 2014 INDUSTRY SURVEYS

The CMS’s annual report, Health, United States, includes detailed information on the sources and the amount of funds for each segment. Changes in funding sources are important to recognize, as margins are higher in the private sector than they are in government-financed sales (such as Medicaid and Medicare). Spending changes in specific illness segments can have an important bearing on pharmaceutical sales and demand for biotechnology products. Health, United States also provides figures on rates of change in total healthcare spending by segment. Proportional changes in pharmaceutical spending can be measured against other healthcare sectors to determine the industry’s relative growth.
The CMS estimates that national health expenditures rose 3.7% to $2.8 trillion in 2012 (latest available), representing 17.2% of US gross domestic product (GDP), down modestly from the previous few years. Further, the CMS has projected that costs would account for 19.9% of the national economy by 2022 and increase annually by an average of 5.8%, 1.0% faster than US GDP, driven by expected robust Medicare enrollment growth, Medicaid coverage expansions, and exchange plan premium and cost-sharing subsidies.
Medicare and Medicaid spending. Changes in spending and in reimbursement rates in these important government healthcare entitlement programs can have a significant impact on biotechnology business.
Medicare is a federally funded national health insurance program for people aged 65 and older, as well as for disabled persons. Historically, it has not covered the cost of drugs dispensed through retail pharmacies, which constitute the bulk of drugs sold in the US. However, it did reimburse for drugs administered in hospitals, clinics, or doctors’ offices—a benefit directed disproportionately at biotechnology products, which often are given by infusions or injections. In May 2014, CMS projected Medicare spending growth of 7.4% annually from 2015–2022, faster than US gross domestic product (GDP). In addition, CMS estimated the healthcare share of GDP rising to 19.9% in 2022, up from 17.9% in 2010.
Medicaid is a health benefits program for low-income US residents who are aged, blind, and disabled, or for members of families with dependent children. Federal and state governments jointly fund the program, though each state sets eligibility standards. Medicaid has traditionally covered the cost of pharmaceuticals for members. As of January 1, 2006, however, those eligible for Medicare received their prescription drug benefits through Medicare, and several million Medicaid recipients were moved to Medicare Part D for their drug coverage. The 2010 Patient Protection and Affordable Care Act (PPACA) also promised to expand Medicaid and Children’s Healthcare Insurance Program (CHIP) eligibility, beginning in 2014. As such, enrollment in these programs are expected to increase significantly in 2014, although we think the number of new enrollees could be hindered by states that have the right to opt out of this expansion, a right that was granted by the US Supreme Court in June 2012.
Interest rates. Like most corporations, biotechnology companies closely monitor changes in interest rates, as those rates affect management decisions on new capital expansion projects, acquisitions, and investment of idle cash. High interest rates increase the cost of borrowing and tend to make acquisitions financed by debt less attractive. In addition, increases in the rate at which future earnings are valued tend to push down biotechnology valuations.
As of July 2014, Standard & Poor’s Economics (which operates separately from S&P Capital IQ) was projecting that the yield on the three-month Treasury bill (a proxy for short-term interest rates) would be about 0.1% for 2014 and 0.4 for 2015. The average yield on 10-year notes (a proxy for long-term interest rates) was projected at 2.7% for 2014 and 3.3% for 2015.
While lower interest rates make debt financing more attractive, challenging credit conditions across the global economy dim the prospects of smaller companies qualifying for debt financing. For biotech firms that have substantial cash balances, lower interest rates can significantly reduce interest income, while their operating expenditures may not decrease. In September 2007, the federal funds rate was at 5.25%, when the Federal Reserve began cutting rates in order to spur a slowing US economy. As the recession worsened throughout 2008, rates were lowered to an unprecedented fed funds target range of 0.0%–0.25%, where they remain as of first eight months of 2014. The Federal Reserve has reiterated that the central bank is prepared for a protracted period of low interest rates, particularly while signs of inflation remain absent.
INDUSTRY SURVEYS BIOTECHNOLOGY / SEPTEMBER 2014 31

HOW TO ANALYZE A BIOTECHNOLOGY COMPANY
The analysis of a biotechnology firm, like that of any company, includes a thorough study of both business strategy and financial health. In contrast to companies in more mature industries, many biotech firms do not have commercial track records. Thus, analysts sometimes have to rely more heavily on qualitative rather than quantitative methods of valuation.
RESEARCHING THE BUSINESS
The first step in the analysis is to examine the company’s business strategy, core competencies, and market position. Many biotech companies are still in a developmental phase, so this step may rely heavily on qualitative judgments about management skill, technology, and new product potential.
In general, S&P Capital IQ (S&P) does not believe that market capitalization is an overly useful variable for measuring the success or prospects of a biotech entity, since market cap can be artificially inflated or deflated in times when equities are priced irrationally. Furthermore, biotech companies tend to have varying degrees of premiums incorporated into their share prices based on prospects for acquisition by a larger entity, making it more difficult to rely on traditional valuation measures.
Products and pipeline are key What are the company’s key products and features of the company’s technology platform? A biotech firm’s product portfolio and research pipeline are essential to its success. A company’s intrinsic value should be primarily a function of the prospective earnings to be gained from approved products and investigational compounds in development, as well as the probability of successfully developing pipeline candidates.
S&P thinks that companies with technologies that are scientifically sound and patentable—with the potential to spawn novel product candidates and applications—generally offer better risk/reward profiles than those that pin their hopes on candidates that may not provide product differentiation.
Look for companies with a number of promising product candidates in later stages of clinical development, preferably targeting diseases with large patient populations for which there is still a need for breakthrough medications. At the same time, be wary of companies with limited resources that may strain their operating capabilities by trying to develop too many marginal (referred to as “me-too” products) products in disease areas that are already well served, which could result in a low likelihood of success or limited market potential, and the possibility of recurring dilutive financing.
Patents provide protection Do patents adequately protect the firm’s products? In assessing a biotech company’s product portfolio, it is imperative to determine when the patents on its proprietary drugs and compounds expire. Although this tends to be more of a problem for pharmaceutical companies than for biotech firms, the loss of market exclusivity on key products, without adequate profit potential from other products or pipeline candidates, can lead to financial trouble. The issue of patent protection is poised to become a larger issue in the coming years, as progress toward a regulatory pathway for generic biotech drugs takes shape.
Current patents, meanwhile, can lead to royalties if a company decides to license its technology to other firms. Patents also protect companies by preventing potential competitors from entering certain markets.
Assessing R&D Have the company’s past research and development (R&D) efforts been productive? Most leading biotech companies spend between 15%–25% of operating revenues on R&D, with most development-stage biotechs often spending well over 100%. However, success rates—in terms of developing lucrative new drugs and therapeutics—can differ markedly.
The bigger, better-funded firms tend to have the advantage of being able to afford to hire top scientists and to conduct the larger, more costly clinical trials often required to develop new drugs, particularly as drug safety comes under greater scrutiny. Furthermore, in a healthcare market dominated by managed care, a key
32 BIOTECHNOLOGY / SEPTEMBER 2014 INDUSTRY SURVEYS

factor in future success will be the biotech industry’s ability to develop cost-effective new drugs that constitute therapeutic breakthroughs. New products that provide similar results to existing therapies are unlikely to achieve great commercial success.
Look for companies developing drugs for illnesses that are not adequately served by current treatments. Generally, drugs for chronic illnesses (such as asthma and rheumatoid arthritis) that have large patient populations can provide a higher return on R&D expenditures than can one-time treatments, such as vaccines.
Management strength Does the firm have experienced people? The quality and experience of a company’s management and scientific teams are very important in determining long-term success. The industry changes rapidly, so it is crucial for a firm to be led by insightful and quick-thinking individuals who can adapt to volatile circumstances.
Ideally, a biotech company should employ top executives who have helped develop and commercialize pharmaceutical products at large drug companies and successful biotech firms. Look for a demonstrated ability to reach milestones. Management should be credible in terms of historically meeting publicly stated goals and key development milestones. Be wary of a company that consistently misses its own targets.
We like management teams that have operating experience. It is important that the people running the company thoroughly understand and appreciate how expensive the drug development process is, and who have established track records of allocating the company’s funds to projects offering the highest returns on investment.
Making the most of alliances Has the firm entered into any promising collaborations or partnerships? Because of the extraordinarily high costs of drug development, a significant discovery made by a small biotechnology or biopharmaceutical company may go nowhere unless the firm can find a larger partner to fund clinical trials and help commercialize the product. It is important that biotech firms choose corporate partners that are committed to seeing the product to commercialization, which is increasingly important as many large pharma companies consolidate and streamline their areas of focus, and that have research experience and established sales infrastructure within a targeted market.
Careful attention should be given to the terms of the deal, as they tend to indicate the value the bigger partner places on the biotech company’s technology. From the junior partner’s perspective, a good deal typically includes a sizable upfront fee from the bigger firm, and may include equity, R&D funding for product development, milestone payments for achieving R&D benchmarks, co-promotion rights, and royalties on sales. Co-promotion rights are usually preferable to royalties, although the smaller firm may be constrained by limited resources, while upfront payments are generally more desirable than those tied to future R&D benchmarks.
Many biotech companies maintain both formal and informal relationships with scientists at leading medical colleges or other organizations, such as the federal government’s National Institutes of Health (NIH). Such relationships can be a valuable resource for a company in its quest for new drugs. Companies with connections to the NIH often gain rights to medications or drug targets discovered by the NIH (usually in conjunction with a leading university).
Financial resources Is the company well financed? A biotech firm must have adequate funding for its development programs, or it may be forced to curtail its R&D efforts. We like to see enough cash on the balance sheet to cover operating expenses for at least two years. Such a position can safeguard a firm from becoming desperate for funding and thus being forced to accept sub-optimal value on its assets.
An ample cash balance will let the firm operate from a position of strength when negotiating collaborative arrangements and gives the firm the ability to carry product development ahead on its own if necessary. The farther along a product is in the development process, the greater the potential future profits the firm should be able to retain in any negotiated deal. Having sufficient cash on hand is also important because access to financing tends to change over time. The biotech sector goes through periods when public equity markets are
INDUSTRY SURVEYS BIOTECHNOLOGY / SEPTEMBER 2014 33

not particularly receptive to funding risky ventures, and it is important for a company to have sufficient resources to see it through such times.
Regulatory compliance How effectively does the company work with the US Food and Drug Administration (FDA)? Because all drugs sold in the United States must first be cleared by this agency, it is critical that a firm is able to work closely with the FDA and satisfy the regulatory authority’s drug approval requirements.
Size and experience can help. The larger biotech firms are usually adept at working with the agency, while many smaller or newer firms are less proficient and often encounter major snags in obtaining approval for their products. Managers hired from successful biotech or pharmaceutical firms with proven drug development experience, and/or an alliance with a strong corporate partner, can prove to be invaluable. Increasingly, companies are involving the FDA in trial design and protocol throughout the clinical process, in an effort to prevent delays and negative surprises in the later stages.
ANALYZING FINANCIAL STATEMENTS
The usefulness of looking at a biotechnology company’s financial statements depends largely on whether the firm has any earnings history. Because most biotech companies (about 90%) are in the developmental stages and have little to no product sale revenues, traditional analytical techniques are of limited value. For these companies, analysts tend to focus on the future earnings potential of products in development, and on whether the company has the resources to fully develop those products.
Conversely, a financial analysis of one of the larger, profitable biotech companies tends to resemble that of a traditional pharmaceutical firm. Key metrics include revenues, costs and expenses, R&D as a percentage of sales, earnings, margins, growth in earnings per share and sales, and return on equity. When possible, individual company statistics should be compared with those of rival companies and the industry average.
Key elements of the income statement Central to any analysis is the income statement, which shows a company’s operating results over a stated period.
Sales. Starting at the top of the income statement, examine the short- and long-term trends in sales or revenues. Ideally, sales in the current period should show increases from the corresponding period in the prior year (year-over-year growth). However, because many biotech companies experience extremely rapid growth following the commercialization of a new drug, a pertinent interim measure for relatively new products is sequential sales growth—that is, increases from the immediately preceding quarter.
Growth rates should be compared with those of direct competitors whenever possible. Also, consider how growth has been achieved. Has it been generated by unit volume gains, price increases, acquisitions, any one-time or nonrecurring gains from asset sales, or some combination of these? Is the company gaining market share, or just riding market growth or price hikes?
R&D. Sufficient investment in R&D is critical to the success of any biotechnology company. R&D spending is unusually high for the biotechnology industry in general. For developmental-stage companies that have not yet produced commercial products, R&D typically exceeds revenues by a wide margin. When comparing companies, most analysts look at ratios such as R&D as a percentage of sales, R&D expenditures per employee, or R&D as a percentage of market capitalization.
Selling, general, and administrative (SG&A) expenses. Royalty costs and costs related to product co-promotion may be included in SG&A or another line item. Investors should compare royalty obligations and the financial structure of collaborative arrangements between firms in order to assess the potential profitability of a drug.
Option expense. Companies were required to expense this item on the income statement beginning in 2006. Investors should be aware of options grants, since a high level of outstanding options could dilute earnings per share (EPS) if these options are eventually exercised. A significant number of options
34 BIOTECHNOLOGY / SEPTEMBER 2014 INDUSTRY SURVEYS

outstanding could also divert company cash to repurchasing shares in order to neutralize the dilutive effect of options. This cash could have otherwise been used for product promotion, drug development, or dividends (assuming that profitable biotech firms eventually pay dividends). Investors should also be aware that many biotechnology companies report earnings excluding stock option expenses, described as “adjusted” or “non-GAAP” earnings.
Gross profit margin. This is the percentage of revenues left after deducting cost of goods sold. Gross margins generally will be lower for biotech firms than for large pharmaceutical companies, due to the complexity of manufacturing biologic drugs.
Product profit margin. S&P uses the percentage of sales remaining after subtracting the cost of goods sold (COGS) and SG&A to ascertain the maximum obtainable profitability per drug. This figure may vary widely because of the costs of co-promotion and royalty arrangements that often are embedded in certain expense line items. Management often does not detail such ongoing costs. In some instances, there are also costs involved for post-marketing clinical trials to support approved products. These costs also should be factored in.
Operating profit margin. This is the percentage of sales remaining after subtracting all ongoing operating costs. In the biotechnology industry, expenses (such as the COGS, R&D, labor, and overhead) tend to be very high. Companies incur substantial costs during a drug’s R&D phase; once those costs have been covered, however, a large portion of revenues flows to the bottom line.
Net profit margin. Net profit margin equals net income as a percentage of total sales. It reflects a company’s additions and subtractions for nonoperating income and expense items (typically interest income and interest expense), as well as taxes. For top-tier firms, net profit margins are usually in the range of 15% to 30%; the rest of the industry remains largely unprofitable.
Tax rate. Investors should be aware of a firm’s tax rate going forward since many biotech firms will face rising tax rates as they become profitable and exhaust historical net operating loss carryforwards, which will restrict net earnings and earnings growth in certain years.
Earnings per share (EPS). This figure—net EPS of outstanding common stock—is important for the more established biotech firms that have achieved profitability. Net earnings are the bottom-line return on a company’s business. Investors target growth and expect companies with profitable ongoing operations to meet or exceed EPS expectations.
Cash flow. A simplified definition of cash flow is net income (excluding special items) plus depreciation and amortization, less capital expenditures. Projecting this figure over many years is useful for performing discounted cash flow analysis of a firm.
Return on equity (ROE). Calculated as net earnings as a percentage of average or ending shareholder’s equity, ROE measures the return earned on shareholders’ capital.
Return on assets (ROA). This ratio (net income divided by average or ending total assets) measures the return on all assets under management’s care.
Using the balance sheet to assess liquidity The balance sheet is a snapshot of a company’s financial condition at a specific moment in time, so it should be examined to determine a company’s financial health. For biotechnology companies, most balance sheet analysis focuses on liquidity.
Cash. Analysts look at a company’s level of cash and marketable securities to assess short-term liquidity. The proper level of cash and cash equivalents varies from company to company. For development-stage biotech companies with no earnings, we like to see at least two years’ worth of cash on hand to fund operations at the current “burn rate”—the rate at which cash is being consumed by R&D and other expenditures. Investors also must consider the amount of convertible debt outstanding, if any, since a
INDUSTRY SURVEYS BIOTECHNOLOGY / SEPTEMBER 2014 35

number of biotech firms issue convertible notes. Subtracting outstanding debt from cash balances provides a more stringent measure of a company’s actual financial strength.
Inventory. Inventory as a percentage of product sales should be analyzed over time. A rising figure can be a warning sign, indicating that sales are falling short of expectations.
Current ratio. Another reliable check on liquidity is the ratio of current assets to current liabilities. The current ratio measures a company’s ability to pay its bills. A higher-than-average current ratio indicates financial strength, since current assets are readily available to be converted into cash. Given that most biotech companies have relatively large cash positions and low debt (they often rely on equity financings), biotech current ratios tend to be higher than those of other industries. This ratio is generally greater than 2.0 for many biotech firms. Any meaningful degradation in the current ratio from previous reporting periods may signal a liquidity problem.
Long-term debt to capital. This ratio is calculated by dividing long-term debt by total capital (the sum of long-term debt and stockholders’ equity). Simply put, it shows the percentage of total capital that long-term debt represents. A relatively low percentage indicates that the company may be less burdened than its peers in terms of debt service. Debt leverage varies significantly among biotechnology companies. Most have not tapped the debt markets much because of their lack of cash flow to service interest payments. An appropriate debt load depends largely on a company’s product lines and projected new product streams. Any sudden change in the company’s attitude toward taking on debt should be thoroughly investigated.
EQUITY VALUATION
S&P Capital IQ thinks that there are several relevant valuation methods for valuing biotech companies. For the few profitable and still independent companies, a price-to-earnings (P/E) ratio is widely used to compare a company’s valuation versus its peers. Taking this metric a step further, dividing the P/E ratio by a company’s long-term growth rate yields a price/earnings-to-growth (PEG) ratio, which puts the P/E ratio in the context of a company’s growth prospects rather than on an absolute basis. For companies that are not profitable, but for which profitability is anticipated within a few years, it is not uncommon for a future period’s P/E estimate to be used to value that company. Assigning that estimate with a target P/E multiple to reflect its growth prospects, and discounting that total back to the present year at a rate that reflects the risks of the company reaching that target valuation is a widely used technique.
The majority of publicly traded biotech companies remain at the development stage, and without near-term commercial prospects. Valuing these companies can be more difficult. S&P thinks it is appropriate in these cases to analyze the revenue potential for the company’s pipeline drivers and to discount their expected cash flows back to the present year at a discount rate commensurate with the risks, which typically reflect the stage of development. Determining a net present value of these assets and dividing the totals by the number of company shares can provide an estimate of a company’s stock price value.
36 BIOTECHNOLOGY / SEPTEMBER 2014 INDUSTRY SURVEYS

GLOSSARY
Agonist—A drug that promotes certain kinds of cellular activity by binding to a cell’s receptor.
Antagonist—A drug that prevents certain types of cellular reactions by blocking other substances from binding to a cell’s receptor.
Antibody—A protein produced by certain types of white blood cells to deactivate foreign proteins.
Antigen—Any substance that induces a body’s immune response.
Autoimmune disease—A condition, such as multiple sclerosis, where the body produces antibodies against its own tissues.
Bioavailability—The percentage of a drug’s active ingredient that reaches a patient’s bloodstream and body tissues.
Biochip/microarray—A miniaturized technology that can be used to run hundreds of tests simultaneously. The chips are etched with genetic or proteomic information and used by researchers to analyze DNA sequences, ascertain gene or protein expression, or detect genetic abnormalities known as mutations.
Biologics—Also known as biologic drugs, biologics are medicinal preparations made from living organisms or their byproducts. Vaccines, antigens, serums, and plasmas are examples of biologics.
Biologics license application (BLA)—The formal filing that drugmakers submit to the US Food and Drug Administration (FDA) for approval to market new biologics-based drugs. The application must contain clinical evidence of the compound’s safety and efficacy.
Biosimilar/biogeneric—A generic copy of a biological molecule, developed using modern biotechnology techniques. A biosimilar has similar activity and is structurally nearly identical to the biologic that it copies. Unlike generic chemical-based drugs, however, a biosimilar is not truly identical and therefore will require a different regulatory process than pharmaceutical generics.
Breakthrough drug—A compound with a mechanism of action significantly different from that of existing drugs, representing a major therapeutic advance.
Clinical trials—Tests, typically consisting of three stages, in which experimental drugs are administered to humans to determine their safety and efficacy before being submitted for regulatory marketing approval.
Combination therapy—The use of two or more drugs that together have greater therapeutic power in treating illness and diseases than either used alone.
Cytokines—A family of proteins, including interferons, interleukins, and various growth factors, that bind to cellular receptors and are involved in the regulation of cell function.
Deoxyribonucleic acid (DNA)—The basic molecule that contains genetic information for most living systems. The DNA molecule consists of four nucleotide bases (adenine, cytosine, guanine, and thymine) and a sugar-phosphate frame arranged in two connected strands forming a double helix.
Gene sequencing—A scientific technique whereby DNA strands are decoded in order to quantify the exact order of DNA’s four nucleotides (A, C, G, and T). This method allows scientists to analyze the sequence of strands and identify specific genes embedded in DNA.
Gene therapy—The introduction of specific genes into a patient’s body to replace defective ones or to suppress the action of a harmful one.
INDUSTRY SURVEYS BIOTECHNOLOGY / SEPTEMBER 2014 37

Genomics—The study of genes and their functions, including mapping genes within the genome, identifying their nucleic acid structures, and investigating their functions.
Growth factors—Proteins responsible for regulating cell proliferation, function, and differentiation.
Immunomodulator—A drug that attempts to modify the immune system.
Investigational new drug (IND)—Regulatory classification of an experimental new compound that has successfully completed animal studies and has been approved by the FDA to proceed to human trials.
Monoclonal antibodies (mAbs)—Large protein molecules produced by white blood cells, which seek out and destroy harmful foreign substances.
New drug application (NDA)—The formal filing that drugmakers submit to the FDA for approval to market new chemical-based drugs. The application must contain clinical evidence of the compound’s safety and efficacy.
Nucleic acid testing (NAT)—A method of biological screening and diagnostic testing that entails amplifying DNA and RNA to identify diseases and infections. NAT is faster and more accurate than more traditional screens and is being used to test blood supplies for HIV and hepatitis infection.
Orphan drug—A drug designed to treat a rare disease afflicting a relatively small patient population (currently fewer than 200,000 cases in the US). The US government provides special incentives to encourage development of such drugs.
Pharmacogenomics—The study of how an individual’s genetic composition affects the response to drugs. It combines traditional pharmaceutical sciences, such as biochemistry, with the knowledge of genes, proteins, and single nucleotide polymorphisms.
Polymerase chain reaction (PCR)—A scientific technique that uses special reagents and polymerase enzymes to amplify a specific fragment of DNA into larger quantities. PCR is used in a variety of genetic analysis settings, such as matching a DNA sample with a particular person or detecting infections.
Priority review—An investigational drug receiving this status from the FDA will be reviewed by the agency within eight months of its BLA or NDA submission, rather than the standard 12 months, according to new regulations recently approved for fiscal 2013.
Proteomics—The study of encoded proteins and their function, with an emphasis on the role that proteins may play in the development of disease.
Recombinant DNA technology—The process of creating new DNA by combining components of DNA from different organisms. Usually, the new DNA is then incorporated into therapeutic substances.
Recombinant soluble receptors—Synthetic versions of proteins manufactured using recombinant DNA technology and designed to block unwanted binding of cytokines to their cellular receptors.
Ribosome nucleic acid interference (RNAi)—Ribosomal nucleic acid, or RNA, plays an important role in protein production by carrying instructions from a cell’s genes (DNA) to its protein-making apparatus. RNAi is a method that can be used to prevent RNA from delivering its messages—in effect, silencing the gene and blocking production of the protein. Scientists believe RNAi may have tremendous potential for the development of new therapies.
Treatment IND—An FDA program that allows experimental drugs treating life-threatening illnesses to be made commercially available to very sick patients before the drugs obtain formal FDA approval.
Tumor necrosis factors (TNF)—Rare proteins of the immune system that appear to destroy some kinds of tumor cells without affecting healthy cells.
38 BIOTECHNOLOGY / SEPTEMBER 2014 INDUSTRY SURVEYS

INDUSTRY REFERENCES
PERIODICALS
Beyond Borders: Global Biotechnology Report http://www.ey.com Annual report on the global biotechnology industry, with information broken down by regions of the world.
BioCentury: The Bernstein Report on BioBusiness http://www.biocentury.com Weekly newsletter; analysis, interpretation, and commentary on biotech news and developments.
The Burrill Report http://www.burrillreport.com Monthly; actionable market intelligence on the latest global developments and trends in the life sciences industry.
Drug Trend Report http://www.drugtrendreport.com Annual publication with detailed analysis of prescription drug costs and utilization; published by Express Scripts, a pharmacy benefit manager.
Genetic Engineering & Biotechnology News http://www.genengnews.com Semimonthly; broad coverage of biotech news and analysis of industry trends.
IN VIVO: The Business & Medicine Report The RPM Report: Regulation, Policy, Market Access http://www.elsevierbi.com Monthly trade magazines. The first covers pertinent issues in the healthcare industry (biotech, medical devices, pharmaceuticals), with a focus on company-specific stories. The second covers regulatory and political trends.
The Journal of the American Medical Association http://www.jama.com Weekly; peer-reviewed medical journal that publishes research papers on a wide range of topics, as well as commentary from industry experts and physicians.
Nature Biotechnology http://www.nature.com/nbt Monthly; encompasses biotech news and trends, opinions, and research articles.
New England Journal of Medicine http://www.nejm.org Weekly; professional medical journal containing detailed scientific articles on medical treatments and health issues.
The Scientist http://www.the-scientist.com Monthly; covers scientific and business news.
BOOKS
The Merck Manual of Diagnosis and Therapy, 18th Ed. http://www.merck.com/pubs Detailed information on various diseases and medical conditions, as well as therapeutics used to treat them.
TRADE ASSOCIATIONS
American Society of Clinical Oncology (ASCO) http://www.asco.org Professional association of clinical oncologists with up-to-date information on cancer therapies and reimbursement.
The Biotechnology Industry Organization (BIO) http://www.bio.org Represents biotech companies, academic institutions, and state biotech centers in legislative and regulatory affairs; publishes industry statistics and information.
Pharmaceutical Research and Manufacturers of America (PhRMA) http://www.phrma.org Represents prescription drug firms in legislative and regulatory affairs; publishes industry statistics and information.
GOVERNMENT AGENCIES
Centers for Medicare & Medicaid Services (CMS) http://cms.hhs.gov This division of the US Department of Health and Human Services (HHS) administers the Medicare program and works with the states to administer Medicaid and the State Children’s Health Insurance Program (SCHIP). CMS also regulates laboratory testing and oversees the certification of nursing homes and continuing care providers.
European Medicines Agency (EMEA) http://www.emea.europa.eu Regulatory body responsible for approvals and oversight of medications in the European Union (EU).
INDUSTRY SURVEYS BIOTECHNOLOGY / SEPTEMBER 2014 39

Food and Drug Administration (FDA) http://www.fda.gov Federal agency charged with supervising the US food, pharmaceutical, and biotechnology industries; part of the Department of Health and Human Services (HHS).
National Center for Health Statistics (NCHS) http://www.cdc.gov/nchs The US government’s principal vital and health statistics agency; part of the Centers for Disease Control and Prevention (CDC).
National Institutes of Health (NIH) http://www.nih.gov Part of HHS, the NIH is the primary federal medical research agency. It conducts research in its own laboratories and supports research by scientists in universities, medical schools, hospitals, and research institutions in the United States and abroad. All of its 27 institutes—including the National Cancer Institute (NCI), which is a vast source of information on cancer treatments and research trends—can be accessed through the NIH main website.
ONLINE RESOURCES
Biospace.com http://www.biospace.com A centralized bioscience-specific “hub” site providing up-to-the-minute biotechnology and pharmaceutical developments, as well as links to other sources of biotech information.
ClinicalTrials.gov http://www.clinicaltrials.gov A centralized database operated by the National Institutes of Health (NIH), listing information on thousands of public and private clinical drug trials, completed or ongoing, in the United States.
Health News Daily http://www.healthnewsdaily.com Site that provides daily stories on industrywide, regulatory, and company-specific news.
The Pink Sheet http://www.elsevierbi.com Weekly newsletter; trade and regulatory coverage of the pharmaceutical and biotech industries.
OTHER SOURCES
IMS Health Inc. http://www.imshealth.com Market research firm providing prescription and sales information on pharmaceutical and biotechnology medications.
Tufts Center for the Study of Drug Development http://csdd.tufts.edu A nonprofit academic research group (affiliated with Tufts University) that provides strategic information to help drug developers, regulators, and policymakers improve the quality and efficiency of pharmaceutical development, review, and utilization.
40 BIOTECHNOLOGY / SEPTEMBER 2014 INDUSTRY SURVEYS

COMPARATIVE COMPANY ANALYSIS
Operating Revenues
Million $ CAGR (%) Index Basis (2003 = 100)Ticker Company Yr. End 2013 2012 2011 2010 2009 2008 2003 10-Yr. 5-Yr. 1-Yr. 2013 2012 2011 2010 2009BIOTECHNOLOGY‡ACOR § ACORDA THERAPEUTICS INC DEC 336.4 A 305.8 292.2 191.0 54.7 47.8 NA NA 47.7 10.0 ** ** ** ** NAALXN [] ALEXION PHARMACEUTICALS INC DEC 1,551.3 1,134.1 A 783.4 A 541.0 386.8 259.1 0.9 NM 43.0 36.8 176,892 129,317 89,331 61,683 44,105AMGN [] AMGEN INC DEC 18,676.0 A 17,265.0 15,582.0 15,053.0 14,642.0 15,003.0 8,356.0 8.4 4.5 8.2 224 207 186 180 175ARQL ARQULE INC DEC 15.9 36.4 47.3 29.2 25.2 14.1 65.5 A (13.2) 2.4 (56.3) 24 56 72 45 38BIIB [] BIOGEN IDEC INC DEC 6,932.2 5,516.5 5,048.6 4,716.4 A 4,377.3 4,097.5 679.2 A 26.2 11.1 25.7 1,021 812 743 694 645
CELG [] CELGENE CORP DEC 6,493.9 5,506.7 4,842.1 3,625.7 A 2,689.9 2,254.8 A 271.5 37.4 23.6 17.9 2,392 2,028 1,784 1,336 991CBST † CUBIST PHARMACEUTICALS INC DEC 1,054.4 A 926.4 754.0 A 636.5 562.1 A 433.6 3.7 NM 19.4 13.8 28,376 24,929 20,290 17,128 15,128EBS § EMERGENT BIOSOLUTIONS INC DEC 312.7 281.9 273.4 286.2 A 234.8 178.6 NA NA 11.9 10.9 ** ** ** ** NAGILD [] GILEAD SCIENCES INC DEC 11,201.7 9,702.5 A 8,385.4 7,949.4 7,011.4 A 5,335.8 867.9 29.1 16.0 15.5 1,291 1,118 966 916 808LGND § LIGAND PHARMACEUTICAL INC DEC 49.0 31.4 30.0 A 23.5 A 38.9 A 27.3 A,C 141.1 (10.0) 12.4 56.0 35 22 21 17 28
MNTA § MOMENTA PHARMACEUTICALS INC DEC 35.5 63.9 283.1 116.8 20.2 14.6 1.5 37.6 19.5 (44.5) 2,439 4,396 19,468 8,031 1,393REGN [] REGENERON PHARMACEUTICALS DEC 2,104.7 1,378.5 445.8 459.1 379.3 238.5 57.5 43.3 54.6 52.7 3,661 2,397 775 798 660RGEN § REPLIGEN CORP DEC 68.2 62.3 23.5 H 27.3 21.0 29.4 6.9 25.7 18.3 9.5 986 901 339 395 303SPPI § SPECTRUM PHARMACEUTICALS INC DEC 148.2 A 267.7 A 193.0 74.1 38.0 28.7 1.0 NM 38.8 (44.6) 14,825 26,771 19,296 7,411 3,803UTHR † UNITED THERAPEUTICS CORP DEC 1,117.0 916.1 743.2 A,C 603.8 369.8 281.5 53.3 35.5 31.7 21.9 2,094 1,717 1,393 1,132 693
VRTX [] VERTEX PHARMACEUTICALS INC DEC 1,212.0 C 1,527.0 1,410.6 143.4 101.9 175.5 69.1 D 33.2 47.2 (20.6) 1,753 2,209 2,040 207 147
LIFE SCIENCES TOOLS & SERVICES‡AFFX § AFFYMETRIX INC DEC 335.7 295.6 A 267.5 305.9 327.1 320.2 300.8 1.1 0.9 13.6 112 98 89 102 109A [] AGILENT TECHNOLOGIES INC OCT 6,782.0 6,858.0 A 6,626.0 5,463.0 A 4,481.0 5,774.0 6,056.0 1.1 3.3 (1.1) 112 113 109 90 74BIO † BIO-RAD LABORATORIES INC DEC 2,132.7 2,069.2 2,073.5 1,927.1 1,784.2 A 1,764.4 A 1,003.4 A 7.8 3.9 3.1 213 206 207 192 178CBM § CAMBREX CORP DEC 318.3 276.8 255.7 227.1 235.6 248.0 410.6 D,F (2.5) 5.1 15.0 78 67 62 55 57CRL † CHARLES RIVER LABS INTL INC DEC 1,165.5 A 1,129.5 A 1,142.6 1,133.4 D 1,202.6 A 1,343.5 A 613.7 A 6.6 (2.8) 3.2 190 184 186 185 196
CVD † COVANCE INC DEC 2,595.1 2,365.8 2,236.4 2,038.5 A 1,962.6 A 1,827.1 974.2 10.3 7.3 9.7 266 243 230 209 201LMNX § LUMINEX CORP DEC 213.4 202.6 A 184.3 A 141.6 A 120.6 104.4 26.3 23.3 15.4 5.4 812 771 701 538 459MTD † METTLER-TOLEDO INTL INC DEC 2,379.0 2,341.5 2,309.3 1,968.2 1,728.9 A 1,973.3 1,304.4 6.2 3.8 1.6 182 180 177 151 133PRXL § PAREXEL INTERNATIONAL CORP JUN 1,996.0 A 1,618.2 1,422.4 1,335.9 1,246.9 A 1,163.0 A 619.2 A 12.4 11.4 23.3 322 261 230 216 201PKI [] PERKINELMER INC DEC 2,173.6 2,141.5 1,921.3 A 1,704.3 D 1,812.2 A,C 1,937.5 D 1,535.2 D 3.5 2.3 1.5 142 139 125 111 118
TECH † TECHNE CORP JUN 310.6 314.6 290.0 A 269.0 264.0 257.4 145.0 7.9 3.8 (1.3) 214 217 200 186 182TMO [] THERMO FISHER SCIENTIFIC INC DEC 13,090.3 12,509.9 A,C 11,725.9 A,C 10,788.7 A 10,109.7 A 10,498.0 A 2,097.1 20.1 4.5 4.6 624 597 559 514 482WAT [] WATERS CORP DEC 1,904.2 1,843.6 1,851.2 1,643.4 1,498.7 1,575.1 A 958.2 7.1 3.9 3.3 199 192 193 172 156
OTHER COMPANIES RELEVANT TO INDUSTRY ANALYSISALNY ALNYLAM PHARMACEUTICALS INC DEC 47.2 66.7 82.8 100.0 100.5 96.2 0.2 A NM (13.3) (29.3) 26,799 37,912 47,021 56,841 57,121AMLN AMYLIN PHARMACEUTICALS INC DEC NA NA 650.7 668.8 758.4 840.1 85.7 NA NA NA NA NA 760 781 885ELN ELAN CORP PLC -ADR DEC NA 0.2 D 660.7 D 1,169.7 820.9 761.8 762.1 NA NA NA NA 0 87 153 108ENZN ENZON PHARMACEUTICALS INC DEC 34.5 42.6 48.1 57.0 D 184.6 196.9 146.4 A (13.5) (29.4) (19.0) 24 29 33 39 126HGSI HUMAN GENOME SCIENCES INC DEC NA NA 131.0 157.4 275.7 48.4 8.2 NA NA NA NA NA 1,604 1,926 3,376
MYGN MYRIAD GENETICS INC JUN 613.2 496.0 402.1 A 362.6 326.5 D 333.6 A 64.3 25.3 12.9 23.6 953 771 625 564 508NPSP NPS PHARMACEUTICALS INC DEC 155.6 130.6 101.6 89.4 84.1 102.3 9.9 31.7 8.8 19.1 1,569 1,317 1,025 901 848NBIX NEUROCRINE BIOSCIENCES INC DEC 2.9 53.1 77.4 33.5 3.0 4.0 139.1 (32.0) (6.0) (94.5) 2 38 56 24 2
Note: Data as originally reported. CAGR-Compound annual grow th rate. ‡S&P 1500 index group. []Company included in the S&P 500. †Company included in the S&P MidCap 400. §Company included in the S&P SmallCap 600. #Of the follow ing calendar year. **Not calculated; data for base year or end year not available. A - This year's data reflect an acquisition or merger. B - This year's data reflect a major merger resulting in the formation of a new company. C - This year's data reflect an accounting change. D - Data exclude discontinued operations. E - Includes excise taxes. F - Includes other (nonoperating) income. G - Includes sale of leased depts. H - Some or all data are not available, due to a f iscal year change.
INDUSTRY SURVEYS BIOTECHNOLOGY / SEPTEMBER 2014 41
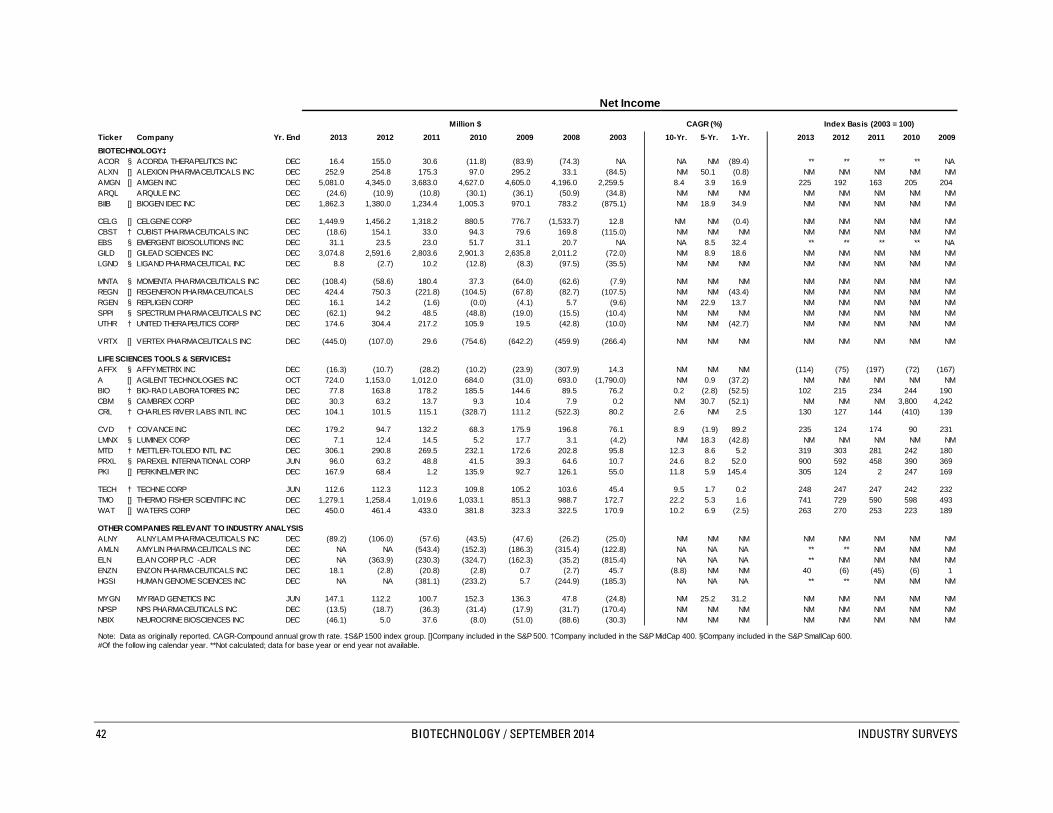
Net Income
Million $ CAGR (%) Index Basis (2003 = 100)Ticker Company Yr. End 2013 2012 2011 2010 2009 2008 2003 10-Yr. 5-Yr. 1-Yr. 2013 2012 2011 2010 2009BIOTECHNOLOGY‡ACOR § ACORDA THERAPEUTICS INC DEC 16.4 155.0 30.6 (11.8) (83.9) (74.3) NA NA NM (89.4) ** ** ** ** NAALXN [] ALEXION PHARMACEUTICALS INC DEC 252.9 254.8 175.3 97.0 295.2 33.1 (84.5) NM 50.1 (0.8) NM NM NM NM NMAMGN [] AMGEN INC DEC 5,081.0 4,345.0 3,683.0 4,627.0 4,605.0 4,196.0 2,259.5 8.4 3.9 16.9 225 192 163 205 204ARQL ARQULE INC DEC (24.6) (10.9) (10.8) (30.1) (36.1) (50.9) (34.8) NM NM NM NM NM NM NM NMBIIB [] BIOGEN IDEC INC DEC 1,862.3 1,380.0 1,234.4 1,005.3 970.1 783.2 (875.1) NM 18.9 34.9 NM NM NM NM NM
CELG [] CELGENE CORP DEC 1,449.9 1,456.2 1,318.2 880.5 776.7 (1,533.7) 12.8 NM NM (0.4) NM NM NM NM NMCBST † CUBIST PHARMACEUTICALS INC DEC (18.6) 154.1 33.0 94.3 79.6 169.8 (115.0) NM NM NM NM NM NM NM NMEBS § EMERGENT BIOSOLUTIONS INC DEC 31.1 23.5 23.0 51.7 31.1 20.7 NA NA 8.5 32.4 ** ** ** ** NAGILD [] GILEAD SCIENCES INC DEC 3,074.8 2,591.6 2,803.6 2,901.3 2,635.8 2,011.2 (72.0) NM 8.9 18.6 NM NM NM NM NMLGND § LIGAND PHARMACEUTICAL INC DEC 8.8 (2.7) 10.2 (12.8) (8.3) (97.5) (35.5) NM NM NM NM NM NM NM NM
MNTA § MOMENTA PHARMACEUTICALS INC DEC (108.4) (58.6) 180.4 37.3 (64.0) (62.6) (7.9) NM NM NM NM NM NM NM NMREGN [] REGENERON PHARMACEUTICALS DEC 424.4 750.3 (221.8) (104.5) (67.8) (82.7) (107.5) NM NM (43.4) NM NM NM NM NMRGEN § REPLIGEN CORP DEC 16.1 14.2 (1.6) (0.0) (4.1) 5.7 (9.6) NM 22.9 13.7 NM NM NM NM NMSPPI § SPECTRUM PHARMACEUTICALS INC DEC (62.1) 94.2 48.5 (48.8) (19.0) (15.5) (10.4) NM NM NM NM NM NM NM NMUTHR † UNITED THERAPEUTICS CORP DEC 174.6 304.4 217.2 105.9 19.5 (42.8) (10.0) NM NM (42.7) NM NM NM NM NM
VRTX [] VERTEX PHARMACEUTICALS INC DEC (445.0) (107.0) 29.6 (754.6) (642.2) (459.9) (266.4) NM NM NM NM NM NM NM NM
LIFE SCIENCES TOOLS & SERVICES‡AFFX § AFFYMETRIX INC DEC (16.3) (10.7) (28.2) (10.2) (23.9) (307.9) 14.3 NM NM NM (114) (75) (197) (72) (167)A [] AGILENT TECHNOLOGIES INC OCT 724.0 1,153.0 1,012.0 684.0 (31.0) 693.0 (1,790.0) NM 0.9 (37.2) NM NM NM NM NMBIO † BIO-RAD LABORATORIES INC DEC 77.8 163.8 178.2 185.5 144.6 89.5 76.2 0.2 (2.8) (52.5) 102 215 234 244 190CBM § CAMBREX CORP DEC 30.3 63.2 13.7 9.3 10.4 7.9 0.2 NM 30.7 (52.1) NM NM NM 3,800 4,242CRL † CHARLES RIVER LABS INTL INC DEC 104.1 101.5 115.1 (328.7) 111.2 (522.3) 80.2 2.6 NM 2.5 130 127 144 (410) 139
CVD † COVANCE INC DEC 179.2 94.7 132.2 68.3 175.9 196.8 76.1 8.9 (1.9) 89.2 235 124 174 90 231LMNX § LUMINEX CORP DEC 7.1 12.4 14.5 5.2 17.7 3.1 (4.2) NM 18.3 (42.8) NM NM NM NM NMMTD † METTLER-TOLEDO INTL INC DEC 306.1 290.8 269.5 232.1 172.6 202.8 95.8 12.3 8.6 5.2 319 303 281 242 180PRXL § PAREXEL INTERNATIONAL CORP JUN 96.0 63.2 48.8 41.5 39.3 64.6 10.7 24.6 8.2 52.0 900 592 458 390 369PKI [] PERKINELMER INC DEC 167.9 68.4 1.2 135.9 92.7 126.1 55.0 11.8 5.9 145.4 305 124 2 247 169
TECH † TECHNE CORP JUN 112.6 112.3 112.3 109.8 105.2 103.6 45.4 9.5 1.7 0.2 248 247 247 242 232TMO [] THERMO FISHER SCIENTIFIC INC DEC 1,279.1 1,258.4 1,019.6 1,033.1 851.3 988.7 172.7 22.2 5.3 1.6 741 729 590 598 493WAT [] WATERS CORP DEC 450.0 461.4 433.0 381.8 323.3 322.5 170.9 10.2 6.9 (2.5) 263 270 253 223 189
OTHER COMPANIES RELEVANT TO INDUSTRY ANALYSISALNY ALNYLAM PHARMACEUTICALS INC DEC (89.2) (106.0) (57.6) (43.5) (47.6) (26.2) (25.0) NM NM NM NM NM NM NM NMAMLN AMYLIN PHARMACEUTICALS INC DEC NA NA (543.4) (152.3) (186.3) (315.4) (122.8) NA NA NA ** ** NM NM NMELN ELAN CORP PLC -ADR DEC NA (363.9) (230.3) (324.7) (162.3) (35.2) (815.4) NA NA NA ** NM NM NM NMENZN ENZON PHARMACEUTICALS INC DEC 18.1 (2.8) (20.8) (2.8) 0.7 (2.7) 45.7 (8.8) NM NM 40 (6) (45) (6) 1HGSI HUMAN GENOME SCIENCES INC DEC NA NA (381.1) (233.2) 5.7 (244.9) (185.3) NA NA NA ** ** NM NM NM
MYGN MYRIAD GENETICS INC JUN 147.1 112.2 100.7 152.3 136.3 47.8 (24.8) NM 25.2 31.2 NM NM NM NM NMNPSP NPS PHARMACEUTICALS INC DEC (13.5) (18.7) (36.3) (31.4) (17.9) (31.7) (170.4) NM NM NM NM NM NM NM NMNBIX NEUROCRINE BIOSCIENCES INC DEC (46.1) 5.0 37.6 (8.0) (51.0) (88.6) (30.3) NM NM NM NM NM NM NM NM
Note: Data as originally reported. CAGR-Compound annual grow th rate. ‡S&P 1500 index group. []Company included in the S&P 500. †Company included in the S&P MidCap 400. §Company included in the S&P SmallCap 600. #Of the follow ing calendar year. **Not calculated; data for base year or end year not available.
42 BIOTECHNOLOGY / SEPTEMBER 2014 INDUSTRY SURVEYS
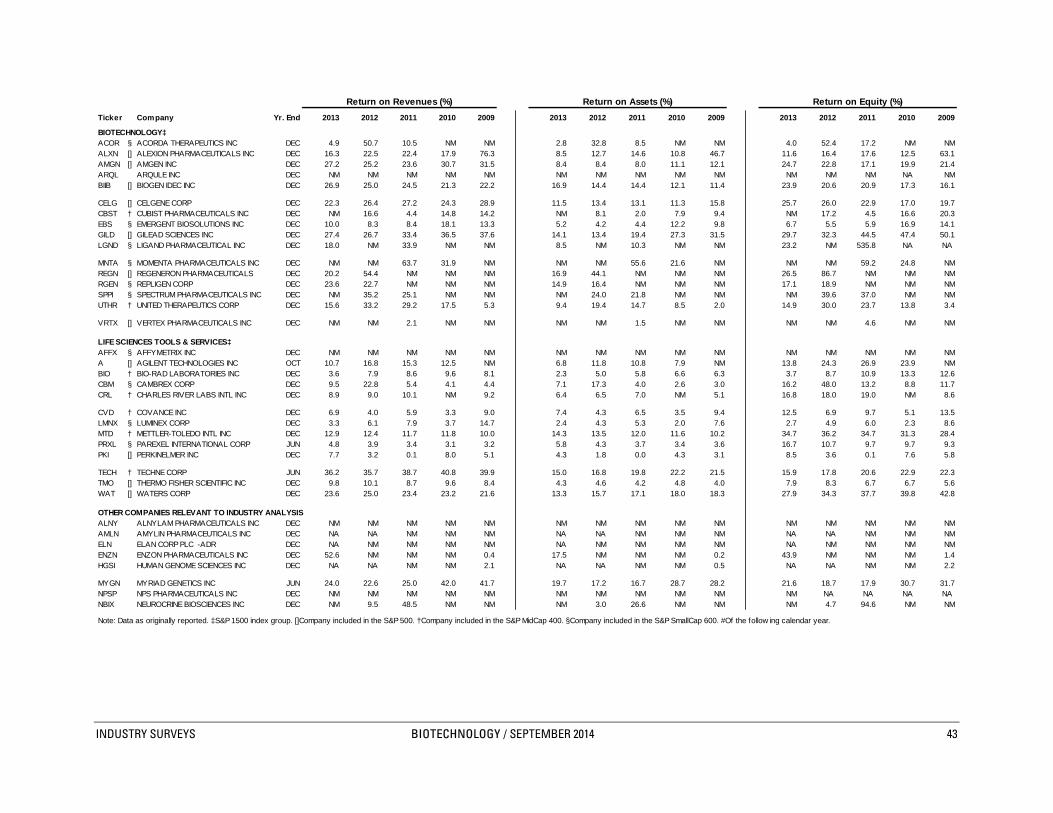
Return on Revenues (%) Return on Assets (%) Return on Equity (%)
Ticker Company Yr. End 2013 2012 2011 2010 2009 2013 2012 2011 2010 2009 2013 2012 2011 2010 2009
BIOTECHNOLOGY‡ACOR § ACORDA THERAPEUTICS INC DEC 4.9 50.7 10.5 NM NM 2.8 32.8 8.5 NM NM 4.0 52.4 17.2 NM NMALXN [] ALEXION PHARMACEUTICALS INC DEC 16.3 22.5 22.4 17.9 76.3 8.5 12.7 14.6 10.8 46.7 11.6 16.4 17.6 12.5 63.1AMGN [] AMGEN INC DEC 27.2 25.2 23.6 30.7 31.5 8.4 8.4 8.0 11.1 12.1 24.7 22.8 17.1 19.9 21.4ARQL ARQULE INC DEC NM NM NM NM NM NM NM NM NM NM NM NM NM NA NMBIIB [] BIOGEN IDEC INC DEC 26.9 25.0 24.5 21.3 22.2 16.9 14.4 14.4 12.1 11.4 23.9 20.6 20.9 17.3 16.1
CELG [] CELGENE CORP DEC 22.3 26.4 27.2 24.3 28.9 11.5 13.4 13.1 11.3 15.8 25.7 26.0 22.9 17.0 19.7CBST † CUBIST PHARMACEUTICALS INC DEC NM 16.6 4.4 14.8 14.2 NM 8.1 2.0 7.9 9.4 NM 17.2 4.5 16.6 20.3EBS § EMERGENT BIOSOLUTIONS INC DEC 10.0 8.3 8.4 18.1 13.3 5.2 4.2 4.4 12.2 9.8 6.7 5.5 5.9 16.9 14.1GILD [] GILEAD SCIENCES INC DEC 27.4 26.7 33.4 36.5 37.6 14.1 13.4 19.4 27.3 31.5 29.7 32.3 44.5 47.4 50.1LGND § LIGAND PHARMACEUTICAL INC DEC 18.0 NM 33.9 NM NM 8.5 NM 10.3 NM NM 23.2 NM 535.8 NA NA
MNTA § MOMENTA PHARMACEUTICALS INC DEC NM NM 63.7 31.9 NM NM NM 55.6 21.6 NM NM NM 59.2 24.8 NMREGN [] REGENERON PHARMACEUTICALS DEC 20.2 54.4 NM NM NM 16.9 44.1 NM NM NM 26.5 86.7 NM NM NMRGEN § REPLIGEN CORP DEC 23.6 22.7 NM NM NM 14.9 16.4 NM NM NM 17.1 18.9 NM NM NMSPPI § SPECTRUM PHARMACEUTICALS INC DEC NM 35.2 25.1 NM NM NM 24.0 21.8 NM NM NM 39.6 37.0 NM NMUTHR † UNITED THERAPEUTICS CORP DEC 15.6 33.2 29.2 17.5 5.3 9.4 19.4 14.7 8.5 2.0 14.9 30.0 23.7 13.8 3.4
VRTX [] VERTEX PHARMACEUTICALS INC DEC NM NM 2.1 NM NM NM NM 1.5 NM NM NM NM 4.6 NM NM
LIFE SCIENCES TOOLS & SERVICES‡AFFX § AFFYMETRIX INC DEC NM NM NM NM NM NM NM NM NM NM NM NM NM NM NMA [] AGILENT TECHNOLOGIES INC OCT 10.7 16.8 15.3 12.5 NM 6.8 11.8 10.8 7.9 NM 13.8 24.3 26.9 23.9 NMBIO † BIO-RAD LABORATORIES INC DEC 3.6 7.9 8.6 9.6 8.1 2.3 5.0 5.8 6.6 6.3 3.7 8.7 10.9 13.3 12.6CBM § CAMBREX CORP DEC 9.5 22.8 5.4 4.1 4.4 7.1 17.3 4.0 2.6 3.0 16.2 48.0 13.2 8.8 11.7CRL † CHARLES RIVER LABS INTL INC DEC 8.9 9.0 10.1 NM 9.2 6.4 6.5 7.0 NM 5.1 16.8 18.0 19.0 NM 8.6
CVD † COVANCE INC DEC 6.9 4.0 5.9 3.3 9.0 7.4 4.3 6.5 3.5 9.4 12.5 6.9 9.7 5.1 13.5LMNX § LUMINEX CORP DEC 3.3 6.1 7.9 3.7 14.7 2.4 4.3 5.3 2.0 7.6 2.7 4.9 6.0 2.3 8.6MTD † METTLER-TOLEDO INTL INC DEC 12.9 12.4 11.7 11.8 10.0 14.3 13.5 12.0 11.6 10.2 34.7 36.2 34.7 31.3 28.4PRXL § PAREXEL INTERNATIONAL CORP JUN 4.8 3.9 3.4 3.1 3.2 5.8 4.3 3.7 3.4 3.6 16.7 10.7 9.7 9.7 9.3PKI [] PERKINELMER INC DEC 7.7 3.2 0.1 8.0 5.1 4.3 1.8 0.0 4.3 3.1 8.5 3.6 0.1 7.6 5.8
TECH † TECHNE CORP JUN 36.2 35.7 38.7 40.8 39.9 15.0 16.8 19.8 22.2 21.5 15.9 17.8 20.6 22.9 22.3TMO [] THERMO FISHER SCIENTIFIC INC DEC 9.8 10.1 8.7 9.6 8.4 4.3 4.6 4.2 4.8 4.0 7.9 8.3 6.7 6.7 5.6WAT [] WATERS CORP DEC 23.6 25.0 23.4 23.2 21.6 13.3 15.7 17.1 18.0 18.3 27.9 34.3 37.7 39.8 42.8
OTHER COMPANIES RELEVANT TO INDUSTRY ANALYSISALNY ALNYLAM PHARMACEUTICALS INC DEC NM NM NM NM NM NM NM NM NM NM NM NM NM NM NMAMLN AMYLIN PHARMACEUTICALS INC DEC NA NA NM NM NM NA NA NM NM NM NA NA NM NM NMELN ELAN CORP PLC -ADR DEC NA NM NM NM NM NA NM NM NM NM NA NM NM NM NMENZN ENZON PHARMACEUTICALS INC DEC 52.6 NM NM NM 0.4 17.5 NM NM NM 0.2 43.9 NM NM NM 1.4HGSI HUMAN GENOME SCIENCES INC DEC NA NA NM NM 2.1 NA NA NM NM 0.5 NA NA NM NM 2.2
MYGN MYRIAD GENETICS INC JUN 24.0 22.6 25.0 42.0 41.7 19.7 17.2 16.7 28.7 28.2 21.6 18.7 17.9 30.7 31.7NPSP NPS PHARMACEUTICALS INC DEC NM NM NM NM NM NM NM NM NM NM NM NA NA NA NA NBIX NEUROCRINE BIOSCIENCES INC DEC NM 9.5 48.5 NM NM NM 3.0 26.6 NM NM NM 4.7 94.6 NM NM
Note: Data as originally reported. ‡S&P 1500 index group. []Company included in the S&P 500. †Company included in the S&P MidCap 400. §Company included in the S&P SmallCap 600. #Of the follow ing calendar year.
INDUSTRY SURVEYS BIOTECHNOLOGY / SEPTEMBER 2014 43

Debt as a % of
Current Ratio Debt / Capital Ratio (%) Net Working CapitalTicker Company Yr. End 2013 2012 2011 2010 2009 2013 2012 2011 2010 2009 2013 2012 2011 2010 2009
BIOTECHNOLOGY‡ACOR § ACORDA THERAPEUTICS INC DEC 3.8 3.4 4.1 3.3 4.0 0.7 1.1 2.5 3.9 4.9 1.2 1.8 1.9 2.9 3.2ALXN [] ALEXION PHARMACEUTICALS INC DEC 3.8 4.2 4.1 4.7 4.4 3.8 4.8 0.0 0.5 1.5 6.1 8.9 0.0 0.9 3.6AMGN [] AMGEN INC DEC 3.4 3.8 4.8 3.5 4.9 53.6 54.6 52.9 31.2 31.6 152.5 104.4 97.7 65.7 70.4ARQL ARQULE INC DEC 3.5 3.0 1.5 1.7 1.9 0.0 0.0 0.0 0.0 0.0 0.0 0.0 0.0 0.0 0.0BIIB [] BIOGEN IDEC INC DEC 1.8 2.0 3.3 2.4 3.5 6.3 8.7 13.7 16.0 14.3 41.5 43.3 51.4 71.6 61.2
CELG [] CELGENE CORP DEC 3.9 3.3 2.8 4.1 7.8 39.6 29.2 16.9 15.6 0.5 74.9 72.1 45.3 38.7 0.6CBST † CUBIST PHARMACEUTICALS INC DEC 2.8 4.5 4.1 6.7 3.6 32.2 25.8 33.3 36.9 32.8 148.6 42.4 59.4 50.3 75.8EBS § EMERGENT BIOSOLUTIONS INC DEC 4.8 4.3 3.6 3.2 3.5 11.2 11.7 11.6 7.6 15.7 28.6 28.9 29.5 18.0 32.3GILD [] GILEAD SCIENCES INC DEC 1.1 1.4 5.5 2.3 2.6 25.5 43.1 53.0 32.6 15.4 415.3 374.0 66.7 87.5 39.3LGND § LIGAND PHARMACEUTICAL INC DEC 0.9 0.7 0.7 1.1 1.3 0.0 33.1 51.0 0.0 0.0 NM NM NM 0.0 0.0
MNTA § MOMENTA PHARMACEUTICALS INC DEC 12.1 19.7 24.9 11.5 6.2 0.0 0.0 0.0 0.0 2.1 0.0 0.0 0.0 0.0 2.3REGN [] REGENERON PHARMACEUTICALS DEC 6.0 7.4 4.4 3.3 4.5 20.5 26.8 47.3 23.2 21.6 33.7 43.7 86.4 64.1 32.8RGEN § REPLIGEN CORP DEC 7.6 6.2 6.3 12.1 12.8 0.0 0.0 0.0 0.0 0.0 0.0 0.0 0.0 0.0 0.0SPPI § SPECTRUM PHARMACEUTICALS INC DEC 2.6 2.1 2.9 1.9 3.2 24.1 20.6 0.0 0.1 0.1 63.0 53.0 0.0 0.1 0.1UTHR † UNITED THERAPEUTICS CORP DEC 1.3 3.8 2.6 1.8 1.0 0.3 20.1 21.7 7.2 4.4 1.7 55.9 75.9 20.5 NM
VRTX [] VERTEX PHARMACEUTICALS INC DEC 4.0 3.7 3.4 2.2 4.6 26.5 34.1 29.9 37.6 8.8 41.1 59.1 48.6 68.7 11.9
LIFE SCIENCES TOOLS & SERVICES‡AFFX § AFFYMETRIX INC DEC 2.3 2.3 5.8 3.9 5.8 32.7 37.4 25.8 24.5 45.4 133.3 170.0 36.7 59.7 71.6A [] AGILENT TECHNOLOGIES INC OCT 3.1 2.4 3.0 2.0 3.5 32.9 28.2 30.8 39.9 53.8 79.8 77.2 51.8 71.0 102.3BIO † BIO-RAD LABORATORIES INC DEC 3.6 4.1 3.9 3.0 3.7 15.6 25.6 28.6 31.4 36.2 34.6 50.2 54.6 55.9 64.6CBM § CAMBREX CORP DEC 2.1 1.7 2.3 2.6 2.7 26.2 26.0 45.7 48.0 50.0 75.3 105.0 126.5 141.1 128.0CRL † CHARLES RIVER LABS INTL INC DEC 2.2 1.4 2.0 2.1 2.4 49.5 46.2 56.5 48.3 24.4 210.3 368.6 336.4 228.7 132.3
CVD † COVANCE INC DEC 2.4 1.4 2.0 1.9 2.2 13.5 0.0 0.0 6.3 0.0 28.7 0.0 0.0 19.6 0.0LMNX § LUMINEX CORP DEC 5.1 4.7 7.2 8.7 7.2 0.2 0.7 1.0 1.4 1.6 0.4 1.7 1.9 2.2 2.9MTD † METTLER-TOLEDO INTL INC DEC 1.6 1.5 1.7 2.1 1.3 28.4 26.4 34.5 42.8 19.7 113.2 114.9 116.6 111.2 134.4PRXL § PAREXEL INTERNATIONAL CORP JUN 1.6 1.6 1.6 1.3 1.4 42.5 25.3 28.7 28.0 34.8 105.2 61.6 75.7 115.8 128.9PKI [] PERKINELMER INC DEC 1.7 1.7 1.4 2.1 1.8 31.4 32.3 33.1 17.6 25.0 210.9 240.3 360.4 74.4 144.0
TECH † TECHNE CORP JUN 12.8 9.7 12.7 11.8 16.5 0.0 0.0 0.0 0.0 0.0 0.0 0.0 0.0 0.0 0.0TMO [] THERMO FISHER SCIENTIFIC INC DEC 3.2 2.3 1.5 2.4 2.8 34.0 28.6 25.0 10.6 10.6 140.6 256.5 336.8 83.8 71.4WAT [] WATERS CORP DEC 5.2 4.5 3.2 4.1 3.0 40.1 41.6 36.3 39.6 37.1 57.5 59.6 52.2 58.3 64.3
OTHER COMPANIES RELEVANT TO INDUSTRY ANALYSISALNY ALNYLAM PHARMACEUTICALS INC DEC 4.7 2.6 1.9 2.5 2.7 0.0 0.0 0.0 0.0 0.0 0.0 0.0 0.0 0.0 0.0AMLN AMYLIN PHARMACEUTICALS INC DEC NA NA 1.4 1.7 2.5 NA NA 109.7 57.7 60.4 NA NA NM 170.6 118.9ELN ELAN CORP PLC -ADR DEC NA 2.6 1.8 1.9 4.5 NA 50.8 42.6 86.7 74.6 NA 102.6 276.1 289.5 169.9ENZN ENZON PHARMACEUTICALS INC DEC 5.4 1.6 10.8 23.6 5.8 0.0 0.0 39.6 28.8 82.4 0.0 0.0 86.3 32.3 208.0HGSI HUMAN GENOME SCIENCES INC DEC NA NA 2.0 1.9 4.8 NA NA 57.4 42.6 44.2 NA NA 188.6 173.7 97.1
MYGN MYRIAD GENETICS INC JUN 7.5 9.4 12.2 17.3 11.4 0.0 0.0 0.0 0.0 0.0 0.0 0.0 0.0 0.0 0.0NPSP NPS PHARMACEUTICALS INC DEC 4.4 4.6 4.6 2.6 2.0 54.1 147.5 128.4 211.7 430.6 61.7 157.8 133.7 220.0 407.1NBIX NEUROCRINE BIOSCIENCES INC DEC 12.7 12.1 2.8 2.5 2.8 0.0 0.0 0.0 0.0 0.0 0.0 0.0 0.0 0.0 0.0
Note: Data as originally reported. ‡S&P 1500 index group. []Company included in the S&P 500. †Company included in the S&P MidCap 400. §Company included in the S&P SmallCap 600. #Of the follow ing calendar year.
44 BIOTECHNOLOGY / SEPTEMBER 2014 INDUSTRY SURVEYS

Price / Earnings Ratio (High-Low) Dividend Payout Ratio (%) Dividend Yield (High-Low, %)
Ticker Company Yr. End 2013 2012 2011 2010 2009 2013 2012 2011 2010 2009
BIOTECHNOLOGY‡ACOR § ACORDA THERAPEUTICS INC DEC NM- 60 7 - 5 43 - 24 NM- NM NM- NM 0 0 0 NM NM 0.0 - 0.0 0.0 - 0.0 0.0 - 0.0 0.0 - 0.0 0.0 - 0.0ALXN [] ALEXION PHARMACEUTICALS INC DEC NM- 63 89 - 52 75 - 42 77 - 41 14 - 9 0 0 0 0 0 0.0 - 0.0 0.0 - 0.0 0.0 - 0.0 0.0 - 0.0 0.0 - 0.0AMGN [] AMGEN INC DEC 18 - 12 16 - 11 16 - 12 13 - 10 14 - 10 28 26 14 0 0 2.3 - 1.6 2.3 - 1.6 1.2 - 0.9 0.0 - 0.0 0.0 - 0.0ARQL ARQULE INC DEC NM- NM NM- NM NM- NM NM- NM NM- NM NM NM NM NM NM 0.0 - 0.0 0.0 - 0.0 0.0 - 0.0 0.0 - 0.0 0.0 - 0.0BIIB [] BIOGEN IDEC INC DEC 38 - 18 27 - 19 24 - 13 17 - 12 16 - 12 0 0 0 0 0 0.0 - 0.0 0.0 - 0.0 0.0 - 0.0 0.0 - 0.0 0.0 - 0.0
CELG [] CELGENE CORP DEC 50 - 23 24 - 17 24 - 17 35 - 25 35 - 22 0 0 0 0 0 0.0 - 0.0 0.0 - 0.0 0.0 - 0.0 0.0 - 0.0 0.0 - 0.0CBST † CUBIST PHARMACEUTICALS INC DEC NM- NM 21 - 15 75 - 39 16 - 12 18 - 10 NM 0 0 0 0 0.0 - 0.0 0.0 - 0.0 0.0 - 0.0 0.0 - 0.0 0.0 - 0.0EBS § EMERGENT BIOSOLUTIONS INC DEC 28 - 15 28 - 19 41 - 23 15 - 8 26 - 9 0 0 0 0 0 0.0 - 0.0 0.0 - 0.0 0.0 - 0.0 0.0 - 0.0 0.0 - 0.0GILD [] GILEAD SCIENCES INC DEC 38 - 18 23 - 12 12 - 10 15 - 9 18 - 14 0 0 0 0 0 0.0 - 0.0 0.0 - 0.0 0.0 - 0.0 0.0 - 0.0 0.0 - 0.0LGND § LIGAND PHARMACEUTICAL INC DEC NM- 44 NM- NM 31 - 17 NM- NM NM- NM 0 NM 0 NM NM 0.0 - 0.0 0.0 - 0.0 0.0 - 0.0 0.0 - 0.0 0.0 - 0.0
MNTA § MOMENTA PHARMACEUTICALS INC DEC NM- NM NM- NM 6 - 3 31 - 13 NM- NM NM NM 0 0 NM 0.0 - 0.0 0.0 - 0.0 0.0 - 0.0 0.0 - 0.0 0.0 - 0.0REGN [] REGENERON PHARMACEUTICALS DEC 74 - 36 24 - 7 NM- NM NM- NM NM- NM 0 0 NM NM NM 0.0 - 0.0 0.0 - 0.0 0.0 - 0.0 0.0 - 0.0 0.0 - 0.0RGEN § REPLIGEN CORP DEC 28 - 11 16 - 7 NM- NM NM- NM NM- NM 0 0 NM NM NM 0.0 - 0.0 0.0 - 0.0 0.0 - 0.0 0.0 - 0.0 0.0 - 0.0SPPI § SPECTRUM PHARMACEUTICALS INC DEC NM- NM 11 - 6 17 - 6 NM- NM NM- NM NM 9 0 NM NM 0.0 - 0.0 1.6 - 0.9 0.0 - 0.0 0.0 - 0.0 0.0 - 0.0UTHR † UNITED THERAPEUTICS CORP DEC 33 - 15 10 - 7 19 - 10 34 - 24 NM- 74 0 0 0 0 0 0.0 - 0.0 0.0 - 0.0 0.0 - 0.0 0.0 - 0.0 0.0 - 0.0
VRTX [] VERTEX PHARMACEUTICALS INC DEC NM- NM NM- NM NM- NM NM- NM NM- NM NM NM 0 NM NM 0.0 - 0.0 0.0 - 0.0 0.0 - 0.0 0.0 - 0.0 0.0 - 0.0
LIFE SCIENCES TOOLS & SERVICES‡AFFX § AFFYMETRIX INC DEC NM- NM NM- NM NM- NM NM- NM NM- NM NM NM NM NM NM 0.0 - 0.0 0.0 - 0.0 0.0 - 0.0 0.0 - 0.0 0.0 - 0.0A [] AGILENT TECHNOLOGIES INC OCT 27 - 19 14 - 11 19 - 10 21 - 14 NM- NM 22 9 0 0 NM 1.1 - 0.8 0.8 - 0.6 0.0 - 0.0 0.0 - 0.0 0.0 - 0.0BIO † BIO-RAD LABORATORIES INC DEC 47 - 39 20 - 16 20 - 13 19 - 12 19 - 10 0 0 0 0 0 0.0 - 0.0 0.0 - 0.0 0.0 - 0.0 0.0 - 0.0 0.0 - 0.0CBM § CAMBREX CORP DEC 20 - 11 7 - 3 17 - 8 19 - 9 20 - 4 0 0 0 0 0 0.0 - 0.0 0.0 - 0.0 0.0 - 0.0 0.0 - 0.0 0.0 - 0.0CRL † CHARLES RIVER LABS INTL INC DEC 25 - 17 20 - 13 19 - 11 NM- NM 24 - 14 0 0 0 NM 0 0.0 - 0.0 0.0 - 0.0 0.0 - 0.0 0.0 - 0.0 0.0 - 0.0
CVD † COVANCE INC DEC 28 - 18 34 - 24 29 - 19 59 - 35 21 - 12 0 0 0 0 0 0.0 - 0.0 0.0 - 0.0 0.0 - 0.0 0.0 - 0.0 0.0 - 0.0LMNX § LUMINEX CORP DEC NM- 91 86 - 52 71 - 48 NM- NM 52 - 29 0 0 0 0 0 0.0 - 0.0 0.0 - 0.0 0.0 - 0.0 0.0 - 0.0 0.0 - 0.0MTD † METTLER-TOLEDO INTL INC DEC 25 - 19 21 - 15 23 - 15 23 - 13 21 - 9 0 0 0 0 0 0.0 - 0.0 0.0 - 0.0 0.0 - 0.0 0.0 - 0.0 0.0 - 0.0PRXL § PAREXEL INTERNATIONAL CORP JUN 34 - 19 31 - 19 34 - 18 36 - 20 24 - 11 0 0 0 0 0 0.0 - 0.0 0.0 - 0.0 0.0 - 0.0 0.0 - 0.0 0.0 - 0.0PKI [] PERKINELMER INC DEC 28 - 20 54 - 34 NM- NM 23 - 16 26 - 14 19 47 NM 24 35 0.9 - 0.7 1.4 - 0.9 1.6 - 1.0 1.5 - 1.1 2.6 - 1.3
TECH † TECHNE CORP JUN 31 - 20 25 - 21 29 - 20 24 - 19 25 - 16 39 37 35 35 27 1.9 - 1.2 1.8 - 1.5 1.7 - 1.2 1.9 - 1.5 1.7 - 1.1TMO [] THERMO FISHER SCIENTIFIC INC DEC 31 - 18 19 - 13 25 - 16 22 - 16 24 - 15 17 16 0 0 0 0.9 - 0.5 1.2 - 0.8 0.0 - 0.0 0.0 - 0.0 0.0 - 0.0WAT [] WATERS CORP DEC 21 - 16 18 - 14 21 - 15 20 - 14 19 - 9 0 0 0 0 0 0.0 - 0.0 0.0 - 0.0 0.0 - 0.0 0.0 - 0.0 0.0 - 0.0
OTHER COMPANIES RELEVANT TO INDUSTRY ANALYSISALNY ALNYLAM PHARMACEUTICALS INC DEC NM- NM NM- NM NM- NM NM- NM NM- NM NM NM NM NM NM 0.0 - 0.0 0.0 - 0.0 0.0 - 0.0 0.0 - 0.0 0.0 - 0.0AMLN AMYLIN PHARMACEUTICALS INC DEC NA - NA NA - NA NM- NM NM- NM NM- NM NA NA NM NM NM NA - NA NA - NA 0.0 - 0.0 0.0 - 0.0 0.0 - 0.0ELN ELAN CORP PLC -ADR DEC NA - NA NM- NM NM- NM NM- NM NM- NM NA NM NM NM NM 0.0 - 0.0 0.0 - 0.0 0.0 - 0.0 0.0 - 0.0 0.0 - 0.0ENZN ENZON PHARMACEUTICALS INC DEC 12 - 3 NM- NM NM- NM NM- NM NM- NM 500 NM NM NM 0 181.4 - 40.9 46.8 - 25.4 0.0 - 0.0 0.0 - 0.0 0.0 - 0.0HGSI HUMAN GENOME SCIENCES INC DEC NA - NA NA - NA NM- NM NM- NM NM- 11 NA NA NM NM 0 NA - NA NA - NA 0.0 - 0.0 0.0 - 0.0 0.0 - 0.0
MYGN MYRIAD GENETICS INC JUN 21 - 11 24 - 15 23 - 16 17 - 9 32 - 15 0 0 0 0 0 0.0 - 0.0 0.0 - 0.0 0.0 - 0.0 0.0 - 0.0 0.0 - 0.0NPSP NPS PHARMACEUTICALS INC DEC NM- NM NM- NM NM- NM NM- NM NM- NM NM NM NM NM NM 0.0 - 0.0 0.0 - 0.0 0.0 - 0.0 0.0 - 0.0 0.0 - 0.0NBIX NEUROCRINE BIOSCIENCES INC DEC NM- NM NM- 78 13 - 8 NM- NM NM- NM NM 0 0 NM NM 0.0 - 0.0 0.0 - 0.0 0.0 - 0.0 0.0 - 0.0 0.0 - 0.0
Note: Data as originally reported. ‡S&P 1500 index group. []Company included in the S&P 500. †Company included in the S&P MidCap 400. §Company included in the S&P SmallCap 600. #Of the follow ing calendar year.
20092013 2012 2011 2010
INDUSTRY SURVEYS BIOTECHNOLOGY / SEPTEMBER 2014 45
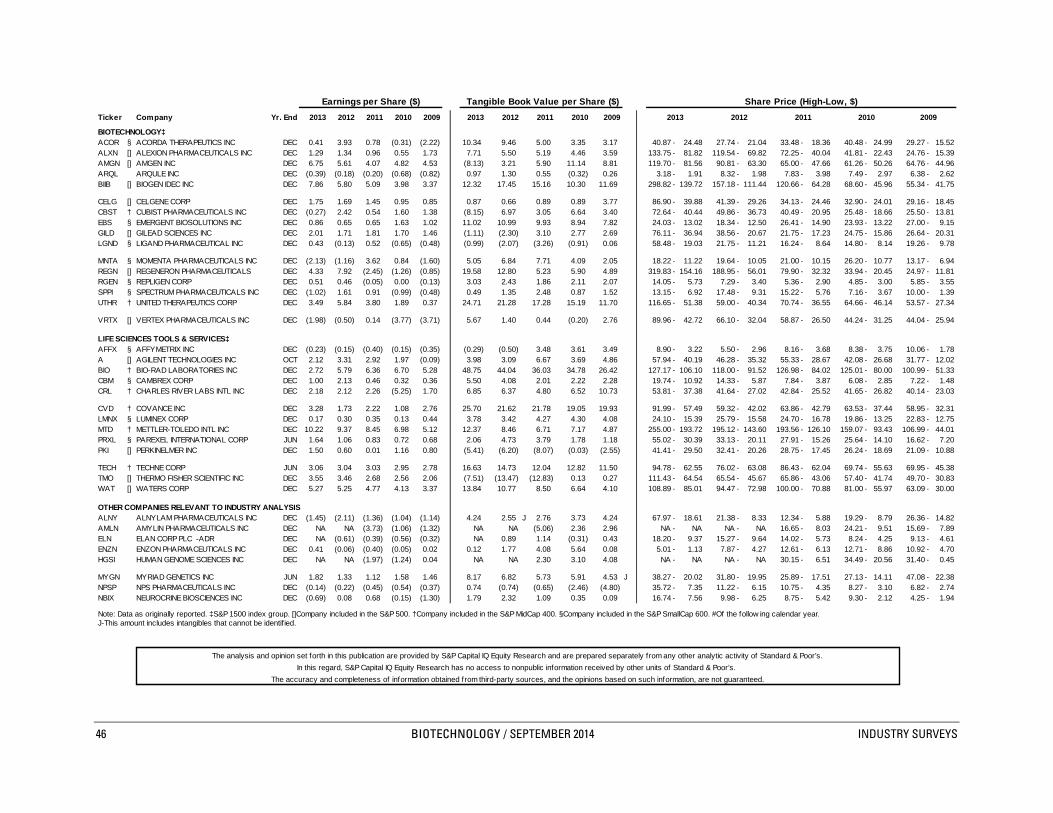
Earnings per Share ($) Tangible Book Value per Share ($) Share Price (High-Low, $)
Ticker Company Yr. End 2013 2012 2011 2010 2009 2013 2012 2011 2010 2009 2013 2012 2011 2010 2009
BIOTECHNOLOGY‡ACOR § ACORDA THERAPEUTICS INC DEC 0.41 3.93 0.78 (0.31) (2.22) 10.34 9.46 5.00 3.35 3.17 40.87 - 24.48 27.74 - 21.04 33.48 - 18.36 40.48 - 24.99 29.27 - 15.52ALXN [] ALEXION PHARMACEUTICALS INC DEC 1.29 1.34 0.96 0.55 1.73 7.71 5.50 5.19 4.46 3.59 133.75 - 81.82 119.54 - 69.82 72.25 - 40.04 41.81 - 22.43 24.76 - 15.39AMGN [] AMGEN INC DEC 6.75 5.61 4.07 4.82 4.53 (8.13) 3.21 5.90 11.14 8.81 119.70 - 81.56 90.81 - 63.30 65.00 - 47.66 61.26 - 50.26 64.76 - 44.96ARQL ARQULE INC DEC (0.39) (0.18) (0.20) (0.68) (0.82) 0.97 1.30 0.55 (0.32) 0.26 3.18 - 1.91 8.32 - 1.98 7.83 - 3.98 7.49 - 2.97 6.38 - 2.62BIIB [] BIOGEN IDEC INC DEC 7.86 5.80 5.09 3.98 3.37 12.32 17.45 15.16 10.30 11.69 298.82 - 139.72 157.18 - 111.44 120.66 - 64.28 68.60 - 45.96 55.34 - 41.75
CELG [] CELGENE CORP DEC 1.75 1.69 1.45 0.95 0.85 0.87 0.66 0.89 0.89 3.77 86.90 - 39.88 41.39 - 29.26 34.13 - 24.46 32.90 - 24.01 29.16 - 18.45CBST † CUBIST PHARMACEUTICALS INC DEC (0.27) 2.42 0.54 1.60 1.38 (8.15) 6.97 3.05 6.64 3.40 72.64 - 40.44 49.86 - 36.73 40.49 - 20.95 25.48 - 18.66 25.50 - 13.81EBS § EMERGENT BIOSOLUTIONS INC DEC 0.86 0.65 0.65 1.63 1.02 11.02 10.99 9.93 8.94 7.82 24.03 - 13.02 18.34 - 12.50 26.41 - 14.90 23.93 - 13.22 27.00 - 9.15GILD [] GILEAD SCIENCES INC DEC 2.01 1.71 1.81 1.70 1.46 (1.11) (2.30) 3.10 2.77 2.69 76.11 - 36.94 38.56 - 20.67 21.75 - 17.23 24.75 - 15.86 26.64 - 20.31LGND § LIGAND PHARMACEUTICAL INC DEC 0.43 (0.13) 0.52 (0.65) (0.48) (0.99) (2.07) (3.26) (0.91) 0.06 58.48 - 19.03 21.75 - 11.21 16.24 - 8.64 14.80 - 8.14 19.26 - 9.78
MNTA § MOMENTA PHARMACEUTICALS INC DEC (2.13) (1.16) 3.62 0.84 (1.60) 5.05 6.84 7.71 4.09 2.05 18.22 - 11.22 19.64 - 10.05 21.00 - 10.15 26.20 - 10.77 13.17 - 6.94REGN [] REGENERON PHARMACEUTICALS DEC 4.33 7.92 (2.45) (1.26) (0.85) 19.58 12.80 5.23 5.90 4.89 319.83 - 154.16 188.95 - 56.01 79.90 - 32.32 33.94 - 20.45 24.97 - 11.81RGEN § REPLIGEN CORP DEC 0.51 0.46 (0.05) 0.00 (0.13) 3.03 2.43 1.86 2.11 2.07 14.05 - 5.73 7.29 - 3.40 5.36 - 2.90 4.85 - 3.00 5.85 - 3.55SPPI § SPECTRUM PHARMACEUTICALS INC DEC (1.02) 1.61 0.91 (0.99) (0.48) 0.49 1.35 2.48 0.87 1.52 13.15 - 6.92 17.48 - 9.31 15.22 - 5.76 7.16 - 3.67 10.00 - 1.39UTHR † UNITED THERAPEUTICS CORP DEC 3.49 5.84 3.80 1.89 0.37 24.71 21.28 17.28 15.19 11.70 116.65 - 51.38 59.00 - 40.34 70.74 - 36.55 64.66 - 46.14 53.57 - 27.34
VRTX [] VERTEX PHARMACEUTICALS INC DEC (1.98) (0.50) 0.14 (3.77) (3.71) 5.67 1.40 0.44 (0.20) 2.76 89.96 - 42.72 66.10 - 32.04 58.87 - 26.50 44.24 - 31.25 44.04 - 25.94
LIFE SCIENCES TOOLS & SERVICES‡AFFX § AFFYMETRIX INC DEC (0.23) (0.15) (0.40) (0.15) (0.35) (0.29) (0.50) 3.48 3.61 3.49 8.90 - 3.22 5.50 - 2.96 8.16 - 3.68 8.38 - 3.75 10.06 - 1.78A [] AGILENT TECHNOLOGIES INC OCT 2.12 3.31 2.92 1.97 (0.09) 3.98 3.09 6.67 3.69 4.86 57.94 - 40.19 46.28 - 35.32 55.33 - 28.67 42.08 - 26.68 31.77 - 12.02BIO † BIO-RAD LABORATORIES INC DEC 2.72 5.79 6.36 6.70 5.28 48.75 44.04 36.03 34.78 26.42 127.17 - 106.10 118.00 - 91.52 126.98 - 84.02 125.01 - 80.00 100.99 - 51.33CBM § CAMBREX CORP DEC 1.00 2.13 0.46 0.32 0.36 5.50 4.08 2.01 2.22 2.28 19.74 - 10.92 14.33 - 5.87 7.84 - 3.87 6.08 - 2.85 7.22 - 1.48CRL † CHARLES RIVER LABS INTL INC DEC 2.18 2.12 2.26 (5.25) 1.70 6.85 6.37 4.80 6.52 10.73 53.81 - 37.38 41.64 - 27.02 42.84 - 25.52 41.65 - 26.82 40.14 - 23.03
CVD † COVANCE INC DEC 3.28 1.73 2.22 1.08 2.76 25.70 21.62 21.78 19.05 19.93 91.99 - 57.49 59.32 - 42.02 63.86 - 42.79 63.53 - 37.44 58.95 - 32.31LMNX § LUMINEX CORP DEC 0.17 0.30 0.35 0.13 0.44 3.78 3.42 4.27 4.30 4.08 24.10 - 15.39 25.79 - 15.58 24.70 - 16.78 19.86 - 13.25 22.83 - 12.75MTD † METTLER-TOLEDO INTL INC DEC 10.22 9.37 8.45 6.98 5.12 12.37 8.46 6.71 7.17 4.87 255.00 - 193.72 195.12 - 143.60 193.56 - 126.10 159.07 - 93.43 106.99 - 44.01PRXL § PAREXEL INTERNATIONAL CORP JUN 1.64 1.06 0.83 0.72 0.68 2.06 4.73 3.79 1.78 1.18 55.02 - 30.39 33.13 - 20.11 27.91 - 15.26 25.64 - 14.10 16.62 - 7.20PKI [] PERKINELMER INC DEC 1.50 0.60 0.01 1.16 0.80 (5.41) (6.20) (8.07) (0.03) (2.55) 41.41 - 29.50 32.41 - 20.26 28.75 - 17.45 26.24 - 18.69 21.09 - 10.88
TECH † TECHNE CORP JUN 3.06 3.04 3.03 2.95 2.78 16.63 14.73 12.04 12.82 11.50 94.78 - 62.55 76.02 - 63.08 86.43 - 62.04 69.74 - 55.63 69.95 - 45.38TMO [] THERMO FISHER SCIENTIFIC INC DEC 3.55 3.46 2.68 2.56 2.06 (7.51) (13.47) (12.83) 0.13 0.27 111.43 - 64.54 65.54 - 45.67 65.86 - 43.06 57.40 - 41.74 49.70 - 30.83WAT [] WATERS CORP DEC 5.27 5.25 4.77 4.13 3.37 13.84 10.77 8.50 6.64 4.10 108.89 - 85.01 94.47 - 72.98 100.00 - 70.88 81.00 - 55.97 63.09 - 30.00
OTHER COMPANIES RELEVANT TO INDUSTRY ANALYSISALNY ALNYLAM PHARMACEUTICALS INC DEC (1.45) (2.11) (1.36) (1.04) (1.14) 4.24 2.55 J 2.76 3.73 4.24 67.97 - 18.61 21.38 - 8.33 12.34 - 5.88 19.29 - 8.79 26.36 - 14.82AMLN AMYLIN PHARMACEUTICALS INC DEC NA NA (3.73) (1.06) (1.32) NA NA (5.06) 2.36 2.96 NA - NA NA - NA 16.65 - 8.03 24.21 - 9.51 15.69 - 7.89ELN ELAN CORP PLC -ADR DEC NA (0.61) (0.39) (0.56) (0.32) NA 0.89 1.14 (0.31) 0.43 18.20 - 9.37 15.27 - 9.64 14.02 - 5.73 8.24 - 4.25 9.13 - 4.61ENZN ENZON PHARMACEUTICALS INC DEC 0.41 (0.06) (0.40) (0.05) 0.02 0.12 1.77 4.08 5.64 0.08 5.01 - 1.13 7.87 - 4.27 12.61 - 6.13 12.71 - 8.86 10.92 - 4.70HGSI HUMAN GENOME SCIENCES INC DEC NA NA (1.97) (1.24) 0.04 NA NA 2.30 3.10 4.08 NA - NA NA - NA 30.15 - 6.51 34.49 - 20.56 31.40 - 0.45
MYGN MYRIAD GENETICS INC JUN 1.82 1.33 1.12 1.58 1.46 8.17 6.82 5.73 5.91 4.53 J 38.27 - 20.02 31.80 - 19.95 25.89 - 17.51 27.13 - 14.11 47.08 - 22.38NPSP NPS PHARMACEUTICALS INC DEC (0.14) (0.22) (0.45) (0.54) (0.37) 0.74 (0.74) (0.65) (2.46) (4.80) 35.72 - 7.35 11.22 - 6.15 10.75 - 4.35 8.27 - 3.10 6.82 - 2.74NBIX NEUROCRINE BIOSCIENCES INC DEC (0.69) 0.08 0.68 (0.15) (1.30) 1.79 2.32 1.09 0.35 0.09 16.74 - 7.56 9.98 - 6.25 8.75 - 5.42 9.30 - 2.12 4.25 - 1.94
Note: Data as originally reported. ‡S&P 1500 index group. []Company included in the S&P 500. †Company included in the S&P MidCap 400. §Company included in the S&P SmallCap 600. #Of the follow ing calendar year. J-This amount includes intangibles that cannot be identif ied.
The analysis and opinion set forth in this publication are provided by S&P Capital IQ Equity Research and are prepared separately from any other analytic activity of Standard & Poor’s.In this regard, S&P Capital IQ Equity Research has no access to nonpublic information received by other units of Standard & Poor’s.
The accuracy and completeness of information obtained from third-party sources, and the opinions based on such information, are not guaranteed.
46 BIOTECHNOLOGY / SEPTEMBER 2014 INDUSTRY SURVEYS
General Disclaimers S&P Capital IQ’s Industry Surveys Reports (the “Industry Surveys”) have been prepared and issued by S&P Capital IQ and/or one of its affiliates. In the United States and United Kingdom, the Industry Surveys are prepared and issued by Standard & Poor’s Financial Services LLC; in Hong Kong, by Standard & Poor’s Investment Advisory Services (HK) Limited, which is regulated by the Hong Kong Securities Futures Commission; in Singapore, by McGraw Hill Financial Singapore Pte. Limited, which is regulated by the Monetary Authority of Singapore; in Malaysia, by Standard & Poor’s Malaysia Sdn Bhd, which is regulated by the Securities Commission of Malaysia; in Australia, by Standard & Poor’s Information Services (Australia) Pty Ltd, which is regulated by the Australian Securities & Investments Commission; and in Japan, by McGraw Hill Financial Japan KK, which is registered by Kanto Financial Bureau. No content (including ratings, credit-related analyses and data, valuations, model, software or other application or output therefrom) or any part thereof (Content) may be modified, reverse engineered, reproduced or distributed in any form by any means, or stored in a database or retrieval system, without the prior written permission of Standard & Poor’s Financial Services LLC or its affiliates (collectively, S&P). The Content shall not be used for any unlawful or unauthorized purposes. S&P and any third-party providers, as well as their directors, officers, shareholders, employees or agents (collectively S&P Parties) do not guarantee the accuracy, completeness, timeliness or availability of the Content. S&P Parties are not responsible for any errors or omissions (negligent or otherwise), regardless of the cause, for the results obtained from the use of the Content, or for the security or maintenance of any data input by the user. The Content is provided on an “as is” basis. S&P PARTIES DISCLAIM ANY AND ALL EXPRESS OR IMPLIED WARRANTIES, INCLUDING, BUT NOT LIMITED TO, ANY WARRANTIES OF MERCHANTABILITY OR FITNESS FOR A PARTICULAR PURPOSE OR USE, FREEDOM FROM BUGS, SOFTWARE ERRORS OR DEFECTS, THAT THE CONTENT’S FUNCTIONING WILL BE UNINTERRUPTED OR THAT THE CONTENT WILL OPERATE WITH ANY SOFTWARE OR HARDWARE CONFIGURATION. In no event shall S&P Parties be liable to any party for any direct, indirect, incidental, exemplary, compensatory, punitive, special or consequential damages, costs, expenses, legal fees, or losses (including, without limitation, lost income or lost profits and opportunity costs or losses caused by negligence) in connection with any use of the Content even if advised of the possibility of such damages. Credit-related and other analyses, including ratings, and statements in the Content are statements of opinion as of the date they are expressed and not statements of fact. S&P’s opinions, analyses and rating acknowledgment decisions (described below) are not recommendations to purchase, hold, or sell any securities or to make any investment decisions, and do not address the suitability of any security. S&P assumes no obligation to update the Content following publication in any form or format. The Content should not be relied on and is not a substitute for the skill, judgment and experience of the user, its management, employees, advisers and/or clients when making investment and other business decisions. S&P does not act as a fiduciary or an investment adviser except where registered as such. While S&P has obtained information from sources it believes to be reliable, S&P does not perform an audit and undertakes no duty of due diligence or independent verification of any information it receives. S&P keeps certain activities of its business units separate from each other in order to preserve the independence and objectivity of their respective activities. As a result, certain business units of S&P may have information that is not available to other S&P business units. S&P has established policies and procedures to maintain the confidentiality of certain non-public information received in connection with each analytical process. S&P provides a wide range of services to, or relating to, many organizations, including issuers or underwriters of securities or obligors, investment advisers, broker-dealers, investment banks, other financial institutions and financial intermediaries. As a result, S&P may receive fees or other economic benefits from organizations whose securities or services it may recommend, analyze, rate, include in model portfolios, evaluate, price or otherwise address. The Industry Surveys are not intended to be investment advice and do not constitute any form of invitation or inducement by S&P Capital IQ to engage in investment activity. This material is not intended as an offer or solicitation for the purchase or sale of any security or other financial instrument. Any opinions expressed herein are given in good faith, are subject to change without notice, and are only current as of the stated date of their issue. Past performance is not necessarily indicative of future results. For details on the S&P Capital IQ conflict-of-interest policies, please visit: www.spcapitaliq.com/Policies
Notice to all Non U.S. Residents: S&P Capital IQ’s Industry Surveys may be distributed in certain localities, countries and/or jurisdictions (“Territories”) by independent third parties or independent intermediaries and/or distributors (the “Intermediaries” or “Distributors”). Intermediaries are not acting as agents or representatives of S&P Capital IQ. In Territories where an Intermediary distributes S&P Capital IQ’s Industry Surveys, the Intermediary, and not S&P Capital IQ, is solely responsible for complying with all applicable regulations, laws, rules, circulars, codes and guidelines established by local and/or regional regulatory authorities, including laws in connection with the distribution of third-party investment research, licensing requirements, supervisory and record keeping obligations that the Intermediary may have under the applicable laws and regulations of the territories where it distributes the Industry Surveys. Industry Surveys are not directed to, or intended for distribution to or use by, any person or entity who is a citizen or resident of or located in any locality, state, country or other jurisdiction where such distribution, publication, availability or use would be contrary to law or regulation or which would subject S&P Capital IQ or its affiliates to any registration or licensing requirements in such jurisdiction. Industry Surveys are not directed to, or intended for distribution to or use by, any person or entity who is not in a class qualified to receive Industry Surveys (e.g., a qualified person and/or investor), as defined by the local laws or regulations in the country or jurisdiction where the person is domiciled, a citizen or resident of, or the entity is legally registered or domiciled. S&P Capital IQ’s Industry Surveys are not intended for distribution in or directed to entities, residents or investors in: Albania, Belarus, Bosnia, Burma, Cote d’Ivoire, Croatia, Cuba, Democratic Republic of the Congo, Former Yugoslav Republic of Macedonia, Herzegovina, Iran, Iraq, Kosovo, Lebanon, Libya, Montenegro and Serbia, North Korea, Somali, Sudan, Syria, Taiwan, Yemen and Zimbabwe. For residents of Australia: Industry Surveys are issued and/or distributed in Australia by SPIS. Any express or implied opinion contained in an Industry Survey is limited to “General Advice” and based solely on consideration of the investment merits of the financial product(s) alone. The information in an Industry Survey has not been prepared for use by retail investors and has been prepared without taking account of any particular investor’s financial or investment objectives, financial situation or needs. Before acting on any advice, any investor using the advice should consider its appropriateness having regard to their own or their clients’ objectives, financial situation and needs. Investors should obtain a Product Disclosure Statement relating to the product and consider the statement before making any decision or recommendation about whether to acquire the product. Each opinion must be weighed solely as one factor in any investment decision made by or on behalf of any adviser and any such adviser must accordingly make their own assessment taking into account an individual’s particular circumstances. SPIS holds an Australian Financial Services License Number 258896. Please refer to the SPIS Financial Services Guide for more information at: www.spcapitaliq.com/FinancialServicesGuide For residents of China: Industry Surveys are not distributed in or directed to residents in The People’s Republic of China. Neither S&P Capital IQ nor its affiliates target investors in China. For residents of Kuwait: The Distributor, and not S&P Capital IQ, is responsible for complying with all relevant licensing requirements as set forth by the Kuwait Capital Markets Law (“CML”) and Kuwait Capital Markets Authority (“CMA”) and with all relevant rules and regulations set out in the CML and CMA rule books. For residents of Malaysia: All queries in relation to Industry Surveys should be referred to Ahmad Halim at [email protected]. For residents of Mexico: S&P Capital IQ is not regulated or supervised by the Mexican National Banking and Securities Commission (“CNBV”). S&P Capital IQ has a licensed rating agency affiliate in Mexico (Standard & Poor’s, S.A. De C.V.), of which S&P maintains firewalls and seeks to avoid conflicts of interest, pursuant to approved policies. For residents of Qatar: The Distributor, and not S&P Capital IQ, is responsible for complying with all relevant licensing requirements as set forth by the Qatar Financial Markets Authority or the Qatar Central Bank, and with all relevant rules and regulations set out in the Qatar Financial Markets Authority’s rule book, including third party branded investment research distribution of securities that are admitted for trading on a Qatari securities exchange (Admitted Securities). Copyright © 2014 Standard & Poor’s Financial Services LLC. All rights reserved. STANDARD & POOR’S, S&P, S&P 500, S&P EUROPE 350 and STARS are registered trademarks of Standard & Poor’s Financial Services LLC. S&P CAPITAL IQ is a trademark of Standard & Poor’s Financial Services LLC.
INDUSTRY SURVEYS BIOTECHNOLOGY / SEPTEMBER 2014 47