industries, joint stock companies, psus, industrial parks
TRANSCRIPT
1
Industries, joint stock companies, PSUs, industrial parks, MSMEs,
mini and major industrial estates, coir-cooperatives, cashew workers
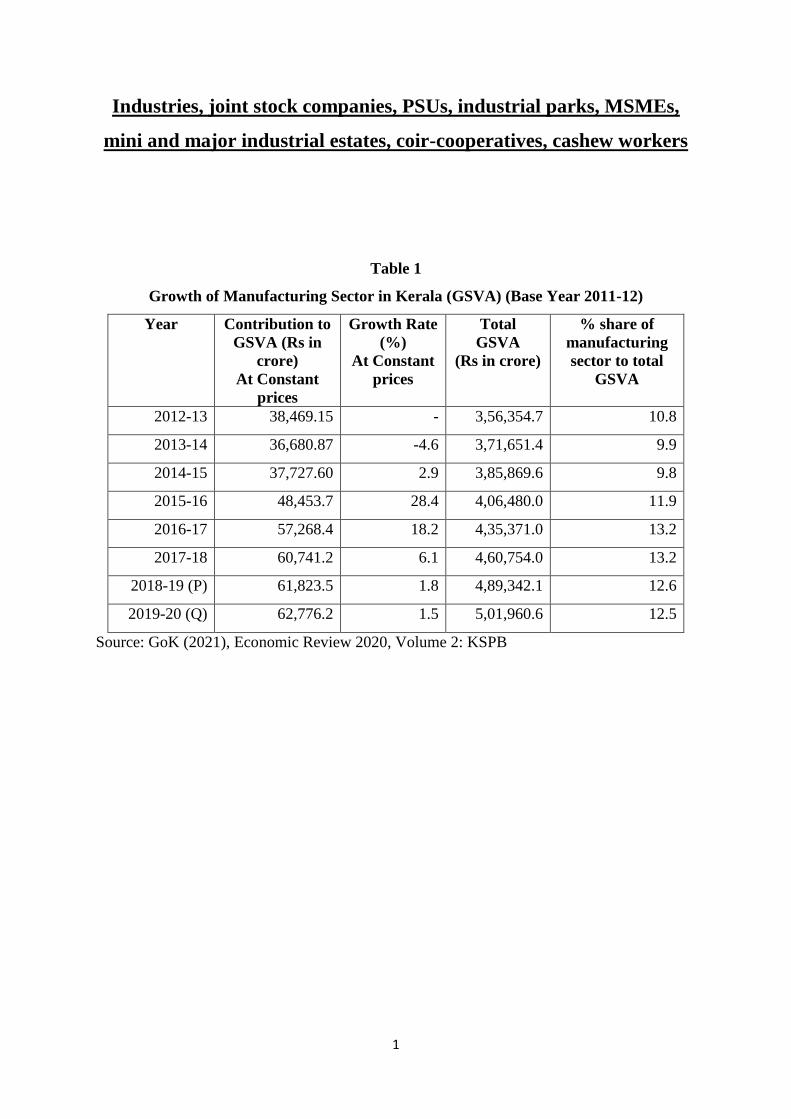
Table 1
Growth of Manufacturing Sector in Kerala (GSVA) (Base Year 2011-12)
Year
Contribution to
GSVA (Rs in
crore)
At Constant
prices
Growth Rate
(%)
At Constant
prices
Total
GSVA
(Rs in crore)
% share of
manufacturing
sector to total
GSVA
2012-13 38,469.15 - 3,56,354.7 10.8
2013-14 36,680.87 -4.6 3,71,651.4 9.9
2014-15 37,727.60 2.9 3,85,869.6 9.8
2015-16 48,453.7 28.4 4,06,480.0 11.9
2016-17 57,268.4 18.2 4,35,371.0 13.2
2017-18 60,741.2 6.1 4,60,754.0 13.2
2018-19 (P) 61,823.5 1.8 4,89,342.1 12.6
2019-20 (Q) 62,776.2 1.5 5,01,960.6 12.5
Source: GoK (2021), Economic Review 2020, Volume 2: KSPB
2
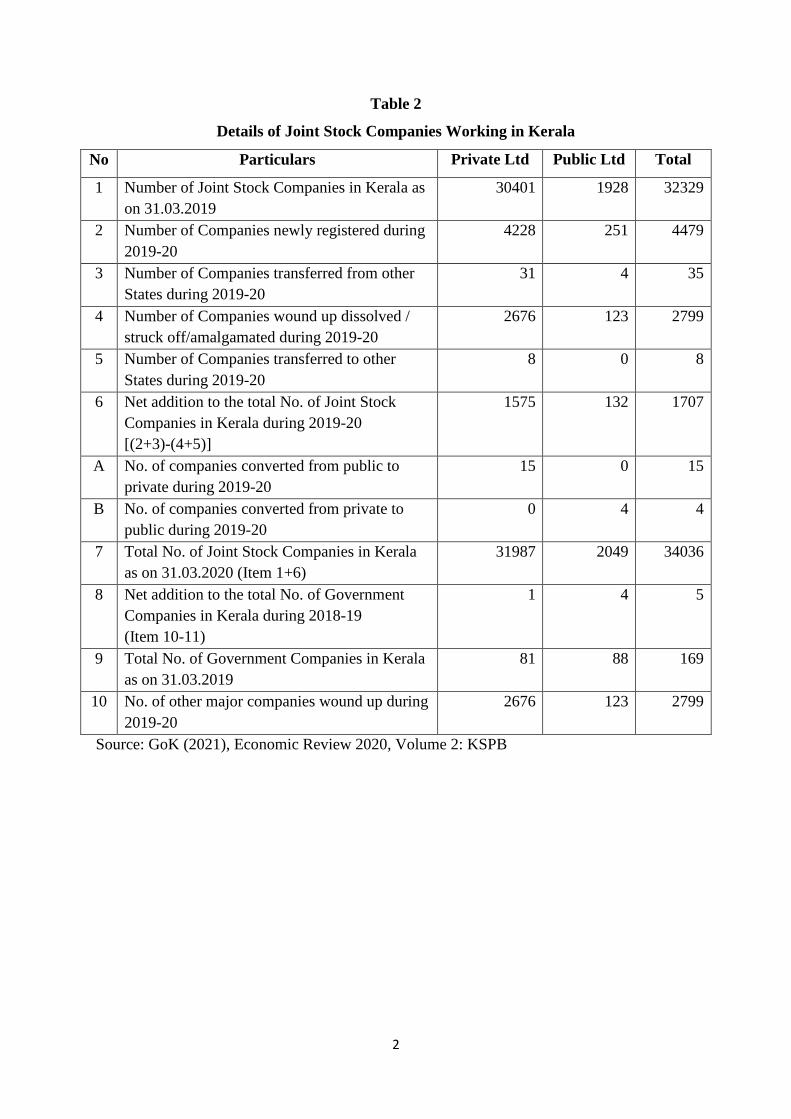
Table 2
Details of Joint Stock Companies Working in Kerala
No Particulars Private Ltd Public Ltd Total
1 Number of Joint Stock Companies in Kerala as
on 31.03.2019
30401 1928 32329
2 Number of Companies newly registered during
2019-20
4228 251 4479
3 Number of Companies transferred from other
States during 2019-20
31 4 35
4 Number of Companies wound up dissolved /
struck off/amalgamated during 2019-20
2676 123 2799
5 Number of Companies transferred to other
States during 2019-20
8 0 8
6 Net addition to the total No. of Joint Stock
Companies in Kerala during 2019-20
[(2+3)-(4+5)]
1575 132 1707
A No. of companies converted from public to
private during 2019-20
15 0 15
B No. of companies converted from private to
public during 2019-20
0 4 4
7 Total No. of Joint Stock Companies in Kerala
as on 31.03.2020 (Item 1+6)
31987 2049 34036
8 Net addition to the total No. of Government
Companies in Kerala during 2018-19
(Item 10-11)
1 4 5
9 Total No. of Government Companies in Kerala
as on 31.03.2019
81 88 169
10 No. of other major companies wound up during
2019-20
2676 123 2799
Source: GoK (2021), Economic Review 2020, Volume 2: KSPB
3
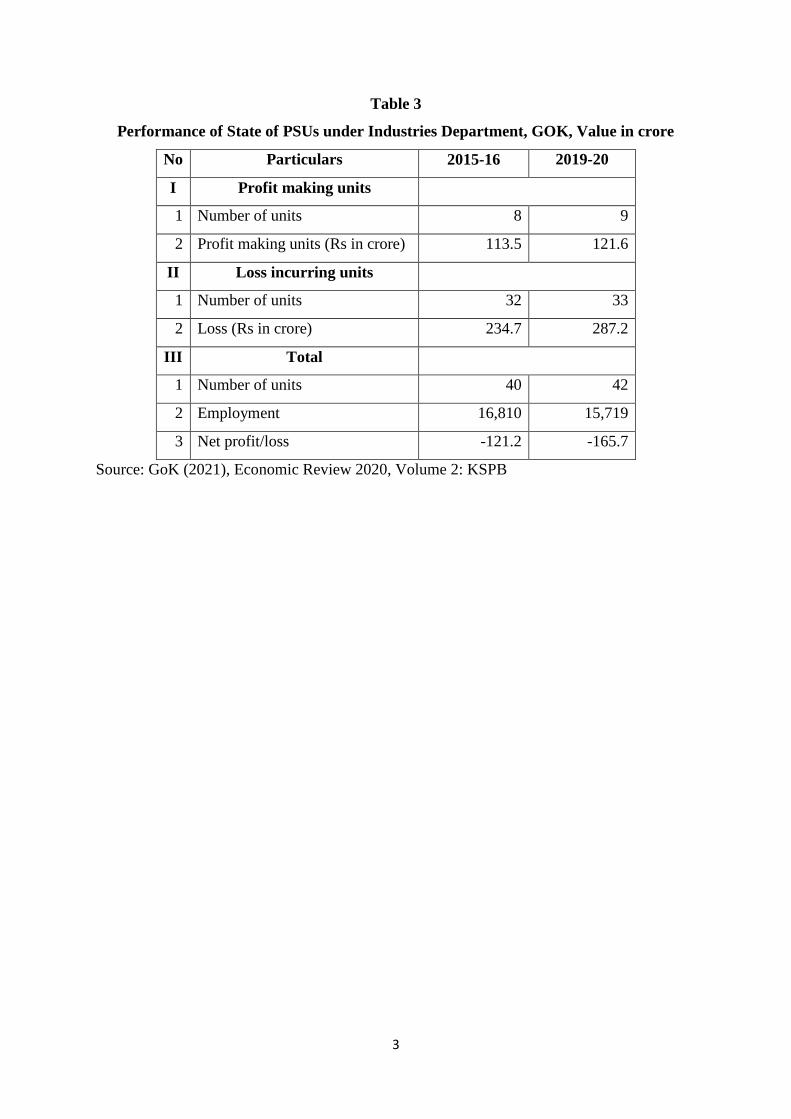
Table 3
Performance of State of PSUs under Industries Department, GOK, Value in crore
No Particulars 2015-16 2019-20
I Profit making units
1 Number of units 8 9
2 Profit making units (Rs in crore) 113.5 121.6
II Loss incurring units
1 Number of units 32 33
2 Loss (Rs in crore) 234.7 287.2
III Total
1 Number of units 40 42
2 Employment 16,810 15,719
3 Net profit/loss -121.2 -165.7
Source: GoK (2021), Economic Review 2020, Volume 2: KSPB
4
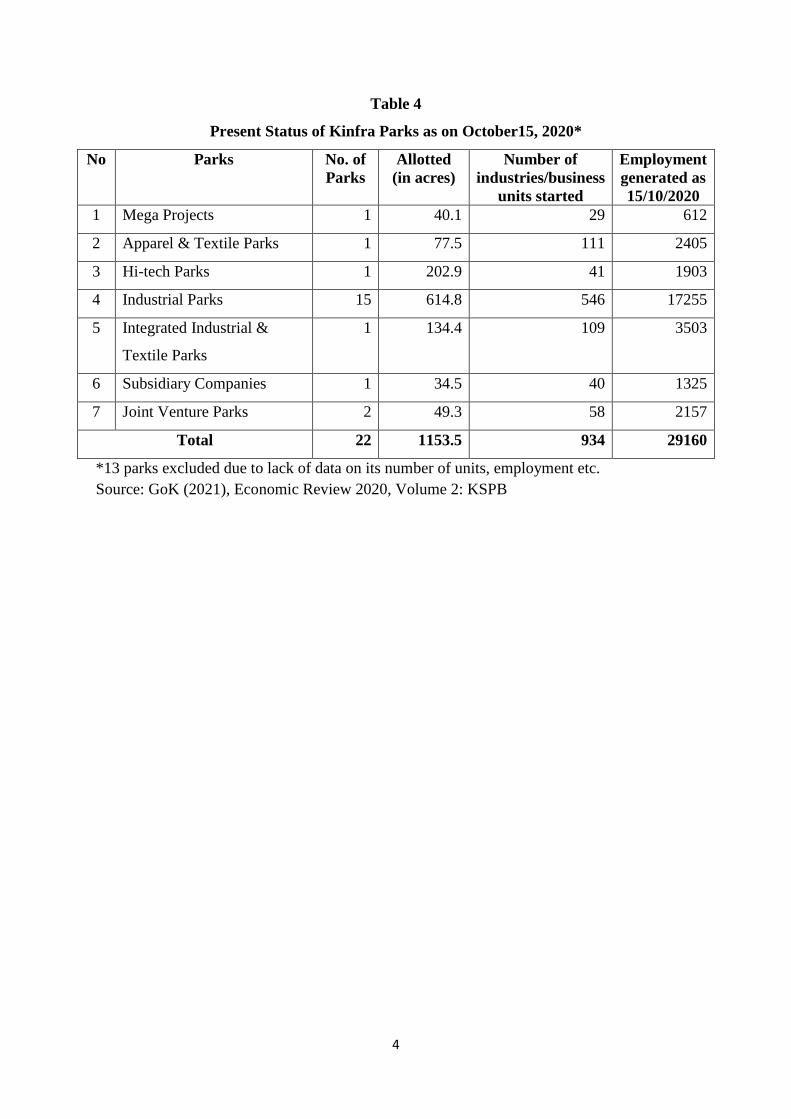
Table 4
Present Status of Kinfra Parks as on October15, 2020*
No Parks No. of
Parks
Allotted
(in acres)
Number of
industries/business
units started
Employment
generated as
15/10/2020
1 Mega Projects 1 40.1 29 612
2 Apparel & Textile Parks 1 77.5 111 2405
3 Hi-tech Parks 1 202.9 41 1903
4 Industrial Parks 15 614.8 546 17255
5 Integrated Industrial &
Textile Parks
1 134.4 109 3503
6 Subsidiary Companies 1 34.5 40 1325
7 Joint Venture Parks 2 49.3 58 2157
Total 22 1153.5 934 29160
*13 parks excluded due to lack of data on its number of units, employment etc.
Source: GoK (2021), Economic Review 2020, Volume 2: KSPB
5
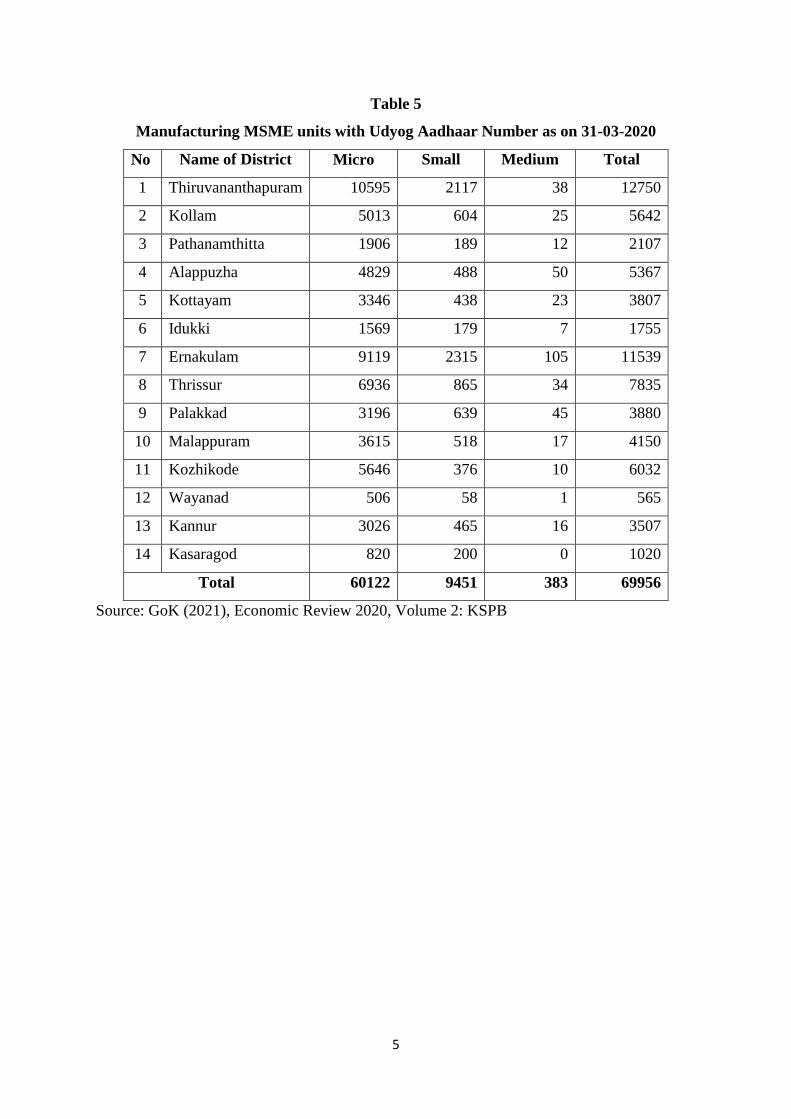
Table 5
Manufacturing MSME units with Udyog Aadhaar Number as on 31-03-2020
No Name of District Micro Small Medium Total
1 Thiruvananthapuram 10595 2117 38 12750
2 Kollam 5013 604 25 5642
3 Pathanamthitta 1906 189 12 2107
4 Alappuzha 4829 488 50 5367
5 Kottayam 3346 438 23 3807
6 Idukki 1569 179 7 1755
7 Ernakulam 9119 2315 105 11539
8 Thrissur 6936 865 34 7835
9 Palakkad 3196 639 45 3880
10 Malappuram 3615 518 17 4150
11 Kozhikode 5646 376 10 6032
12 Wayanad 506 58 1 565
13 Kannur 3026 465 16 3507
14 Kasaragod 820 200 0 1020
Total 60122 9451 383 69956
Source: GoK (2021), Economic Review 2020, Volume 2: KSPB
6
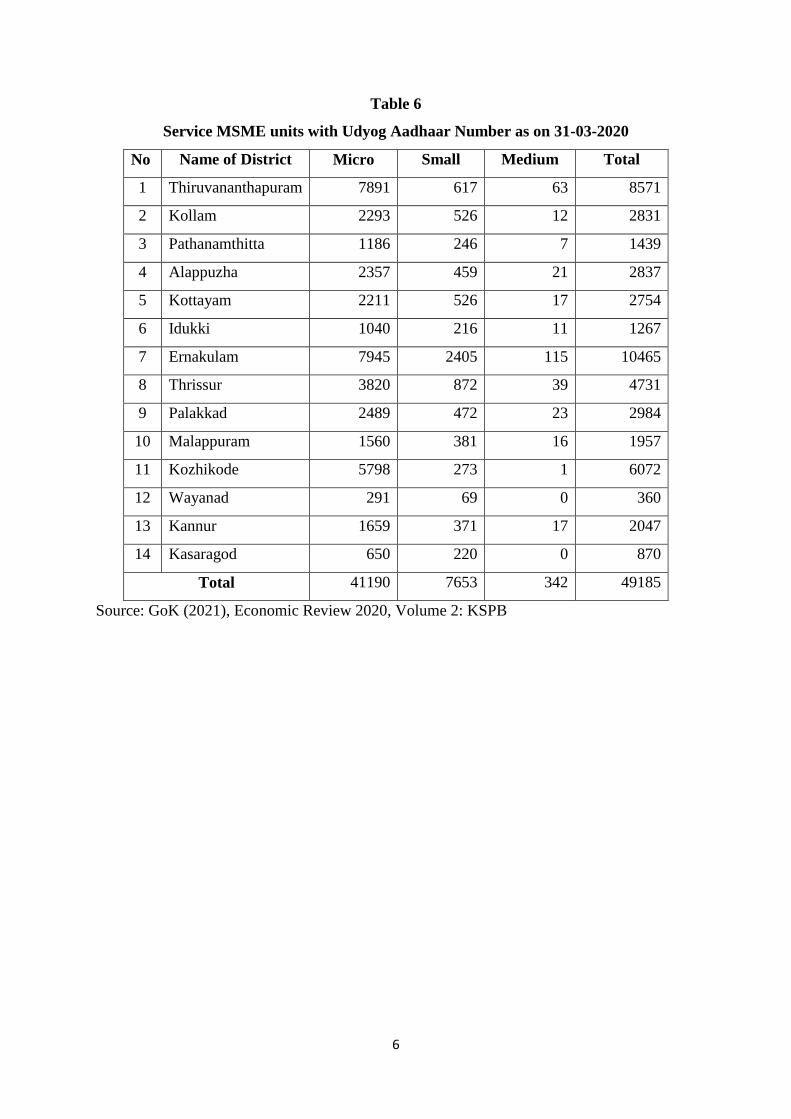
Table 6
Service MSME units with Udyog Aadhaar Number as on 31-03-2020
No Name of District Micro Small Medium Total
1 Thiruvananthapuram 7891 617 63 8571
2 Kollam 2293 526 12 2831
3 Pathanamthitta 1186 246 7 1439
4 Alappuzha 2357 459 21 2837
5 Kottayam 2211 526 17 2754
6 Idukki 1040 216 11 1267
7 Ernakulam 7945 2405 115 10465
8 Thrissur 3820 872 39 4731
9 Palakkad 2489 472 23 2984
10 Malappuram 1560 381 16 1957
11 Kozhikode 5798 273 1 6072
12 Wayanad 291 69 0 360
13 Kannur 1659 371 17 2047
14 Kasaragod 650 220 0 870
Total 41190 7653 342 49185
Source: GoK (2021), Economic Review 2020, Volume 2: KSPB
7
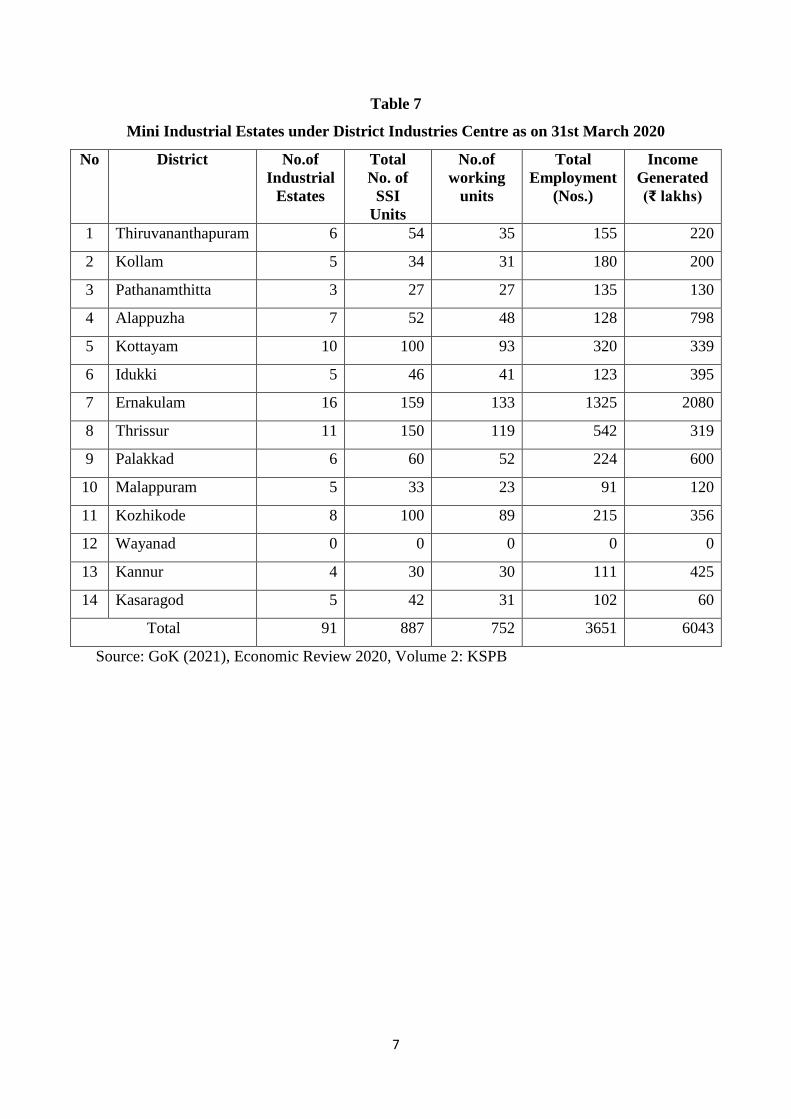
Table 7
Mini Industrial Estates under District Industries Centre as on 31st March 2020
No District No.of
Industrial
Estates
Total
No. of
SSI
Units
No.of
working
units
Total
Employment
(Nos.)
Income
Generated
(₹ lakhs)
1 Thiruvananthapuram 6 54 35 155 220
2 Kollam 5 34 31 180 200
3 Pathanamthitta 3 27 27 135 130
4 Alappuzha 7 52 48 128 798
5 Kottayam 10 100 93 320 339
6 Idukki 5 46 41 123 395
7 Ernakulam 16 159 133 1325 2080
8 Thrissur 11 150 119 542 319
9 Palakkad 6 60 52 224 600
10 Malappuram 5 33 23 91 120
11 Kozhikode 8 100 89 215 356
12 Wayanad 0 0 0 0 0
13 Kannur 4 30 30 111 425
14 Kasaragod 5 42 31 102 60
Total 91 887 752 3651 6043
Source: GoK (2021), Economic Review 2020, Volume 2: KSPB
8
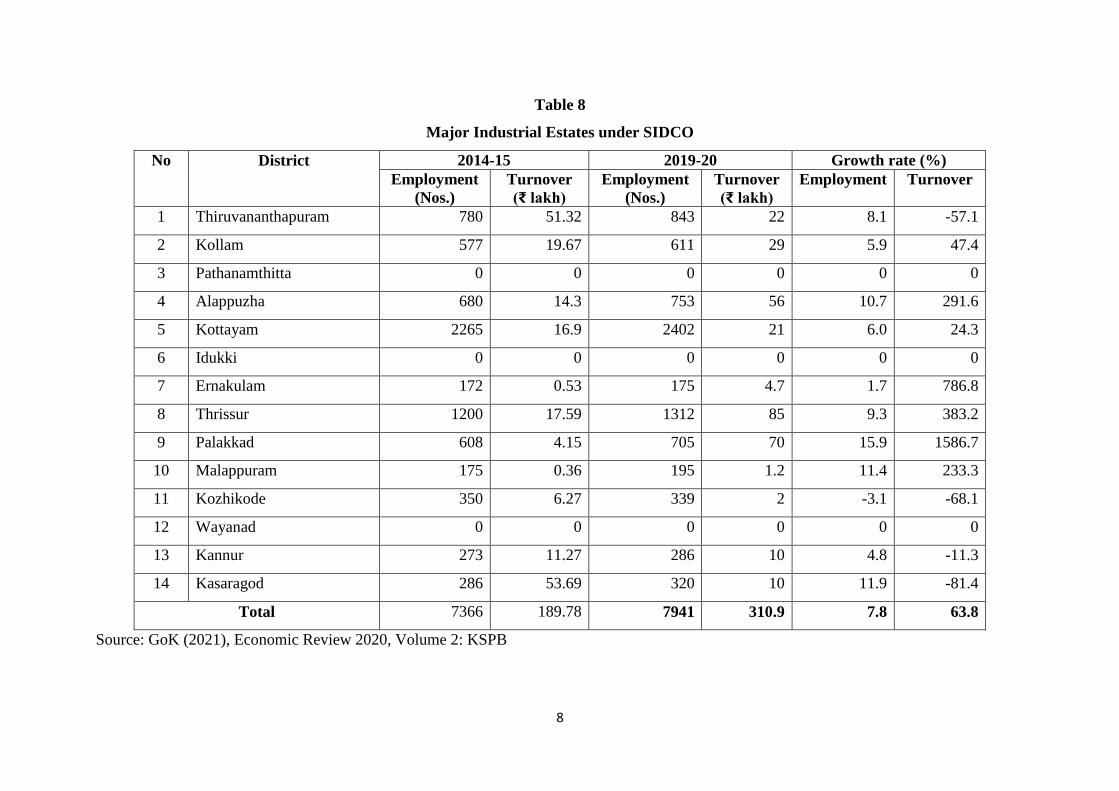
Table 8
Major Industrial Estates under SIDCO
No District 2014-15 2019-20 Growth rate (%)
Employment
(Nos.)
Turnover
(₹ lakh)
Employment
(Nos.)
Turnover
(₹ lakh)
Employment Turnover
1 Thiruvananthapuram 780 51.32 843 22 8.1 -57.1
2 Kollam 577 19.67 611 29 5.9 47.4
3 Pathanamthitta 0 0 0 0 0 0
4 Alappuzha 680 14.3 753 56 10.7 291.6
5 Kottayam 2265 16.9 2402 21 6.0 24.3
6 Idukki 0 0 0 0 0 0
7 Ernakulam 172 0.53 175 4.7 1.7 786.8
8 Thrissur 1200 17.59 1312 85 9.3 383.2
9 Palakkad 608 4.15 705 70 15.9 1586.7
10 Malappuram 175 0.36 195 1.2 11.4 233.3
11 Kozhikode 350 6.27 339 2 -3.1 -68.1
12 Wayanad 0 0 0 0 0 0
13 Kannur 273 11.27 286 10 4.8 -11.3
14 Kasaragod 286 53.69 320 10 11.9 -81.4
Total 7366 189.78 7941 310.9 7.8 63.8
Source: GoK (2021), Economic Review 2020, Volume 2: KSPB
9
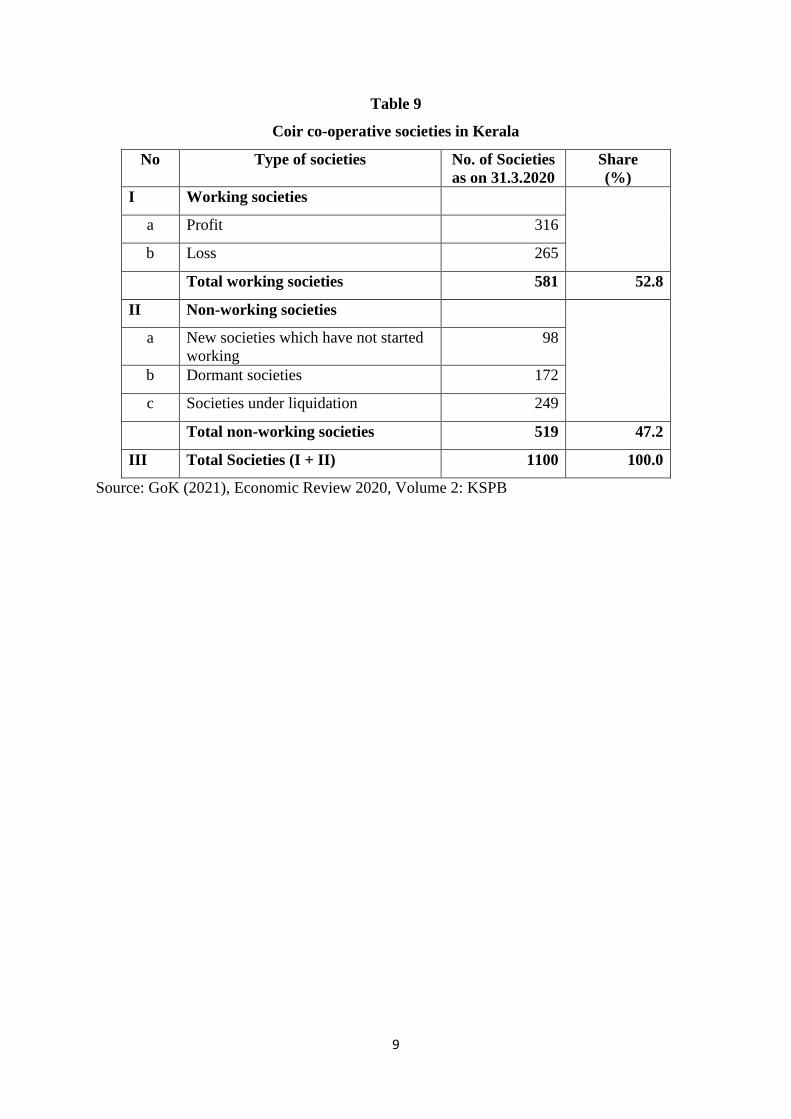
Table 9
Coir co-operative societies in Kerala
No Type of societies No. of Societies
as on 31.3.2020
Share
(%)
I Working societies
a Profit 316
b Loss 265
Total working societies 581 52.8
II Non-working societies
a New societies which have not started
working
98
b Dormant societies 172
c Societies under liquidation 249
Total non-working societies 519 47.2
III Total Societies (I + II) 1100 100.0
Source: GoK (2021), Economic Review 2020, Volume 2: KSPB
10
Table 10
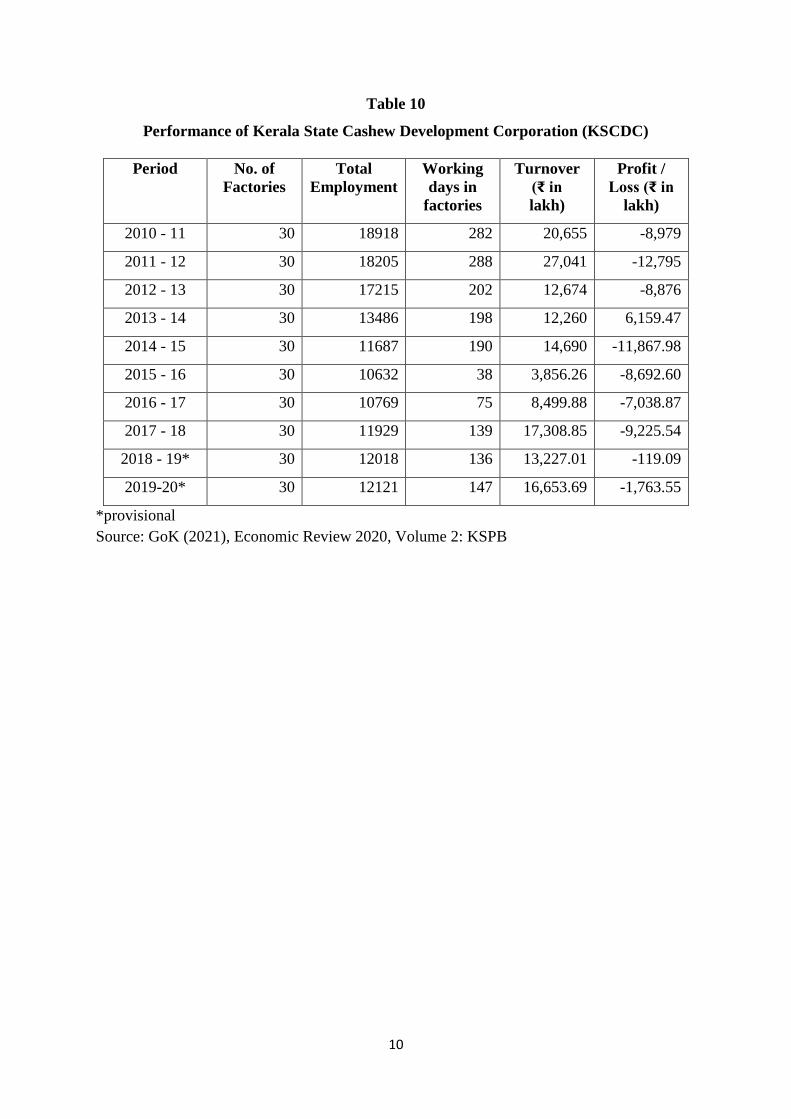
Performance of Kerala State Cashew Development Corporation (KSCDC)
Period
No. of
Factories
Total
Employment
Working
days in
factories
Turnover
(₹ in
lakh)
Profit /
Loss (₹ in
lakh)
2010 - 11 30 18918 282 20,655 -8,979
2011 - 12 30 18205 288 27,041 -12,795
2012 - 13 30 17215 202 12,674 -8,876
2013 - 14 30 13486 198 12,260 6,159.47
2014 - 15 30 11687 190 14,690 -11,867.98
2015 - 16 30 10632 38 3,856.26 -8,692.60
2016 - 17 30 10769 75 8,499.88 -7,038.87
2017 - 18 30 11929 139 17,308.85 -9,225.54
2018 - 19* 30 12018 136 13,227.01 -119.09
2019-20* 30 12121 147 16,653.69 -1,763.55
*provisional
Source: GoK (2021), Economic Review 2020, Volume 2: KSPB
11
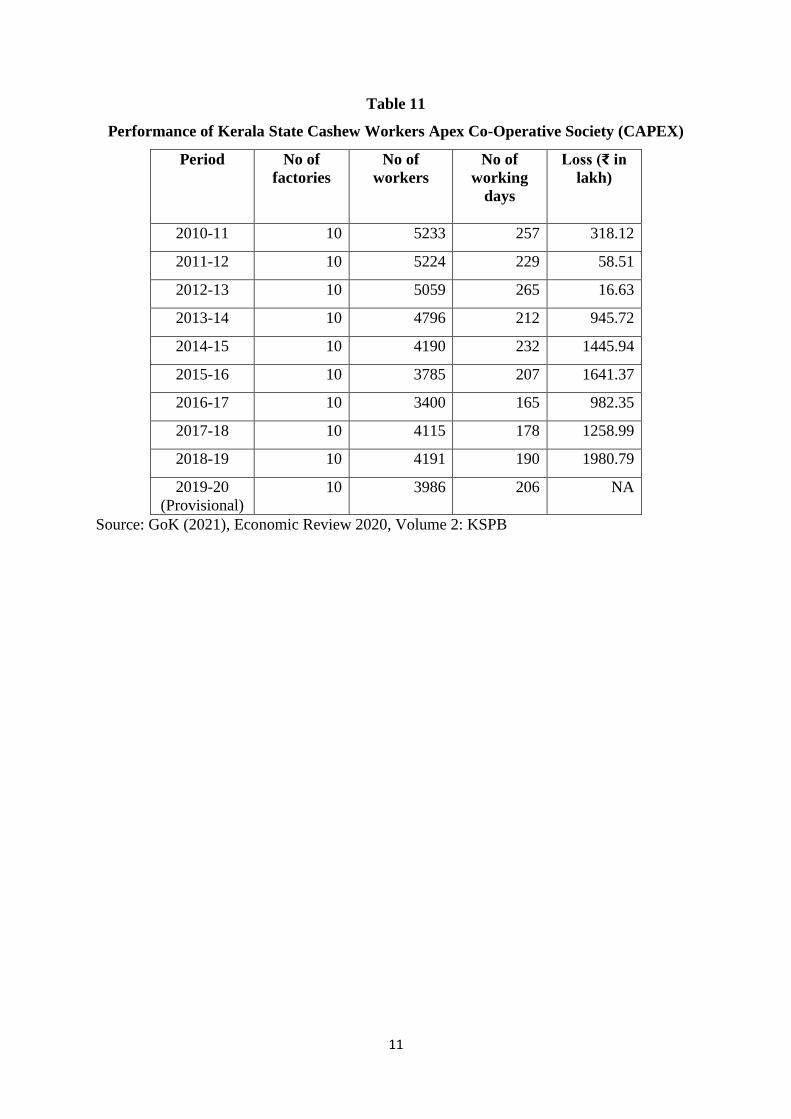
Table 11
Performance of Kerala State Cashew Workers Apex Co-Operative Society (CAPEX)
Period
No of
factories
No of
workers
No of
working
days
Loss (₹ in
lakh)
2010-11 10 5233 257 318.12
2011-12 10 5224 229 58.51
2012-13 10 5059 265 16.63
2013-14 10 4796 212 945.72
2014-15 10 4190 232 1445.94
2015-16 10 3785 207 1641.37
2016-17 10 3400 165 982.35
2017-18 10 4115 178 1258.99
2018-19 10 4191 190 1980.79
2019-20
(Provisional)
10 3986 206 NA
Source: GoK (2021), Economic Review 2020, Volume 2: KSPB
12
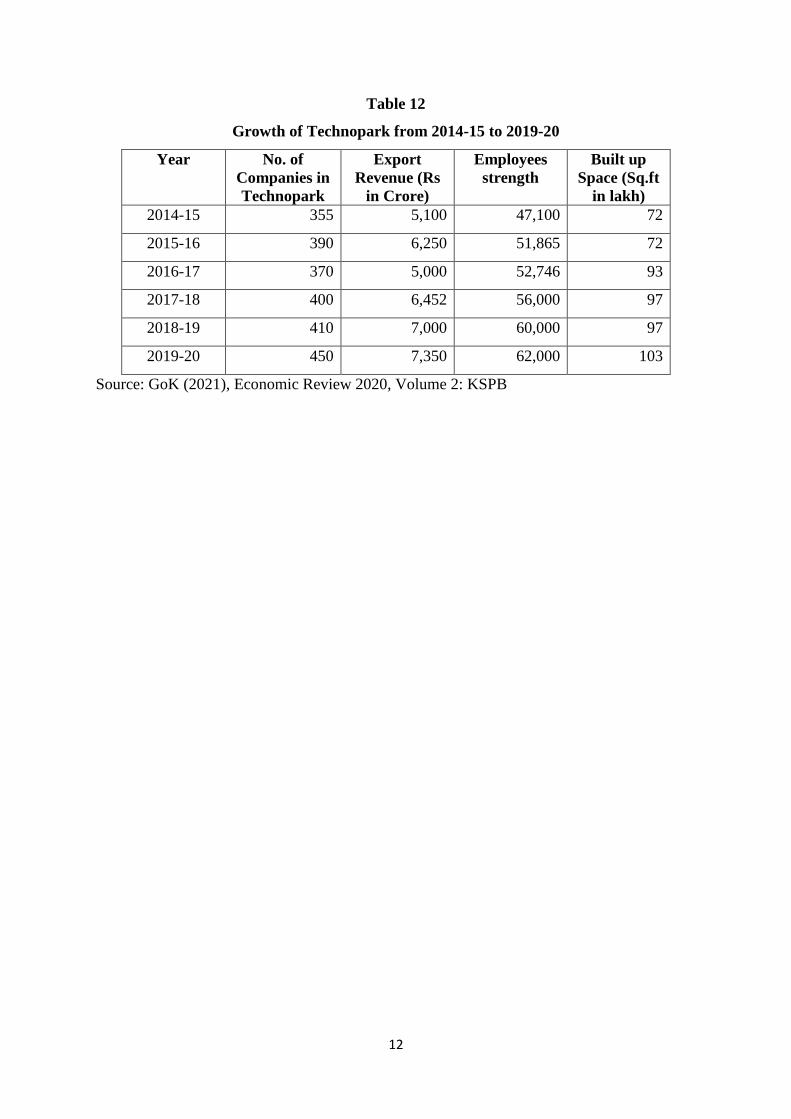
Table 12
Growth of Technopark from 2014-15 to 2019-20
Year No. of
Companies in
Technopark
Export
Revenue (Rs
in Crore)
Employees
strength
Built up
Space (Sq.ft
in lakh)
2014-15 355 5,100 47,100 72
2015-16 390 6,250 51,865 72
2016-17 370 5,000 52,746 93
2017-18 400 6,452 56,000 97
2018-19 410 7,000 60,000 97
2019-20 450 7,350 62,000 103
Source: GoK (2021), Economic Review 2020, Volume 2: KSPB
13
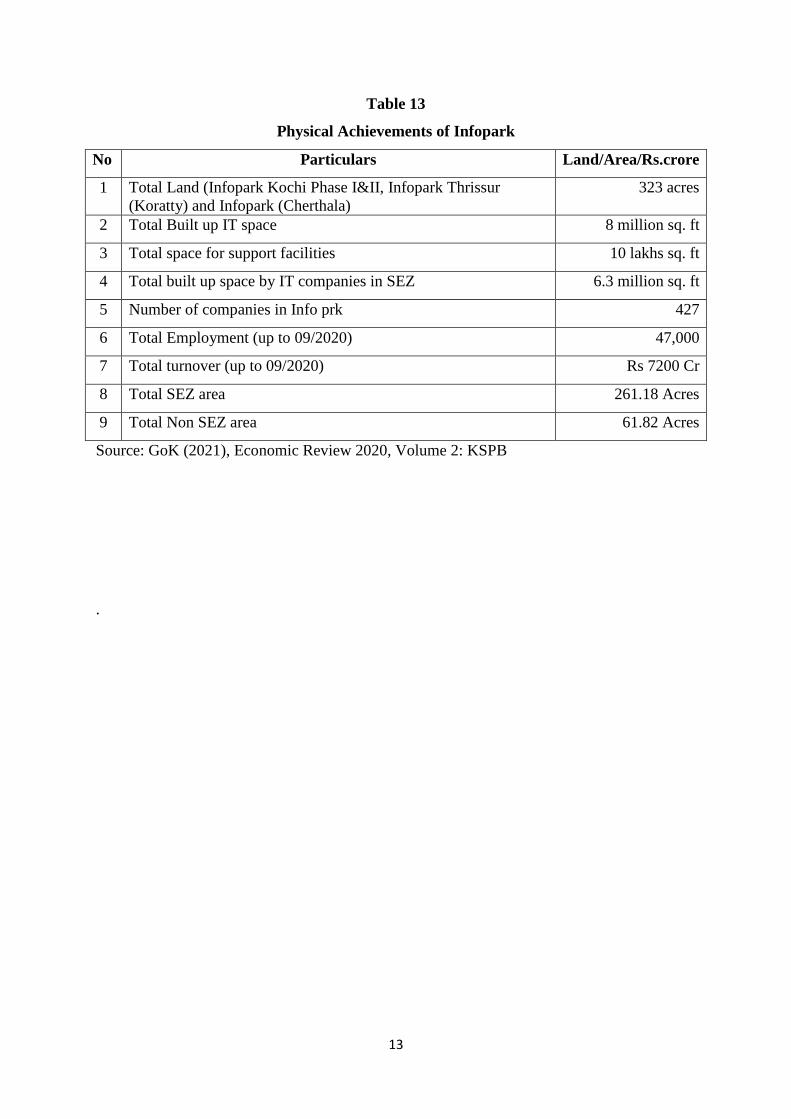
Table 13
Physical Achievements of Infopark
No Particulars Land/Area/Rs.crore
1 Total Land (Infopark Kochi Phase I&II, Infopark Thrissur
(Koratty) and Infopark (Cherthala)
323 acres
2 Total Built up IT space 8 million sq. ft
3 Total space for support facilities 10 lakhs sq. ft
4 Total built up space by IT companies in SEZ 6.3 million sq. ft
5 Number of companies in Info prk 427
6 Total Employment (up to 09/2020) 47,000
7 Total turnover (up to 09/2020) Rs 7200 Cr
8 Total SEZ area 261.18 Acres
9 Total Non SEZ area 61.82 Acres
Source: GoK (2021), Economic Review 2020, Volume 2: KSPB
.
14
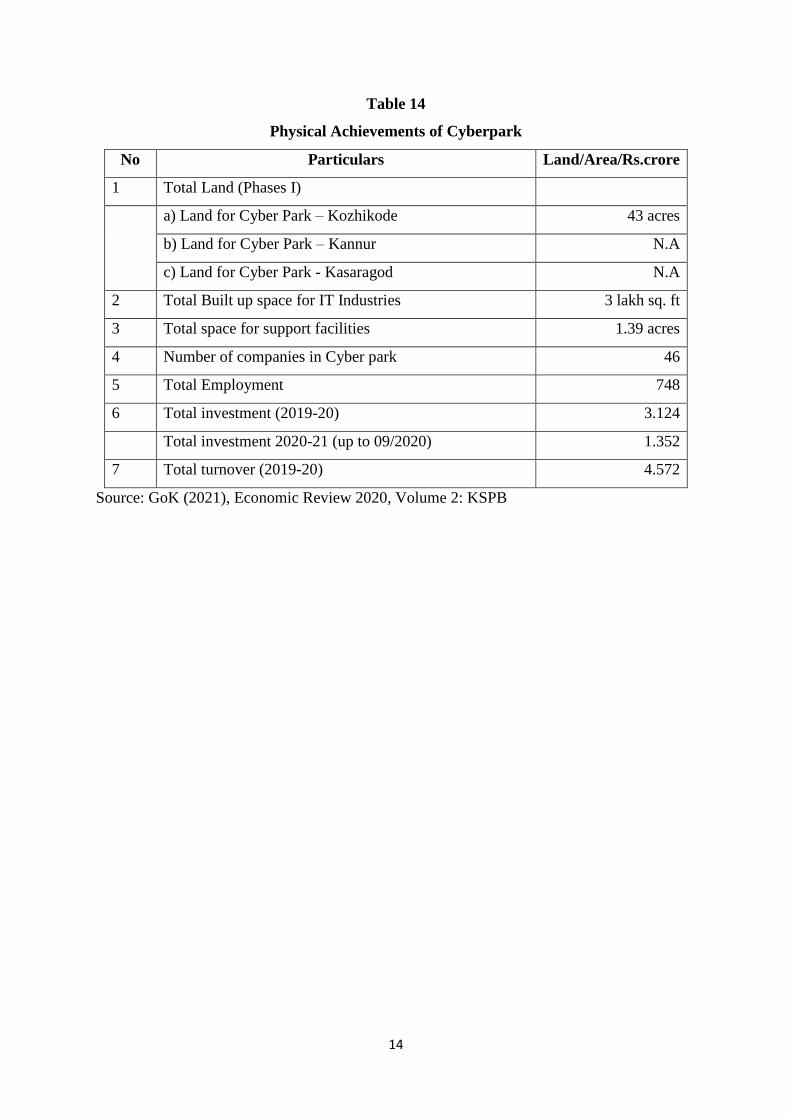
Table 14
Physical Achievements of Cyberpark
No Particulars Land/Area/Rs.crore
1 Total Land (Phases I)
a) Land for Cyber Park – Kozhikode 43 acres
b) Land for Cyber Park – Kannur N.A
c) Land for Cyber Park - Kasaragod N.A
2 Total Built up space for IT Industries 3 lakh sq. ft
3 Total space for support facilities 1.39 acres
4 Number of companies in Cyber park 46
5 Total Employment 748
6 Total investment (2019-20) 3.124
Total investment 2020-21 (up to 09/2020) 1.352
7 Total turnover (2019-20) 4.572
Source: GoK (2021), Economic Review 2020, Volume 2: KSPB