industrial - us investment outlook - jll · pdf file12-month net absorption (as % of...
TRANSCRIPT
United States | H1 2017
Industrial Investment
A focus on value and risk shaping investor behavior
JLL Research
IndustrialProperty market
It’s all in the numbers… the Industrial first half breakdown
Investment Outlook | United States | Industrial | H1 20172
Industrial investment momentum outpaces
overall CRE as investors continue to
expand holdings
-5012-month change in total vacancy (bps)
Source: JLL Research
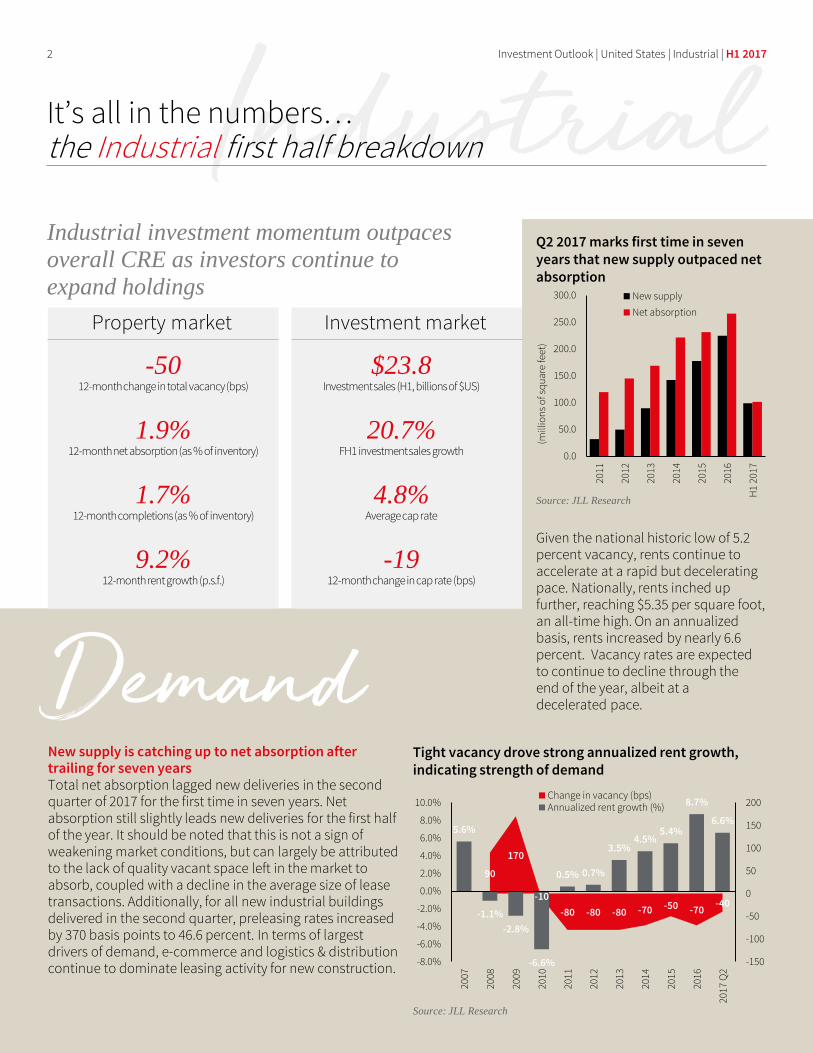
Tight vacancy drove strong annualized rent growth, indicating strength of demand
1.9%12-month net absorption (as % of inventory)
1.7%12-month completions (as % of inventory)
9.2%12-month rent growth (p.s.f.)
Investment market
$23.8Investment sales (H1, billions of $US)
20.7%FH1 investment sales growth
4.8%Average cap rate
-1912-month change in cap rate (bps)
Given the national historic low of 5.2 percent vacancy, rents continue to accelerate at a rapid but decelerating pace. Nationally, rents inched up further, reaching $5.35 per square foot, an all-time high. On an annualized basis, rents increased by nearly 6.6 percent. Vacancy rates are expected to continue to decline through the end of the year, albeit at a decelerated pace. Demand
New supply is catching up to net absorption after trailing for seven yearsTotal net absorption lagged new deliveries in the second quarter of 2017 for the first time in seven years. Net absorption still slightly leads new deliveries for the first half of the year. It should be noted that this is not a sign of weakening market conditions, but can largely be attributed to the lack of quality vacant space left in the market to absorb, coupled with a decline in the average size of lease transactions. Additionally, for all new industrial buildings delivered in the second quarter, preleasing rates increased by 370 basis points to 46.6 percent. In terms of largest drivers of demand, e-commerce and logistics & distribution continue to dominate leasing activity for new construction.
90
170
-10
-80 -80 -80 -70 -50 -70-40
5.6%
-1.1%
-2.8%
-6.6%
0.5% 0.7%
3.5%4.5%
5.4%
8.7%
6.6%
-150
-100
-50
0
50
100
150
200
-8.0%
-6.0%
-4.0%
-2.0%
0.0%
2.0%
4.0%
6.0%
8.0%
10.0%
2007
2008
2009
2010
2011
2012
2013
2014
2015
2016
2017
Q2
Change in vacancy (bps)Annualized rent growth (%)
Source: JLL Research
Q2 2017 marks first time in seven years that new supply outpaced net absorption
0.0
50.0
100.0
150.0
200.0
250.0
300.0
2011
2012
2013
2014
2015
2016
H1
2017
(mill
ion
s o
f sq
uar
e fe
et)
New supply
Net absorption
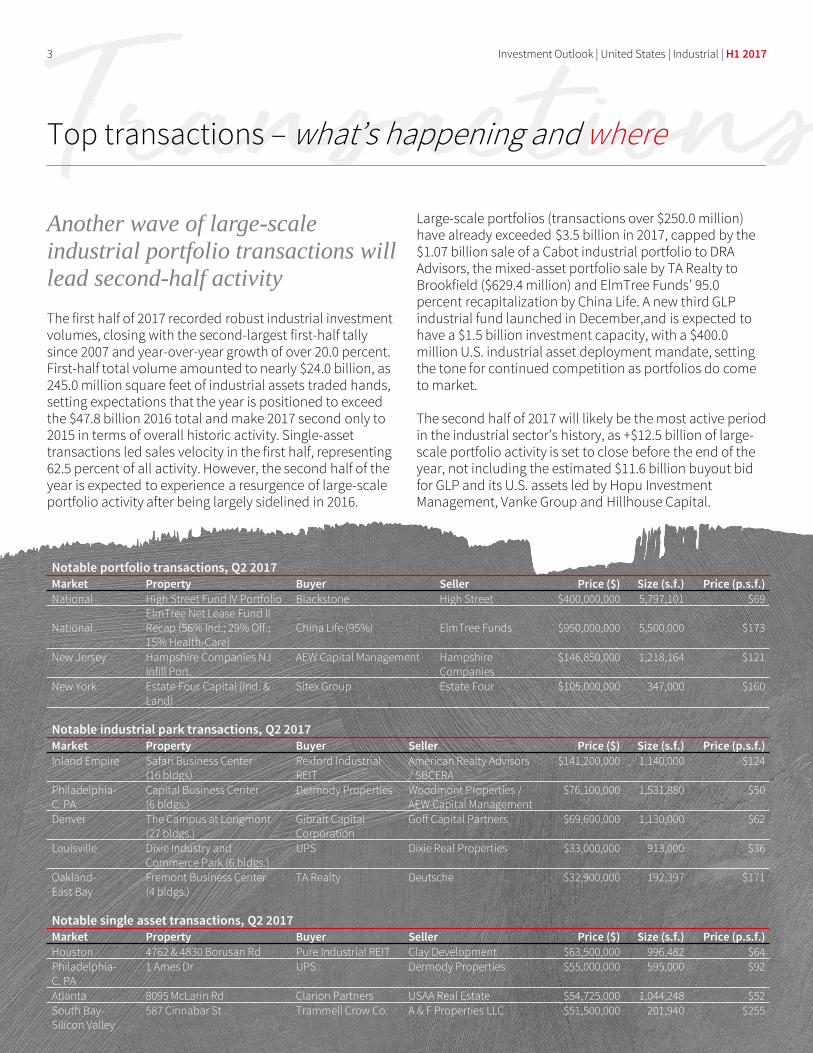
The first half of 2017 recorded robust industrial investment volumes, closing with the second-largest first-half tally since 2007 and year-over-year growth of over 20.0 percent. First-half total volume amounted to nearly $24.0 billion, as 245.0 million square feet of industrial assets traded hands, setting expectations that the year is positioned to exceed the $47.8 billion 2016 total and make 2017 second only to 2015 in terms of overall historic activity. Single-asset transactions led sales velocity in the first half, representing 62.5 percent of all activity. However, the second half of the year is expected to experience a resurgence of large-scale portfolio activity after being largely sidelined in 2016.
Large-scale portfolios (transactions over $250.0 million) have already exceeded $3.5 billion in 2017, capped by the $1.07 billion sale of a Cabot industrial portfolio to DRA Advisors, the mixed-asset portfolio sale by TA Realty to Brookfield ($629.4 million) and ElmTree Funds’ 95.0 percent recapitalization by China Life. A new third GLP industrial fund launched in December,and is expected to have a $1.5 billion investment capacity, with a $400.0 million U.S. industrial asset deployment mandate, setting the tone for continued competition as portfolios do come to market.
The second half of 2017 will likely be the most active period in the industrial sector’s history, as +$12.5 billion of large-scale portfolio activity is set to close before the end of the year, not including the estimated $11.6 billion buyout bid for GLP and its U.S. assets led by Hopu Investment Management, Vanke Group and Hillhouse Capital.
TransactionsTop transactions – what’s happening and where
Investment Outlook | United States | Industrial | H1 20173
Another wave of large-scale
industrial portfolio transactions will
lead second-half activity
Notable industrial park transactions, Q2 2017Market Property Buyer Seller Price ($) Size (s.f.) Price (p.s.f.)
Inland Empire Safari Business Center (16 bldgs)
Rexford Industrial REIT
American Realty Advisors / SBCERA
$141,200,000 1,140,000 $124
Philadelphia-C. PA
Capital Business Center (6 bldgs.)
Dermody Properties Woodmont Properties / AEW Capital Management
$76,100,000 1,531,880 $50
Denver The Campus at Longmont (27 bldgs.)
Gibralt Capital Corporation
Goff Capital Partners $69,600,000 1,130,000 $62
Louisville Dixie Industry and Commerce Park (6 bldgs.)
UPS Dixie Real Properties $33,000,000 913,000 $36
Oakland-East Bay
Fremont Business Center (4 bldgs.)
TA Realty Deutsche $32,900,000 192,397 $171
Notable single asset transactions, Q2 2017Market Property Buyer Seller Price ($) Size (s.f.) Price (p.s.f.)
Houston 4762 & 4830 Borusan Rd Pure Industrial REIT Clay Development $63,500,000 996,482 $64Philadelphia-C. PA
1 Ames Dr UPS Dermody Properties $55,000,000 595,000 $92
Atlanta 8095 McLarin Rd Clarion Partners USAA Real Estate $54,725,000 1,044,248 $52South Bay-Silicon Valley
587 Cinnabar St Trammell Crow Co. A & F Properties LLC $51,500,000 201,940 $255
Notable portfolio transactions, Q2 2017Market Property Buyer Seller Price ($) Size (s.f.) Price (p.s.f.)
National High Street Fund IV Portfolio Blackstone High Street $400,000,000 5,797,101 $69
NationalElmTree Net Lease Fund II Recap (56% Ind.; 29% Off.; 15% Health-Care)
China Life (95%) ElmTree Funds $950,000,000 5,500,000 $173
New Jersey Hampshire Companies NJ Infill Port.
AEW Capital Management Hampshire Companies
$146,850,000 1,218,164 $121
New York Estate Four Capital (Ind. & Land)
Sitex Group Estate Four $105,000,000 347,000 $160
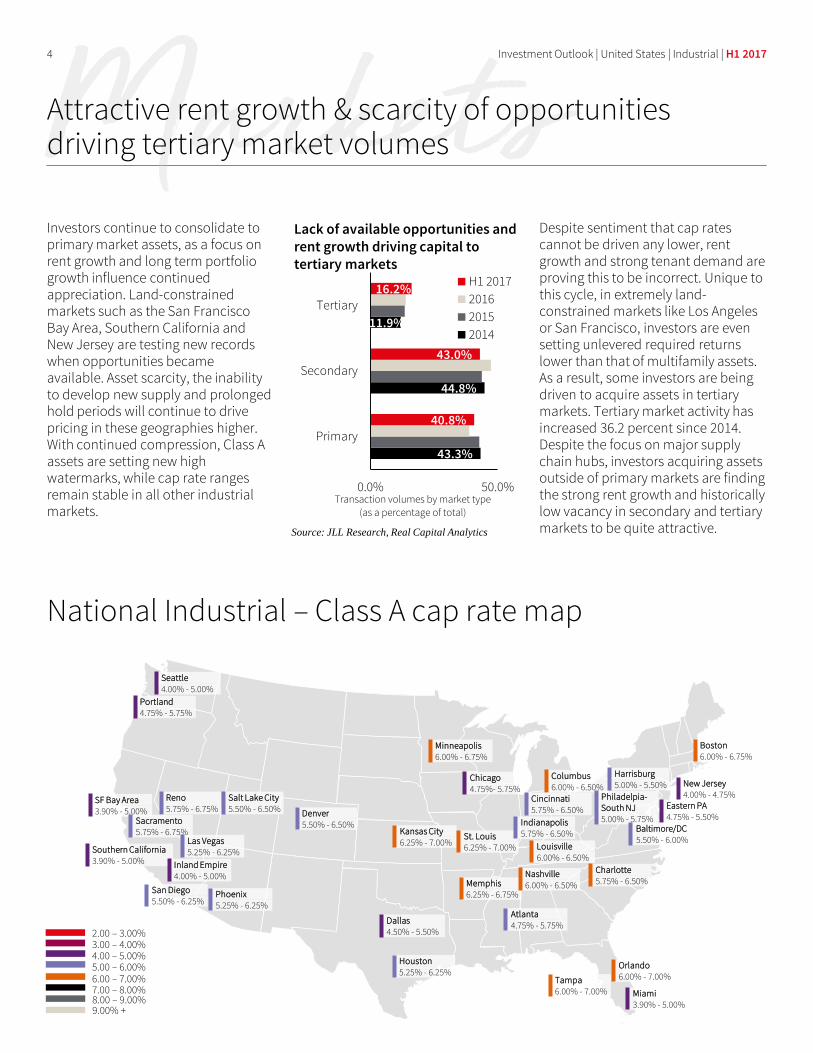
Investors continue to consolidate to primary market assets, as a focus on rent growth and long term portfolio growth influence continued appreciation. Land-constrained markets such as the San Francisco Bay Area, Southern California and New Jersey are testing new records when opportunities became available. Asset scarcity, the inability to develop new supply and prolonged hold periods will continue to drive pricing in these geographies higher. With continued compression, Class A assets are setting new high watermarks, while cap rate ranges remain stable in all other industrial markets.
Despite sentiment that cap rates cannot be driven any lower, rent growth and strong tenant demand are proving this to be incorrect. Unique to this cycle, in extremely land-constrained markets like Los Angeles or San Francisco, investors are even setting unlevered required returns lower than that of multifamily assets. As a result, some investors are being driven to acquire assets in tertiary markets. Tertiary market activity has increased 36.2 percent since 2014. Despite the focus on major supply chain hubs, investors acquiring assets outside of primary markets are finding the strong rent growth and historically low vacancy in secondary and tertiary markets to be quite attractive.
MarketsAttractive rent growth & scarcity of opportunitiesdriving tertiary market volumes
Investment Outlook | United States | Industrial | H1 20174
Source: JLL Research, Real Capital Analytics
Lack of available opportunities and rent growth driving capital to tertiary markets
NJ
CT
MA
NH
NC
VA
WA
VT
AL
AZ
AR
CACO
FL
GA
ID
IL IN
IA
KSKY
LA
ME
MI
MN
MS
MO
MT
NE
NV
NM
NY
ND
OH
OK
OR
PA
SC
SD
TN
TX
UTWV
WI
WY
Seattle4.00% - 5.00%
43.3%
44.8%
11.9%
40.8%
43.0%
16.2%
0.0% 50.0%
Primary
Secondary
Tertiary
Transaction volumes by market type (as a percentage of total)
H1 2017
2016
2015
2014
Portland4.75% - 5.75%
Reno5.75% - 6.75%
SF Bay Area3.90% - 5.00%
Southern California3.90% - 5.00%
Sacramento5.75% - 6.75%
Inland Empire4.00% - 5.00%
San Diego5.50% - 6.25%
Salt Lake City5.50% - 6.50%
Las Vegas5.25% - 6.25%
Phoenix5.25% - 6.25%
Denver5.50% - 6.50%
Minneapolis6.00% - 6.75%
Chicago4.75%- 5.75%
Kansas City6.25% - 7.00%
St. Louis6.25% - 7.00%
Memphis6.25% - 6.75%
Dallas4.50% - 5.50%
Houston5.25% - 6.25%
Columbus6.00% - 6.50%
Cincinnati5.75% - 6.50%
Louisville6.00% - 6.50%
Nashville6.00% - 6.50%
Atlanta4.75% - 5.75%
Boston6.00% - 6.75%
Eastern PA4.75% - 5.50%
Philadelpia-South NJ5.00% - 5.75%
Harrisburg5.00% - 5.50%
Baltimore/DC 5.50% - 6.00%
Charlotte5.75% - 6.50%
Orlando6.00% - 7.00%Tampa
6.00% - 7.00% Miami3.90% - 5.00%
4.00 – 5.00%5.00 – 6.00%6.00 – 7.00%7.00 – 8.00%
3.00 – 4.00%2.00 – 3.00%
8.00 – 9.00%9.00% +
National Industrial – Class A cap rate map
Indianapolis5.75% - 6.50%
New Jersey4.00% - 4.75%
capitalSources of
Investment Outlook | United States | Industrial | H1 20175
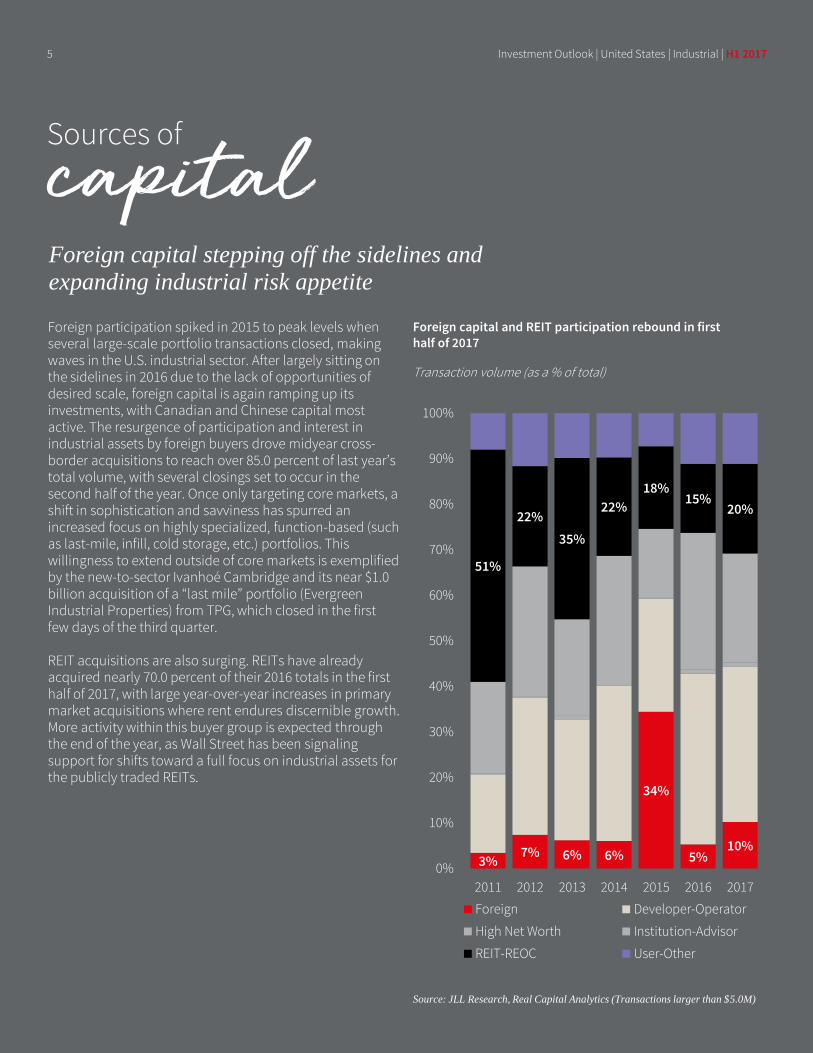
Foreign capital stepping off the sidelines and
expanding industrial risk appetite
Foreign participation spiked in 2015 to peak levels when several large-scale portfolio transactions closed, making waves in the U.S. industrial sector. After largely sitting on the sidelines in 2016 due to the lack of opportunities of desired scale, foreign capital is again ramping up its investments, with Canadian and Chinese capital most active. The resurgence of participation and interest in industrial assets by foreign buyers drove midyear cross-border acquisitions to reach over 85.0 percent of last year’s total volume, with several closings set to occur in the second half of the year. Once only targeting core markets, a shift in sophistication and savviness has spurred an increased focus on highly specialized, function-based (such as last-mile, infill, cold storage, etc.) portfolios. This willingness to extend outside of core markets is exemplified by the new-to-sector Ivanhoé Cambridge and its near $1.0 billion acquisition of a “last mile” portfolio (Evergreen Industrial Properties) from TPG, which closed in the first few days of the third quarter.
REIT acquisitions are also surging. REITs have already acquired nearly 70.0 percent of their 2016 totals in the first half of 2017, with large year-over-year increases in primary market acquisitions where rent endures discernible growth. More activity within this buyer group is expected through the end of the year, as Wall Street has been signaling support for shifts toward a full focus on industrial assets for the publicly traded REITs.
Source: JLL Research, Real Capital Analytics (Transactions larger than $5.0M)
Foreign capital and REIT participation rebound in first half of 2017
Transaction volume (as a % of total)
3%7% 6% 6%
34%
5%10%
51%
22%
35%
22%
18%15%
20%
0%
10%
20%
30%
40%
50%
60%
70%
80%
90%
100%
2011 2012 2013 2014 2015 2016 2017
Foreign Developer-Operator
High Net Worth Institution-Advisor
REIT-REOC User-Other
irisk
Investment Outlook | United States | Industrial | H1 20176
Current discourse within the investment community remains focused on the prolific performance of the industrial sector since the financial crisis, almost always coupled with anxieties over how mature into the cycle the sector is. A focus on certain elements of the current market conditions are becoming more vocalized, with particular attention being given to the following risk factors:
Oversupply apprehensions. Broadly, as new supply exceeded net absorption nationally for the first time in seven years in the second quarter, investors will keep a sharp eye on market fundamentals in the latter half of the year. Worries that supply outpacing net absorption could tip the market will be weighed against the lack of quality vacant space remaining in the market, as well as the recent reduction in the average lease transaction size.
Persistent troubles by retailers and the industrial requirements of these users. Further bankruptcies, store closings and mergers/acquisitions could pose residual effects on industrial fundamentals, presenting risks to planned tenant expansions and renewals. While this does present a risk, these industrial facilities typically are last to be liquidated, solace for investors with retail-tenanted assets.
Current scarcity of industrial assets. Scarcity will be further amplified as consolidation continues in the sector with large-scale portfolio activity. This is already impacting the competitive landscape for assets that do become available, affecting underwriting and asset pricing. From a transactional point of view, we are currently observing an increase in capital evaluating highly specialized assets (multistory mezzanine facilities, food processing facilities, cold/freezer storage, urban infill warehouses, etc.), reflective of a shift out on the risk curve given the risks associated with these assets. This could potentially leave investors more susceptible to downside risk if a downturn in demand does materialize in the geographies of these facilities.
Sources of
Concentrated competition driving investment
further out the risk curve
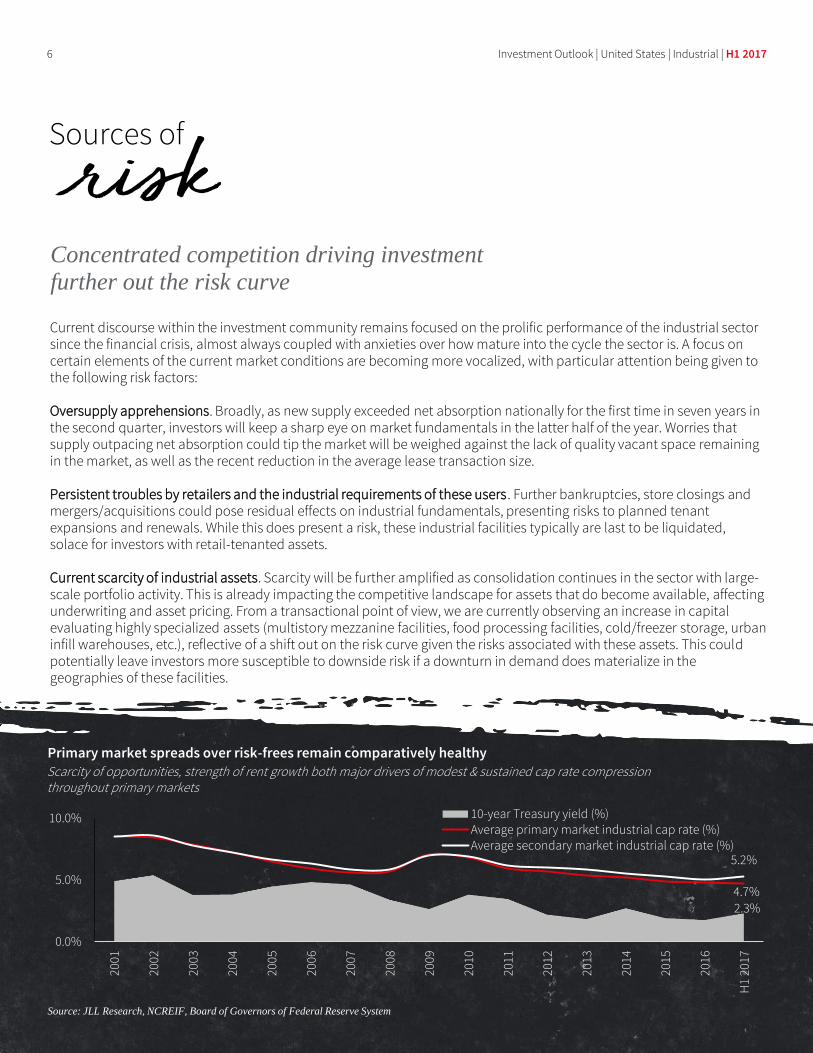
Source: JLL Research, NCREIF, Board of Governors of Federal Reserve System
Primary market spreads over risk-frees remain comparatively healthyScarcity of opportunities, strength of rent growth both major drivers of modest & sustained cap rate compression throughout primary markets
2.3%
4.7%
5.2%
0.0%
5.0%
10.0%
2001
2002
2003
2004
2005
2006
2007
2008
2009
2010
2011
2012
2013
2014
2015
2016
H1
2017
10-year Treasury yield (%)Average primary market industrial cap rate (%)Average secondary market industrial cap rate (%)

ContactsInvestor Research:
Sean CoghlanDirector, Investor Research+1 215 988 [email protected]
Sean KaneManager, Investor Research+1 213 239 [email protected]
Office:
David Hoebbel+1 312 228 [email protected]
Retail:
Arielle Einhorn+1 312 228 [email protected]
Industrial:
Peter Kroner+1 312 228 [email protected]
Net Lease:
Sean Coghlan+1 215 988 [email protected]
Multifamily:
Michael Morrone+1 312 228 [email protected]
Debt & Equity:
Ronak Sheth+1 312 228 [email protected]
Investment Outlook | United States | Industrial | H1 20177

About JLL
JLL (NYSE: JLL) is a leading professional services firm that specializes in real estate and investment management. A Fortune 500 company, JLL helps real estate owners, occupiers and investors achieve their business ambitions. In 2016, JLL had revenue of $6.8 billion and fee revenue of $5.8 billion and, on behalf of clients, managed 4.4 billion square feet, or 409 million square meters, and completed sales acquisitions and finance transactions of approximately $145 billion. At the end of the second quarter of 2017, JLL had nearly 300 corporate offices, operations in over 80 countries and a global workforce of nearly 80,000. As of June 30, 2017, LaSalle Investment Management had $57.6 billion of real estate under asset management. JLL is the brand name, and a registered trademark, of Jones Lang LaSalle Incorporated. For further information, visit ir.jll.com.
About JLL Research
JLL’s research team delivers intelligence, analysis and insight through market-leading reports and services that illuminate today’s commercial real estate dynamics and identify tomorrow’s challenges and opportunities. Our more than 400 global research professionals track and analyze economic and property trends and forecast future conditions in over 60 countries, producing unrivalled local and global perspectives. Our research and expertise, fueled by real-time information and innovative thinking around the world, creates a competitive advantage for our clients and drives successful strategies and optimal real estate decisions.
© 2017 Jones Lang LaSalle IP, Inc.
All rights reserved. All information contained herein is from sources deemed reliable; however, no representation or warranty is made to the accuracy thereof.