industrial ion chromatography application note compendium...industrial application note compendium...
TRANSCRIPT
Industrial Ion Chromatography application note compendium
Overview
Table of contents
Chemicals
Electronics
Materials
Batteries
Oil and Gas
Biofuels
Power

Industrial application note compendium
There is a broad range of industrial applications that are ideally suited for the use of ion chromatography (IC), which is reflected in the large quantity of application and technical notes that are available. This compendium presents summaries of the latest releases in each of the following areas:
• Chemicals
• Materials
• Batteries
• Electronics
• Oil and Gas
• Biofuels
• Power
Overview
Table of contents
Chemicals
Electronics
Materials
Batteries
Oil and Gas
Biofuels
Power

Industrial application note compendium
Overview
Table of contents
Chemicals
ChemicalsMonitoring for ionic contaminants in chemical production is essential to ensure high product quality, particularly when these chemicals are subsequently used in manufacturing processes that require ultra clean reagents such as in semiconductor fabrication. Ion chromatography enables trace level (part per billion (ppb)) determination of anions and cations in acids, bases, and organic solvents.
Electronics
Trace anions in acids and buffered etchant
Trace anions in basic solutions
Anionic impurities in sulfuric acid
Cations and amines in hydrogen peroxide
Anions in sodium hydroxide
Trace anions in organic solvents
Materials
Batteries
Oil and Gas
Biofuels
Power

Determination of trace anions in hydrofluoric acid, ammonium fluoride, and a buffered oxide etchant
Concentrated hydrofluoric acid (HF) is used in the semiconductor and electronics industries, both alone and as one component of a buffered oxide etchant (BOE), to remove oxide layers during device production. This HF must be of high purity, especially with respect to anionic impurities that can damage the semiconductor. Simply diluting the HF to a concentration that will not overload the anion-exchange column does not allow enough sensitivity to determine the contaminating anions.
This technical note describes determination of low concentrations of strong acid anions in HF using ion exclusion (Thermo Scientific™ Dionex™ IonPac™ ICE-AS1) and anion exchange (Thermo Scientific™ Dionex™ IonPac™ AS11-HC) columns. The method design also allows determination of low concentrations of strong acid anions in an HF/ammonium fluoride mixture (BOE), and ammonium fluoride.
0 5 10 15 20 25-10
0
100
Minutes
µS
-0.0117 18 19
0.5
5
2 3
4
5
1
Sample: 8.33% NH4F.HF
Peaks: 1. Fluoride — 2. Chloride 80.89 µg/L 3. Nitrate 341.6 4. Sulfate 1021 5. Phosphate 3.62
Determination of anions in ammonium fluoride.
Anion MDLs for each high fluoride sample.
AnionMDL (µg/L)
Hydrofluoric Acid (12%) Ammonium Fluoride (8.33%) Simulated BOE (10x Dilution)
Chloride 1.23 0.81 0.71
Nitrate 1.01 2.25 3.17
Sulfate 2.49 5.48 1.81
Phosphate 9.86 4.83 1.14
For more information click here
Overview
Table of contents
Chemicals
Electronics
Trace anions in hydrofluoric acid and buffered etchant
Trace anions in basic solutions
Anionic impurities in sulfuric acid
Cations and amines in hydrogen peroxide
Anions in sodium hydroxide
Trace anions in organic solvents
Materials
Batteries
Oil and Gas
Biofuels
Power
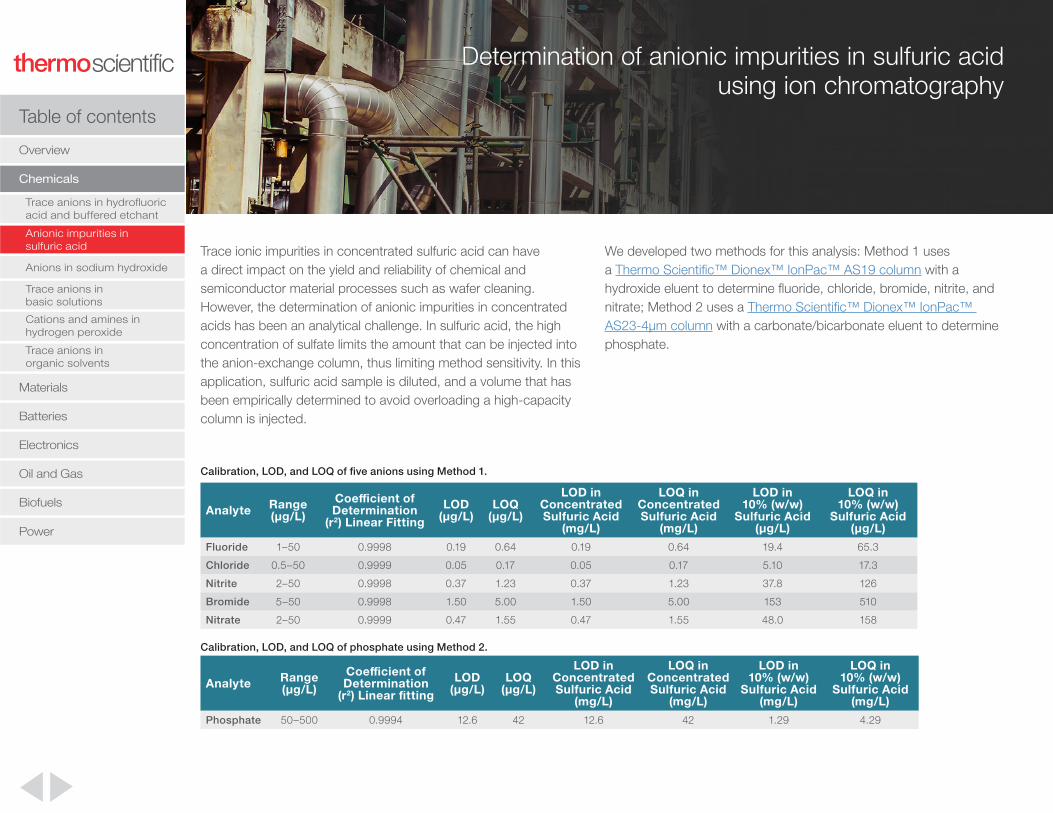
Trace ionic impurities in concentrated sulfuric acid can have a direct impact on the yield and reliability of chemical and semiconductor material processes such as wafer cleaning. However, the determination of anionic impurities in concentrated acids has been an analytical challenge. In sulfuric acid, the high concentration of sulfate limits the amount that can be injected into the anion-exchange column, thus limiting method sensitivity. In this application, sulfuric acid sample is diluted, and a volume that has been empirically determined to avoid overloading a high-capacity column is injected.
We developed two methods for this analysis: Method 1 uses a Thermo Scientific™ Dionex™ IonPac™ AS19 column with a hydroxide eluent to determine fluoride, chloride, bromide, nitrite, and nitrate; Method 2 uses a Thermo Scientific™ Dionex™ IonPac™ AS23-4μm column with a carbonate/bicarbonate eluent to determine phosphate.
Determination of anionic impurities in sulfuric acid using ion chromatography
Calibration, LOD, and LOQ of five anions using Method 1.
Analyte Range (µg/L)
Coefficient of Determination
(r2) Linear FittingLOD
(µg/L) LOQ
(µg/L)
LOD in Concentrated Sulfuric Acid
(mg/L)
LOQ in Concentrated Sulfuric Acid
(mg/L)
LOD in 10% (w/w)
Sulfuric Acid (µg/L)
LOQ in 10% (w/w)
Sulfuric Acid (µg/L)
Fluoride 1–50 0.9998 0.19 0.64 0.19 0.64 19.4 65.3
Chloride 0.5–50 0.9999 0.05 0.17 0.05 0.17 5.10 17.3
Nitrite 2–50 0.9998 0.37 1.23 0.37 1.23 37.8 126
Bromide 5–50 0.9998 1.50 5.00 1.50 5.00 153 510
Nitrate 2–50 0.9999 0.47 1.55 0.47 1.55 48.0 158
Calibration, LOD, and LOQ of phosphate using Method 2.
Analyte Range (µg/L)
Coefficient of Determination
(r2) Linear fittingLOD
(µg/L) LOQ
(µg/L)
LOD in Concentrated Sulfuric Acid
(mg/L)
LOQ in Concentrated Sulfuric Acid
(mg/L)
LOD in 10% (w/w)
Sulfuric Acid (mg/L)
LOQ in 10% (w/w)
Sulfuric Acid (mg/L)
Phosphate 50–500 0.9994 12.6 42 12.6 42 1.29 4.29
Overview
Table of contents
Chemicals
Electronics
Trace anions in hydrofluoric acid and buffered etchant
Trace anions in basic solutions
Anionic impurities in sulfuric acid
Cations and amines in hydrogen peroxide
Anions in sodium hydroxide
Trace anions in organic solvents
Materials
Batteries
Oil and Gas
Biofuels
Power

For more information click here
0 10 20 30-0.06
0
0.10
1
Minutes
µS/c
m
2
3 4 56
ABC
B C Peaks: 1. Fluoride 2. Chloride 3. Nitrite 4. Bromide 5. Nitrate 6. Phosphate <LOD 48.1 µg/L
Samples: A. DI H20
B. Sulfuric acid C. Sulfuric acid spiked with 50 ppb six anions
Overlay of chromatograms of sample vs. sample spiked with 50 µg/L of the six anions standards mix using Method 2. Note: only phosphate was determined using this method.
Overview
Table of contents
Chemicals
Electronics
Trace anions in hydrofluoric acid and buffered etchant
Trace anions in basic solutions
Anionic impurities in sulfuric acid
Cations and amines in hydrogen peroxide
Anions in sodium hydroxide
Trace anions in organic solvents
Materials
Batteries
Oil and Gas
Biofuels
Power
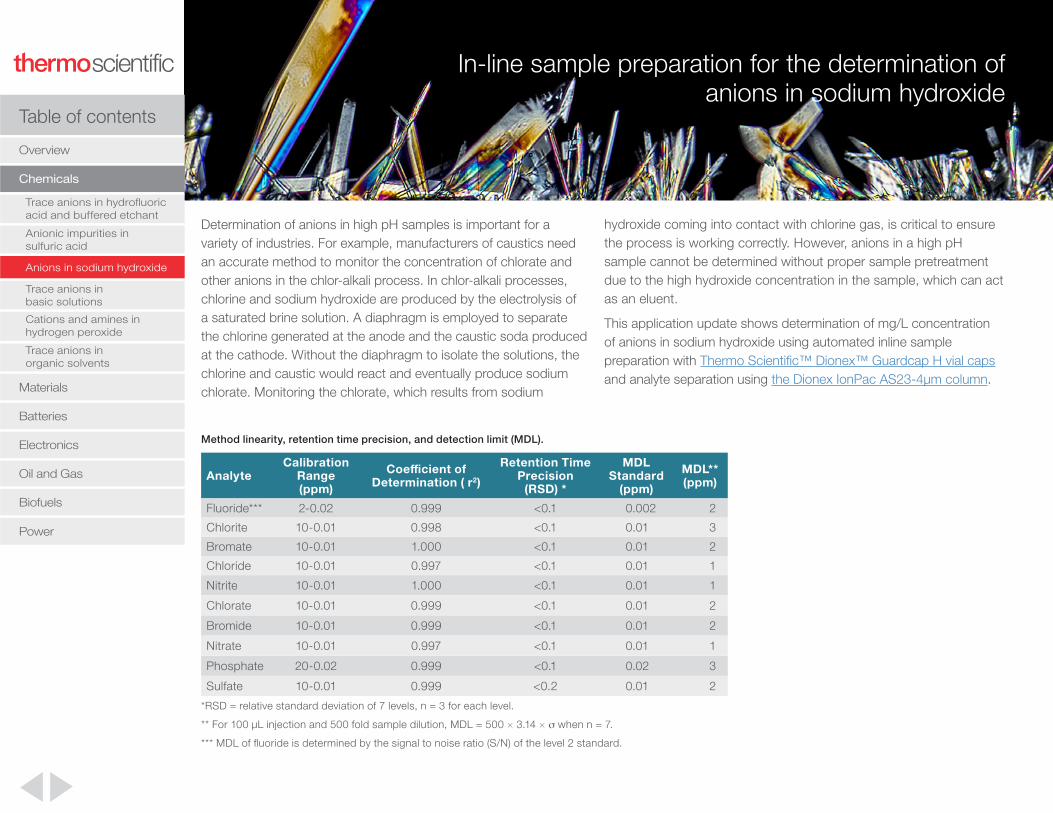
Determination of anions in high pH samples is important for a variety of industries. For example, manufacturers of caustics need an accurate method to monitor the concentration of chlorate and other anions in the chlor-alkali process. In chlor-alkali processes, chlorine and sodium hydroxide are produced by the electrolysis of a saturated brine solution. A diaphragm is employed to separate the chlorine generated at the anode and the caustic soda produced at the cathode. Without the diaphragm to isolate the solutions, the chlorine and caustic would react and eventually produce sodium chlorate. Monitoring the chlorate, which results from sodium
In-line sample preparation for the determination of anions in sodium hydroxide
hydroxide coming into contact with chlorine gas, is critical to ensure the process is working correctly. However, anions in a high pH sample cannot be determined without proper sample pretreatment due to the high hydroxide concentration in the sample, which can act as an eluent.
This application update shows determination of mg/L concentration of anions in sodium hydroxide using automated inline sample preparation with Thermo Scientific™ Dionex™ Guardcap H vial caps and analyte separation using the Dionex IonPac AS23-4μm column.
Method linearity, retention time precision, and detection limit (MDL).
AnalyteCalibration
Range (ppm)
Coefficient of Determination ( r2)
Retention Time Precision
(RSD) *
MDL Standard
(ppm)
MDL** (ppm)
Fluoride*** 2-0.02 0.999 <0.1 0.002 2
Chlorite 10-0.01 0.998 <0.1 0.01 3
Bromate 10-0.01 1.000 <0.1 0.01 2
Chloride 10-0.01 0.997 <0.1 0.01 1
Nitrite 10-0.01 1.000 <0.1 0.01 1
Chlorate 10-0.01 0.999 <0.1 0.01 2
Bromide 10-0.01 0.999 <0.1 0.01 2
Nitrate 10-0.01 0.997 <0.1 0.01 1
Phosphate 20-0.02 0.999 <0.1 0.02 3
Sulfate 10-0.01 0.999 <0.2 0.01 2
*RSD = relative standard deviation of 7 levels, n = 3 for each level.
** For 100 µL injection and 500 fold sample dilution, MDL = 500 × 3.14 × σ when n = 7.
*** MDL of fluoride is determined by the signal to noise ratio (S/N) of the level 2 standard.
Overview
Table of contents
Anionic impurities in sulfuric acid
Anions in sodium hydroxide
Chemicals
Trace anions in hydrofluoric acid and buffered etchant
Electronics
Trace anions in basic solutions
Cations and amines in hydrogen peroxide
Trace anions in organic solvents
Materials
Batteries
Oil and Gas
Biofuels
Power

For more information click here
Chromatograms of mixed anions samples in high-pH and in neutral matrices.
0 5 10 15 20 25
0
-5
25
Minutes
µS
A
B
1
2
3
4
5
6 78
9
11
10
Sample : Mixed standard treated with Dionex Guardcap H A- in 500× diluted NaOH (0.0382N) B- in DI water
Peaks: A B (ppm) 1. Fluoride 1 1 2. Chlorite 5 0 3. Bromate 5 5 4. Chloride 5 5 5. Nitrite 5 5 6. Chlorate 5 5 7. Bromide 5 5 8. Nitrate 5 5 9. Carbonate - 10. Phosphate 10 10 11. Sulfate 5 5
Overview
Table of contents
Anionic impurities in sulfuric acid
Anions in sodium hydroxide
Chemicals
Trace anions in hydrofluoric acid and buffered etchant
Electronics
Trace anions in basic solutions
Cations and amines in hydrogen peroxide
Trace anions in organic solvents
Materials
Batteries
Oil and Gas
Biofuels
Power
Determination of trace anions in basic solutions by single pass AutoNeutralization and ion chromatography
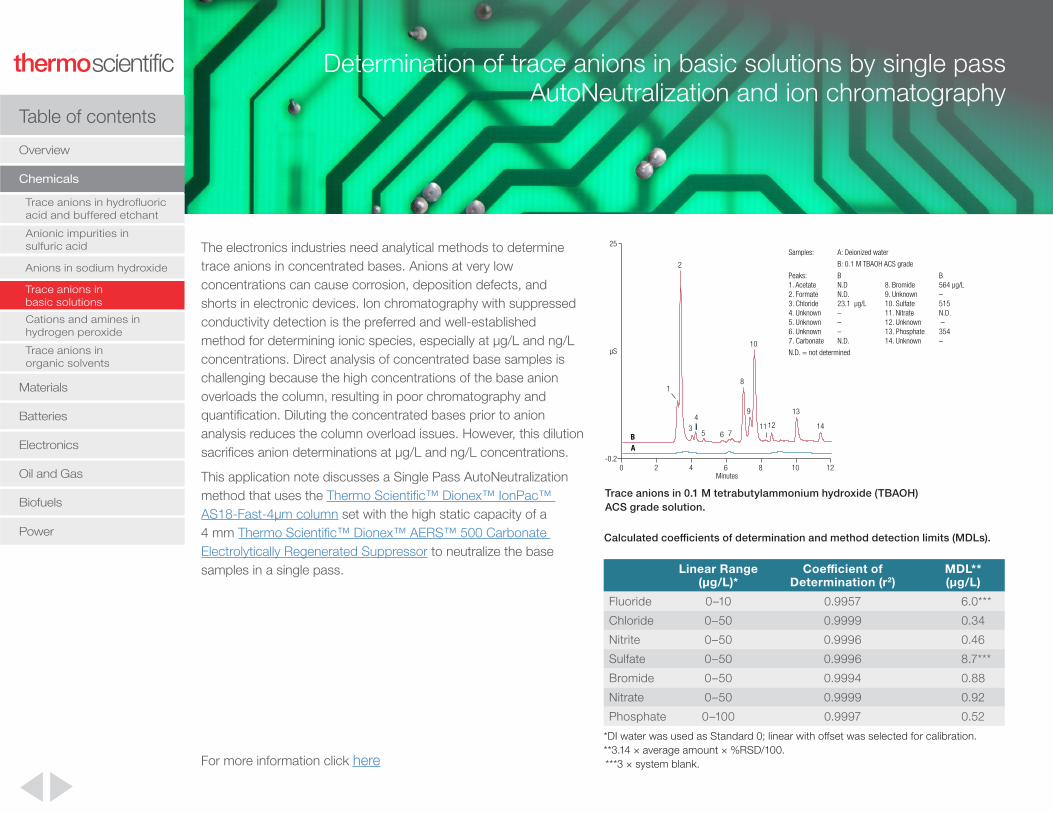
The electronics industries need analytical methods to determine trace anions in concentrated bases. Anions at very low concentrations can cause corrosion, deposition defects, and shorts in electronic devices. Ion chromatography with suppressed conductivity detection is the preferred and well-established method for determining ionic species, especially at μg/L and ng/L concentrations. Direct analysis of concentrated base samples is challenging because the high concentrations of the base anion overloads the column, resulting in poor chromatography and quantification. Diluting the concentrated bases prior to anion analysis reduces the column overload issues. However, this dilution sacrifices anion determinations at μg/L and ng/L concentrations.
This application note discusses a Single Pass AutoNeutralization method that uses the Thermo Scientific™ Dionex™ IonPac™ AS18-Fast-4μm column set with the high static capacity of a 4 mm Thermo Scientific™ Dionex™ AERS™ 500 Carbonate Electrolytically Regenerated Suppressor to neutralize the base samples in a single pass.
For more information click here
1
25
-0.2
µS
3 11
13
10
Minutes104 120 2 86
6 7
9
2
4
5
8
AB
1412
Samples: A: Deionized water
B: 0.1 M TBAOH ACS grade
Peaks: B B1. Acetate N.D 8. Bromide 564 µg/L 2. Formate N.D. 9. Unknown – 3. Chloride 23.1 µg/L 10. Sulfate 515 4. Unknown – 11. Nitrate N.D. 5. Unknown – 12. Unknown – 6. Unknown – 13. Phosphate 354 7. Carbonate N.D. 14. Unknown –
N.D. = not determined
Calculated coefficients of determination and method detection limits (MDLs).
*DI water was used as Standard 0; linear with offset was selected for calibration.**3.14 × average amount × %RSD/100. ***3 × system blank.
Linear Range (µg/L)*
Coefficient of Determination (r2)
MDL** (µg/L)
Fluoride 0–10 0.9957 6.0***
Chloride 0–50 0.9999 0.34
Nitrite 0–50 0.9996 0.46
Sulfate 0–50 0.9996 8.7***
Bromide 0–50 0.9994 0.88
Nitrate 0–50 0.9999 0.92
Phosphate 0–100 0.9997 0.52
Trace anions in 0.1 M tetrabutylammonium hydroxide (TBAOH) ACS grade solution.
Trace anions in basic solutions
Anions in sodium hydroxide
Overview
Table of contents
Anionic impurities in sulfuric acid
Chemicals
Trace anions in hydrofluoric acid and buffered etchant
Electronics
Cations and amines in hydrogen peroxide
Trace anions in organic solvents
Materials
Batteries
Oil and Gas
Biofuels
Power

Determination of cations and amines in hydrogen peroxide by ion chromatography using a RFIC (reagent-free) system
Hydrogen peroxide is an essential chemical in the fabrication of integrated circuit and microcircuit devices. Maximum allowable contaminant levels for semiconductor-grade hydrogen peroxide can be as low as <100 ppt (ng/L) per individual inorganic cation. A number of semiconductor manufacturers include specifications for maximum allowable levels of <1 ppb (μg/L) for trimethylamine and related amines.
This application note describes the use of a Thermo Scientific™ Dionex™ IonPac™ CS17 column to determine trace cations and amines in hydrogen peroxide with a large-loop injection. The Dionex IonPac CS17 column separates amines without the organic solvent eluent modifier needed for separating amines when using older cation-exchange IC columns. Using Reagent-Free™ IC (RFIC™) system, this application easily determines sub-μg/L concentrations of cations and amines.
For more information click here
Analyte Average Amount(μg/L)
RSD(%)(μg/L) MDLa (μg/L)
Lithium 0.629 0.272 0.005
Sodium 2.502 0.324 0.025
Ammonium 1.125 1.877 0.066
Methylamine 18.100 0.184 0.105
Potassium 3.521 0.616 0.068
Ethylamine 6.263 0.549 0.108
Dimethylamine 36.040 0.292 0.330
Trimethylamine 12.870 0.342 0.138
Magnesium 0.735 2.575 0.059
Calcium 0.857 5.518 0.148
a MDL = σts,99
where ts,99
= 3.14 for n = 7.
RFIC Analysis of hydrogen peroxide Sample #1.
Determination of MDLs for cations and amines.
µS
Minutes
0 5 10 15 20 25 30 35 40 45 50
1.0
–0.1
Peaks: 1. Sodium 27.6 µg/L 2. Ammonium 16.3 3. Potassium 20.5 4. Unknown —
5. Unknown — 6. Magnesium 0.35 7. Calcium 5.80
1
23
4 5 6
7
Trace anions in basic solutions
Cations and amines in hydrogen peroxide
Anions in sodium hydroxide
Overview
Table of contents
Anionic impurities in sulfuric acid
Chemicals
Trace anions in hydrofluoric acid and buffered etchant
Electronics
Trace anions in organic solvents
Materials
Batteries
Oil and Gas
Biofuels
Power
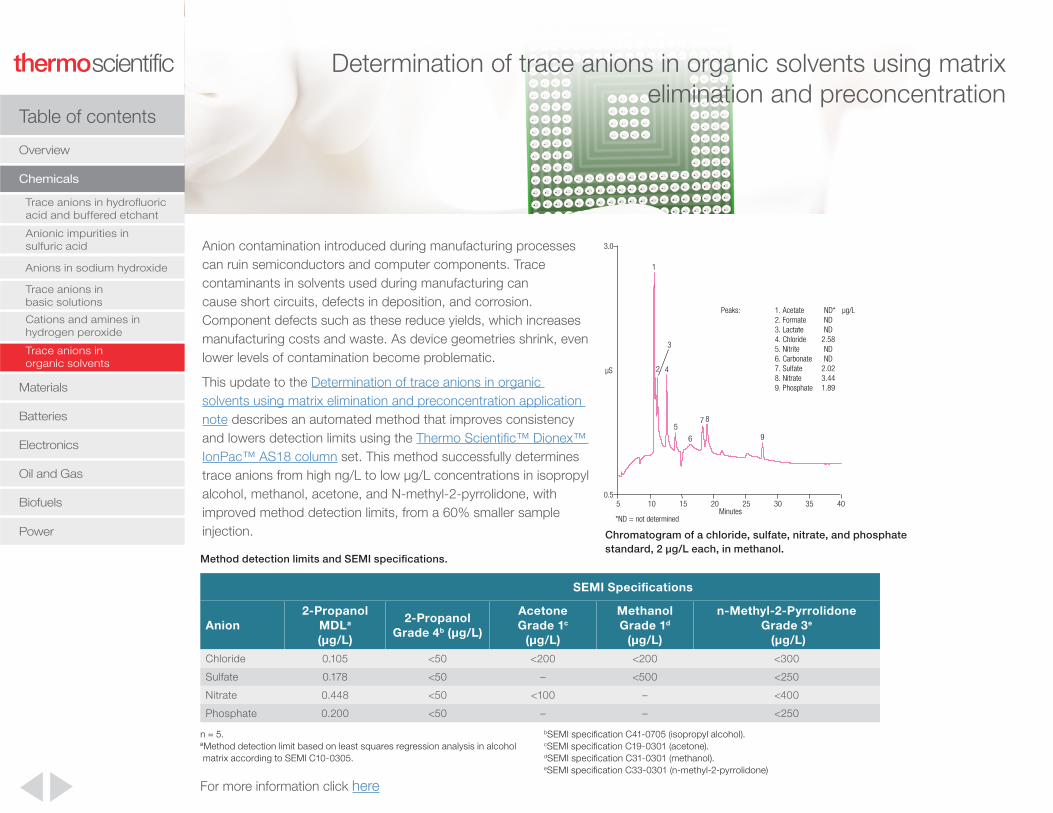
Determination of trace anions in organic solvents using matrix elimination and preconcentration
Anion contamination introduced during manufacturing processes can ruin semiconductors and computer components. Trace contaminants in solvents used during manufacturing can cause short circuits, defects in deposition, and corrosion. Component defects such as these reduce yields, which increases manufacturing costs and waste. As device geometries shrink, even lower levels of contamination become problematic.
This update to the Determination of trace anions in organic solvents using matrix elimination and preconcentration application note describes an automated method that improves consistency and lowers detection limits using the Thermo Scientific™ Dionex™ IonPac™ AS18 column set. This method successfully determines trace anions from high ng/L to low μg/L concentrations in isopropyl alcohol, methanol, acetone, and N-methyl-2-pyrrolidone, with improved method detection limits, from a 60% smaller sample injection.
For more information click here
Peaks: 1. Acetate ND* µg/L 2. Formate ND 3. Lactate ND 4. Chloride 2.58 5. Nitrite ND 6. Carbonate ND 7. Sulfate 2.02 8. Nitrate 3.44 9. Phosphate 1.89
Minutes
0.5
3.0
3
4
5
6
7 8
9
5 10 20 30 40
µS
15 25 35
2
1
*ND = not determined
Chromatogram of a chloride, sulfate, nitrate, and phosphate standard, 2 µg/L each, in methanol.
Method detection limits and SEMI specifications.
Cations and amines in hydrogen peroxide
Trace anions in organic solvents
n = 5.ªMethod detection limit based on least squares regression analysis in alcohol matrix according to SEMI C10-0305.
SEMI Specifications
Anion2-Propanol
MDLa (µg/L)
2-Propanol Grade 4b (µg/L)
Acetone Grade 1c
(µg/L)
Methanol Grade 1d
(µg/L)
n-Methyl-2-Pyrrolidone Grade 3e
(µg/L)Chloride 0.105 <50 <200 <200 <300
Sulfate 0.178 <50 – <500 <250
Nitrate 0.448 <50 <100 – <400
Phosphate 0.200 <50 – – <250
bSEMI specification C41-0705 (isopropyl alcohol).cSEMI specification C19-0301 (acetone).dSEMI specification C31-0301 (methanol).eSEMI specification C33-0301 (n-methyl-2-pyrrolidone)
Trace anions in basic solutions
Anions in sodium hydroxide
Overview
Table of contents
Anionic impurities in sulfuric acid
Chemicals
Trace anions in hydrofluoric acid and buffered etchant
Electronics
Materials
Batteries
Oil and Gas
Biofuels
Power
MaterialsAnalysis of solid and semi-solid materials to determine halogen content can be challenging but pairing an IC system with a combustion unit simplifies this process by automating sample preparation and data acquisition to produce results with sensitivity, accuracy and consistency.
Overview
Table of contents
Chemicals
Electronics
Chlorine, bromine and sulfur in polyethylene materials using CIC
Materials
Batteries
Oil and Gas
Biofuels
Power

Polyethylene (PE) is a thermo-plastic created from the polymerization of ethylene, a process that produces long straight chains of hydrocarbon monomers. Plastic materials consist not only of plastic polymers, as many additives are used to improve different properties of the plastic. Halogen and sulfur-containing compounds are often added as plasticizers, flame retardants, and heat stabilizers. Due to the widespread use of plastic/polymers and their subsequent impact on the environment, it is important to know the content of the halogens and sulfur when polyethylene materials are disposed or recycled.
Plastic samples can be very difficult to analyze as sample preparation is required to extract analytes or remove interfering matrices, and these sample preparation techniques can be labor intensive. Combustion ion chromatography (CIC) has been demonstrated for the determination of halogens and sulfur in a variety of difficult samples.
Here we demonstrate that a Mitsubishi™ AQF-2100H combustion system combined with a Thermo Scientific™ Dionex™ Aquion™ IC System using a Dionex IonPac AS23 column set can be used for automated qualitative and quantitative analysis of halogens and sulfur in plastic samples.
Note: This application can also be run with hydroxide eluent. (see AN72349 for more info.)
Determination of chlorine, bromine, and sulfur in polyethylene materials using combustion IC with a carbonate/bicarbonate eluent
For more information click here
Sample 1Sample 2Sample 3Sample 4
0 2 4 6 8 10 12 14 16 18Minutes
Cl–SO4
2–
F–NO2
–
-11
-3
-1
2
µS/c
m
Chromatograms of polymer samples 1,2, 3, and 4.
Spike recovery for samples 1, 2, 3, and 4.
Sample #1
Unspiked (ppm)
Added(ppm)
Spiked(ppm)
Recovery(%)
Chlorine 20.6 98.6 135 116
Sulfur 0 82.2 76.6 93.2
Sample #2
Chlorine 3.09 95.8 106 107
Sulfur 2.30 79.5 75.5 92.1
Sample #3
Chlorine 90.4 97.5 176 87.8
Sulfur 62.0 76.9 130 88.8
Sample #4
Chlorine 55.3 98.1 181 128
Sulfur 30.8 79.9 108 96.4
Overview
Table of contents
Chlorine, bromine and sulfur in polyethylene materials using CIC
Materials
Chemicals
Electronics
Batteries
Oil and Gas
Biofuels
Power
Overview
Table of contents
Materials
Batteries
BatteriesRechargeable lithium-ion batteries (LIBs) are key components for portable electronics, medical devices, industrial equipment and automobiles. Ion Chromatography can be used to gain insight into the fundamental processes and degradation mechanisms in LIBs and to ensure product quality during manufacturing.
Tetrafluoroborate, perchlorate, and hexafluorophosphate in simulated battery electrolyte
Electronics
Manganese in lithium/manganese oxide batteryelectrolyte
Chemicals
Oil and Gas
Biofuels
Power

Lithium ion batteries are commonly used in portable consumer electronic devices. The electrolyte solution in these batteries consists of a lithium salt in an organic solvent. The anions of the added lithium salts can be determined by ion chromatography to ensure that the solutions have been prepared at the proper concentrations.
Here, the authors prepare simulated samples that contain either lithium tetrafluoroborate, lithium perchlorate, or lithium hexafluorophosphate in an equal mixture of ethylene carbonate, diethyl carbonate, and propylene carbonate, and demonstrate that the anionic content can be determined accurately using a Thermo Scientific™ Reagent-Free™ IC (RFIC™) system with a Thermo Scientific™ Dionex™ IonPac™ AS20 column.
Determination of tetrafluoroborate, perchlorate, and hexafluorophosphate in a simulated electrolyte
sample from lithium ion battery production
For more information click here
0 5 10 15 20 26–0.5
5.0
C
B
A
12
3
Con
duct
ivity
(µS
)
Minutes
Samples: (10,000 times dilution) A. Tetrafluoroborate B. Perchlorate C. Hexafluorophosphate
Peaks: 1. Tetrafluoroborate 9.53 mg/L 2. Perchlorate 9.69 3. Hexafluorophosphate 15.1
27720
Chromatograms of samples (10,000 times dilution).
Assay results for the samples and spiked samples.
Ion
Calculated Concentration after
10,000 Times Dilution (mg/L)
Average Found Concentration
(mg/L)
Recovery (%)
Spiked Concentration(mg/L)
Average Found Concentration in
Spiked Sample (mg/L)
Recovery (%)
Tetrafluoroborate 8.70 9.53 109 2 11.3 88.5
Perchlorate 9.95 9.69 97.4 2 11.8 106
Hexafluorophosphate 14.5 15.1 104 2 16.8 85.0
Overview
Table of contents
Batteries
Tetrafluoroborate, perchlorate, and hexafluorophosphate in simulated battery electrolyte
Manganese in lithium/manganese oxide batteryelectrolyte
Materials
Chemicals
Electronics
Oil and Gas
Biofuels
Power
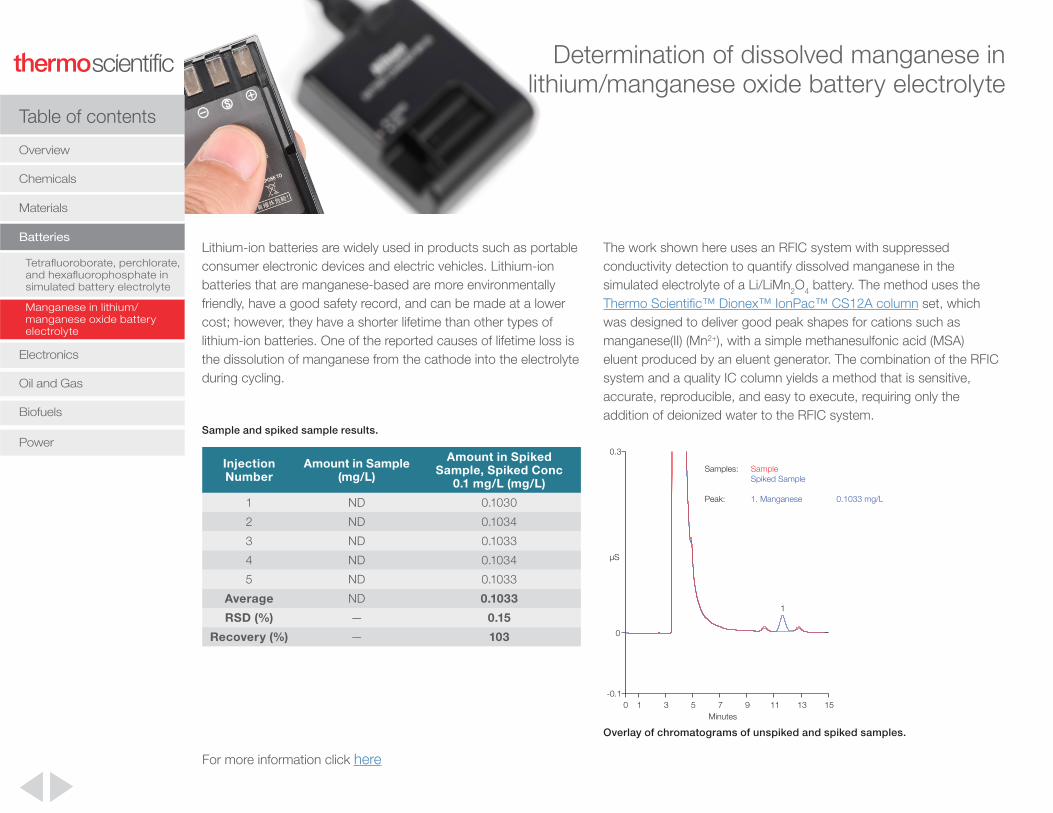
Determination of dissolved manganese in lithium/manganese oxide battery electrolyte
Lithium-ion batteries are widely used in products such as portable consumer electronic devices and electric vehicles. Lithium-ion batteries that are manganese-based are more environmentally friendly, have a good safety record, and can be made at a lower cost; however, they have a shorter lifetime than other types of lithium-ion batteries. One of the reported causes of lifetime loss is the dissolution of manganese from the cathode into the electrolyte during cycling.
For more information click here
Samples: Sample Spiked Sample
Peak: 1. Manganese 0.1033 mg/L
µS
0 1 3 5 7 9 11 13 15-0.1
0
0.3
1
Minutes
Overlay of chromatograms of unspiked and spiked samples.
Sample and spiked sample results.
Injection Number
Amount in Sample (mg/L)
Amount in Spiked Sample, Spiked Conc
0.1 mg/L (mg/L)
1 ND 0.1030
2 ND 0.1034
3 ND 0.1033
4 ND 0.1034
5 ND 0.1033
Average ND 0.1033
RSD (%) — 0.15
Recovery (%) — 103
The work shown here uses an RFIC system with suppressed conductivity detection to quantify dissolved manganese in the simulated electrolyte of a Li/LiMn2O4 battery. The method uses the Thermo Scientific™ Dionex™ IonPac™ CS12A column set, which was designed to deliver good peak shapes for cations such as manganese(II) (Mn2+), with a simple methanesulfonic acid (MSA) eluent produced by an eluent generator. The combination of the RFIC system and a quality IC column yields a method that is sensitive, accurate, reproducible, and easy to execute, requiring only the addition of deionized water to the RFIC system.
Table of contents
Tetrafluoroborate, perchlorate, and hexafluorophosphate in simulated battery electrolyte
Manganese in lithium/manganese oxide batteryelectrolyte
Batteries
Materials
Chemicals
Overview
Electronics
Oil and Gas
Biofuels
Power

ElectronicsIonic contamination is a big concern in all aspects of the electronics
manufacturing process because small amounts of contamination
(parts-per-billion (ppb) to parts-per-million (ppm) concentrations)
can cause corrosion, erosion, electromigration, and shorting. Ion
chromatography is an efficient analytical technique that can quickly
determine both trace and major constituents of a wide variety of
process contaminants, providing a convenient means of quantifying
common inorganic anions and cations.
Overview
Table of contents
Electronics
Batteries
Configuring modular HPIC systems for trace anion determinations
Halogens in polymers and electronics by CIC
Urea in ultrapure water by IC-MS/MS
Materials
Chemicals
Oil and Gas
Biofuels
Power

Comparison of Dionex EWP water and container blanks with 50 ppt trace anions using Thermo Scientific™ Dionex™ AutoPrep™ System small loop.
Anionic contaminants at ppb to ppt levels in water used by the electronics industry during manufacturing can cause corrosion-related failures, poor product quality, low product yields, and shortened product life. Ionic contamination is increasingly important and more challenging as devices decrease in size. Trace level determinations are challenging due to the potential introduction of contaminants from the environment that can occur during sample handling, which elevates the background level of anions, decreasing the limits of detection that can be achieved.
Configuring the Dionex Modular HPIC system with an inline water purifier and inline calibration for trace anion determinations in ultrapure water
Estimated method detection limits.
For more information click here
Analyte Standard (ppt)
Limit of Detection, 3× S/N (ppt)
Fluoride 8.6* 26
Chloride 6.5* 20
Nitrite 8.0* 24
Bromide 50.0** 7
Nitrate 6.2* 19
Sulfate 51.7** 19
Phosphate 53.1** 43
* Estimated concentration in sample containers of a 10 mL sample injection.
** Calibration standard 50 ppt.
2010
Sample: A: EWP system blank; B: Sample blank*C: 50 ppt Standards
Vol.: B: 10 mL for container sample,C: 10 µL for standards
Peaks: 1. System 6. Bromide2. Fluoride 7. Nitrate3. Contamination 8. Carbonate4. Chloride 9. Sulfate5. Nitrite 10. Phosphate
3
45
6
2
µS
7
30Minutes
µS
9 10
00.1
0.50
1
8
A
B
C
* Sample run time includes 21.5 min pre-injection time
In this technical note, automated calibration and the Thermo Scientific™ Dionex™ EWP Electrolytic Water Purifier (EWP) are combined to minimize potential contamination to accurately and reproducibly determine anions at ppt levels using a Thermo Scientific™ Dionex™ IonPac™ AS17C™ column set and KOH electrolytic eluent generation.
Overview
Table of contents
Electronics
Configuring modular HPIC systems for trace anion determinations
Batteries
Materials
Chemicals
Halogens in polymers and electronics by CIC
Urea in ultrapure water by IC-MS/MS
Oil and Gas
Biofuels
Power
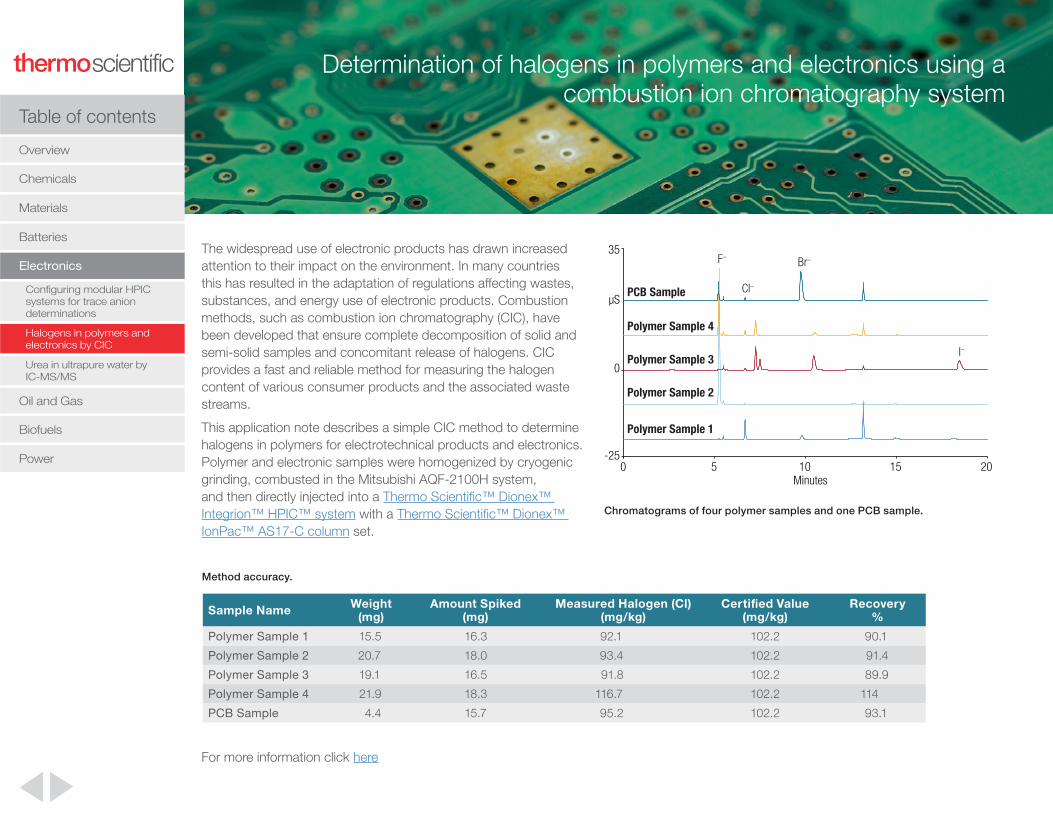
Determination of halogens in polymers and electronics using a combustion ion chromatography system
The widespread use of electronic products has drawn increased attention to their impact on the environment. In many countries this has resulted in the adaptation of regulations affecting wastes, substances, and energy use of electronic products. Combustion methods, such as combustion ion chromatography (CIC), have been developed that ensure complete decomposition of solid and semi-solid samples and concomitant release of halogens. CIC provides a fast and reliable method for measuring the halogen content of various consumer products and the associated waste streams.
This application note describes a simple CIC method to determine halogens in polymers for electrotechnical products and electronics. Polymer and electronic samples were homogenized by cryogenic grinding, combusted in the Mitsubishi AQF-2100H system, and then directly injected into a Thermo Scientific™ Dionex™ Integrion™ HPIC™ system with a Thermo Scientific™ Dionex™ IonPac™ AS17-C column set.
Chromatograms of four polymer samples and one PCB sample.
For more information click here
0 5 10 15 20-25
0
35
Minutes
µS
Polymer Sample 1
Polymer Sample 2
Polymer Sample 3
Polymer Sample 4
PCB Sample
F–
Cl–
Br–
I–
Method accuracy.
Sample Name Weight (mg)
Amount Spiked (mg)
Measured Halogen (Cl) (mg/kg)
Certified Value (mg/kg)
Recovery %
Polymer Sample 1 15.5 16.3 92.1 102.2 90.1
Polymer Sample 2 20.7 18.0 93.4 102.2 91.4
Polymer Sample 3 19.1 16.5 91.8 102.2 89.9
Polymer Sample 4 21.9 18.3 116.7 102.2 114
PCB Sample 4.4 15.7 95.2 102.2 93.1
Table of contents
Configuring modular HPIC systems for trace anion determinations
Halogens in polymers and electronics by CIC
Electronics
Batteries
Materials
Chemicals
Overview
Urea in ultrapure water by IC-MS/MS
Oil and Gas
Biofuels
Power
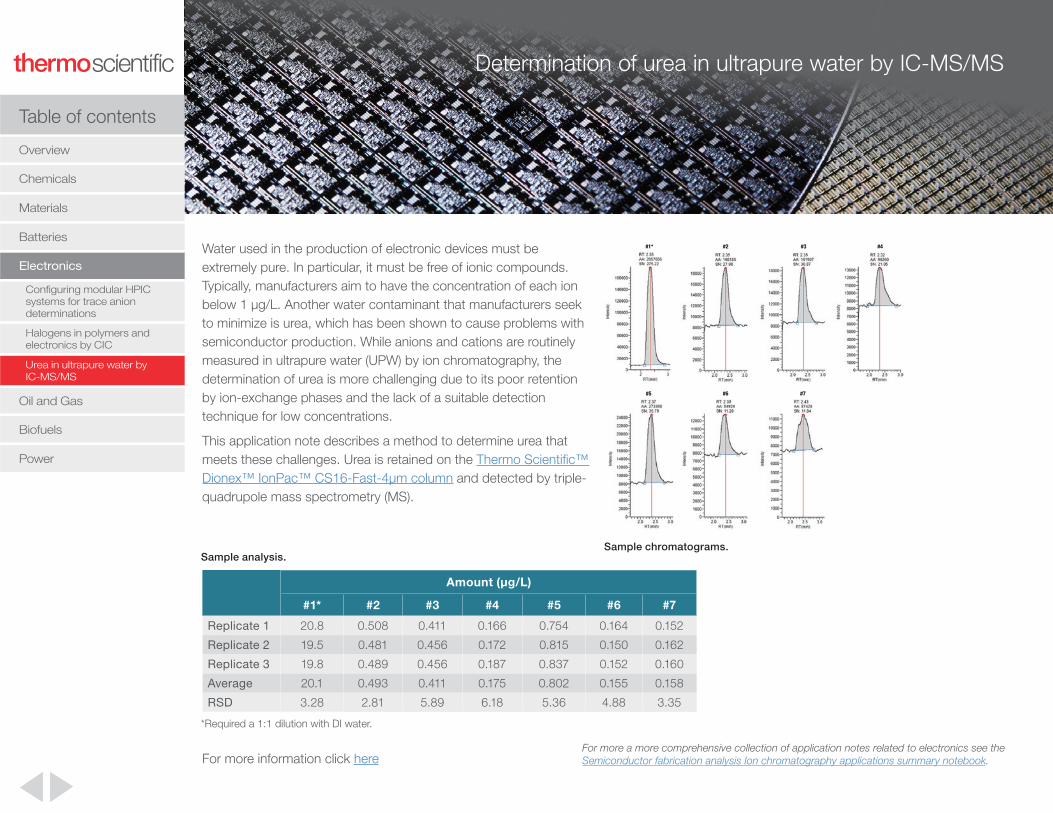
Determination of urea in ultrapure water by IC-MS/MS
Water used in the production of electronic devices must be extremely pure. In particular, it must be free of ionic compounds. Typically, manufacturers aim to have the concentration of each ion below 1 µg/L. Another water contaminant that manufacturers seek to minimize is urea, which has been shown to cause problems with semiconductor production. While anions and cations are routinely measured in ultrapure water (UPW) by ion chromatography, the determination of urea is more challenging due to its poor retention by ion-exchange phases and the lack of a suitable detection technique for low concentrations.
This application note describes a method to determine urea that meets these challenges. Urea is retained on the Thermo Scientific™ Dionex™ IonPac™ CS16-Fast-4µm column and detected by triple-quadrupole mass spectrometry (MS).
For more information click hereFor more a more comprehensive collection of application notes related to electronics see the Semiconductor fabrication analysis Ion chromatography applications summary notebook.
#1*
#6
#4#3#2
#5 #7
Sample chromatograms.Sample analysis.
Amount (μg/L)
#1* #2 #3 #4 #5 #6 #7
Replicate 1 20.8 0.508 0.411 0.166 0.754 0.164 0.152
Replicate 2 19.5 0.481 0.456 0.172 0.815 0.150 0.162
Replicate 3 19.8 0.489 0.456 0.187 0.837 0.152 0.160
Average 20.1 0.493 0.411 0.175 0.802 0.155 0.158
RSD 3.28 2.81 5.89 6.18 5.36 4.88 3.35
*Required a 1:1 dilution with DI water.
Table of contents
Halogens in polymers and electronics by CIC
Urea in ultrapure water by IC-MS/MS
Configuring modular HPIC systems for trace anion determinations
Electronics
Batteries
Materials
Chemicals
Overview
Oil and Gas
Biofuels
Power

Oil and gasAccurate and reliable analytical information at all stages of the oil and gas refining process is critical to meet performance and environmental standards. The presence of organic acids and halogens can result in costly corrosion, while precisely monitoring the amine scrubbing process ensures efficiency and product quality.
Overview
Table of contents
Electronics
Oil and Gas
Formic and acetic acids in petroleum products
IC-MS determination of cations and amines in scrubbing solutions
Fast separation of heat stable salts
Fluorine, chlorine and sulfur in aromatic hydrocarbons by CIC
Alkanolamine in neutralizing amines
Total fluorine, chlorine, bromine, and sulfur in LPG by CIC
Batteries
Materials
Chemicals
Biofuels
Power

Determination of formic and acetic acids in petroleum products by ion chromatography
Organic acids in crude oil, refined products, fuel, etc., are one of the biggest concerns of the oil, oil refining, and combustion engine manufacturers. As a result of their corrosive properties and the associated costs of corrosion, organic acids have become a topic of great industrial interest. To assess the acidity of petroleum products the ‘total acid number’ (TAN), defined by the ASTM as milligrams of KOH required to neutralize one gram of oil or petroleum product, is commonly used. Recently, it was determined that TAN is no longer a reliable indicator as a surrogate parameter. Low molecular weight organic acids are reported as the most aggressively corrosive in the refining process. Ion chromatography can be used for the selective and sensitive determination of low molecular weight organic acids in aqueous or water-miscible matrices.
This application note summarizes the use and evaluation of an automated analytical IC method using the Thermo Scientific™ Dionex™ IonPac™ AS11-HC column for the direct determination of acetic acid and formic acid in diesel, oil, and diesel/oil mixtures, to support research on corrosion processes of industrial production installations and car engines.
For more information click here
Diesel sample taken from a stressed diesel engine (TAN = 0.06).
0.00 2.50 5.00 7.50 10.00 12.00
0.00
1.00
2.00
3.00
4.00
5.00
6.00
7.00
t (min)
Formic Acid
AceticAcid
Diesel: TAN 0.06
κ (µ
S/c
m)
Table of contents
Oil and Gas
Formic and acetic acids in petroleum products
Overview
Electronics
Batteries
Materials
Chemicals
IC-MS determination of cations and amines in scrubbing solutions
Fast separation of heat stable salts
Fluorine, chlorine and sulfur in aromatic hydrocarbons by CIC
Alkanolamine in neutralizing amines
Total fluorine, chlorine, bromine, and sulfur in LPG by CIC
Biofuels
Power
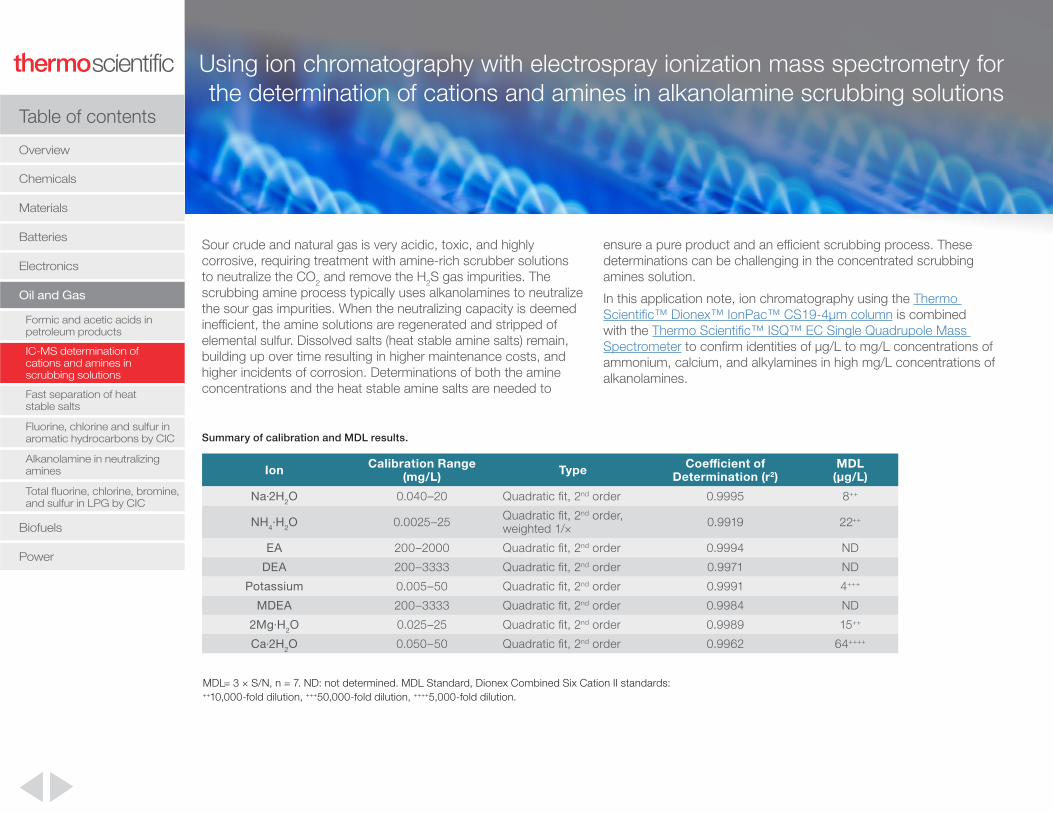
Using ion chromatography with electrospray ionization mass spectrometry for the determination of cations and amines in alkanolamine scrubbing solutions
Sour crude and natural gas is very acidic, toxic, and highly corrosive, requiring treatment with amine-rich scrubber solutions to neutralize the CO2 and remove the H2S gas impurities. The scrubbing amine process typically uses alkanolamines to neutralize the sour gas impurities. When the neutralizing capacity is deemed inefficient, the amine solutions are regenerated and stripped of elemental sulfur. Dissolved salts (heat stable amine salts) remain, building up over time resulting in higher maintenance costs, and higher incidents of corrosion. Determinations of both the amine concentrations and the heat stable amine salts are needed to
ensure a pure product and an efficient scrubbing process. These determinations can be challenging in the concentrated scrubbing amines solution.
In this application note, ion chromatography using the Thermo Scientific™ Dionex™ IonPac™ CS19-4μm column is combined with the Thermo Scientific™ ISQ™ EC Single Quadrupole Mass Spectrometer to confirm identities of μg/L to mg/L concentrations of ammonium, calcium, and alkylamines in high mg/L concentrations of alkanolamines.
Summary of calibration and MDL results.
Ion Calibration Range (mg/L) Type Coefficient of
Determination (r2)MDL
(µg/L)
Na·2H2O 0.040–20 Quadratic fit, 2nd order 0.9995 8++
NH4·H2O 0.0025–25 Quadratic fit, 2nd order, weighted 1/× 0.9919 22++
EA 200–2000 Quadratic fit, 2nd order 0.9994 ND
DEA 200–3333 Quadratic fit, 2nd order 0.9971 ND
Potassium 0.005–50 Quadratic fit, 2nd order 0.9991 4+++
MDEA 200–3333 Quadratic fit, 2nd order 0.9984 ND
2Mg·H2O 0.025–25 Quadratic fit, 2nd order 0.9989 15++
Ca·2H2O 0.050–50 Quadratic fit, 2nd order 0.9962 64++++
MDL= 3 × S/N, n = 7. ND: not determined. MDL Standard, Dionex Combined Six Cation II standards: ++10,000-fold dilution, +++50,000-fold dilution, ++++5,000-fold dilution.
Table of contents
Formic and acetic acids in petroleum products
IC-MS determination of cations and amines in scrubbing solutions
Oil and Gas
Overview
Electronics
Batteries
Materials
Chemicals
Fast separation of heat stable salts
Fluorine, chlorine and sulfur in aromatic hydrocarbons by CIC
Alkanolamine in neutralizing amines
Total fluorine, chlorine, bromine, and sulfur in LPG by CIC
Biofuels
Power
4.9 6.9
18e5
CBA
2
7.84.8
3.0e4
CBA
8.2
1.2e7 4
CBA
5.2
3
5.6 9.5
2.5e7
CBA
Minutes
25
-2
µS/cm
CD
3015 350 5 252010
3
4,5
62
1C
7
BA
8 9
4.5e5 5
5.8 8.8
CBA
1.2e7
4.5 10.5
1.8e5 7
CBA
5.4 9.4
6
CBA
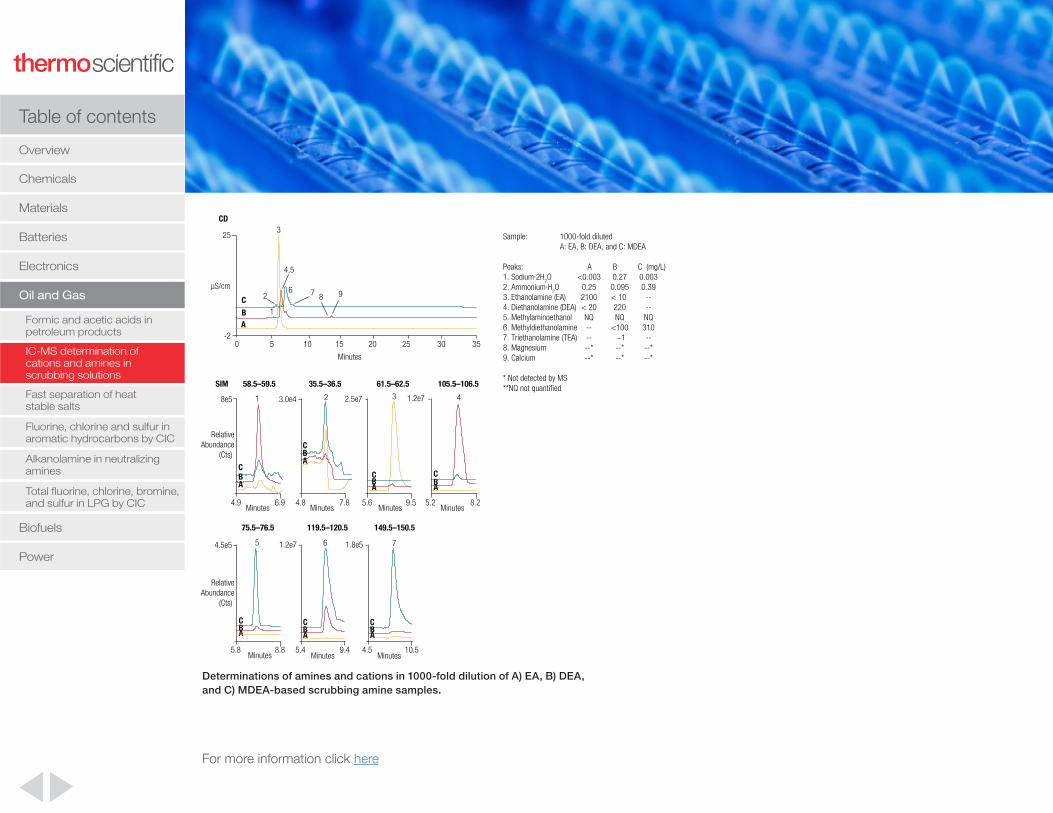
Sample: 1000-fold diluted A: EA, B: DEA, and C: MDEA
Peaks: A B C (mg/L)1. Sodium·2H
2O <0.003 0.27 0.003
2. Ammonium·H2O 0.25 0.095 0.39
3. Ethanolamine (EA) 2100 < 10 --4. Diethanolamine (DEA) < 20 220 --5. Methylaminoethanol NQ NQ NQ 6. Methyldiethanolamine -- <100 3107. Triethanolamine (TEA) -- ~1 --8. Magnesium --* --* --* 9. Calcium --* --* --*
* Not detected by MS**NQ not quanti�ed
MinutesMinutesMinutesMinutes
Minutes MinutesMinutes
58.5–59.5
75.5–76.5
35.5–36.5 61.5–62.5 105.5–106.5
149.5–150.5119.5–120.5
SIM
RelativeAbundance
(Cts)
RelativeAbundance
(Cts)
For more information click here
Determinations of amines and cations in 1000-fold dilution of A) EA, B) DEA, and C) MDEA-based scrubbing amine samples.
Table of contents
Formic and acetic acids in petroleum products
IC-MS determination of cations and amines in scrubbing solutions
Oil and Gas
Overview
Electronics
Batteries
Materials
Chemicals
Fast separation of heat stable salts
Fluorine, chlorine and sulfur in aromatic hydrocarbons by CIC
Alkanolamine in neutralizing amines
Total fluorine, chlorine, bromine, and sulfur in LPG by CIC
Biofuels
Power

-0.25
0
2.00
2.75
1
2
3
4
5 6 7
8
9 1011 12
13
14
µS/cm
RS#1_spiked1
RS#1_spiked2
RS#1_Unspiked
0 5 10 15 20 25 30Minutes
Peaks: 1. Fluoride 6. Bromide 11. Iodide 2. Acetate 7. Nitrate 12. Thiosulfate 3. Formate 8. Carbonate 13. Phosphate 4. Chloride 9. Sulfate 14. Thiocyanate 5. Nitrite 10. Oxalate
Hydrogen sulfide (H2S) and carbon dioxide (CO2) are often found in natural gas streams. These gases are removed using amine-rich solutions before they can be transported or used. However, amine solutions also extract other contaminants during this process, which is also known as the amine sweetening process. The contaminants in the acid gas removal processes are called heat stable salts (HSS). Increased HSS levels lead to corrosion and the resulting operation problems, resulting in unscheduled outages. Thus, it is important to monitor HSS in amine solutions so appropriate action can be taken to control them.
In this application note, a Thermo Scientific™ Dionex™ IonPac™ AS25A column was used to analyze various refinery samples for the presence of common inorganic anions as well as heat stable amine salt anions. The Dionex IonPac AS25A column is optimized to separate bromide and nitrate, which cannot be baseline resolved on a Thermo Scientific™ Dionex™ IonPac™ AS25 column. The Dionex IonPac AS25A column is a high-capacity, hydroxide-selective anion-exchange column ideally suited for determination of sulfur species in wastewater effluents from the chemical and petroleum industries.
Fast separation of heat stable salts
Chromatograms of unspiked and spiked refinery sample (RS) #1 at two levels.
Anion Range (mg/L)
Calibration Type
Coefficient of Determination (r2)
LOD (mg/L)
LOQ (mg/L)
Thiosulfate 0.10–10 Linear 0.99952 0.018 0.061
Thiocyanate 0.20–20 Linear 0.99932 0.016 0.053
Results for calibration, LOD, and LOQ for thiosulfate and thiocyanate.
For more information click here
IC-MS determination of cations and amines in scrubbing solutions
Fast separation of heat stable salts
Table of contents
Formic and acetic acids in petroleum products
Oil and Gas
Overview
Electronics
Batteries
Materials
Chemicals
Fluorine, chlorine and sulfur in aromatic hydrocarbons by CIC
Alkanolamine in neutralizing amines
Total fluorine, chlorine, bromine, and sulfur in LPG by CIC
Biofuels
Power

The total fluorine, chlorine, and sulfur contained in aromatic hydrocarbon matrices can contribute to emissions that cause pollution, be harmful to many catalytic processes, and lead to corrosion. Ion chromatography is a sensitive and versatile method for the determination of halides and sulfate. Application of combustion IC (CIC) has been demonstrated for many applications that determine the total amounts of these elements in samples. CIC has been used to determine potentially corrosive or environmentally damaging halogens and sulfur in complex sample matrices such as intractable solids, semisolids, liquids, and even gasses.
This application note describes determination of fluorine, chlorine, and sulfur in aromatic hydrocarbon samples based on ASTM method D7359-14a. A gasoline sample is used here as an example of an aromatic hydrocarbon sample to demonstrate method capabilities. The CIC system used for this method includes a
Determination of total fluorine, chlorine, and sulfur in aromatic hydrocarbons by oxidative pyrolytic combustion followed by
ion chromatography
Combustion IC chromatogram of a gasoline sample.
For more information click here
0 2.0 4.0 6.0 8.0 10.0 12.0 14.50.200
0.600
µS/c
m
F–
SO4
2–
Cl–
Minutes
Results for the spike recovery experiment (n=3).
Spike Conc. (mg/L)
F Cl SO4
Average Amount (mg/L)
% Recovery
Average Amount
% Recovery
Average Amount (mg/L)
% Recovery
0 (Premium Gasoline) 0.24 – 0.22 – 4.37 –
0.5 0.75 102 0.71 96.5 4.82 91.0
1 1.22 98.0 1.08 85.9 5.30 93.0
2 2.11 93.7 2.03 90.5 6.30 96.3
Mitsubishi Automatic Combustion Unit Model AQF-2100H system and Dionex Integrion HPIC system equipped with the Dionex IonPac AS18-Fast-4µm column set.
Table of contents
Fast separation of heat stable salts
Fluorine, chlorine and sulfur in aromatic hydrocarbons by CIC
IC-MS determination of cations and amines in scrubbing solutions
Formic and acetic acids in petroleum products
Oil and Gas
Overview
Electronics
Batteries
Materials
Chemicals
Alkanolamine in neutralizing amines
Total fluorine, chlorine, bromine, and sulfur in LPG by CIC
Biofuels
Power

Wet natural gas withdrawn from wells using hydraulic fracturing requires additional processing to remove the water, C2 to C5 hydrocarbons, and sometimes hydrogen sulfide (H2S) and carbon dioxide (CO2) before it can be sold. Sour crude natural gas is very acidic, toxic, and highly corrosive, requiring amine gas treatment with amine-rich scrubber solutions to neutralize the CO2 and remove the H2S gas impurities. Amine gas treatment typically uses percent concentrations of alkanolamines to neutralize the sour gas impurities. When the neutralizing capacity is deemed inefficient, the amine solutions are regenerated and stripped of elemental sulfur. Dissolved salts (heat stable amine salts) remain, building up over time and resulting in higher maintenance costs and higher incidents of corrosion. Determinations of both the amine concentrations and the heat stable amine salts are needed to ensure a pure product and an efficient amine gas treatment process. These determinations can be challenging in the concentrated alkanolamine solutions.
This application note demonstrates the separations of μg/L to 25 mg/L concentrations of inorganic cations and ammonium, and μg/L to 1250 mg/L concentrations of alkanolamines in 1000-fold diluted neutralizing amine solution sample on the Thermo Scientific™ Dionex™ IonPac™ CS20 cation-exchange column.
1000-fold diluted TEA-based scrubbing amine sample.
For more information click here
Alkanolamine determinations in neutralizing amines samples with improved separation technology
3
15.5
-0.5
µS/cm
4 5
6
7
2
Minutes3010 3520 0
Peaks: mg/L 1. Sodium 186 2. Ammonium 194 3. EA 28.6 4. DEA 28.2 5. TEA 972 6. Magnesium 20.7 7. Calcium 30.7
Table of contents
Fluorine, chlorine and sulfur in aromatic hydrocarbons by CIC
Alkanolamine in neutralizing amines
Fast separation of heat stable salts
IC-MS determination of cations and amines in scrubbing solutions
Formic and acetic acids in petroleum products
Oil and Gas
Overview
Electronics
Batteries
Materials
Chemicals
Total fluorine, chlorine, bromine, and sulfur in LPG by CIC
Biofuels
Power

For more information click here
Summary of calibration range and MDL results.
Calibration Range (mg/L)
TypeCoefficient of Determination
MDL* (µg/L)
Sodium 0.5–25 Quadratic 0.9997 26
Ammonium 0.5–25 Quadratic 0.9994 160
EA0.5–25
50–1250Quadratic Quadratic
0.9991 0.9998
49 --
DEA0.5–25
50–1250Quadratic Quadratic
0.9997 0.9996
100 --
TEA0.5–25
50–1250Quadratic Quadratic
0.9989 0.9979
100 --
MDEA0.5–25 0–1250
Quadratic Quadratic
0.9993 0.9992
52 --
Magnesium 0.5–25 Quadratic 0.9978 2
Calcium 0.5–25 Quadratic 0.9926 3
*n = 7, MDL = SD × 3.14.
Table of contents
Fluorine, chlorine and sulfur in aromatic hydrocarbons by CIC
Alkanolamine in neutralizing amines
Fast separation of heat stable salts
IC-MS determination of cations and amines in scrubbing solutions
Formic and acetic acids in petroleum products
Oil and Gas
Overview
Electronics
Batteries
Materials
Chemicals
Total fluorine, chlorine, bromine, and sulfur in LPG by CIC
Biofuels
Power

Minutes
3
1
3.0
0.0
µS/cm
6
72 8
45
Peaks: mg/kg 1. Total Fluorine (F) 20.1 2. Formate -- 3. Total Chlorine (Cl) 17.3 4. Total Bromine (Br) 19.7 5. Carbonate -- 6. Total Sulfur (S) 17.5 7. Unknown -- 8. Total Iodine (I) --
0 14105
Heavier components of natural gas, C3-C5 can be compressed and is often pressurized to a liquid state to produce liquefied petroleum gas (LPG). Determinations of halogen and sulfur-containing compounds in LPG are needed because these contaminants can foul the catalysts during processing and cause corrosion. Analysis of LPG hydrocarbons is commonly done by GC-MS; however, the quantification of numerous halogen- and sulfur-containing compounds can be challenging. As with other challenging samples, pyrolytic combustion ion chromatography (CIC) is an ideal approach to eliminate the sample matrix and increase sample homogeneity.
This application note demonstrates the determinations of total halo-benzene compounds and total dimethylsulfide in n-butane LPG as fluoride, chloride, bromide, iodide, and sulfate using pyrohydrolytic combustion coupled with an IC system using a Thermo Scientific™ Dionex™ IonPac™ AS20 column.
Nine incremental combustions of n-butane LPG standard with 2 mg/kg additives with results calculated using the 15–135 mg/kg calibration curve.
Method qualification results showing calibration ranges, linear response, and estimated MDL.
For more information click here
Determination of total fluorine, chlorine, bromine, and sulfur in liquefied petroleum gas by pyrohydrolytic combustion ion chromatography
Compound*Calibration
Range (mg/kg)
TypeCoefficient of Determination
(r2)
MDL using Small Loop Injections
(µg/kg)
Calibration Range
(mg/kg)Type
Coefficient of Determination
(r2)
Total Fluorine as Fluoride 2–18 Quadratic 0.9994 17 15–135 Quadratic 0.9992
Total Chlorine as Chloride 2–18 Linear 0.9990 280 15–135 linear 0.9988
Total Bromine as Bromide 2–18 Linear 0.9995 1000 15–135 linear 0.9996
Total Sulfur as Sulfate 2–18 Linear 0.9991 36 15–135 linear 0.9986
Total Iodine as Iodide* -- -- -- 4000 15–135 linear 0.9986*
*A calibration curve was obtained for total iodine using 50 mg/L peroxide, 1000 mg/L hydrazine absorption solution.
Table of contents
Alkanolamine in neutralizing amines
Total fluorine, chlorine, bromine, and sulfur in LPG by CIC
Fluorine, chlorine and sulfur in aromatic hydrocarbons by CIC
Fast separation of heat stable salts
IC-MS determination of cations and amines in scrubbing solutions
Formic and acetic acids in petroleum products
Oil and Gas
Overview
Electronics
Batteries
Materials
Chemicals
Biofuels
Power
For an overview of the Thermo Fisher Scientific portfolio of products for oil and gas, see Applications Notebook: Oil & Gas Application Notebook – Complete Workflow Solutions: Chromatography, Mass Spectrometry, Molecular Spectroscopy, Lab Data Management Software
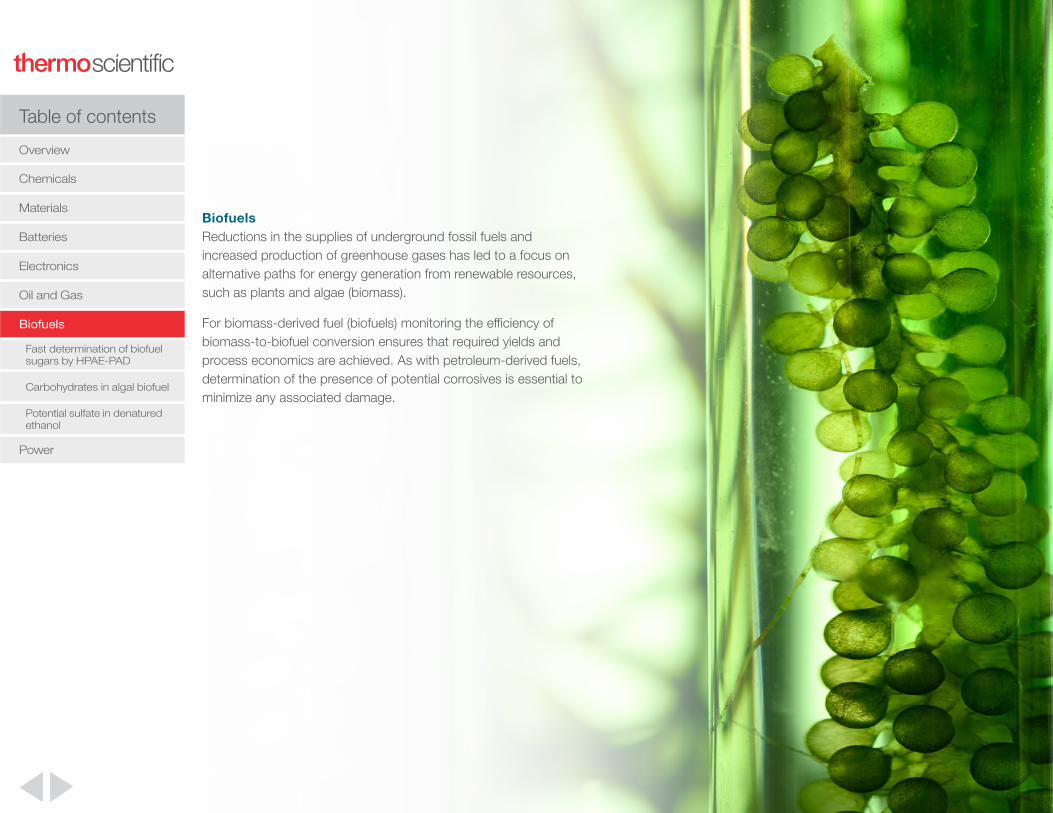
BiofuelsReductions in the supplies of underground fossil fuels and increased production of greenhouse gases has led to a focus on alternative paths for energy generation from renewable resources, such as plants and algae (biomass).
For biomass-derived fuel (biofuels) monitoring the efficiency of biomass-to-biofuel conversion ensures that required yields and process economics are achieved. As with petroleum-derived fuels, determination of the presence of potential corrosives is essential to minimize any associated damage.
Table of contents
Oil and Gas
Overview
Electronics
Batteries
Materials
Chemicals
Biofuels
Power
Fast determination of biofuel sugars by HPAE-PAD
Carbohydrates in algal biofuel
Potential sulfate in denatured ethanol
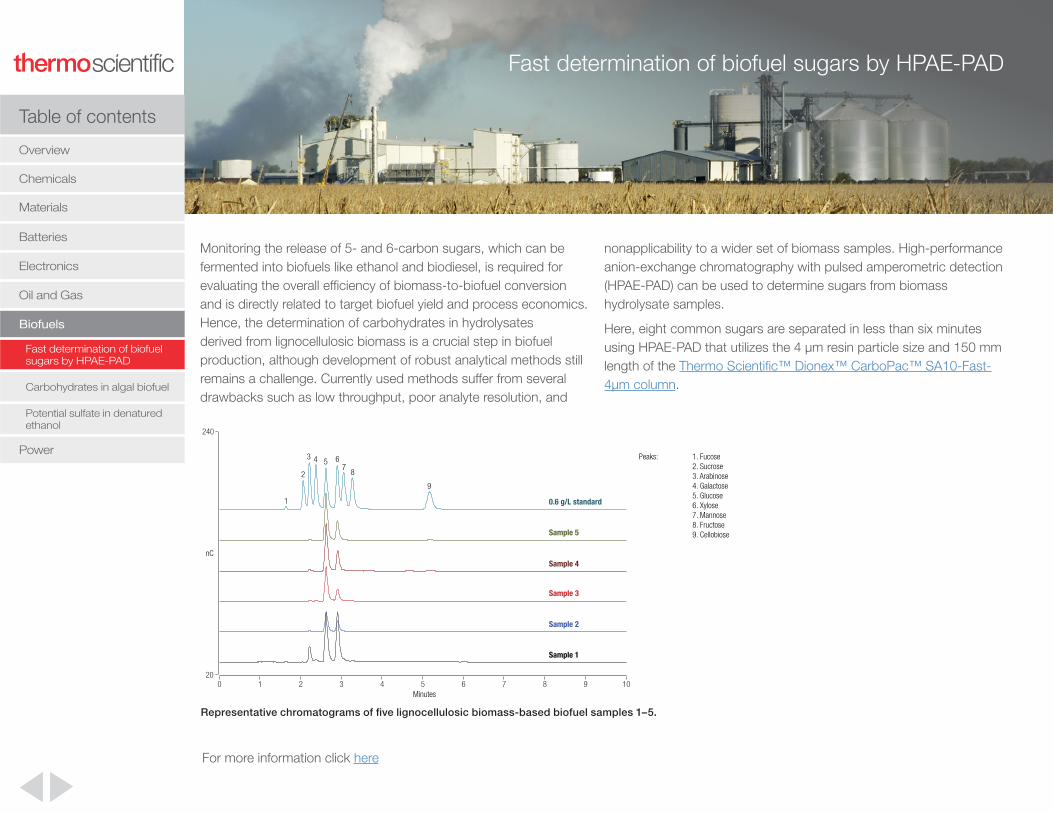
Monitoring the release of 5- and 6-carbon sugars, which can be fermented into biofuels like ethanol and biodiesel, is required for evaluating the overall efficiency of biomass-to-biofuel conversion and is directly related to target biofuel yield and process economics. Hence, the determination of carbohydrates in hydrolysates derived from lignocellulosic biomass is a crucial step in biofuel production, although development of robust analytical methods still remains a challenge. Currently used methods suffer from several drawbacks such as low throughput, poor analyte resolution, and
Representative chromatograms of five lignocellulosic biomass-based biofuel samples 1–5.
For more information click here
Fast determination of biofuel sugars by HPAE-PAD
20
240
1
2
3 4 5 67
8
9
Sample 1
Sample 2
Sample 3
Sample 5
Sample 4
0.6 g/L standard
0 1 2 3 4 5 6 7 8 9 10Minutes
nC
Peaks: 1. Fucose 2. Sucrose 3. Arabinose 4. Galactose 5. Glucose 6. Xylose 7. Mannose 8. Fructose 9. Cellobiose
nonapplicability to a wider set of biomass samples. High-performance anion-exchange chromatography with pulsed amperometric detection (HPAE-PAD) can be used to determine sugars from biomass hydrolysate samples.
Here, eight common sugars are separated in less than six minutes using HPAE-PAD that utilizes the 4 µm resin particle size and 150 mm length of the Thermo Scientific™ Dionex™ CarboPac™ SA10-Fast-4µm column.
Table of contents
Overview
Electronics
Batteries
Materials
Chemicals
Oil and Gas
Biofuels
Power
Fast determination of biofuel sugars by HPAE-PAD
Carbohydrates in algal biofuel
Potential sulfate in denatured ethanol
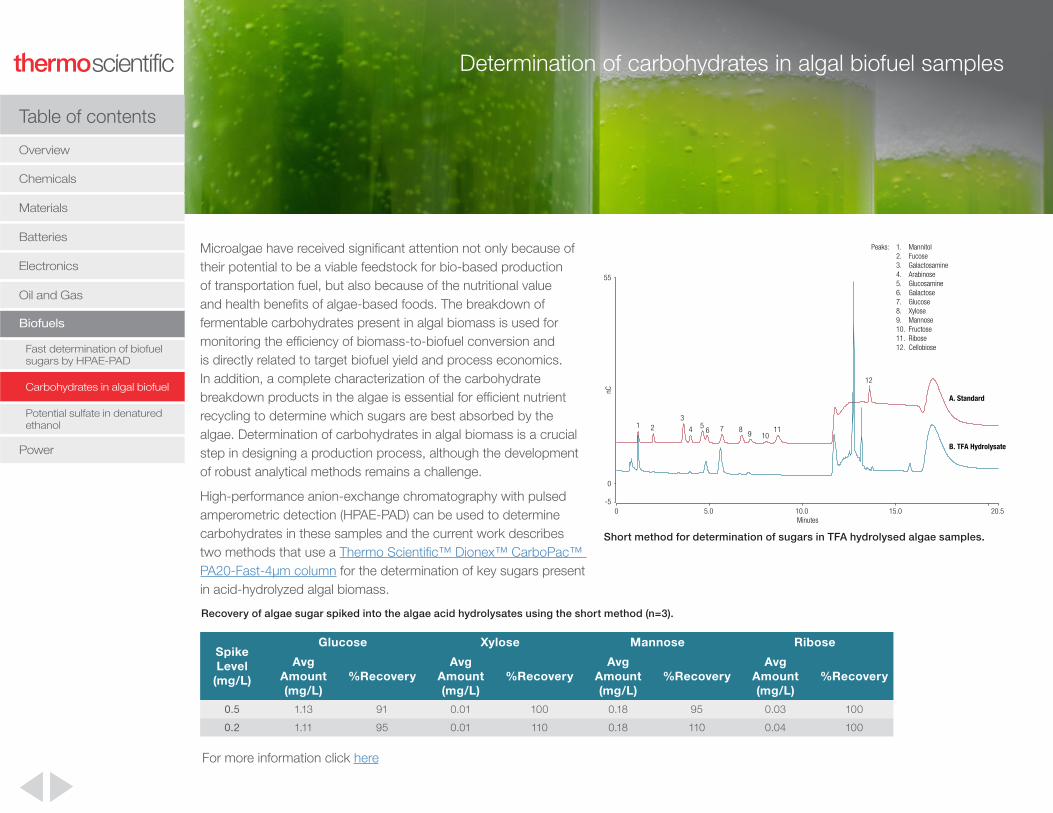
Microalgae have received significant attention not only because of their potential to be a viable feedstock for bio-based production of transportation fuel, but also because of the nutritional value and health benefits of algae-based foods. The breakdown of fermentable carbohydrates present in algal biomass is used for monitoring the efficiency of biomass-to-biofuel conversion and is directly related to target biofuel yield and process economics. In addition, a complete characterization of the carbohydrate breakdown products in the algae is essential for efficient nutrient recycling to determine which sugars are best absorbed by the algae. Determination of carbohydrates in algal biomass is a crucial step in designing a production process, although the development of robust analytical methods remains a challenge.
High-performance anion-exchange chromatography with pulsed amperometric detection (HPAE-PAD) can be used to determine carbohydrates in these samples and the current work describes two methods that use a Thermo Scientific™ Dionex™ CarboPac™ PA20-Fast-4μm column for the determination of key sugars present in acid-hydrolyzed algal biomass.
Short method for determination of sugars in TFA hydrolysed algae samples.
For more information click here
Determination of carbohydrates in algal biofuel samples
1 4 5 6 2
3
B. TFA Hydrolysate
7 11 8 9 10
12
A. Standard
Minutes
nC
10.0 20.5 15.0 5.0 0 -5
0
55
Peaks: 1. Mannitol 2. Fucose 3. Galactosamine 4. Arabinose 5. Glucosamine 6. Galactose 7. Glucose 8. Xylose 9. Mannose 10. Fructose 11. Ribose 12. Cellobiose
Recovery of algae sugar spiked into the algae acid hydrolysates using the short method (n=3).
Spike Level
(mg/L)
Glucose Xylose Mannose Ribose
Avg Amount (mg/L)
%RecoveryAvg
Amount (mg/L)
%RecoveryAvg
Amount (mg/L)
%RecoveryAvg
Amount (mg/L)
%Recovery
0.5 1.13 91 0.01 100 0.18 95 0.03 100
0.2 1.11 95 0.01 110 0.18 110 0.04 100
Table of contents
Overview
Electronics
Batteries
Materials
Chemicals
Biofuels
Power
Fast determination of biofuel sugars by HPAE-PAD
Carbohydrates in algal biofuel
Potential sulfate in denatured ethanol
Oil and Gas
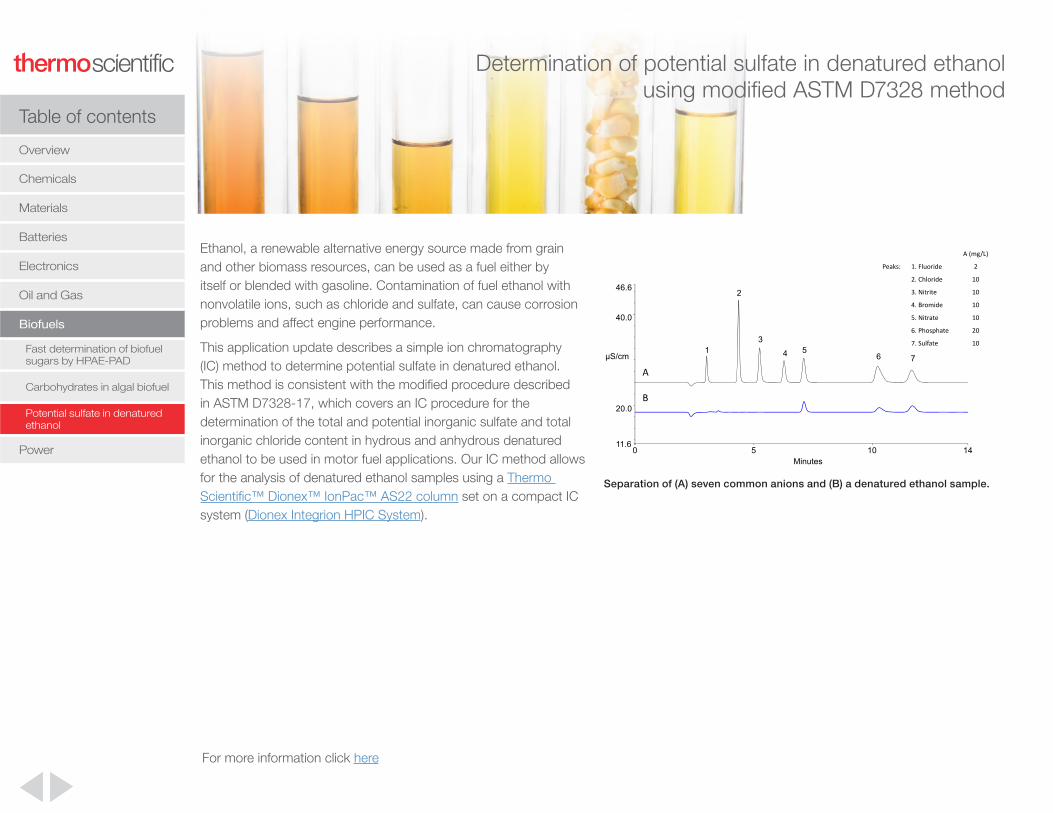
Ethanol, a renewable alternative energy source made from grain and other biomass resources, can be used as a fuel either by itself or blended with gasoline. Contamination of fuel ethanol with nonvolatile ions, such as chloride and sulfate, can cause corrosion problems and affect engine performance.
This application update describes a simple ion chromatography (IC) method to determine potential sulfate in denatured ethanol. This method is consistent with the modified procedure described in ASTM D7328-17, which covers an IC procedure for the determination of the total and potential inorganic sulfate and total inorganic chloride content in hydrous and anhydrous denatured ethanol to be used in motor fuel applications. Our IC method allows for the analysis of denatured ethanol samples using a Thermo Scientific™ Dionex™ IonPac™ AS22 column set on a compact IC system (Dionex Integrion HPIC System).
Separation of (A) seven common anions and (B) a denatured ethanol sample.
For more information click here
Determination of potential sulfate in denatured ethanol using modified ASTM D7328 method
0 5 10 1411.6
20.0
40.0
46.6
µS/cm
Minutes
1
2
3
4 56 7
A
B
A (mg/L)
Peaks: 1. Fluoride 2
2. Chloride 10
3. Nitrite 10
4. Bromide 10
5. Nitrate 10
6. Phosphate 20
7. Sulfate 10
Table of contents
Overview
Electronics
Batteries
Materials
Chemicals
Biofuels
Power
Fast determination of biofuel sugars by HPAE-PAD
Carbohydrates in algal biofuel
Potential sulfate in denatured ethanol
Oil and Gas

PowerThe ionic purity of boiler water, feedwater, borated water, and steam is important to maintain component reliability, safety, and the overall economic viability of nuclear power plant (NPP) and fossil fuel power plant (FFPP) operation. Failure mechanisms in the boiler, turbine, heaters, and condensers of power plants can be directly related to water and steam ionic purity. By understanding the ionic contamination levels for water and steam contaminants that are determined by IC, utilities and operators can eliminate or reduce damage from corrosion, scaling, and deposition. For additional corrosion protection, organic amines are commonly added to plant waters and monitoring their presence in wastewater, along with degradation products, is critical to ensure compliance with regulatory discharge limits.
Overview
Table of contents
Chemicals
Electronics
Materials
Batteries
Power
Trace sodium and transition metals in power industry samples
Determination of morpholine, ethanolamine, and hydraine in power plant wastewater
Oil and Gas
Biofuels

It is critical for power plants to continuously monitor corrosive ionic impurities in various plant water streams. Corrosive contaminants—particularly sodium, chloride, and sulfate—have been implicated as a major source of corrosion and deposition-related plant shutdowns in nuclear and fossil-fueled plants. Ion chromatography (IC) can measure these contaminants and has been implemented in several U.S. power plant water chemistry monitoring programs. The measurement of ultratrace levels of sodium in boiler waters treated with amine additives, such as ethanolamine, is a particularly challenging analytical problem. Nuclear and fossil-fueled power plants also require the monitoring of various metals that can also play a role in corrosion. Although suppressed and nonsuppressed conductivity can be used for the detection of alkali and alkaline earth metals, only nonsuppressed conductivity is suitable for the detection of transition metals.
This application note compares suppressed to nonsuppressed conductivity detection for the determination of sub-ppb concentrations of sodium in simulated power plant matrices using the Thermo Scientific™ Dionex™ IonPac™ SCS 1 column. In addition, this application note describes the determination of transition metals by nonsuppressed conductivity detection.
Determination of trace sodium and transition metals in power industry samples by ion chromatography with nonsuppressed conductivity detection
Peaks: A 1. Ammonium — µg/L (ppb) 2. Ethanolamine 3000
B 1. Sodium 0.25 µg/L (ppb)2. Ammonium —3. Ethanolamine 3000
–1,076.50
µS
–1,079.00
0Minutes
10
1
2
155
–1,079.00
µS
–1,082.50
0Minutes
10
12
3
155
A
B
A representative chromatogram of 3000 μg/L ethanolamine spiked with (A) no sodium, and (B) 0.25 μg/L sodium.
Trace sodium and transition metals in power industry samples
Overview
Table of contents
Chemicals
Electronics
Materials
Batteries
Power
Determination of morpholine, ethanolamine, and hydraine in power plant wastewater
Oil and Gas
Biofuels
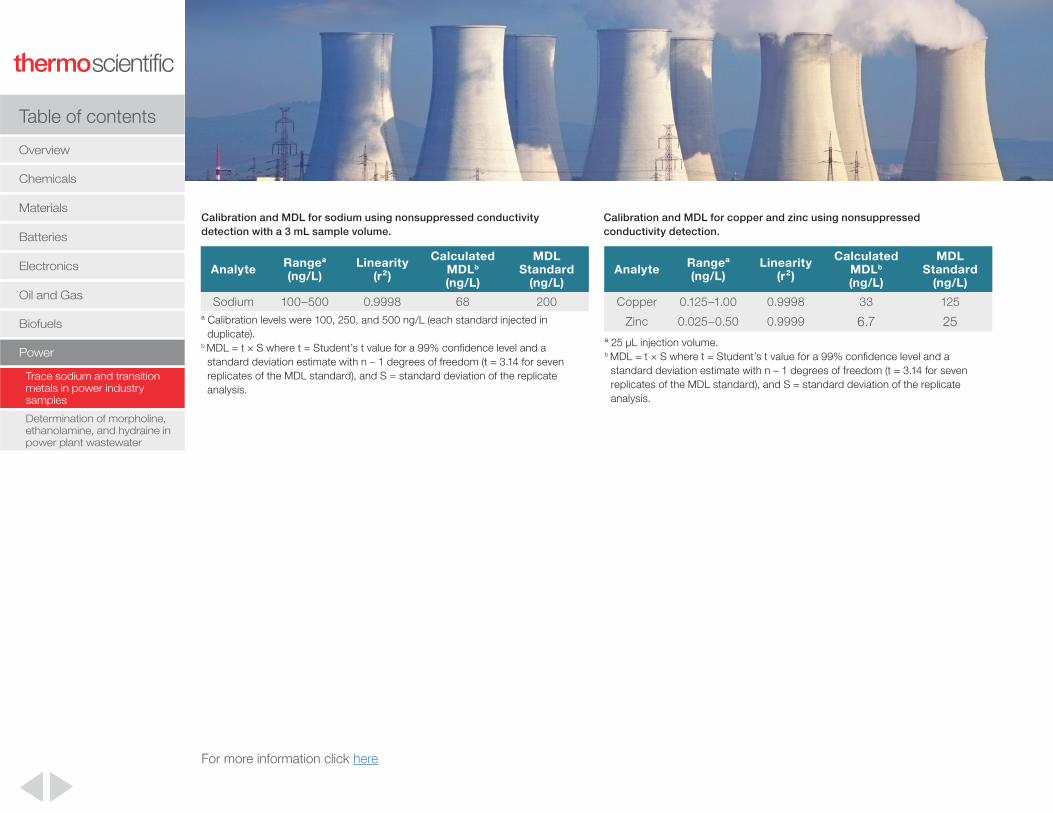
Calibration and MDL for sodium using nonsuppressed conductivity detection with a 3 mL sample volume.
Calibration and MDL for copper and zinc using nonsuppressedconductivity detection.
Analyte Rangeª(ng/L)
Linearity(r²)
CalculatedMDLb
(ng/L)
MDLStandard
(ng/L)
Sodium 100–500 0.9998 68 200ª Calibration levels were 100, 250, and 500 ng/L (each standard injected in
duplicate).b MDL = t × S where t = Student’s t value for a 99% confidence level and a
standard deviation estimate with n – 1 degrees of freedom (t = 3.14 for seven replicates of the MDL standard), and S = standard deviation of the replicate analysis.
Analyte Rangeª(ng/L)
Linearity(r²)
CalculatedMDLb
(ng/L)
MDLStandard
(ng/L)
Copper 0.125–1.00 0.9998 33 125
Zinc 0.025–0.50 0.9999 6.7 25ª 25 μL injection volume.b MDL = t × S where t = Student’s t value for a 99% confidence level and a
standard deviation estimate with n – 1 degrees of freedom (t = 3.14 for seven replicates of the MDL standard), and S = standard deviation of the replicate analysis.
For more information click here
Trace sodium and transition metals in power industry samples
Overview
Table of contents
Chemicals
Electronics
Materials
Batteries
Power
Determination of morpholine, ethanolamine, and hydraine in power plant wastewater
Oil and Gas
Biofuels

Trace sodium and transition metals in power industry samples
Table of contents
Determination of morpholine, ethanolamine, and hydraine in power plant wastewater
Nuclear power plant (NPP) wastewater can contain high salt content from periodic flushes of the boiler (blowout) to remove salt buildup (i.e., scale). The determination of morpholine, ethanolamine (ETA), and hydrazine in the presence of mg/L concentrations of ammonium is an analytical challenge due to their similar selectivity on cation-exchange phases and the presence of higher concentrations of ammonium and other common cations. These challenges were met by optimizing one method to determine both hydrazine and morpholine and a second method to determine ETA.
This application note describes two methods to determine μg/L concentrations of hydrazine, morpholine, and ETA in disparately larger concentrations of ammonium and other cations in a simulated NPP wastewater sample. Hydrazine and morpholine were determined in the simulated NPP wastewater matrix on the Thermo Scientific™ Dionex™ IonPac CS16 column by suppressed conductivity detection and integrated pulsed amperometric detection (IPAD). Ethanolamine is separated by cation-exchange chromatography on the Thermo Scientific™ Dionex™ IonPac CS15 column with suppressed conductivity detection using the column’s selectivity to elute ethanolamine before ammonium.
Determination of morpholine, ethanolamine, and hydrazine in simulated nuclear power plant wastewater
Peaks: 1. Lithium 1000 µg/L 2. Sodium 50,000 3. Ammonium 50,000 4. Ethanolamine 150 5. Hydrazine 20 6. Potassium 10,000 7. Morpholine 200 8. Magnesium 50,000 9. Calcium 50,000
0 15 3284
120
Minutes
nC
0.5
120
µS
3
4
5 7
1 2 3,4,5 6 8 9
7
B
A
Comparison of hydrazine and morpholine in a simulated NPP wastewater matrix by A) suppressed conductivity detection and B) IPAD.
Overview
Chemicals
Electronics
Materials
Batteries
Power
Oil and Gas
Biofuels

Find out more at www.thermofisher.com/IC
For Research Use Only. Not for use in diagnostic procedures. ©2020 Thermo Fisher Scientific Inc. All rights reserved. AddaVax and related products are trademarked and owned by InviviGen. ABISCO-100 and related products are trademarked and owned by ISCONOVA. Mitsubishi related products are trademarked and owned by Mitsubishi Corporation. All other trademarks are the property of Thermo Fisher Scientific and its subsidiaries unless otherwise specified. This information is presented as an example of the capabilities of Thermo Fisher Scientific Inc. products. It is not intended to encourage use of these products in any manners that might infringe the intellectual property rights of others. Specifications, terms and pricing are subject to change. Not all products are available in all locations. Please consult your local sales representative for details. AI73313-EN 0420S
Precisions and accuracies of amine determinations in a simulated NPP wastewater matrixª.
Analyte RetentionTime RSD
PeakArea RSD
AmountAdded(μg/L)
AverageRecovery
(%)
Hydrazineb 0.05 1.9 20 109.0
Morpholineb 0.08 2.9 200 97.2
Ethanolaminec 0.43 1.8 200 101.7
ª The simulated NPP wastewater matrix contains 1 mg/L lithium, 10 mg/L potassium, and 50 mg/L each of sodium, ammonium, calcium, and magnesium.
b The precision and recoveries of hydrazine and morpholine are determined in 100% of the simulated NPP wastewater matrix.
c The precision and recovery of ethanolamine are determined in 80% of the simulated NPP wastewater matrix.
For more information click here
For more a more comprehensive collection of power application notes see: Power Plant Water Applications Summary Notebook
Table of contents
Overview
Chemicals
Electronics
Materials
Batteries
Trace sodium and transition metals in power industry samples
Determination of morpholine, ethanolamine, and hydraine in power plant wastewater
Power
Oil and Gas
Biofuels