induction of micrornas mir-155, mir-222, mir-424 and mir ...in haematopoiesis including mir-424...
TRANSCRIPT
- 1 -
Induction of microRNAs mir-155, mir-222, mir-424 and
mir-503, promotes monocytic differentiation through
combinatorial regulation.
Alistair R. R. Forrest*1,2, Mutsumi Kanamori-Katayama1,
Yasuhiro Tomaru1, Timo Lassmann1, Noriko Ninomiya1, Yukari
Takahashi1, Michiel J. L. de Hoon1, Atsutaka Kubosaki1, Ai
Kaiho1, Masanori Suzuki1, Jun Yasuda1, Jun Kawai1,
Yoshihide Hayashizaki1, David A. Hume3, Harukazu Suzuki1
1Omics Science Center, RIKEN Yokohama Institute, 1-7-22, Suehiro-cho, Tsurumi-
ku, Yokohama,230-0045, Japan
2The Eskitis Institute for Cell and Molecular Therapies, Griffith University, Brisbane,
QLD 4111, Australia.
3The Roslin Institute and Royal (Dick) School of Veterinary Studies, The University
of Edinburgh, Roslin, EH259PS, UK.
Corresponding Author: Dr Alistair Forrest, Omics Science Center, RIKEN
Yokohama Institute, 1-7-22 Suehiro-cho, Tsurumi-ku, Yokohama, Kanagawa 230-
0045 Japan. Fax: +81-45-503-9216; Tel:+81-45-503-9222; Email:
Keywords: microRNA, acute myeloid leukemia, AML, monocyte, differentiation,
microarray, bioinformatics, gene expression profiling

- 2 -
Abstract
Acute myeloid leukemia (AML) involves a block in terminal differentiation of
the myeloid lineage and uncontrolled proliferation of a progenitor state. Using
phorbol myristate acetate it is possible to overcome this block in THP-1 cells (a
M5-AML containing the MLL-MLLT3 fusion), resulting in differentiation to an
adherent monocytic phenotype. As part of FANTOM4 we used microarrays to
identify 23 microRNAs that are regulated by PMA. We identify four PMA
induced microRNAs (mir-155, mir-222, mir-424 and mir-503) that when over-
expressed cause cell cycle arrest and partial differentiation and when used in
combination induce additional changes not seen by any individual microRNA.
We further characterise these pro-differentiative microRNAs and show that mir-
155 and mir-222 induce G2 arrest and apoptosis respectively. We find mir-424
and mir-503 are derived from a polycistronic precursor mir-424-503 that is
under repression by the MLL-MLLT3 leukemogenic fusion. Both of these
microRNAs directly target cell cycle regulators and induce G1 cell cycle arrest
when over-expressed in THP-1. We also find that the pro-differentiative mir-424
and mir-503 down-regulate the anti-differentiative mir-9 by targeting a site in its
primary transcript. Our study highlights the combinatorial effects of multiple
microRNAs within cellular systems.
- 3 -
Introduction
The FANTOM4 (Functional ANnoTation Of Mammals) project used a combination
of deep sequencing, microarrays, bioinformatic predictions and siRNA perturbations
to map a network of mammalian transcription factors and their targets (1). For this
project we studied monocytic differentiation of the M5 acute myeloid leukemia
(AML) cell line THP-1 (2). This cell line contains the MLL-MLLT3 leukemogenic
gene fusion (3) and displays a monoblastic phenotype, however upon phorbol
myristate acetate (PMA) treatment it differentiates into an adherent monocytic
phenotype (4), closely approximating monoblast to monocyte differentiation.
In this parallel study we monitored the expression dynamics of microRNAs after
PMA treatment and sought to identify those that might promote differentiation.
MicroRNAs are short 21-22 nucleotide RNA molecules which cause translational
repression and degradation of multiple messenger RNAs by binding target sequences
in their 3’ UTRs (5). Multiple microRNAs are implicated in differentiation of cell
lineages including skeletal muscle, adipocytes and neurons (6-8) and in mammals, the
microRNA sub-system is essential for embryonic development. Dicer is required for
differentiation of embryonic stem cells (9), Dicer (-/-) knockouts are embryonic lethal
(10) and Ago2 (-/-) knockouts suffer severe haematopoietic defects (11). In addition
several microRNAs are deleted or amplified in cancer and have been implicated as
tumour suppressors (12, 13) or oncogenic (14, 15).
In this study we find multiple microRNAs are induced upon PMA treatment and that
four of these can promote both partial monocytic differentiation and cell cycle arrest

- 4 -
in over-expression experiments. Our data suggests a model whereby multiple
microRNAs are induced in conjunction with various transcription factors to co-
operatively promote differentiation and inhibit cellular proliferation at multiple points
in the cell cycle.
Materials and methods
The details of this section are available online as Supplementary Information.
Results
Multiple microRNAs are induced during PMA induced THP-1 differentiation.
The expression patterns of microRNAs during PMA induced THP-1 differentiation
were determined using Agilent microRNA arrays on biological triplicate time-
courses. The expression profile for each microRNA after PMA treatment is available
through the FANTOM4 EdgeExpress Database (16). Between undifferentiated (0h)
and differentiated (96h) states we identified 21 microRNAs that were up-regulated
and 2 that were down-regulated with average expression changes of at least 3 fold
(Table 1). Of the up-regulated microRNAs, several have been previously implicated
in haematopoiesis including mir-424 which promotes monocytopoiesis (17), mir-221,
mir-222 and mir-24 which inhibit eryrthopoiesis (18, 19) and mir-155 which promotes
B-cell proliferation and depletes myeloid and erythroid hematopoietic stem cell
populations (20, 21). Of the two down-regulated microRNAs, mir-210 promotes
osteoblast differentiation (22) and mir-9 blocks B-cell differentiation by targeting
PRDM1 (23). We note that although detected in THP1 the mir-17-92 polycistron
previously reported to prevent monocytic differentiation by repression of AML1 (24)
- 5 -
is not significantly down-regulated suggesting our cells are at a different stage of
differentiation.
Deep-sequencing of small RNAs from one of the three THP-1 biological replicates
time-courses (25) confirmed the differential expression of microRNAs detected by the
arrays. Fold change estimates by the two technologies varied (eg. mir-221 was
induced 5.7 fold on the arrays but 10.9 fold by sequencing) but repression or
induction was consistent. We also estimated microRNA abundances from the
sequencing and found mir-221 the most abundant inducible microRNA in THP-1
accounting for 11% of all tags at 96h (106251 tags per million).
MicroRNAs 155, 222, 424 and 503 partially promote monocytic differentiation
A set of 11 PMA regulated microRNAs (10 induced and 1 repressed) with a wide
range of abundances (eg. mir-146b – 23 tpm, mir-221 – 106251 tpm) were selected
for further studies. Synthetic microRNA precursors were transfected into
undifferentiated THP-1 cells and the effect on gene expression measured after 48hrs
using Illumina Sentrix6v2 whole genome microarrays. Significant expression changes
were determined by B-statistic comparison (26) against the effect of a scrambled
negative control duplex RNA (B-statistic ≥ 2.5 and fold change ≥ 2) (Supplementary
table 1). Lists of up and down-regulated mRNAs were then compared to PMA
regulated mRNAs identified in the FANTOM4 data (1) to identify microRNAs that
promote differentiation. Expression changes induced by the microRNA over-
expressions could be then split into PMA-like (pro-differentiative) changes, unrelated
changes and anti-PMA-like (anti-differentiative) changes.

- 6 -
MicroRNAs were considered pro-differentiative if 1) there were more PMA-like
changes than anti-PMA-like changes (at least 1.5x) and 2) for the given microRNA
the fraction of all changes that were PMA-like was greater than the average fraction
plus one standard deviation (Supplementary Table 2). None of the microRNAs
completely reiterated the expression changes observed with PMA, and no
morphological differences were observed, however using the above criteria mir-155,
mir-222, mir-424 and mir-503 induced expression changes suggesting partial
differentiation including induction of known markers of differentiation ITGAL
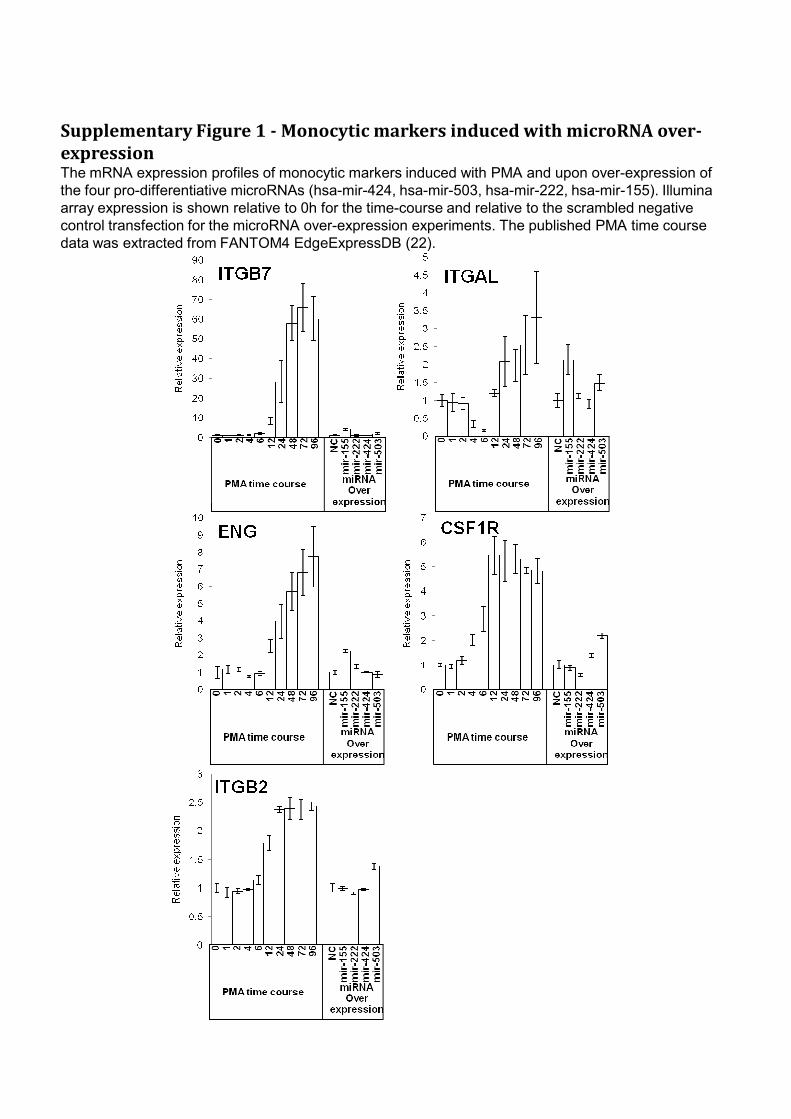
(Cd11a), ITGB7 and ENG (Cd105) by mir-155 and ITGAL, ITGB2 and CSF1R by
mir-503 (Supplementary Fig. 1). Mir-155 and mir-503 had the greatest ratio of PMA-
like to anti-PMA-like changes (2.9x) and mir-503 also had the greatest number of
PMA-like changes in total (75 down, 35 up). As a comparison the additional negative
control microRNA (mir-142 – expressed in THP-1 but not regulated by PMA) failed
to induce pro-differentiative expression changes and had a differentiation ratio of
0.3x.
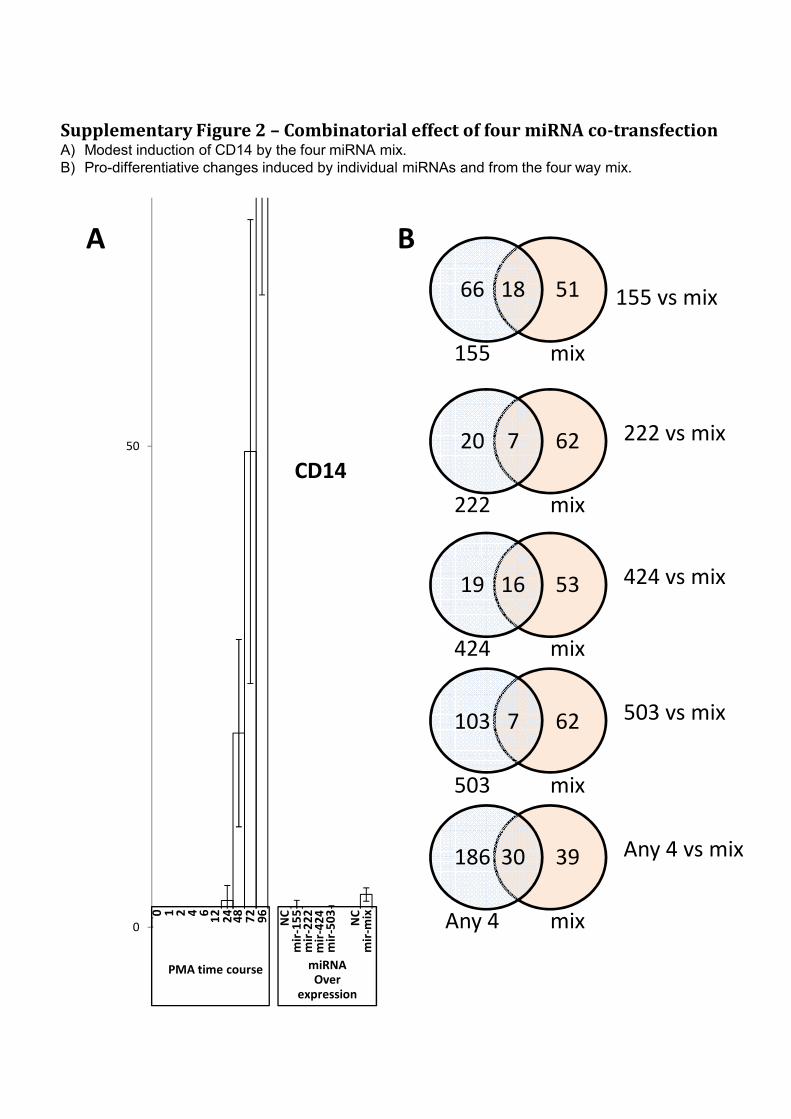
The combined effect of the four microRNAs was then tested by co-over-expressing
mir-155, mir-222, mir-424 and mir-503 in equimolar amounts in THP-1 for 48hrs.
The mixture induced 69 pro-differentiative changes, 39 of which were not observed in
any of the four individual pre-miRNA transfections (including modest induction of
the key monocytic marker CD14 - supplementary figure 2). One quarter of all changes
induced by the mixture were PMA like and the ratio of PMA-like to anti-PMA-like
changes was 6.3x, far larger than observed for any of the individual miRNA
transfections (Supplementary Table 2). Together this suggests that the mixture more

- 7 -
closely mimics the PMA induced expression changes by reducing the non-specific
and anti-PMA-like changes and increasing the PMA-like changes.
Finally we also identify mir-9 as an anti-differentiative miRNA using this analysis.
36% of the genes down-regulated by mir-9 over-expression are normally up-regulated
with PMA and 26% of all expression changes for mir-9 were anti-differentiative
suggesting it helps maintain the undifferentiated monoblast state similar to its role in
blocking B-cell differentiation (23).
mir-424-503 is a polycistronic microRNA cluster that promotes differentiation
and G1 arrest of the cell cycle.
Gene ontology analysis (27) of genes affected by the pro-differentiative microRNAs
revealed that both mir-424 and mir-503 down-regulate genes annotated as cell-cycle
regulators (Table 2 and supplementary table 3). This is consistent with a report that
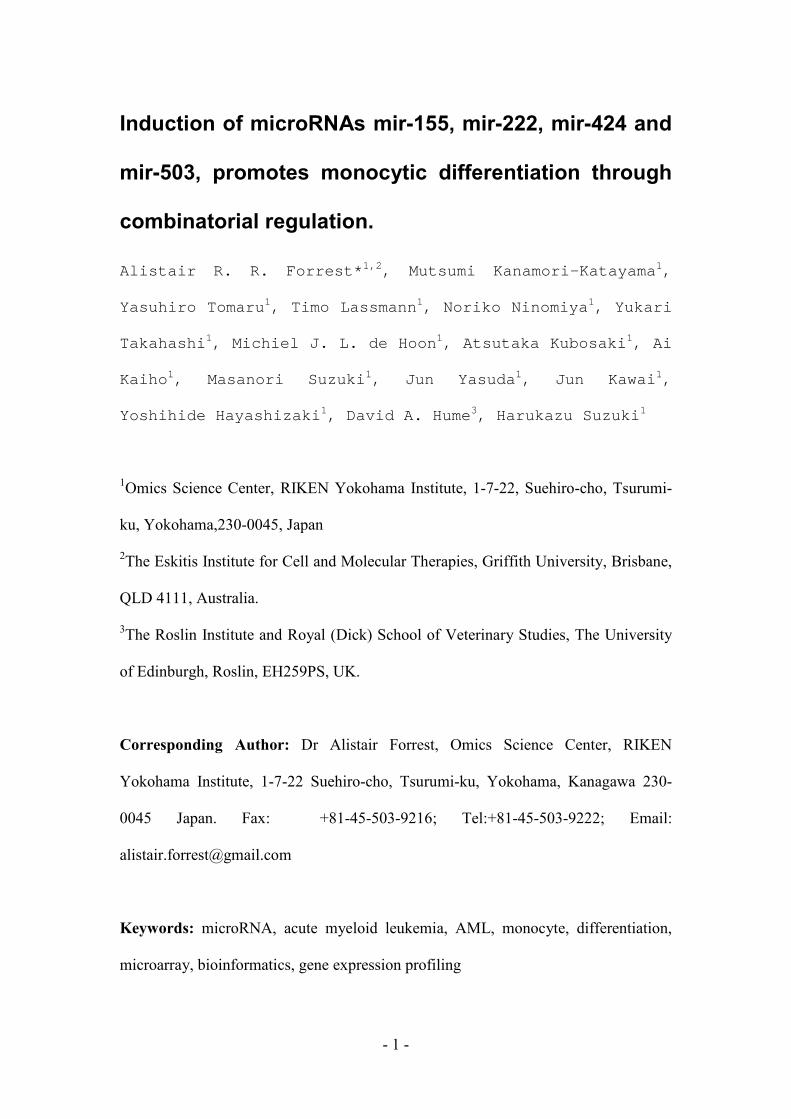
mir-424 over-expression can induce G1 arrest of the cell cycle (28). We confirmed
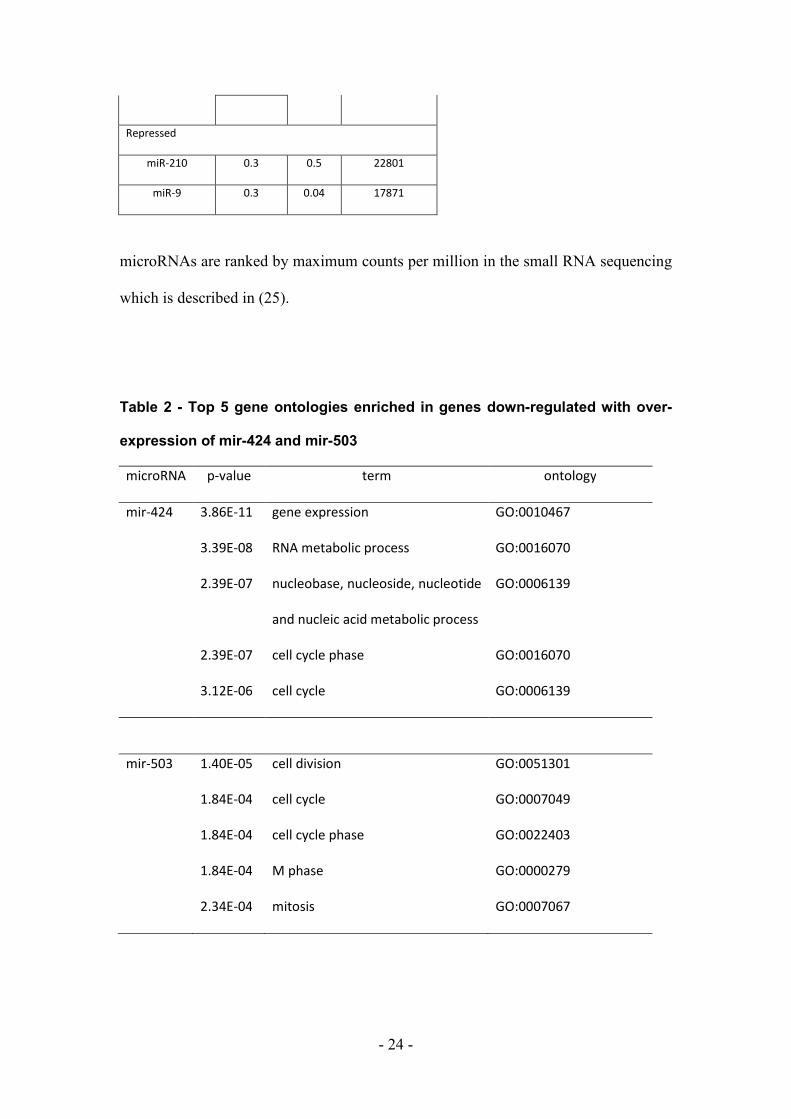
this in THP-1 cells using flow cytometry and also show that mir-503 induces G1
arrest to similar levels as mir-424 (Fig. 1). In addition we find mir-222 induces a G2
accumulation, while mir-155 was depleted for G2 with accumulation of a sub-G1
population, suggesting apoptosis.
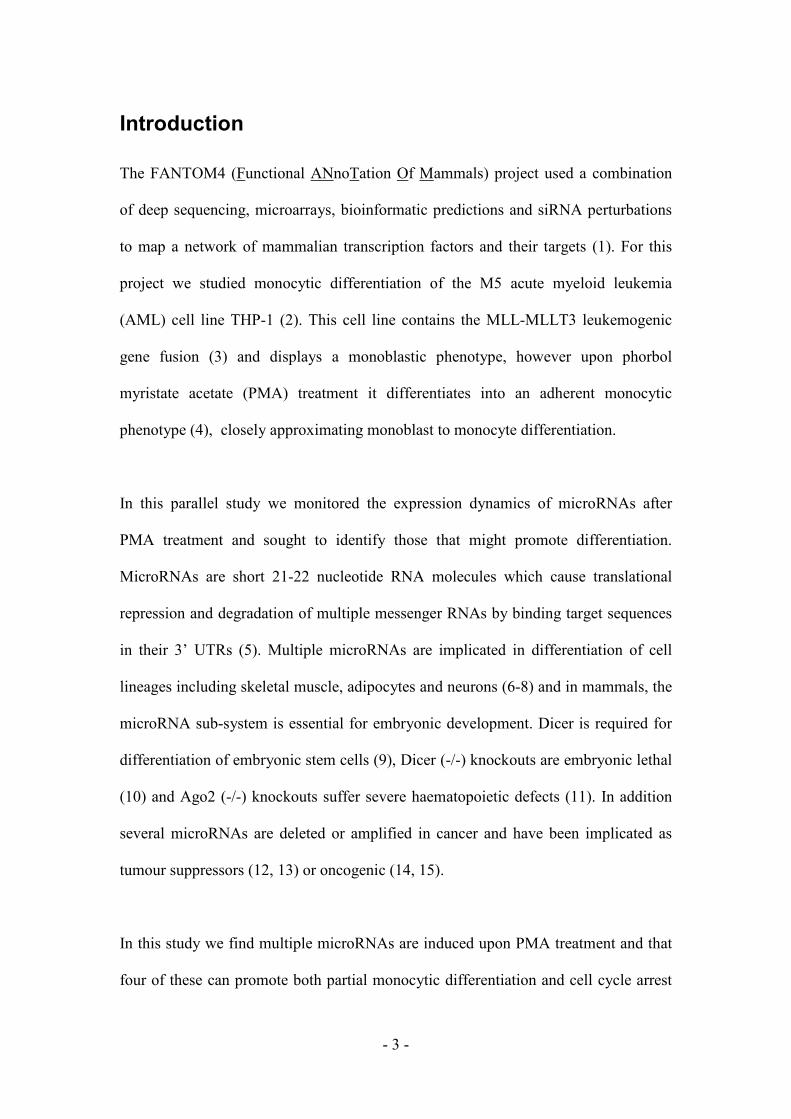
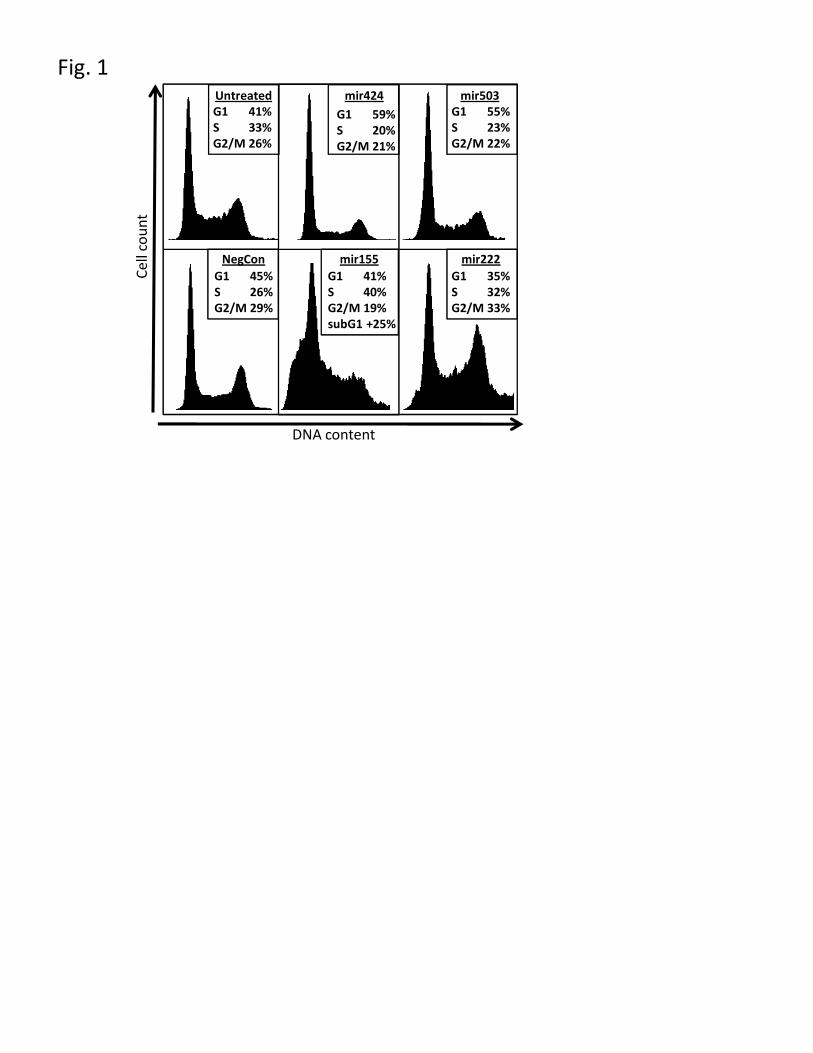
Examination of the mir-424 and mir-503 loci finds they are separated by 383 bases on
the genome and likely to be derived from the same primary transcript. We confirm
this using RT-PCR (Fig 2A & B, Supplementary Fig.4). A further five microRNAs
(mir-542-5p, mir-542-3p, mir-450a, mir-450b-5p, mir-450b-3p) that are within 7KB
of mir-424-503 may also be generated from the same primary transcript, and two of

- 8 -
these (mir-542-5p and mir-542-3p) are also induced. However the deep sequencing
results show these are present at much lower levels than mir-424 and mir-503 (see
Table 1).
Finally we observe that the mir-424-503 polycistronic microRNAs have related seed
sequences, thus they share target genes explaining why both can induce partial
differentiation and cell cycle arrest (Fig. 2C). The array analysis shows overlapping
but distinct sets of targets for both mir-424 and mir-503, and despite similarity to mir-
15/16 members neither induced apoptosis (29). This arrangement of polycistronic
microRNAs with shared seed sequences has been reported for mir-15a-mir-16-1 (29,
30), and mir-17-92 (14), and may be a common architecture.
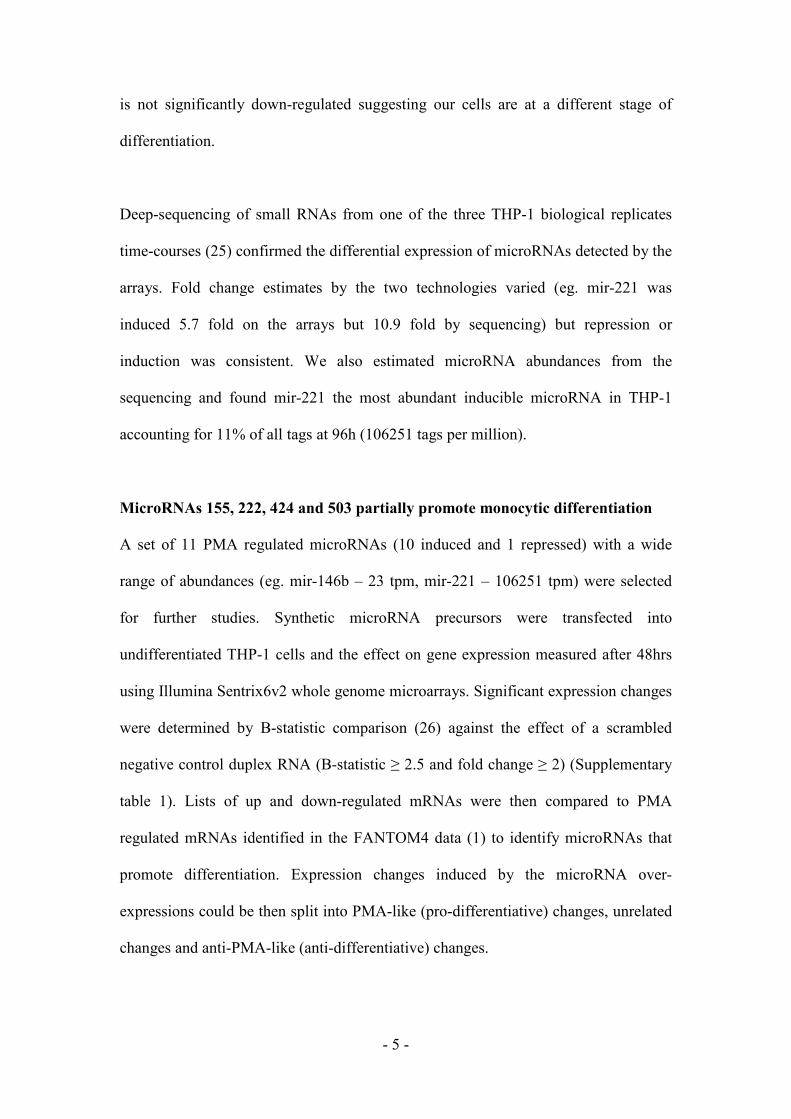
mir-424 and mir-503 directly target multiple cell cycle regulators.
Mir-424 has been previously shown to target the cell cycle regulators CCNE1,
CCND1, CCND3 and CDK6 (28, 31) and all of these are down-regulated at the
mRNA level in our over-expression experiments (0.77, 0.84, 0.69 and 0.85 fold
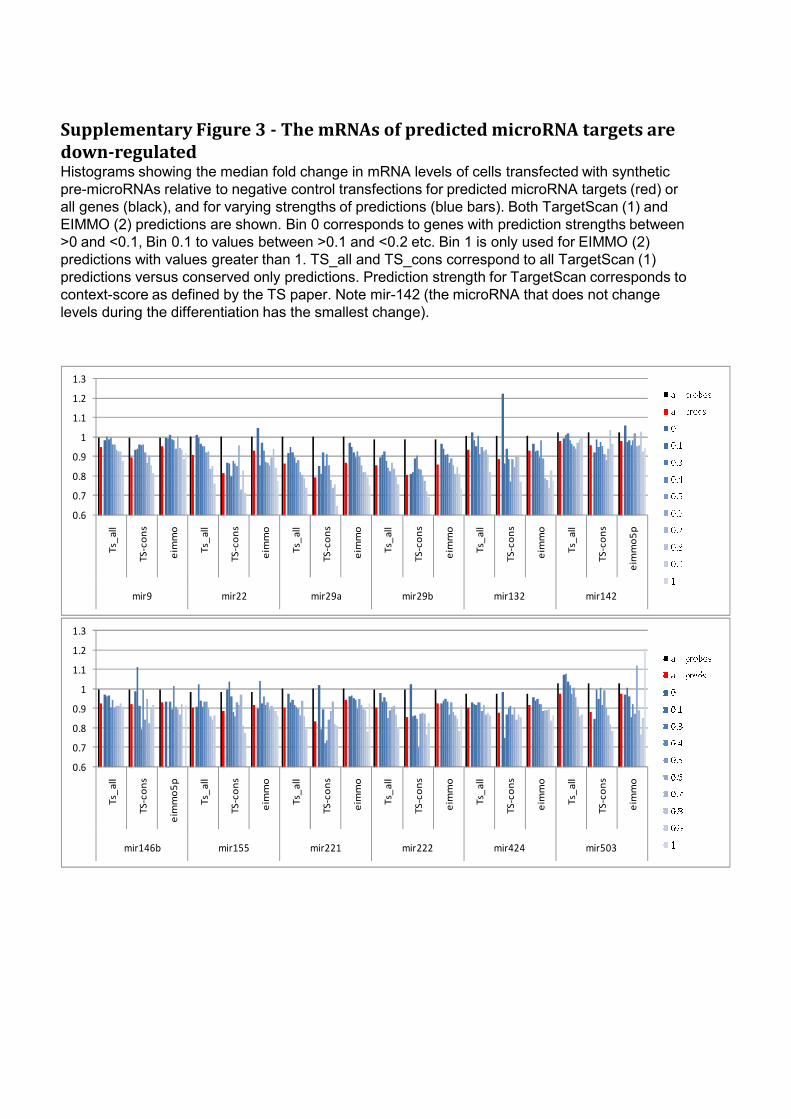
respectively). To identify the likely direct targets of mir-503 and the other
microRNAs identified in this study we compared publicly available microRNA target
predictions (both EIMMO and TargetScan (32, 33)) with the lists of genes down-
regulated in the microRNA over-expression experiments (for full lists of putative
targets see supplementary table 4 and also supplementary Fig. 3).
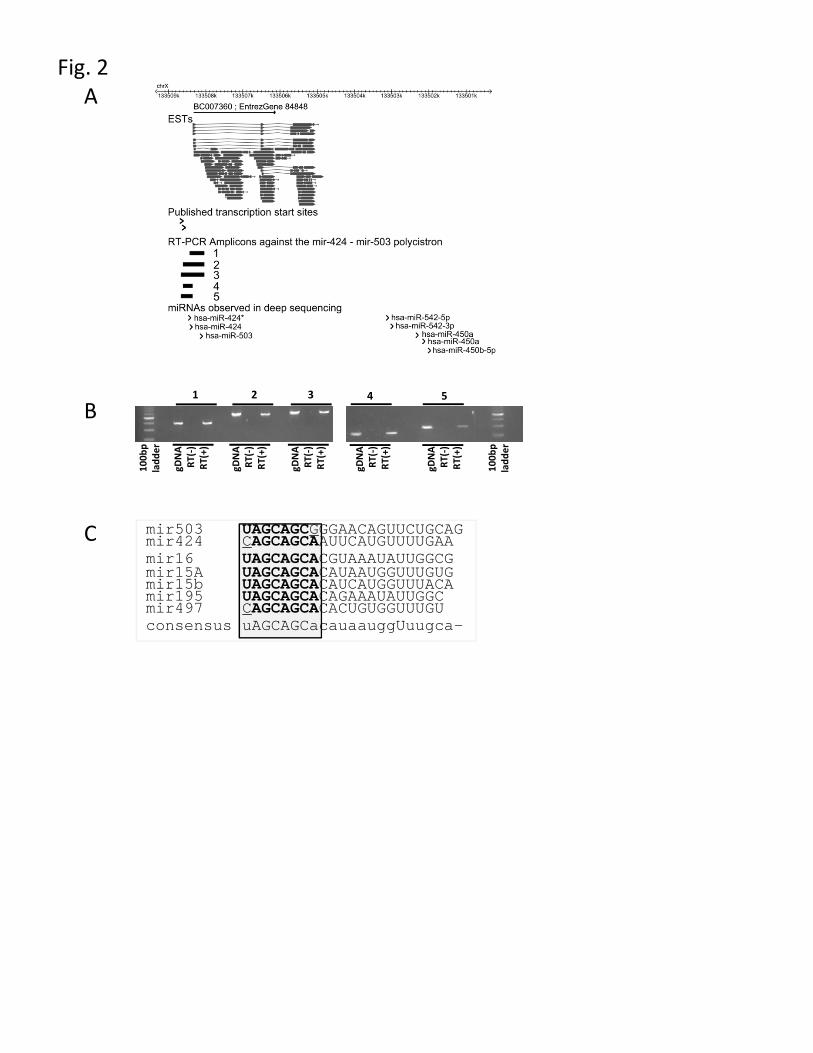
A combined set of predicted mir-424 and mir-503 targets with roles in cell cycle were
then tested using luciferase reporter assays with mir-424, mir-503 and mir-9 co-
transfection (Fig. 3). The known mir-424 targets CCNE1 and CCND1 were the

- 9 -
second and third most affected targets of mir-424 and were also affected by mir-503,
while PRDM1 and ETS1 which lack predicted mir-424/503 sites were the least
affected (Fig. 3A). Conversely PRDM1 was the most affected construct in the mir-9
transfection, while WEE1 and CDC14A lacking mir-9 target sites were the least
affected.
Using BCL6 and POU2F2 constructs as thresholds for non-specific down-regulation
(these both lack mir-424/503 sites) we find the following, mir-424 targets ANLN,
CCNE1, CCND1, WEE1, ATF6, KIF23, CHEK1, CDC25A, CDC14A and CCNF
while mir-503 targets CDC14A, ANLN, CCND1, ATF6, EIF2C1, CDC25A, CHEK1,
CCNE1, CCNE2, WEE1, CCNF and CDKN1A. We note that seven of these targets
appear in both lists, however they are affected to different levels eg. CDC14A was the
most affected target of mir-503 but tenth strongest by mir-424, reflective of the
different affinities of the mir-424 and mir-503 sequences.
The pro-differentiative mir-424-503 polycistron also targets the primary
transcript of the anti-differentiative mir-9-3
Mentioned previously, mir-9 is down-regulated during differentiation and when over-
expressed induces anti-differentiative gene expression changes. The mature
microRNA can be generated from three possible locations, mir-9-1, 9-2 and 9-3,
however mir-9-3 is the most likely copy regulated in THP-1 differentiation as both
Illumina microarray signal (Fig. 4A) and Cap Analysis of Gene Expression signal
(data not shown) for the primary transcript is down-regulated with PMA.
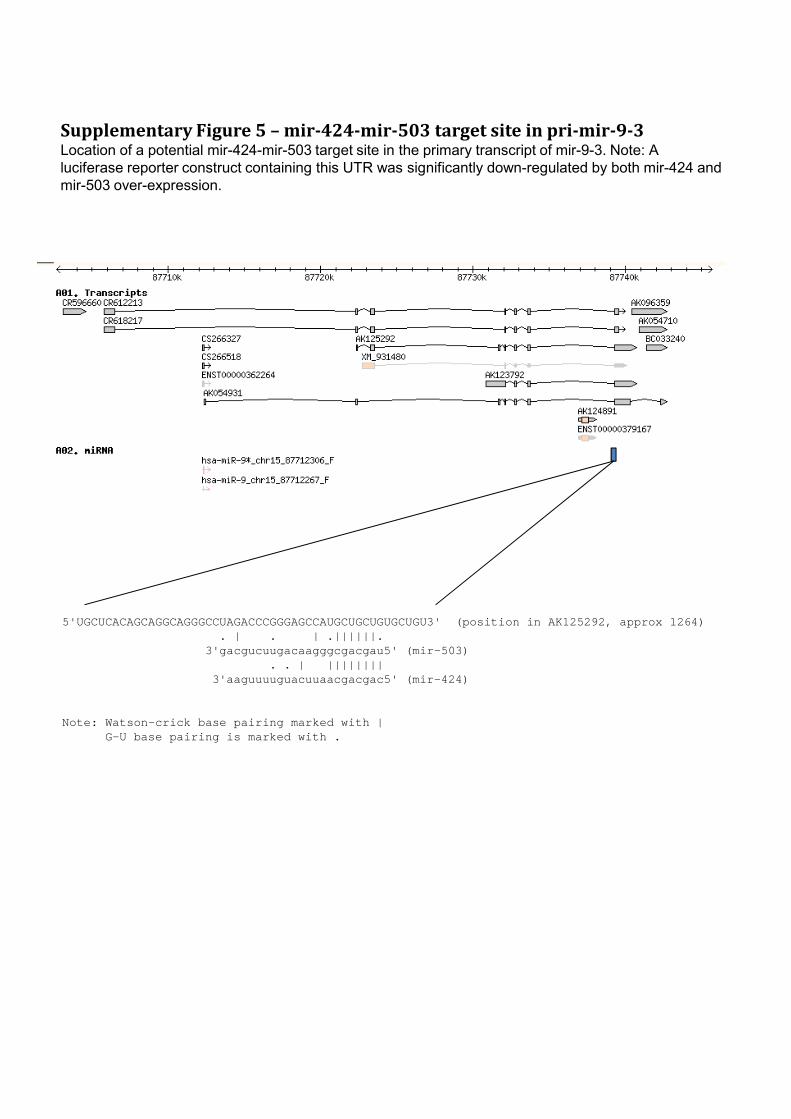
Surprisingly, over-expression of either mir-424 or mir-503 also down-regulated mir-
9-3 (Fig. 4A) and upon examining the primary transcript sequence we identified a
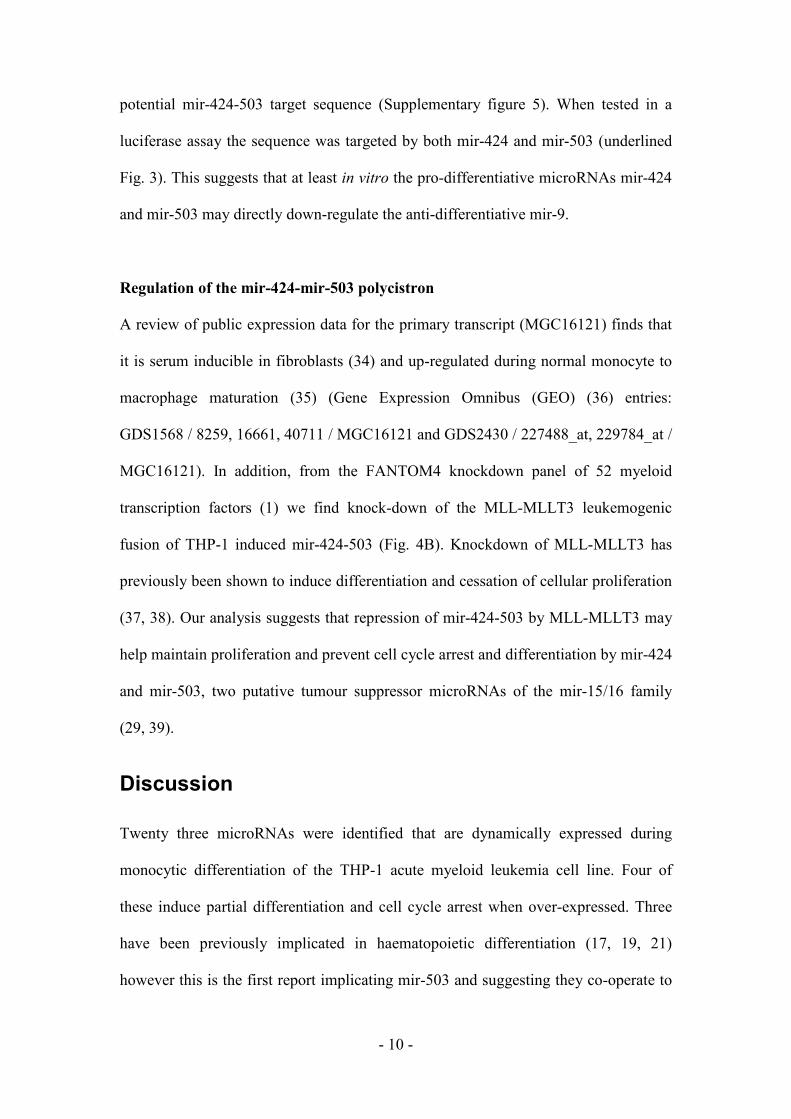
- 10 -
potential mir-424-503 target sequence (Supplementary figure 5). When tested in a
luciferase assay the sequence was targeted by both mir-424 and mir-503 (underlined
Fig. 3). This suggests that at least in vitro the pro-differentiative microRNAs mir-424
and mir-503 may directly down-regulate the anti-differentiative mir-9.
Regulation of the mir-424-mir-503 polycistron
A review of public expression data for the primary transcript (MGC16121) finds that
it is serum inducible in fibroblasts (34) and up-regulated during normal monocyte to
macrophage maturation (35) (Gene Expression Omnibus (GEO) (36) entries:
GDS1568 / 8259, 16661, 40711 / MGC16121 and GDS2430 / 227488_at, 229784_at /
MGC16121). In addition, from the FANTOM4 knockdown panel of 52 myeloid
transcription factors (1) we find knock-down of the MLL-MLLT3 leukemogenic
fusion of THP-1 induced mir-424-503 (Fig. 4B). Knockdown of MLL-MLLT3 has
previously been shown to induce differentiation and cessation of cellular proliferation
(37, 38). Our analysis suggests that repression of mir-424-503 by MLL-MLLT3 may
help maintain proliferation and prevent cell cycle arrest and differentiation by mir-424
and mir-503, two putative tumour suppressor microRNAs of the mir-15/16 family
(29, 39).
Discussion
Twenty three microRNAs were identified that are dynamically expressed during
monocytic differentiation of the THP-1 acute myeloid leukemia cell line. Four of
these induce partial differentiation and cell cycle arrest when over-expressed. Three
have been previously implicated in haematopoietic differentiation (17, 19, 21)
however this is the first report implicating mir-503 and suggesting they co-operate to

- 11 -
promote monocytic differentiation. Mir-424 was previously reported as regulated by
SPI1(PU.1) and inducing monocytic differentiation by targeting NFIA (17), however
in THP-1, NFIA is not expressed and SPI1 knockdown has no effect on mir-424
expression suggesting other targets and regulators are involved. We show that mir-
424 and mir-503 are produced as a polycistronic message which is repressed by MLL-
MLLT3 and that both induce G1 arrest by targeting an overlapping set of cell cycle
regulators. We also show both target the primary transcript of mir-9 an anti-
differentiative microRNA. This is the first report to our knowledge of a set of pro-
differentiative microRNAs targeting the primary transcript of an anti-differentiative
microRNA.
For mir-155 and mir-222 we observed apoptosis and G2 cell cycle arrest respectively.
From the array data and target site predictions we identify several targets that could
explain the respective phenotypes (see supplementary table 4). We hypothesize that
apoptosis by mir-155 occurs by targeting anti-apoptotic factors (similar to BCL2
targeting by mir-15/16 (29)) and predict RPS6KA3, SGK3, RHEB and KRAS as
likely targets (40-43) three of which have supporting protein level evidence as targets
(RPS6KA3, RHEB and KRAS) (44, 45). Apoptosis by mir-155 has not been
previously reported but may explain the selective depletion of myeloid and erythroid
hematopoetic stem cell populations in preference for B-cell proliferation (21), and
also explain the fraction of apoptotic THP-1 cells observed with PMA treatment (46).
We also predict the G2 accumulation of THP-1 induced by mir-222 is via targeting of
CDKN1B, RB1 and SKP1A by mir-222. Knock-down of RB1 and SKP1A can
increase G2 populations (47, 48) and CDKN1B is a validated target (49, 50). We note

- 12 -
that in different cell lines mir-222 can induce either an S-phase or G1-accumulation
(51, 52). This highlights that the effect of mir-222, like mir-155 and perhaps most
microRNAs is context specific. The phenotype in any given cell type will depend on
the expression levels of microRNA targets and all the other components with which
they are networked.
The interconnected nature of these components is best demonstrated by the
observations regarding the four microRNAs. All four were shown to induce cell cycle
phenotypes and for mir-424 and mir-503 we confirmed down-regulation of direct
targets by luciferase assay, however these microRNAs also induced significant
numbers of genes. For example 57 of the 209 genes induced by the four microRNA
mix are also induced by PMA. These must be indirect targets, which are induced
through down-regulation of anti-differentiative components of the monoblast state,
such as pri-mir-9-3 (Fig. 5).
Finally THP-1 differentiation involves the co-ordinated up-regulation of transcription
factor activities involved in the differentiated monocyte phenotype and down-
regulation of factors primarily involved in cell cycle (1). Artificial siRNA knockdown
of these naturally down-regulated factors or over-expression of the four microRNAs
individually can promote partial differentiation however none are sufficient to
completely reiterate differentiation in THP1. This is most likely because state
transition (from one ‘transcriptional basin’ (1) to another) requires co-ordination of
multiple components including transcription factors, microRNAs and cytokines, and
perturbation of a single component is insufficient to perturb the system from one
stable basin state to another. To test this in part we have shown that co-over-

- 13 -
expression of all four microRNAs promotes a more specific PMA like response than
over-expression of any individual microRNA, and it would be interesting to combine
this further with knock down of specific transcription factors such as MYB and MLL-
MLLT3. The data we have presented here has been generated using the THP-1 cell
line containing the MLL-MLLT3 fusion. It will be important now to test the role of
these microRNAs in primary AML samples and cell lines with other known genetic
legions and compare them with normal monoblasts to see whether over-expression of
these microRNAs could be used as a potential differentiative therapy.
Acknowledgements
This study was supported by the following; A research grant for RIKEN Omics
Science Center from MEXT to YH; A grant of the Genome Network Project from the
Ministry of Education, Culture, Sports, Science and Technology, Japan to YH
(http://genomenetwork.nig.ac.jp/index_e.html). We would also like to thank all of the
members in the FANTOM consortium for fruitful collaboration and cooperation in
particular thanks to F. Hori for information collection and C. Wells and J.
Quackenbush for discussions on the microRNA microarrays. ARRF was supported by
a CJ Martin Fellowship from the Australian NHMRC (ID 428261).
Supplementary Information accompanies the paper on the Leukemia website
(http://www.nature.com/leu).

- 14 -
References
1. Suzuki H, Forrest AR, van Nimwegen E, Daub CO, Balwierz PJ, Irvine KM, et al. The
transcriptional network that controls growth arrest and differentiation in a human myeloid
leukemia cell line. Nat Genet 2009 May; 41(5): 553-562.
2. Tsuchiya S, Yamabe M, Yamaguchi Y, Kobayashi Y, Konno T, Tada K. Establishment and
characterization of a human acute monocytic leukemia cell line (THP-1). Int J Cancer 1980
Aug; 26(2): 171-176.
3. Odero MD, Zeleznik-Le NJ, Chinwalla V, Rowley JD. Cytogenetic and molecular analysis of
the acute monocytic leukemia cell line THP-1 with an MLL-AF9 translocation. Genes
Chromosomes Cancer 2000 Dec; 29(4): 333-338.
4. Tsuchiya S, Kobayashi Y, Goto Y, Okumura H, Nakae S, Konno T, et al. Induction of
maturation in cultured human monocytic leukemia cells by a phorbol diester. Cancer Res
1982 Apr; 42(4): 1530-1536.
5. Standart N, Jackson RJ. MicroRNAs repress translation of m7Gppp-capped target mRNAs in
vitro by inhibiting initiation and promoting deadenylation. Genes Dev 2007 Aug 15; 21(16):
1975-1982.
6. Chen JF, Mandel EM, Thomson JM, Wu Q, Callis TE, Hammond SM, et al. The role of
microRNA-1 and microRNA-133 in skeletal muscle proliferation and differentiation. Nat
Genet 2006 Feb; 38(2): 228-233.
7. Esau C, Kang X, Peralta E, Hanson E, Marcusson EG, Ravichandran LV, et al. MicroRNA-
143 regulates adipocyte differentiation. J Biol Chem 2004 Dec 10; 279(50): 52361-52365.

- 15 -
8. Hohjoh H, Fukushima T. Marked change in microRNA expression during neuronal
differentiation of human teratocarcinoma NTera2D1 and mouse embryonal carcinoma P19
cells. Biochem Biophys Res Commun 2007 Oct 19; 362(2): 360-367.
9. Kanellopoulou C, Muljo SA, Kung AL, Ganesan S, Drapkin R, Jenuwein T, et al. Dicer-
deficient mouse embryonic stem cells are defective in differentiation and centromeric
silencing. Genes Dev 2005 Feb 15; 19(4): 489-501.
10. Bernstein E, Kim SY, Carmell MA, Murchison EP, Alcorn H, Li MZ, et al. Dicer is essential
for mouse development. Nat Genet 2003 Nov; 35(3): 215-217.
11. O'Carroll D, Mecklenbrauker I, Das PP, Santana A, Koenig U, Enright AJ, et al. A Slicer-
independent role for Argonaute 2 in hematopoiesis and the microRNA pathway. Genes Dev
2007 Aug 15; 21(16): 1999-2004.
12. Lee YS, Dutta A. The tumor suppressor microRNA let-7 represses the HMGA2 oncogene.
Genes Dev 2007 May 1; 21(9): 1025-1030.
13. Tazawa H, Tsuchiya N, Izumiya M, Nakagama H. Tumor-suppressive miR-34a induces
senescence-like growth arrest through modulation of the E2F pathway in human colon cancer
cells. Proc Natl Acad Sci U S A 2007 Sep 25; 104(39): 15472-15477.
14. Hayashita Y, Osada H, Tatematsu Y, Yamada H, Yanagisawa K, Tomida S, et al. A
polycistronic microRNA cluster, miR-17-92, is overexpressed in human lung cancers and
enhances cell proliferation. Cancer Res 2005 Nov 1; 65(21): 9628-9632.
15. Kluiver J, Poppema S, de Jong D, Blokzijl T, Harms G, Jacobs S, et al. BIC and miR-155 are
highly expressed in Hodgkin, primary mediastinal and diffuse large B cell lymphomas. J
Pathol 2005 Oct; 207(2): 243-249.

- 16 -
16. Severin J, Waterhouse AM, Kawaji H, Lassmann T, van Nimwegen E, Balwierz PJ, et al.
FANTOM4 EdgeExpressDB: an integrated database of promoters, genes, microRNAs,
expression dynamics and regulatory interactions. Genome Biol 2009 Apr 19; 10(4): R39.
17. Rosa A, Ballarino M, Sorrentino A, Sthandier O, De Angelis FG, Marchioni M, et al. The
interplay between the master transcription factor PU.1 and miR-424 regulates human
monocyte/macrophage differentiation. Proc Natl Acad Sci U S A 2007 Dec 11; 104(50):
19849-19854.
18. Wang Q, Huang Z, Xue H, Jin C, Ju XL, Han JD, et al. MicroRNA miR-24 inhibits
erythropoiesis by targeting activin type I receptor ALK4. Blood 2008 Jan 15; 111(2): 588-595.
19. Felli N, Fontana L, Pelosi E, Botta R, Bonci D, Facchiano F, et al. MicroRNAs 221 and 222
inhibit normal erythropoiesis and erythroleukemic cell growth via kit receptor down-
modulation. Proc Natl Acad Sci U S A 2005 Dec 13; 102(50): 18081-18086.
20. Costinean S, Zanesi N, Pekarsky Y, Tili E, Volinia S, Heerema N, et al. Pre-B cell
proliferation and lymphoblastic leukemia/high-grade lymphoma in E(mu)-miR155 transgenic
mice. Proc Natl Acad Sci U S A 2006 May 2; 103(18): 7024-7029.
21. Georgantas RW, 3rd, Hildreth R, Morisot S, Alder J, Liu CG, Heimfeld S, et al. CD34+
hematopoietic stem-progenitor cell microRNA expression and function: a circuit diagram of
differentiation control. Proc Natl Acad Sci U S A 2007 Feb 20; 104(8): 2750-2755.
22. Mizuno Y, Tokuzawa Y, Ninomiya Y, Yagi K, Yatsuka-Kanesaki Y, Suda T, et al. miR-210
promotes osteoblastic differentiation through inhibition of AcvR1b. FEBS Lett 2009 Jul 7;
583(13): 2263-2268.
- 17 -
23. Nie K, Gomez M, Landgraf P, Garcia JF, Liu Y, Tan LH, et al. MicroRNA-mediated down-
regulation of PRDM1/Blimp-1 in Hodgkin/Reed-Sternberg cells: a potential pathogenetic
lesion in Hodgkin lymphomas. Am J Pathol 2008 Jul; 173(1): 242-252.
24. Fontana L, Pelosi E, Greco P, Racanicchi S, Testa U, Liuzzi F, et al. MicroRNAs 17-5p-20a-
106a control monocytopoiesis through AML1 targeting and M-CSF receptor upregulation. Nat
Cell Biol 2007 Jul; 9(7): 775-787.
25. Taft RJ, Glazov EA, Cloonan N, Simons C, Stephen S, Faulkner GJ, et al. Tiny RNAs
associated with transcription start sites in animals. Nat Genet 2009 May; 41(5): 572-578.
26. Smyth GK, Yang YH, Speed T. Statistical issues in cDNA microarray data analysis. Methods
Mol Biol 2003; 224: 111-136.
27. Beissbarth T, Speed TP. GOstat: find statistically overrepresented Gene Ontologies within a
group of genes. Bioinformatics 2004 Jun 12; 20(9): 1464-1465.
28. Liu Q, Fu H, Sun F, Zhang H, Tie Y, Zhu J, et al. miR-16 family induces cell cycle arrest by
regulating multiple cell cycle genes. Nucleic Acids Res 2008 Sep; 36(16): 5391-5404.
29. Cimmino A, Calin GA, Fabbri M, Iorio MV, Ferracin M, Shimizu M, et al. miR-15 and miR-
16 induce apoptosis by targeting BCL2. Proc Natl Acad Sci U S A 2005 Sep 27; 102(39):
13944-13949.
30. Calin GA, Ferracin M, Cimmino A, Di Leva G, Shimizu M, Wojcik SE, et al. A MicroRNA
signature associated with prognosis and progression in chronic lymphocytic leukemia. N Engl
J Med 2005 Oct 27; 353(17): 1793-1801.

- 18 -
31. Linsley PS, Schelter J, Burchard J, Kibukawa M, Martin MM, Bartz SR, et al. Transcripts
targeted by the microRNA-16 family cooperatively regulate cell cycle progression. Mol Cell
Biol 2007 Mar; 27(6): 2240-2252.
32. Gaidatzis D, van Nimwegen E, Hausser J, Zavolan M. Inference of miRNA targets using
evolutionary conservation and pathway analysis. BMC Bioinformatics 2007; 8: 69.
33. Lewis BP, Shih IH, Jones-Rhoades MW, Bartel DP, Burge CB. Prediction of mammalian
microRNA targets. Cell 2003 Dec 26; 115(7): 787-798.
34. Chang HY, Sneddon JB, Alizadeh AA, Sood R, West RB, Montgomery K, et al. Gene
expression signature of fibroblast serum response predicts human cancer progression:
similarities between tumors and wounds. PLoS Biol 2004 Feb; 2(2): E7.
35. Martinez FO, Gordon S, Locati M, Mantovani A. Transcriptional profiling of the human
monocyte-to-macrophage differentiation and polarization: new molecules and patterns of gene
expression. J Immunol 2006 Nov 15; 177(10): 7303-7311.
36. Edgar R, Domrachev M, Lash AE. Gene Expression Omnibus: NCBI gene expression and
hybridization array data repository. Nucleic Acids Res 2002 Jan 1; 30(1): 207-210.
37. Martino V, Tonelli R, Montemurro L, Franzoni M, Marino F, Fazzina R, et al. Down-
regulation of MLL-AF9, MLL and MYC expression is not obligatory for monocyte-
macrophage maturation in AML-M5 cell lines carrying t(9;11)(p22;q23). Oncol Rep 2006 Jan;
15(1): 207-211.
38. Pession A, Martino V, Tonelli R, Beltramini C, Locatelli F, Biserni G, et al. MLL-AF9
oncogene expression affects cell growth but not terminal differentiation and is downregulated
during monocyte-macrophage maturation in AML-M5 THP-1 cells. Oncogene 2003 Nov 27;
22(54): 8671-8676.
- 19 -
39. Calin GA, Dumitru CD, Shimizu M, Bichi R, Zupo S, Noch E, et al. Frequent deletions and
down-regulation of micro- RNA genes miR15 and miR16 at 13q14 in chronic lymphocytic
leukemia. Proc Natl Acad Sci U S A 2002 Nov 26; 99(24): 15524-15529.
40. Kang S, Dong S, Gu TL, Guo A, Cohen MS, Lonial S, et al. FGFR3 activates RSK2 to
mediate hematopoietic transformation through tyrosine phosphorylation of RSK2 and
activation of the MEK/ERK pathway. Cancer Cell 2007 Sep; 12(3): 201-214.
41. Liu D, Yang X, Songyang Z. Identification of CISK, a new member of the SGK kinase family
that promotes IL-3-dependent survival. Curr Biol 2000 Oct 5; 10(19): 1233-1236.
42. Basso AD, Mirza A, Liu G, Long BJ, Bishop WR, Kirschmeier P. The farnesyl transferase
inhibitor (FTI) SCH66336 (lonafarnib) inhibits Rheb farnesylation and mTOR signaling. Role
in FTI enhancement of taxane and tamoxifen anti-tumor activity. J Biol Chem 2005 Sep 2;
280(35): 31101-31108.
43. Wang W, Wang CY, Dong JH, Chen X, Zhang M, Zhao G. Identification of effective siRNA
against K-ras in human pancreatic cancer cell line MiaPaCa-2 by siRNA expression cassette.
World J Gastroenterol 2005 Apr 7; 11(13): 2026-2031.
44. Selbach M, Schwanhausser B, Thierfelder N, Fang Z, Khanin R, Rajewsky N. Widespread
changes in protein synthesis induced by microRNAs. Nature 2008 Sep 4; 455(7209): 58-63.
45. Gottwein E, Mukherjee N, Sachse C, Frenzel C, Majoros WH, Chi JT, et al. A viral
microRNA functions as an orthologue of cellular miR-155. Nature 2007 Dec 13; 450(7172):
1096-1099.

- 20 -
46. O'Sullivan AW, Wang JH, Redmond HP. The role of P38 MAPK and PKC in BLP induced
TNF-alpha release, apoptosis, and NFkappaB activation in THP-1 monocyte cells. J Surg Res
2009 Jan; 151(1): 138-144.
47. Astrinidis A, Senapedis W, Henske EP. Hamartin, the tuberous sclerosis complex 1 gene
product, interacts with polo-like kinase 1 in a phosphorylation-dependent manner. Hum Mol
Genet 2006 Jan 15; 15(2): 287-297.
48. Kitagawa K, Abdulle R, Bansal PK, Cagney G, Fields S, Hieter P. Requirement of Skp1-Bub1
interaction for kinetochore-mediated activation of the spindle checkpoint. Mol Cell 2003 May;
11(5): 1201-1213.
49. le Sage C, Nagel R, Egan DA, Schrier M, Mesman E, Mangiola A, et al. Regulation of the
p27(Kip1) tumor suppressor by miR-221 and miR-222 promotes cancer cell proliferation.
EMBO J 2007 Aug 8; 26(15): 3699-3708.
50. Medina R, Zaidi SK, Liu CG, Stein JL, van Wijnen AJ, Croce CM, et al. MicroRNAs 221 and
222 bypass quiescence and compromise cell survival. Cancer Res 2008 Apr 15; 68(8): 2773-
2780.
51. Visone R, Russo L, Pallante P, De Martino I, Ferraro A, Leone V, et al. MicroRNAs (miR)-
221 and miR-222, both overexpressed in human thyroid papillary carcinomas, regulate
p27Kip1 protein levels and cell cycle. Endocr Relat Cancer 2007 Sep; 14(3): 791-798.
52. Mayoral RJ, Pipkin ME, Pachkov M, van Nimwegen E, Rao A, Monticelli S. MicroRNA-221-
222 regulate the cell cycle in mast cells. J Immunol 2009 Jan 1; 182(1): 433-445.
- 21 -
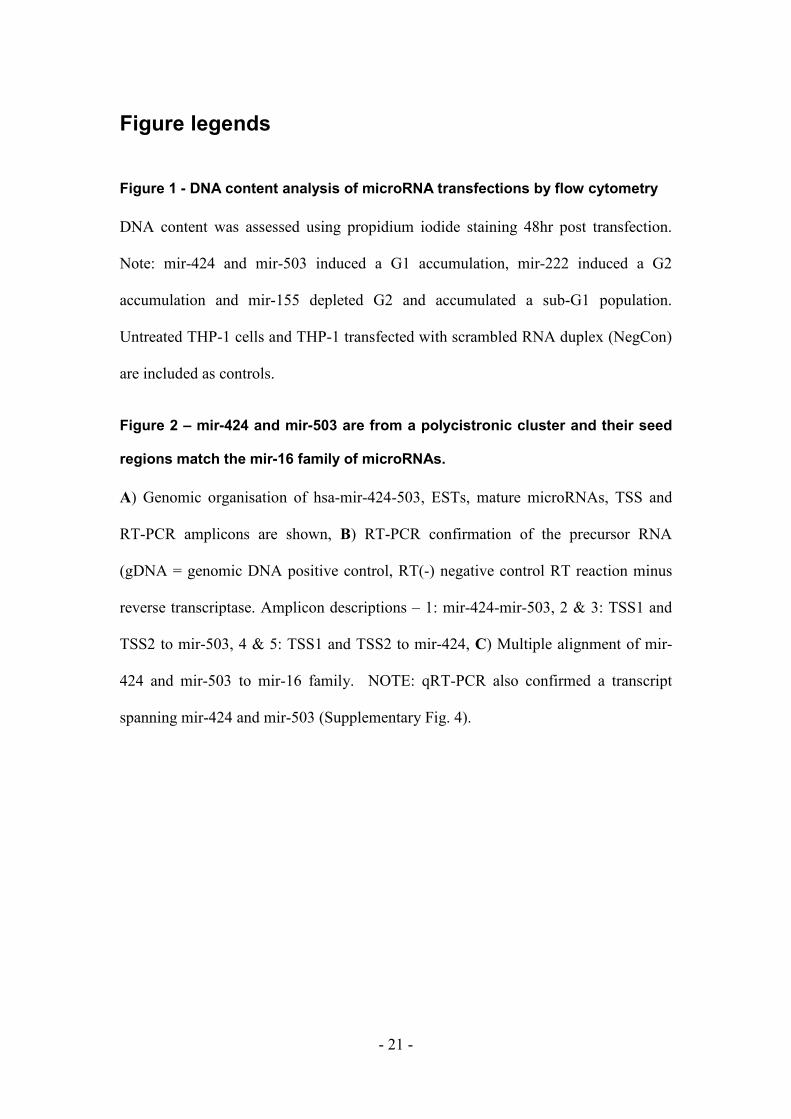
Figure legends
Figure 1 - DNA content analysis of microRNA transfections by flow cytometry
DNA content was assessed using propidium iodide staining 48hr post transfection.
Note: mir-424 and mir-503 induced a G1 accumulation, mir-222 induced a G2
accumulation and mir-155 depleted G2 and accumulated a sub-G1 population.
Untreated THP-1 cells and THP-1 transfected with scrambled RNA duplex (NegCon)
are included as controls.
Figure 2 – mir-424 and mir-503 are from a polycistronic cluster and their seed
regions match the mir-16 family of microRNAs.
A) Genomic organisation of hsa-mir-424-503, ESTs, mature microRNAs, TSS and
RT-PCR amplicons are shown, B) RT-PCR confirmation of the precursor RNA
(gDNA = genomic DNA positive control, RT(-) negative control RT reaction minus
reverse transcriptase. Amplicon descriptions – 1: mir-424-mir-503, 2 & 3: TSS1 and
TSS2 to mir-503, 4 & 5: TSS1 and TSS2 to mir-424, C) Multiple alignment of mir-
424 and mir-503 to mir-16 family. NOTE: qRT-PCR also confirmed a transcript
spanning mir-424 and mir-503 (Supplementary Fig. 4).
- 22 -
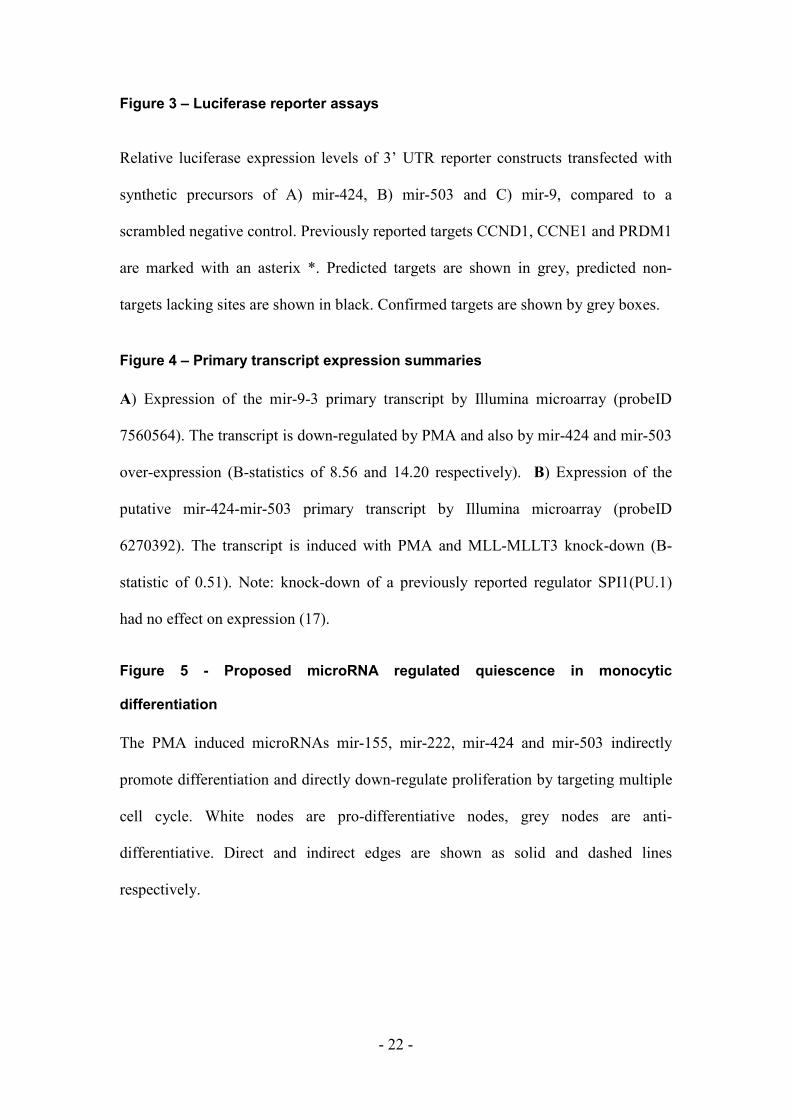
Figure 3 – Luciferase reporter assays
Relative luciferase expression levels of 3’ UTR reporter constructs transfected with
synthetic precursors of A) mir-424, B) mir-503 and C) mir-9, compared to a
scrambled negative control. Previously reported targets CCND1, CCNE1 and PRDM1
are marked with an asterix *. Predicted targets are shown in grey, predicted non-
targets lacking sites are shown in black. Confirmed targets are shown by grey boxes.
Figure 4 – Primary transcript expression summaries
A) Expression of the mir-9-3 primary transcript by Illumina microarray (probeID
7560564). The transcript is down-regulated by PMA and also by mir-424 and mir-503
over-expression (B-statistics of 8.56 and 14.20 respectively). B) Expression of the
putative mir-424-mir-503 primary transcript by Illumina microarray (probeID
6270392). The transcript is induced with PMA and MLL-MLLT3 knock-down (B-
statistic of 0.51). Note: knock-down of a previously reported regulator SPI1(PU.1)
had no effect on expression (17).
Figure 5 - Proposed microRNA regulated quiescence in monocytic
differentiation
The PMA induced microRNAs mir-155, mir-222, mir-424 and mir-503 indirectly
promote differentiation and directly down-regulate proliferation by targeting multiple
cell cycle. White nodes are pro-differentiative nodes, grey nodes are anti-
differentiative. Direct and indirect edges are shown as solid and dashed lines
respectively.

- 23 -
Tables
Table 1 - microRNAs induced or repressed >= 3 fold in THP-1 after 96hours
PMA induced differentiation.
Dynamically
regulated
microRNAs
microRNA
array Small RNA sequencing
fold
change
fold
change max cpm
Induced
miR-221 5.7 10.9 106251
miR-24 3.2 2.2 65581
miR-222 3.3 6.4 55722
miR-124 39.3 44 30058
miR-22 14.7 7.6 18316
miR-29b 5.3 3.4 10154
miR-29a 5.2 2 6087
miR-503 6.8 8.3 4099
miR-424 5.1 1.9 1971
miR-155 3 1.3 1445
miR-30a-5p 4.3 1.9 568
miR-132 12.3 11.5 294
miR-542-3p 4.8 2.6 172
miR-137 17.3 9.5 153
miR-151 10.2 1.8 105
miR-133a 7.7 ND 70
miR-542-5p 4.3 ND 67
miR-146b 5.6 ND 23
miR-193b 3.7 ND 19
miR-133b 12 ND < 1
miR-146a 17 ND ND
- 24 -
Repressed
miR-210 0.3 0.5 22801
miR-9 0.3 0.04 17871
microRNAs are ranked by maximum counts per million in the small RNA sequencing
which is described in (25).
Table 2 - Top 5 gene ontologies enriched in genes down-regulated with over-
expression of mir-424 and mir-503
microRNA p-value term ontology
mir-424 3.86E-11 gene expression GO:0010467
3.39E-08 RNA metabolic process GO:0016070
2.39E-07 nucleobase, nucleoside, nucleotide
and nucleic acid metabolic process
GO:0006139
2.39E-07 cell cycle phase GO:0016070
3.12E-06 cell cycle GO:0006139
mir-503 1.40E-05 cell division GO:0051301
1.84E-04 cell cycle GO:0007049
1.84E-04 cell cycle phase GO:0022403
1.84E-04 M phase GO:0000279
2.34E-04 mitosis GO:0007067
G1
S
G2/M
45%
26%
29%
v
Untreated mir424
mir155
mir503
mir222NegCon
G1
S
G2/M
subG1
41%
40%
19%
+25%
G1
S
G2/M
41%
33%
26%
v G1
S
G2/M
59%
20%
21%
vG1
S
G2/M
55%
23%
22%
v
G1
S
G2/M
35%
32%
33%
v
DNA content
Ce
ll c
ou
nt
Fig. 1
mir503 UAGCAGCGGGAACAGUUCUGCAG
B
C
A
1
gD
NA
RT
(-)
RT
(+)
10
0b
p
lad
de
r
2 3 4 5
10
0b
p
lad
de
r
gD
NA
RT
(-)
RT
(+)
gD
NA
RT
(-)
RT
(+)
gD
NA
RT
(-)
RT
(+)
gD
NA
RT
(-)
RT
(+)
Fig. 2
mir503 UAGCAGCGGGAACAGUUCUGCAGmir424 CAGCAGCAAUUCAUGUUUUGAAmir16 UAGCAGCACGUAAAUAUUGGCGmir15A UAGCAGCACAUAAUGGUUUGUGmir15b UAGCAGCACAUCAUGGUUUACAmir195 UAGCAGCACAGAAAUAUUGGCmir497 CAGCAGCACACUGUGGUUUGUconsensus uAGCAGCacauaauggUuugca-
C
0
0.2
0.4
0.6
0.8
1
1.2
AN
LN
CC
NE
1
CC
ND
1
WE
E1
AT
F6
KIF
23
*p
ri-m
ir-9
-3
CH
EK
1
CD
C2
5A
CD
C1
4A
CC
NF
BC
L6
CD
KN
1A
EIF
2C
1
TLK
1
CD
C2
5B
CC
NE
2
AP
PB
P1
E2
F3
PO
U2
F2
FO
XO
1
DIC
ER
1
E2
F7
PR
DM
1
ET
S1
mir424
mir
NC
0
0.2
0.4
0.6
0.8
1
1.2
CD
C1
4A
AN
LN
CC
ND
1
AT
F6
EIF
2C
1
CD
C2
5A
CH
EK
1
*p
ri-m
ir-9
-3
CC
NE
1
CC
NE
2
WE
E1
CC
NF
CD
KN
1A
PO
U2
F2
E2
F3
E2
F7
FO
XO
1
ET
S1
PR
DM
1
KIF
23
AP
PB
P1
CD
C2
5B
TLK
1
BC
L6
DIC
ER
1
mir503
mir
NC
1.41.61.8 mir9
Confirmed
Confirmed
Fig. 3
A
B
C
Negative control
Predicted
non-target
Predicted
target
* *
00.20.40.60.8
11.21.41.6
PR
DM
1
ET
S1
BC
L6
CC
NE
2
CC
NE
1
PO
U2
F2
AN
LN
TLK
1
KIF
23
DIC
ER
1
CD
KN
1A
E2
F7
AT
F6
AP
PB
P1
CC
ND
1
CH
EK
1
EIF
2C
1
FO
XO
1
CD
C2
5A
CC
NF
CD
C2
5B
E2
F3
WE
E1
CD
C1
4A
mir
NC
Confirmed
C
*
Legend: predicted target, predicted non-target, negative control

0
0.2
0.4
0.6
0.8
1
1.2
1.4
0 2 6
24
72
mir
-42
4
Re
lati
ve
exp
ress
ion
mir9-3 pri
NC0 1 2 4 6
12
24
48
72
96
miRNA-OEPMA time course
0
1
2
3
4
5
6
7
8
9
10
0 2 6
24
72
MLL
T3
Re
lati
ve
exp
ress
ion
mir424/503 pri
0 1 2 4 61
22
44
87
29
6
siRNA-KDPMA time course
NC
MLL
T3
SP
I1
Fig. 4
A B
42
45
03

PMADifferentiated
quiescent
state
Proliferating
undifferentiated
state
pri-424-
503
pri-9-3
MLL-
MLLT3
mir-424
mir-503
mir-222
mir-9
mir-155
Fig. 5

Supplementary Materials and methods
Cell culture and RNA extraction
Human monoblast leukemia THP-1 cells were maintained in RPMI1640 medium (Invitrogen,
Carlsbad, CA, USA), 1mM sodium pyruvate, 10 mM HEPES supplemented with 0.001 % (v/v) 2-
mercaptoethanol, 10 µg/ml Penicillin/ Streptomycin (Invitrogen) and 10% fetal bovine serum at
37°C in a 5% CO2 and 95% O2 atmosphere. RNA was purified for expression analysis by Qiagen
RNeasy columns, Takara FastPure RNA Kit or TRIzol. RNA quality was checked by Nanodrop and
Bioanalyser. For the pre-microRNA over-expression experiments Total RNA was extracted 48h
after transfection, using the FastPure RNA kit (TAKARA BIO, Ohtsu, Shiga, Japan) in accordance
with the manufacturer’s instructions.
pre-miRNA overexpression experiments
THP-1 cells were seeded in 6 cm dishes at a density of 1 × 10⁶ cells/dish for transfection.
Transfection was performed with 1.6 µg/ml (final concentration) of Lipofectamine 2000
(Invitrogen) and 20 µM (final concentration) of pre-miRNA (Ambion or Nihon-shinyaku) by
reverse transfection protocol in accordance with the manufacturer’s instructions. For the co-
over-expression experiment 5uM for mir-155, mir-222, mir-424 and mir-503 was used.
Agilent miRNA microarrays
RNA purification, sample preparation and hybridization to Agilent Human miRNA Microarrays
(Agilent) was performed essentially as described in the Agilent Technical Manual using 100 ng
total RNA. Microarrays were scanned with Agilent’s DNA Microarray Scanner and expressed
numerically with Agilent Feature Extraction Software. The biological triplicate data was ‘per
chip’ normalized in GeneSpring GX (Agilent). Each measurement was divided by the 90th
percentile of all measurements in that sample. Note: due to the small number of probes on the
arrays (534), per chip normalization is generally not recommended however an alternative such
as spike in controls was not available, therefore, we trialed normalization to the median and
other deciles. The 90th
percentile gave us the most consistent profiles between the biological
replicate time-courses.
Deep Sequencing data analysis

Library generation and sequence mapping is described previously (1). All sequences shorter
than 18 nucleotides were discarded. The remaining sequences were aligned against all mature
and star sequences in mirbase (release 12) using nexalign (T.Lassman manuscript in
preparation). The raw expression for each miRNA sequence was determined by counting the
number of sequences mapping to genome loci overlapping the genomic location of the mature
miRNA. Normalized expression values were derived by dividing each raw expression with the
total expression of miRNAs at each time-point and multiplying by one million.
Illumina microarray analysis
Sample amplification and hybridisation
RNA (500 ng) was amplified using the Illumina TotalPrep RNA Amplification Kit, according to
manufacturer’s instructions. cRNA was hybridized to Illumina Human Sentrix-6 bead chips
Ver.2, according to standard Illumina protocols (http://www.illumina.com).
Raw data curation and normalization of Illumina microarray
Chips scans were processed using Illumina BeadScan and BeadStudio software packages and
summarized data was generated in BeadStudio (version 3.1). The summarized data from
BeadStudio was imported into R/BioConductor using the readBead function from the
BeadExplorer package (http://bioconductor.org/packages/1.9/bioc/html/BeadExplorer.html).
Background adjustment and quantile normalization (2) was performed using algorithms within
the affymetrix package (3) (function: bg.adjust and normalize.quantiles). The normalized data
was exported out off R/BioConductor with write.beadData function.
Normalisation and statistical analysis of Illumina microarray data
All microarray experiments were conducted in biological triplicate. A gene was considered
detected if the average detection score (p-value) of the three replicates was less than 0.01.
Quantile normalization and B-statistic calculations were carried out using the lumi and limma
packages of Bioconductor in the R statistical language (4-6). For differential gene expression
during the timecourse and between siRNAs, pre-miRNAs and negative control transfections we
required a B-statistic ≥ 2.5, fold change ≥ 2 and the gene had to be detected in one of the
conditions (average detection score ≤ 0.01).
RT-PCR confirmation of the hsa-mir-424, hsa-mir-503 precursor
Primers were designed overlapping the mature hsa-mir-424 and hsa-mir-503 sequences and
internal to the transcription start sites described in (7). The primers for amplicons 1 to 5 are the
following. amplicon 1 (chrX:133508023-133508403) used primer1: GGG ATA CAG CAG CAA TTC
ATG T, and primer4: TTA CCC TGG CAG CGG AAA CAA TAC, amplicon 2 (chrX:133508023-
133508586) used primer2: CAC CTG CAG CTC CTG GAA ATC AAA and primer4, amplicon 3
(chrX:133508023-133508641) used primer4 and primer3: CGT TGT TCC AAG ATT CAT CCT CAG
GG, amplicon 4 (chrX:133508337-133508586) used primer2 and primer5: GGT ATA GCA GCG
CCT CAC GTT T and amplicon 5 (chrX:133508336-133508641) used primer3 and primer5.
cDNA was made from a pool of THP-1 RNAs across the PMA time-course (0~96hr 10point Mix).
Templates tested by PCR were 1) positive control Genomic DNA 100ng/100ul, 2) negative
control RT(-) total RNA 12.5ng/25ul, and 3) test RT(+) total RNA 12.5ng/25ul RNA).
MicroRNA target predictions
MicroRNA target predictions were downloaded from http://www.targetscan.org/ (version 4.2
April 2008), and http://www.mirz.unibas.ch/ElMMo2/ (release 2 January 2008).
Luciferase reporter constructs to test sites in the 3’UTR of predicted targets
Luciferase reporter constructs were generated from 3 fragment fusion PCR as described
previously (8). The fragments consisted of 1) a CMV promoter driving a destabilised luciferase
(the PCR template for this was generated by subcloning the destabilised luciferase from
pGL4.12_luc2CP (Promega) into pMIR-REPORT (Ambion)), 2) A fragment containing the
predicted miRNA target sites in 3’UTRs of candidate target mRNAs to be tested (PCR primers
are given in supplementary table 3). 3) an SV40 late poly-adenylation signal amplified from pG5
vector (Promega).
Samples for the assay were constructed by using PCR. The followings are PCR primers used;
target-specific forward primer, 5’-GAA GGA GCC GCC ACC ATG-3’ followed by approximately 20-
base 5’-end target sequence; target-specific reverse primer, 5’-CAA TTT CAC ACA GGA AAC TCA-
3’ followed by approximately 20-base 3’-end target sequence; PMIR_CMV_F, 5’-GGG TCA TTA
GTT CAT AGC CCA-3’; Luc2CP_Luc_R, 5’-CAT GGT GGC GGC TCC TTC TTA GAC GTT GAT CCT GGC
GCT-3’; FSV40LPAS02, 5’-GTT TCC TGT GTG AAA TTG TTA TCC GCT GCA GAC ATG ATA AGA TAC
ATT G-3’; RSV40LPAS01, 5’-AGC AAG TTC AGC CTG GTT AAG ATC CTT ATC GAT TTT ACC AC-3’;
PMIR_CMV_Nested_F, 5’-GGG AGG AGA AGC ATG AAT TCA AGG-3’; LGT10L, 5’-AGC AAG TTC
AGC CTG GTT AAG-3’; FPCMV5, 5’-GCC ATG TTG GCA TTG ATT ATT GAC-3’; (The sequences in
bold type are complementary to the common tag sequences of the target-specific forward and
reverse primers, respectively).
Each target sequence was amplified with the designed target-specific forward and
reverse primers. The fragment for the CMV promoter and the Luc2CP gene was PCR-amplified
from pMIR_Luc2CP vector using the primer sets PMIR_CMV_F and Luc2CP_Luc_R. The fragment
for the SV40 late poly-adenylation signal (SV40LPAS) was PCR-amplified from pG5 vector
(Promega) using the primer sets FSV40LPAS02 and RSV40LPAS01. Overlapping PCR was carried
out to connect the target fragments with the CMV_Luc2CP-fragment and the SV40LPAS
fragment using the primer pair PMIR_CMV_Nested_F and LGT10L. PCR conditions were based
on those in our previous reports.
The fragment for the CMV promoter, Renilla luciferase gene and SV40LPAS was also PCR-
amplified from pRL-CMV using the primer sets FPCMV5 and RSV40LPAS01. All PCR products
were checked by agarose gel electrophoresis after the amplification.
CR Primers were designed flanking miRNA target sites in 3’UTRs of candidate target mRNAs
(supplementary table 1). A CMV-luciferase PCR fragment Fusion PCR was used to generate
constructs.
MicroRNA target validation by luciferase assay
miRNA target reporter assays were carried out in 96-well assay plates and were repeated three
times. Each target construct (0.2 µl), the Renilla luciferase fragment (0.2 µl) and pre-miRNA (2
pmol) were diluted to 95 µl with Opti-MEM (Invitrogen) followed by mixing 50 µl of 2%
Lipofectamine2000 (Invitrogen). After 20 min incubation at room temperature, the suspended
Hela cells (88,000 cells/55 µl) were mixed for transfection (total 200 µl). After 48h of
incubation, fire fly and Renilla luciferase reporters were sequentially measured using the Dual-
Glo Luciferase Assay system (Promega) according to the manufacture’s protocol. The reporter
activity for fire fly luciferase was normalized by that for Renilla luciferase.
Flow cytometry
48 hours after pre-miRNA transfection, cells were harvested and fixed in 70% ince cold ethanol.
Fixed cells were washed in PBS and then DNA stained (2.5 μg/ml propidium iodide, and 0.5
mg/ml RNase A in PBS). Flow cytometry analysis was done using a FACS Calibur (Becton
Dickinson, Franklin, NJ, USA) instrument following the manufacturer’s recommended protocol.
Data were collected and processed using the FlowJo FACS analysis software (Tree Star, Inc.,
Ashland, OR, USA).
Data deposition
All expression data has been deposited at the Center for Information Biology gene EXpression
database (CIBEX (9)). Accession numbers for the Illumina mRNA measurements are CBX46 (PMA
time-course), CBX45 (pre-miRNA over-expression), and CBX47 (52 transcription factor
knockdowns). The accession number for the Agilent miRNA array experiment is CBX49. The
small RNA sequences of Taft et al. (1) are deposited at DDBJ (Accessions: AIAAF0000001 -
AIAAF0055261, AIAAG0000001 - AIAAG0013956, AIAAH0000001 - AIAAH0046376,
AIAAI0000001 - AIAAI0087752, AIAAJ0000001 - AIAAJ0100819, AIAAP0000001 - AIAAP0061402,
AIAAQ0000001 - AIAAQ0033032, AIAAR0000001 - AIAAR0049623, AIAAS0000001 -
AIAAS0055455, AIAAT0000001 - AIAAT0061351).
Authors' contributions statement
MK carried out the Illumina mRNA and Agilent miRNA array experiments. Y. Tomaru performed the pre-
miRNA over-expression experiments. NN performed the luciferase reporter experiments and RT-PCR
confirmation of the mir-424-mir-503 pri-miRNA. Y. Takahashi performed the FACs experiments. TL
conceptualized some of the bioinformatic analysis. MdH provided the normalised miRNA tag counts
from the small RNA libraries. AK was involved in experimental testing. MS, JY, were involved in
supervision and general discussions. TL, JK, HS, YH and DAH were involved in conceptualization of
FANTOM4 and the choice of the THP-1 model. ARRF designed and analysed most of the experiments
(including the array profiling, over-expression, reporter assays and FACs experiments), carried out the
bioinformatic analysis and wrote the manuscript.

References for supplementary information
1. Taft RJ, Glazov EA, Cloonan N, Simons C, Stephen S, Faulkner GJ, et al. Tiny RNAs associated with
transcription start sites in animals. Nat Genet 2009 May; 41(5): 572-578.
2. Bolstad BM, Irizarry RA, Astrand M, Speed TP. A comparison of normalization methods for high
density oligonucleotide array data based on variance and bias. Bioinformatics 2003 Jan 22;
19(2): 185-193.
3. Gautier L, Cope L, Bolstad BM, Irizarry RA. affy--analysis of Affymetrix GeneChip data at the
probe level. Bioinformatics 2004 Feb 12; 20(3): 307-315.
4. Smyth GK, Yang YH, Speed T. Statistical issues in cDNA microarray data analysis. Methods Mol
Biol 2003; 224: 111-136.
5. Smyth GK. Linear models and empirical bayes methods for assessing differential expression in
microarray experiments. Stat Appl Genet Mol Biol 2004; 3: Article3.
6. Lin SM, Du P, Huber W, Kibbe WA. Model-based variance-stabilizing transformation for Illumina
microarray data. Nucleic Acids Res 2008 Feb; 36(2): e11.
7. Rosa A, Ballarino M, Sorrentino A, Sthandier O, De Angelis FG, Marchioni M, et al. The interplay
between the master transcription factor PU.1 and miR-424 regulates human
monocyte/macrophage differentiation. Proc Natl Acad Sci U S A 2007 Dec 11; 104(50): 19849-
19854.
8. Suzuki H, Fukunishi Y, Kagawa I, Saito R, Oda H, Endo T, et al. Protein-protein interaction panel
using mouse full-length cDNAs. Genome Res 2001 Oct; 11(10): 1758-1765.
9. Ikeo K, Ishi-i J, Tamura T, Gojobori T, Tateno Y. CIBEX: center for information biology gene
expression database. C R Biol 2003 Oct-Nov; 326(10-11): 1079-1082.
Supplementary legends
Supplementary figures:
Supplementary Figure 1 - Monocytic markers induced with microRNA
over-expression
The mRNA expression profiles of monocytic markers induced with PMA and upon over-
expression of the four pro-differentiative microRNAs (hsa-mir-424, hsa-mir-503, hsa-mir-222,
hsa-mir-155). Illumina array expression is shown relative to 0h for the time-course and relative
to the scrambled negative control transfection for the microRNA over-expression experiments.
The published PMA time course data was extracted from FANTOM4 EdgeExpressDB (22).
Supplementary Figure 2 – Combinatorial effect of four miRNA co-
transfection
A) Modest induction of CD14 by the four miRNA mix.
B) Pro-differentiative changes induced by individual miRNAs and from the four way mix.
Supplementary Figure 3 - The mRNAs of predicted microRNA targets are
down-regulated
Histograms showing the median fold change in mRNA levels of cells transfected with synthetic
pre-microRNAs relative to negative control transfections for predicted microRNA targets (red) or
all genes (black), and for varying strengths of predictions (blue bars). Both TargetScan (1) and
EIMMO (2) predictions are shown. Bin 0 corresponds to genes with prediction strengths
between >0 and <0.1, Bin 0.1 to values between >0.1 and <0.2 etc. Bin 1 is only used for
EIMMO (2) predictions with values greater than 1. TS_all and TS_cons correspond to all
TargetScan (1) predictions versus conserved only predictions. Prediction strength for
TargetScan corresponds to context-score as defined by the TS paper. Note mir-142 (the
microRNA that does not change levels during the differentiation has the smallest change).
Supplementary Figure 4 – qRT confirmation of mir-424-mir-503
polycistron
qRT-PCR confirmation of the transcript spanning mir424 and mir503. NOTE: RT- samples are
not detected (ct=40), indicating no DNA contamination.
Supplementary Figure 5 – mir-424-mir-503 target site in pri-mir-9-3
Location of a potential mir-424-mir-503 target site in the primary transcript of mir-9-3. Note: A
luciferase reporter construct containing this UTR was significantly down-regulated by both mir-
424 and mir-503 over-expression.
Supplementary tables:
Supplementary table 1 – Perturbed genes
Combined list of genes significantly perturbed in any of the microRNA over-expression experiments.
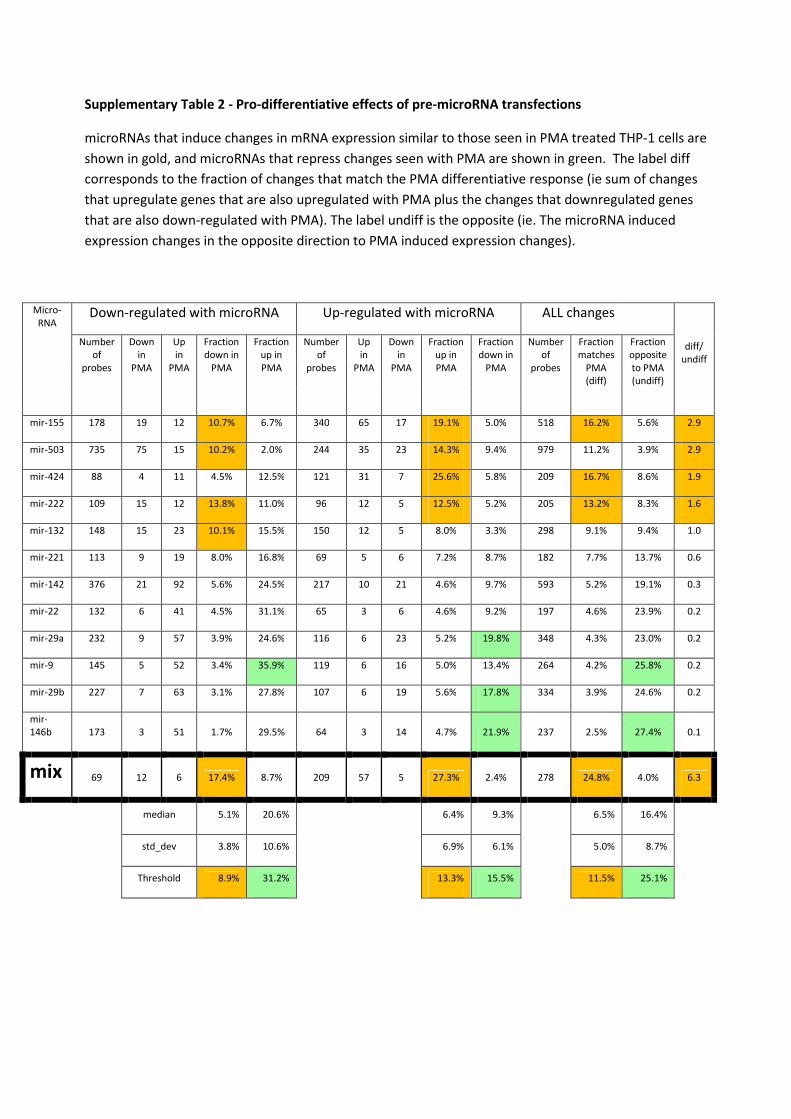
Supplementary Table 2 - Pro-differentiative effects of pre-microRNA
transfections
microRNAs that induce changes in mRNA expression similar to those seen in PMA treated THP-1 cells are
shown in gold, and microRNAs that repress changes seen with PMA are shown in green. The label diff
corresponds to the fraction of changes that match the PMA differentiative response (ie sum of changes
that upregulate genes that are also upregulated with PMA plus the changes that downregulated genes
that are also down-regulated with PMA). The label undiff is the opposite (ie. The microRNA induced
expression changes in the opposite direction to PMA induced expression changes).
Supplementary table 3 – Gene ontology enrichment
Gene ontology enrichments for genes up or down-regulated in THP-1 miRNA over-expression
experiments.
Supplementary table 4 – predicted direct targets down-regulated at the
RNA level
A list of predicted targets of all microRNAs tested that are supported by mRNA down-regulation (at least
0.75x that of control).
Supplementary table 5 – PCR primers used for 3’UTR luciferase
constructs
Fold change of targets tested by luciferase assay. PCR primers and amplicons sizes are included.
Supplementary Table 2 - Pro-differentiative effects of pre-microRNA transfections
microRNAs that induce changes in mRNA expression similar to those seen in PMA treated THP-1 cells are
shown in gold, and microRNAs that repress changes seen with PMA are shown in green. The label diff
corresponds to the fraction of changes that match the PMA differentiative response (ie sum of changes
that upregulate genes that are also upregulated with PMA plus the changes that downregulated genes
that are also down-regulated with PMA). The label undiff is the opposite (ie. The microRNA induced
expression changes in the opposite direction to PMA induced expression changes).
Micro-
RNA Down-regulated with microRNA Up-regulated with microRNA ALL changes
diff/
undiff
Number
of
probes
Down
in
PMA
Up
in
PMA
Fraction
down in
PMA
Fraction
up in
PMA
Number
of
probes
Up
in
PMA
Down
in
PMA
Fraction
up in
PMA
Fraction
down in
PMA
Number
of
probes
Fraction
matches
PMA
(diff)
Fraction
opposite
to PMA
(undiff)
mir-155 178 19 12 10.7% 6.7% 340 65 17 19.1% 5.0% 518 16.2% 5.6% 2.9
mir-503 735 75 15 10.2% 2.0% 244 35 23 14.3% 9.4% 979 11.2% 3.9% 2.9
mir-424 88 4 11 4.5% 12.5% 121 31 7 25.6% 5.8% 209 16.7% 8.6% 1.9
mir-222 109 15 12 13.8% 11.0% 96 12 5 12.5% 5.2% 205 13.2% 8.3% 1.6
mir-132 148 15 23 10.1% 15.5% 150 12 5 8.0% 3.3% 298 9.1% 9.4% 1.0
mir-221 113 9 19 8.0% 16.8% 69 5 6 7.2% 8.7% 182 7.7% 13.7% 0.6
mir-142 376 21 92 5.6% 24.5% 217 10 21 4.6% 9.7% 593 5.2% 19.1% 0.3
mir-22 132 6 41 4.5% 31.1% 65 3 6 4.6% 9.2% 197 4.6% 23.9% 0.2
mir-29a 232 9 57 3.9% 24.6% 116 6 23 5.2% 19.8% 348 4.3% 23.0% 0.2
mir-9 145 5 52 3.4% 35.9% 119 6 16 5.0% 13.4% 264 4.2% 25.8% 0.2
mir-29b 227 7 63 3.1% 27.8% 107 6 19 5.6% 17.8% 334 3.9% 24.6% 0.2
mir-
146b 173 3 51 1.7% 29.5% 64 3 14 4.7% 21.9% 237 2.5% 27.4% 0.1
mix 69 12 6 17.4% 8.7% 209 57 5 27.3% 2.4% 278 24.8% 4.0% 6.3
median 5.1% 20.6% 6.4% 9.3% 6.5% 16.4%
std_dev 3.8% 10.6% 6.9% 6.1% 5.0% 8.7%
Threshold 8.9% 31.2% 13.3% 15.5% 11.5% 25.1%
Supplementary Figure 1 - Monocytic markers induced with microRNA over-
expressionThe mRNA expression profiles of monocytic markers induced with PMA and upon over-expression of
the four pro-differentiative microRNAs (hsa-mir-424, hsa-mir-503, hsa-mir-222, hsa-mir-155). Illumina
array expression is shown relative to 0h for the time-course and relative to the scrambled negative
control transfection for the microRNA over-expression experiments. The published PMA time course
data was extracted from FANTOM4 EdgeExpressDB (22).
50
CD14
Supplementary Figure 2 – Combinatorial effect of four miRNA co-transfectionA) Modest induction of CD14 by the four miRNA mix.
B) Pro-differentiative changes induced by individual miRNAs and from the four way mix.
155 vs mix
222 vs mix7 62
mix
20
222
18 51
mix
66
155
BA
0
0 2 6
24
72
PMA timecourse miRNA overexpression
424 vs mix
503 vs mix
Any 4 vs mix30 39
mix
186
Any 4
7 62
mix
103
503
16 53
mix
19
424
NC0 1 2 4 6
12
24
48
72
96
miRNA
Over
expression
PMA time course
mir
-50
3
mir
-22
2m
ir-1
55
mir
-42
4
NC
mir
-mix
Supplementary Figure 3 - The mRNAs of predicted microRNA targets are
down-regulated Histograms showing the median fold change in mRNA levels of cells transfected with synthetic
pre-microRNAs relative to negative control transfections for predicted microRNA targets (red) or
all genes (black), and for varying strengths of predictions (blue bars). Both TargetScan (1) and
EIMMO (2) predictions are shown. Bin 0 corresponds to genes with prediction strengths between
>0 and <0.1, Bin 0.1 to values between >0.1 and <0.2 etc. Bin 1 is only used for EIMMO (2)
predictions with values greater than 1. TS_all and TS_cons correspond to all TargetScan (1)
predictions versus conserved only predictions. Prediction strength for TargetScan corresponds to
context-score as defined by the TS paper. Note mir-142 (the microRNA that does not change
levels during the differentiation has the smallest change).
0.6
0.7
0.8
0.9
1
1.1
1.2
1.3
Ts_all
TS-cons
eimmo
Ts_all
TS-cons
eimmo
Ts_all
TS-cons
eimmo
Ts_all
TS-cons
eimmo
Ts_all
TS-cons
eimmo
Ts_all
TS-cons
eimmo5p
all_probes
all_preds
0
0.1
0.2
0.3
0.4
0.5
TS eimmo
TS eimmo
TS eimmo
TS eimmo
TS eimmo
TS
eimmo5p
mir9 mir22 mir29a mir29b mir132 mir142
0.5
0.6
0.6
0.7
0.8
0.9
1
1.1
1.2
1.3
Ts_all
TS-cons
eimmo5p
Ts_all
TS-cons
eimmo
Ts_all
TS-cons
eimmo
Ts_all
TS-cons
eimmo
Ts_all
TS-cons
eimmo
Ts_all
TS-cons
eimmo
mir146b mir155 mir221 mir222 mir424 mir503
all_probes
all_preds
0
0.1
0.2
0.3
0.4
0.5
0.6

Supplementary Figure 4 – qRT confirmation of mir-424-mir-503 polycistronqRT-PCR confirmation of the transcript spanning mir424 and mir503. NOTE: RT(-) samples are not
detected (ct=40), indicating no DNA contamination.
0
50
100
150
200
250
300
1 2 3 4 5
pgDNA
Amplicon
100pg gDNA
RT+
RT-
Primer_1+4Primer_1+4Primer_1+4Primer_1+4 Primer_2+4Primer_2+4Primer_2+4Primer_2+4 Primer_3+4Primer_3+4Primer_3+4Primer_3+4 Primer_2+5Primer_2+5Primer_2+5Primer_2+5 Primer_3+5Primer_3+5Primer_3+5Primer_3+5
Human Genomic DNAHuman Genomic DNAHuman Genomic DNAHuman Genomic DNA0.1/well0.1/well0.1/well0.1/well
rep1 32.734.2
rep1 39.638.2
rep1 36.637.6
rep1 32.333.0
rep1 33.232.9rep2 34.3 rep2 37.9 rep2 36.9 rep2 33.4 rep2 31.7
rep3 35.5 rep3 37.0 rep3 39.4 rep3 33.2 rep3 33.7rep1 37.4 rep1 37.5 rep1 38.3 rep1 31.7 rep1 31.9THP1_timecourse_pool_RT(+)THP1_timecourse_pool_RT(+)THP1_timecourse_pool_RT(+)THP1_timecourse_pool_RT(+)
total RNA total RNA total RNA total RNA 2.52.52.52.5ng/wellng/wellng/wellng/well
rep1 37.436.9
rep1 37.538.6
rep1 38.338.5
rep1 31.731.5
rep1 31.931.8rep2 35.2 rep2 40.0 rep2 39.1 rep2 31.4 rep2 31.3
rep3 38.2 rep3 38.4 rep3 38.2 rep3 31.5 rep3 32.2
THP1_timecourse_pool _RT(THP1_timecourse_pool _RT(THP1_timecourse_pool _RT(THP1_timecourse_pool _RT(----))))total RNA total RNA total RNA total RNA 2.52.52.52.5ng/wellng/wellng/wellng/well
rep1 40.040.0
rep1 40.040.0
rep1 40.040.0
rep1 40.040.0
rep1 40.040.0rep2 40.0 rep2 40.0 rep2 40.0 rep2 40.0 rep2 40.0
rep3 40.0 rep3 40.0 rep3 40.0 rep3 40.0 rep3 40.0
Amplicons: FWD REV size Genomic span1: mir424_TO_mir503 primer1 primer4 381 chrX:133508023-1335084032: TSS+100_TO_mir503 primer2 primer4 564 chrX:133508023-1335085863: TSS2_TO_mir503 primer3 primer4 619 chrX:133508023-1335086414: TSS+100_TO_mir424 primer2 primer5 250 chrX:133508337-1335085865: TSS2_TO_mir424 primer3 primer5 305 chrX:133508336-133508641
primer1 GGGATACAGCAGCAATTCATGTprimer2 CACCTGCAGCTCCTGGAAATCAAAprimer3 CGTTGTTCCAAGATTCATCCTCAGGGprimer4 TTACCCTGGCAGCGGAAACAATACprimer5 GGTATAGCAGCGCCTCACGTTT
Supplementary Figure 5 – mir-424-mir-503 target site in pri-mir-9-3Location of a potential mir-424-mir-503 target site in the primary transcript of mir-9-3. Note: A
luciferase reporter construct containing this UTR was significantly down-regulated by both mir-424 and
mir-503 over-expression.
5'UGCUCACAGCAGGCAGGGCCUAGACCCGGGAGCCAUGCUGCUGUGCUGU3' (position in AK125292, approx 1264). | . | .||||||.
3'gacgucuugacaagggcgacgau5' (mir-503). . | ||||||||
3'aaguuuuguacuuaacgacgac5' (mir-424)
Note: Watson-crick base pairing marked with |G-U base pairing is marked with .