induced polarization method - kaukau.edu.sa/files/0003035/subjects/ip.pdf · induced potentials...
TRANSCRIPT

GEOL 335.3
Induced Polarization Method
Principles;
Areas of application;
Measurement;
Equipment and layout;
Interpretation;
Case histories.
Reading:� Reynolds, Chapter 9.
� Telford et al., Chapter 9.
GEOL 335.3
Induced Potentials
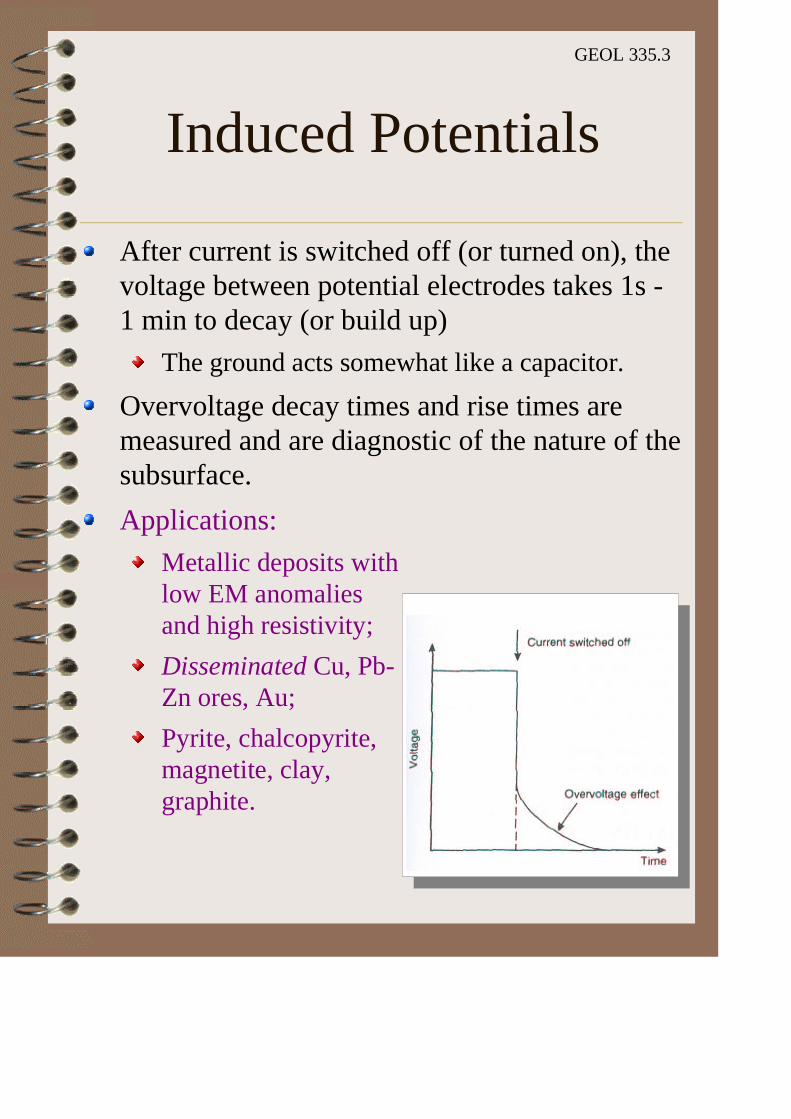
After current is switched off (or turned on), the voltage between potential electrodes takes 1s - 1 min to decay (or build up)
The ground acts somewhat like a capacitor.
Overvoltage decay times and rise times are measured and are diagnostic of the nature of the subsurface.
Applications:
Metallic deposits with low EM anomalies and high resistivity;
Disseminated Cu, Pb-Zn ores, Au;
Pyrite, chalcopyrite, magnetite, clay, graphite.

GEOL 335.3
IP Techniques
Time domain (pulse transient);
Frequency domain (using harmonic signals):
Traditional variable-frequency IP (using two or more frequencies of < 10 Hz);
Phase domain (measure phase delays between current and voltage);
Spectral IP (measure phases and amplitudes at frequencies 10-3 to 4·103 Hz).
Using conventional resistivity arrays
Most commonly double-dipole configuration;
Schlumberger arrays for broad reconnaissance surveys.
GEOL 335.3
Origin of IPMacroscopic
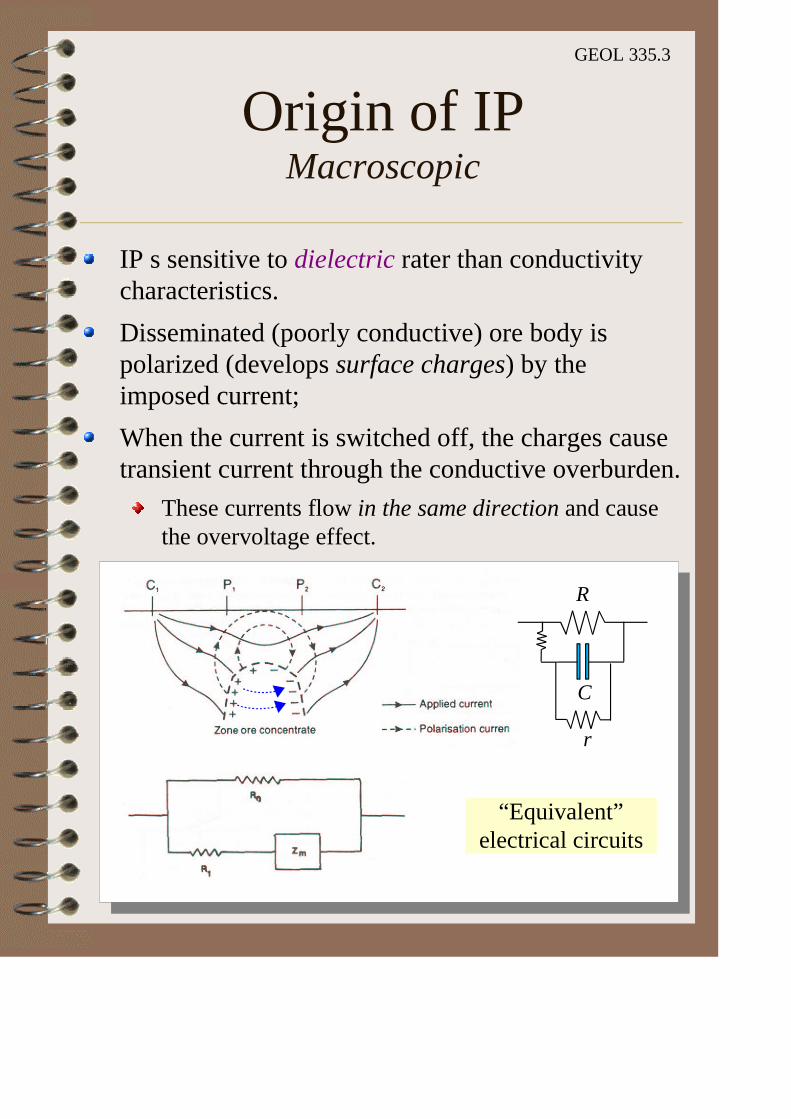
IP s sensitive to dielectric rater than conductivity characteristics.
Disseminated (poorly conductive) ore body is polarized (develops surface charges) by the imposed current;
When the current is switched off, the charges cause transient current through the conductive overburden.
These currents flow in the same direction and cause the overvoltage effect.
“Equivalent” electrical circuits
R
C
r

GEOL 335.3
Origin of IPMicroscopic
Grain (and electrode) polarization:
Electrolytic (membrane) polarization:

GEOL 335.3
Time-domain IP
Measuring apparent chargeability (M)Apparent chargeability (M
a) increases with increasing
duration of the pulses (~ 3-5 s);
Graphite has Ma.=11.2 ms, magnetite - 2.2 ms at 1 s
integration.M=
V p
V 0
mVV
or %
Overvoltage
Polarisation voltage
M a=
�t 1
t 2
V P t dt
V 0
msec
GEOL 335.3
Variable-frequency IP
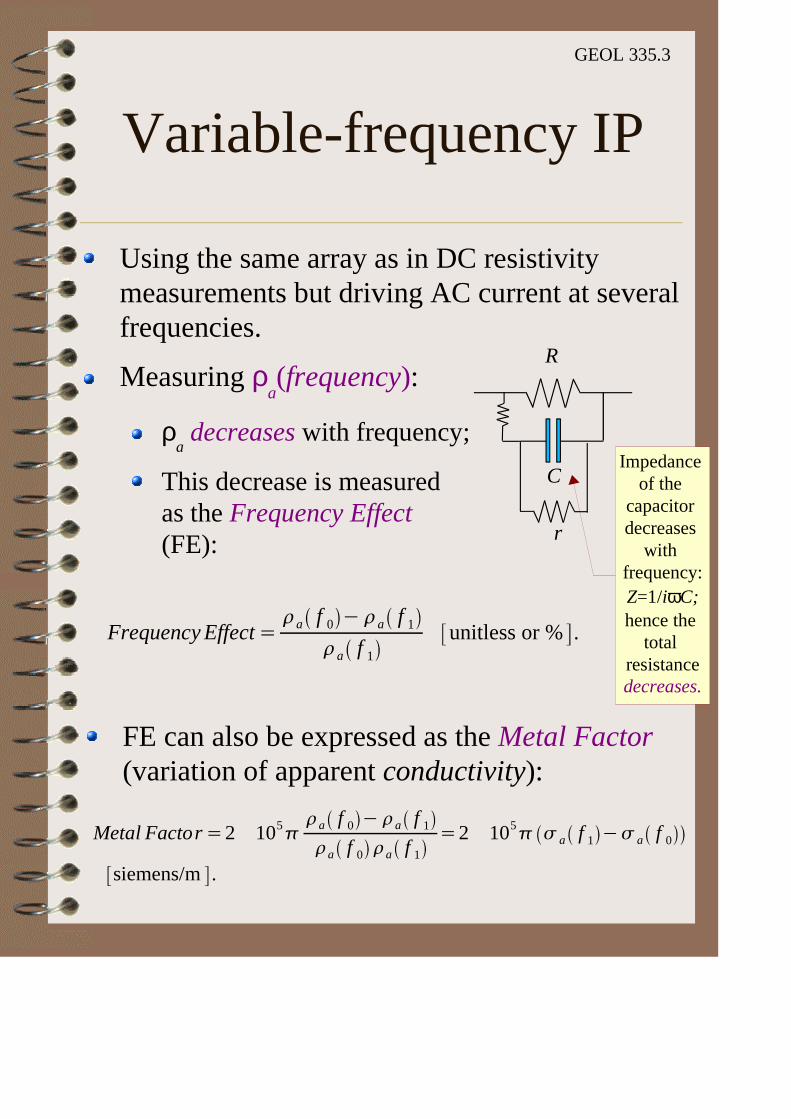
Using the same array as in DC resistivity measurements but driving AC current at several frequencies.
Measuring ρa(frequency):
ρa decreases with frequency;
This decrease is measured as the Frequency Effect (FE):
Impedance of the
capacitor decreases
with frequency:Z=1/iωC;hence the
total resistancedecreases.
Frequency Effect=�a f 0 ��a f 1
�a f 1
unitless or % .
Metal Factor=2 × 10⁵��a f 0 ��a f 1
�a f 0 �a f 1
=2 × 10⁵� � a f 1 �� a f 0
siemens/m .
R
C
r
FE can also be expressed as the Metal Factor (variation of apparent conductivity):

GEOL 335.3
Spectral (complex resistivity) IP
Using AC current at a range of frequencies from 30 to 4000 Hz.
Measuring complex impedance:
Z � =
U �
I �K.
The Cole-Cole model for complex resistivity:
Z � = �0 1�M 1�1
1�i��c = Z e i�
Geometric factor of the array
Relaxation timeChargeability
DC resistivity
Typical values:M: 0-1 (depending on mineral content);τ: 10-4 - 104 (depending on grain size);c: 0.2 - 0.6 (depending on grain size distribution)
GEOL 335.3
Cole-Cole relaxation spectra
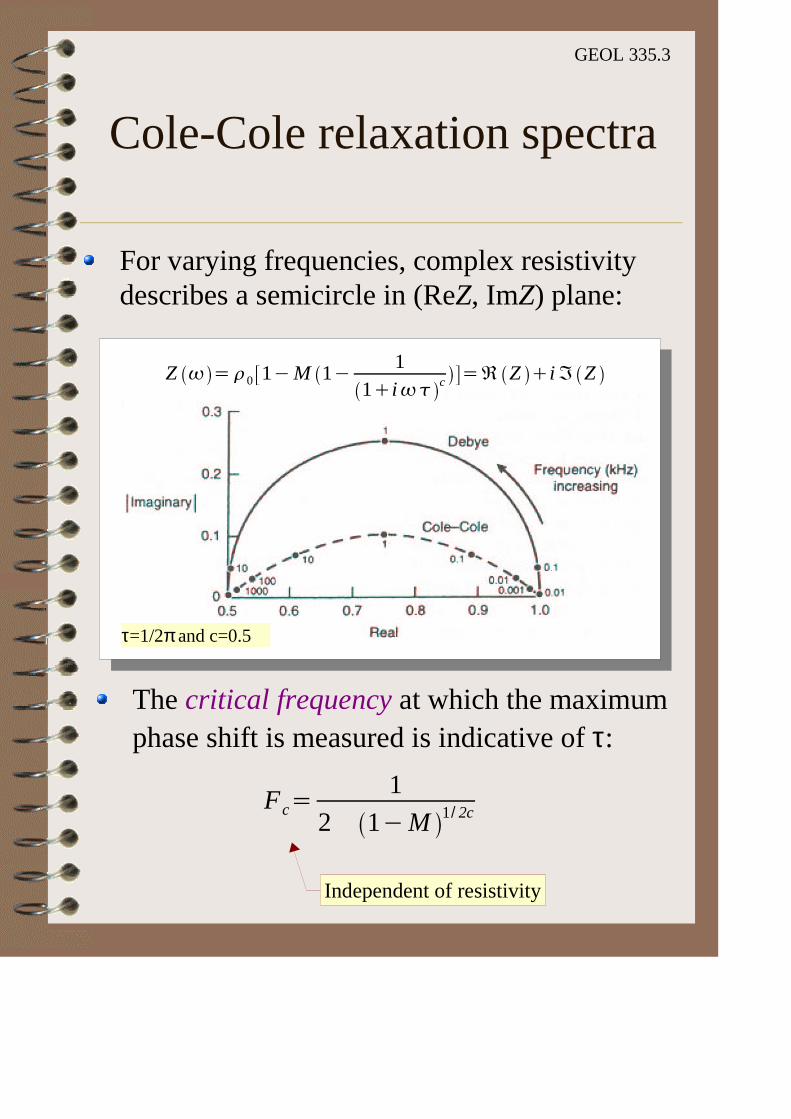
For varying frequencies, complex resistivity describes a semicircle in (ReZ, ImZ) plane:
Z � =�0 1�M 1�1
1�i�� c =� Z �i� Z
The critical frequency at which the maximum phase shift is measured is indicative of τ:
Independent of resistivity
τ=1/2π and c=0.5
Fc=1
2 � 1�M 1 / 2c
GEOL 335.3
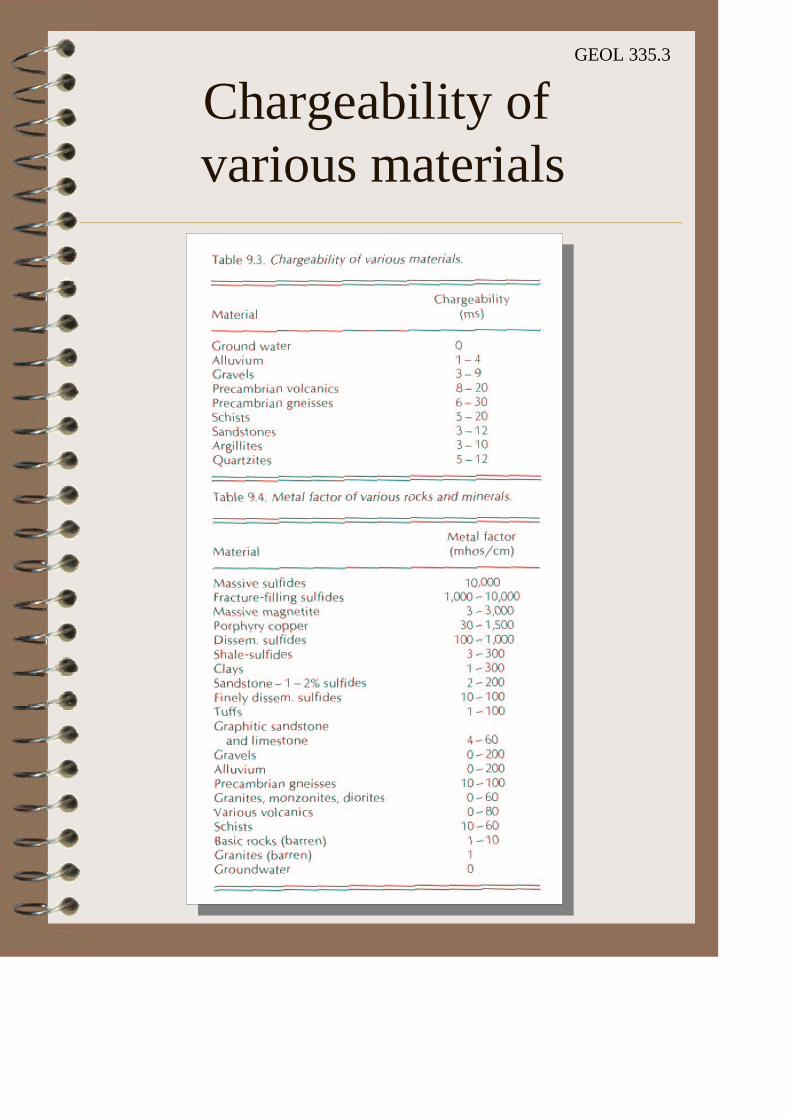
Chargeability of various materials

GEOL 335.3
Displays of IP data
Profiles and maps of apparent chargeability (time-domain IP);
Pseudo-sections (combined with ρa)

GEOL 335.3
Lab Case History(Ogilvy and Kuzmina, 1972)
For saline water lens,both ρ
a and M
a
show only broadanomalies
Ratio of overvoltages at 0. 5 and 5 minutesis a good indicator
Freshwater lensis well detectedby chargeability
GEOL 335.3
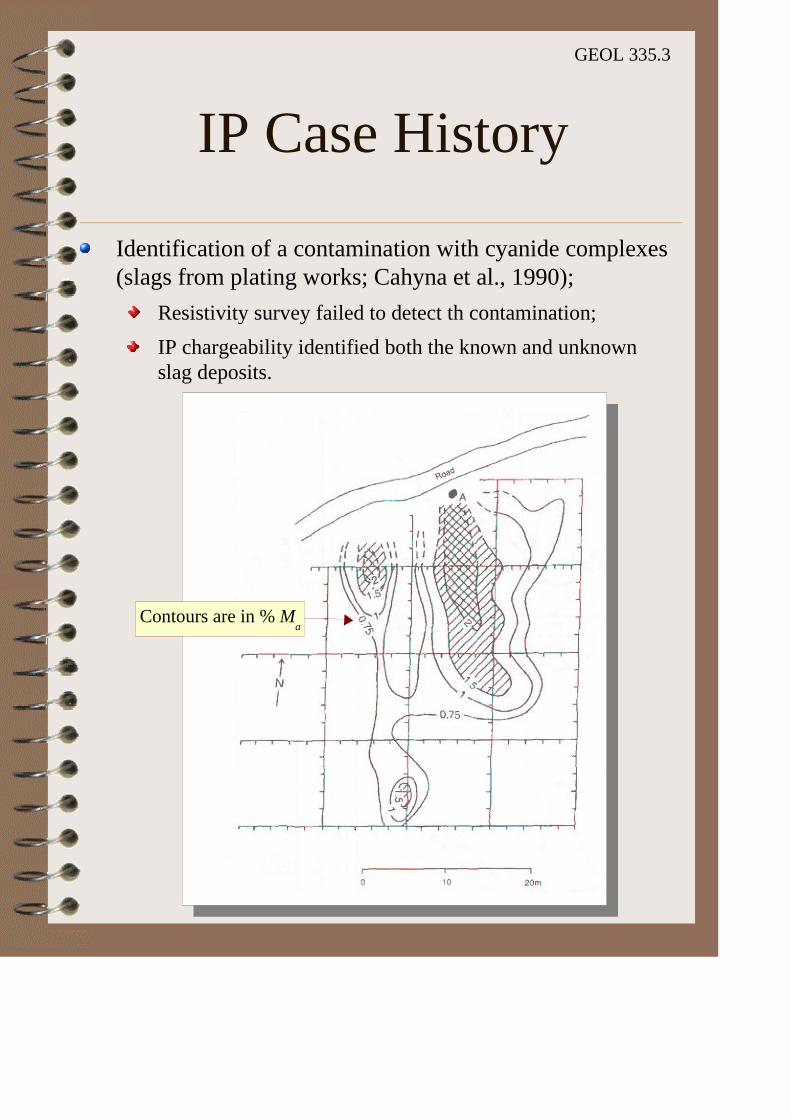
IP Case History
Identification of a contamination with cyanide complexes (slags from plating works; Cahyna et al., 1990);
Resistivity survey failed to detect th contamination;
IP chargeability identified both the known and unknown slag deposits.
Contours are in % Ma