indirect rule - clausen.berkeley.edu · indirect rule was also doctrine of rule over native...
TRANSCRIPT
INDIRECT RULE
Raul Sanchez de la Sierra∗
Gauthier Marchais†
Soeren Henn‡
March 3rd, 2019
Abstract
When governing foreign populations, ruler often create their own administration to raise taxes, administer justice, for intelligence purposes, and to maintain social control - direct rule. Historically, however, rulers have often delegated power to the political institutions that ex-isted prior to their conquest, creating indirect rule. This choice had important consequences for state development: while direct rule implies the creation of a new and persistent admin-istrative capacity as documented by historians, indirect rule may create local despots, which can have detrimental effects on political institutions in the long-run (Acemoglu, Chaves, Osafo-Kwaako, and Robinson, 2014, Mamdani, 1996). A fundamental challenge with exist-ing cross-country empirical work is that the number of recorded country level episodes of this institutional change is small, and experiences are very context-dependent. Therefore, it has proven difficult to systematically understand the sources, or impacts, of direct and indirect rule. To address this challenge, we collect a novel dis-aggregated panel data set covering the histories of 456 Chiefs in 106 villages, and 508 episodes of armed groups’ village governance in eastern Congo since 1990, thereby obtaining a large number of “regime changes.” We use this data to achieve three goals. First, we define and operationalize indirect and direct rule across multiple dimensions of governance. Second, we explain when armed groups are more likely to develop their own administration. Third, we use survey self-reported data and implicit association tests to provide suggestive evidence of the effects of indirect rule on the legitimacy of chiefs which have worked for an armed group, and “native” institutions in general. We find that armed groups frequently engage in direct and indirect rule along mul-tiple margins. Armed groups are more likely to co-opt pre-existing traditional chiefs when the chiefs are of the same ethnic group as the population the armed group intends to govern, and when the group is of a different ethnic group than such population. Furthermore, armed groups rely more on direct rule as their tenure in power increases.
JEL Classification: D72, D74, O12, N27Keywords: Economic Development, Conflict, Elite Control, Political Economy.
∗Corresponding author. Assistant Professor, UC Berkeley and Harvard Academy Scholar. This project wassupported by Private Enterprise Development in Low income countries, and the International Center for Taxationand Development. David Ifkovits, Matt Pecenco, and Carlos Schmitd Padilla provided excellent research assistance.Aimable Amani Lameke, Adama Kabore, Anne-Laure van der Wielen, and Marakuja Kivu Research providedexcellent management for this project’s operations. Sanchez de la Sierra is especially thankful to Mick Moore andWilson Prichard for their continuous support, and to Adam Random for tireless administrative support.†Institute of Development Studies, University of Sussex‡Harvard University, Ph.D candidate, Political Economy & Government.
2

1 Introduction
Kings, states and empires conquering foreign populations need to have administrative state ca-
pacity in order to raise taxes, gather intelligence, and enforce property rights. Rulers can perform
these functions either by creating their own administration, or by enlisting pre-existing local au-
thorities, who usually have more legitimacy and can mobilize intrinsic motivation, to administer
on their behalf, a practice known as indirect rule (Greif, 2008, Mamdani, 1996). Yet, episodes of
direct and indirect rule are poorly documented, because few records from periods prior to incor-
poration into larger entities survived (if they existed at all). More generally, armed groups also
face a similar trade-off. Recent scholarship on armed conflict and civil wars has paid attention to
the forms of authority that emerge during armed conflict (Arjona, Kasfir, and Mampilly, 2017,
Kalyvas, 2006, Mampilly, 2011, Wood, 2003). Yet armed factions decide in certain cases to dele-
gate power and administration to pre-existing political entities, and instead to develop their own
integrated administrations. Why rulers of states and armed groups choose to co-opt the political
institutions of foreign conquered populations or create their own is not well understood.
As a foundation for this study, we managed data collectors in order to assemble a yearly panel
data set on the institutions of rule created by violent actors in 106 villages of Nord Kivu, in the
eastern Democratic Republic of the Congo (DRC) that have changed “regime” multiple times over
the last 25 years. The DRC is considered a “failed state,” and the the presence of armed groups
who govern conquered villages provides a suitable environment to study the causes of indirect and
direct rule.1 The data allow us to trace the evolution of the institutional arrangements created by
armed groups when they govern new territory.
In this paper, we exploit the variation of community-level, 256 episodes of village governance
created by armed groups and traditional Chiefs over the past 25 years in 106 villages.2 We do so
in order to achieve three goals.
Our first step is to develop an approach to conceptualize direct and indirect rule in the data.
Drawing on the trade-offs faced by armed groups, the panel dataset we thus collected, as well as
600 pages of qualitative fieldwork we gathered through local researchers, we establish that the
1Source: Fund For Peace (2013). Several authors have recently challenged the term failed state for DRC. SeeEngelbert and Tull (2013) and Hoffmann (2014). See United Nations Security Council (2002), Nest (2011), Sanchezde la Sierra (2014) Stearns (2011), Verweijen (2013), the Usalama project. See also the RRMP program evaluationreports.
2For some variables, we also have additional 133 villages in South Kivu, totaling 508 episodes.
3

type of administration that armed groups create in their territories varies starkly along multiple
dimensions and identify such dimensions. Consistent with our qualitative work, we consider 7
dimensions of rule, and project them onto a two-dimensional space of direct and indirect rule -
since more direct rule can, in theory, also be associated with more indirect rule.
We first establish that armed groups deploy a sophisticated administration of direct rule and
characterize its forms, and that they also often rely on village traditional chiefs instead. Armed
groups often collect taxes themselves (head tax, toll tax, mill tax, market tax), but they often
request the village traditional chief to collect such taxes for them. Armed groups often organize
the recruitment of labor themselves, but they also often ask the village traditional chief to orga-
nize them for the group. Similarly armed groups sometimes conduct propaganda campaigns to
increase their legitimacy in the village, but they often delegate such efforts to the chief. They also
often administer the entire village, have written administration documents, a written constitution,
contracts, and are directly in charge of village affairs by administering justice. Alternatively, they
can delegate this to the traditional chief, although they do this less often. Armed groups often
replace the chief as the figure of the village political power, but they equally often delegate the
power to the chief. In addition, armed groups often provide public services (mostly security), and
often penetrate village affairs by regulating economic activity, creating sometimes local markets,
regulating population movement, or holding local monopolies. We develop a systematic approach
to measure the extent to which they create direct rule along such dimensions, or pressure the chief
to do them, indirect rule, consistent with Sanchez de la Sierra (2017).
Having established the reliance of armed groups on direct and indirect rule, we then propose to
explain this institutional outcome. We identify the conditions under which indirect rule is going
to be more profitable to outside groups — when the village Chief has a comparative advantage
over the group to extract resources from his villagers — and test this implication using the panel
data we collected.
We find that armed groups are more likely to prefer indirect rule when the chief has better
“technology” compared to the group. Chiefs who share ethnic ties with the population to be
governed are more likely to be requested to take on roles of indirect rule for the armed group
than chiefs who do not. Armed groups who share ethnicity with the population, in turn, are more
likely to provide public services for the village themselves. Furthermore, the decision to co-opt
traditional chiefs is not constant over time: the longer an armed group is in power, the more they
4

are likely to develop direct rule. This effect comes mostly by taking over the roles of taxation,
administration, and justice in the village.
Finally, we examine the impact of indirect rule on the subsequent ability of traditional Chiefs
to rule. Since indirect rule usually pushes the chiefs beyond their “optimal” level of extraction
constrained by the need to sustain their own legitimacy and accountability, traditional chiefs’
ability to rule can be eroded by episodes of indirect rule. We measure detailed characteristics of
Chiefs, and the population attitudes towards different Chiefs after the episode took place, using
surveys and implicit association tests. We find no evidence that exposure to indirect rule creates
resentment among the population, nor undermines the traditional chiefs’ ability to govern.
The outcome of our research has implications for research and policy on institutional choice.
Local leaders, often traditional Chiefs, can use a combination of mechanisms, rituals, and spiritual
power to solve collective action problems, and thus improve public good provision and distribute
resources in the presence of incomplete contracts (Flannery and Marcus, 2012). Outside rulers
and armed groups, whose source of power usually relies on coercion and of foreign systems of be-
liefs, are mostly unable to activate such mechanisms, and are thus usually limited to the incentive
effects of coercion and threats of violence. Rulers of states and armed groups more generally, rec-
ognizing the legitimacy held by traditional chiefs, often try to exploit it by installing indirect rule
and delegating local administrative duties such as collecting taxes, intelligence, mobilizing recruits
and the provision of public goods. Indirect rule was also doctrine of rule over native populations
in the colonial era. Recent research has shown that, even in empires that championed indirect rule
as their central doctrine, modes of rule varied significantly Boone (2003). Indirect rule has been
observed in cases where the conquering military actor is a full-fledged state with a political and
administrative capacity that is independent (at least at the onset) from the conquered societies —
for instance, the US invasion of Irak is often described as one such episode (Hechter and Kabiri,
2010).3 The mechanics of this choice have been examined in economics theoretically, in Padro
I Miquel and Yared (2012).
A growing literature across social sciences examines the formation of state capacity. Besley
and Persson (2009) examine the origins of fiscal and legal capacity in Europe, and argue that state
3Yet knowledge of the institutional origins of armed factions in conflict zones such as eastern DRC does notalways warrant this assumption of “foreign political entities.” In most contemporary conflicts, not some conqueringand ruling entities are part of conquered entities from the outside. Indeed, many armed groups have deep socialand institutional bases in the societies in which they emerged and evolve, and are a part of larger power networksthat span political, economic and military spheres (Sanchez de la Sierra, 2017).
5

capacity is the outcome of a dynamic choice by rulers interested in extracting resources in the long
run. However, state capacity is also the outcome of a balance of power between rulers, and the
administrators, who have the power to implement policy — or refrain from doing so (Greif, 2008).
Rulers have historically confronted the problem of how to select, and how to manage administra-
tors. When administrators have local power to mobilize resources locally, they can be a useful
ally of the ruler, but by the same token they can also create most harm by refraining to imple-
ment their policy or by mobilizing forces against the ruler. Rulers have solved this problem by
attempting to undermine the power of administrators vis a vis the ruler — with for instance, the
creation of competition between administrators, rotations systems. A low-cost approach to build
an administration that rulers often engaged with is to build alliances with local power-holders,
who have local sources of legitimacy and power. These local power holders kept their popula-
tions under control and collected taxes, in exchange for the technology of coercion provided by
the rulers “monopoly of violence.” However, local power holders have little loyalty towards the
central ruler and poor incentives to perform. They have thus often colluded among themselves
and with the population against the ruler. Thus, rulers interested in extracting more resources,
and especially with a longer time horizon, have historically created state capacity by “vertically
integrating.” Local rulers were replaced by agents of the central administration sent by the ruler,
creating direct rule (Tilly, 1990). While this latter form of governance is likely to increase the
power of the ruler over the long run, it is also more costly to develop, and thus was not always
the preferred strategy (Mamdani, 1996).
A significant body of evidence points to the detrimental effects of indirect rule on development,
and in particular, the poorest segments of the population (Acemoglu, Chaves, Osafo-Kwaako, and
Robinson, 2014, Mamdani, 1996). Indirect rule often pins the chief against the population cre-
ating long-run animosity and conflict, reducing Chief’s ability to govern and solve coordination
problems. The legitimacy of Chiefs derives historically from their (natural and supernatural) ca-
pacity to provide goods (such as rain, agricultural produce, successful mine extraction, protection
from thieves) and the ancestral justification to their power (Flannery and Marcus, 2012). Their
legitimacy crucially hinges on the reciprocal gift exchanges that the Chief must sustain with their
population. With indirect rule for an outside ruler who shares little ties and accountability with
the population to be governed, this channel can be broken, as chiefs become accountable not
to their communities, but to an external, usually extractive ruler. These external rulers (armed
6

groups, colonial states) most often provide the coercive means to support to the Chiefs efforts to
maximize resource and labor extraction, beyond optimal “legitimate” levels that the traditional
chiefs would have otherwise chosen given their initial accountability links.
The remainder of the paper is organized as follows. Section 2 provides background. Section 3
presents the conceptual approach. Section 4 presents the approach to data collection and the data.
Section 5 examines the variation in rule in the data and introduces our measure of direct rule and
indirect rule. Section 6 examines the determinants of direct rule, and of indirect rule. Section 7
presents the analysis of the impact of indirect rule. Section 8 presents a discussion on the data
collection methodology proposed in this paper. Finally, Section 9 concludes.
2 Background: governing foreign populations in Eastern
Congo
Eastern DRC presents a varied “political topography” inherited from a complex institutional his-
tory. Pre-colonial Eastern Congo was characterized by decentralized political entities, in contrast
to neighboring Rwanda where much more centralized forms of political organization prevailed
(Chretien, 2000, Newbury, 1992). Political authority was organized around lineage systems and
small Chiefdoms, but remained highly decentralized (Newbury, 2009). Regional conquests in the
19th century, followed by the colonial era, introduced “extractive” forms of rule in the region,
which relied heavily on local intermediaries, and particular chiefs, to mobilize resources. While in
certain areas, the colonial state directly appropriated the means of production — land — it applied
indirect rule in less lucrative areas or areas where it did not have sufficient administrative capacity.
Those areas were integrated into the colonial state by organizing native populations into ethnic
constituencies under the leadership of traditional chiefs, tasked with mobilizing resources-taxes
and labor — and maintaining order (Hoffmann, 2014, Mamdani, 2012). After decolonization, the
newly independent state maintained and reproduced the modes of governance that had been set up
during the colonial era (Hoffmann, 2014). As the post-colonial Mobutist state collapsed in the late
1990’s, multiple actors, international business networks and various armed factions, attempted to
assert territorial and political control over the resource rich East.
The Second Congo War (1998-2003) led to the creation of a large number of armed groups.
7

In 1998, the Rassemblement Congolais pour la Democratie (RCD) launched an offensive to over-
throw the then DRC president in office, Laurent-Desire Kabila. The RCD struggled to dominate
the rural areas, where it faced resistance by the self-defense groups known as the Mayi-Mayi and
by the Forces De Liberation du Rwanda (FDLR) among other groups. More than thirty armed
groups were active, mostly in the east of the country, and nine foreign armies intervened during
the conflict. This conflict weakened the Congolese state and led to the implantation of a large
number of armed groups and criminal networks, many of which persisted beyond the official end
of the war in 2003. The Congolese state struggled to regain control over the Eastern Provinces
in the “post-conflict” period (2003-2017). Despite the official end of the war, they remained af-
fected by recurring armed conflict, with a succession of large scale rebellions (CNDP, M23), larger
armed groups such as the Forces De Liberation du Rwanda (FDLR) and myriads of local self
defense groups fighting for control over territory and population in the rural areas. Today, armed
groups control large areas of territory in the East. In some districts they control most of the ad-
ministrative divisions (Shabunda, Mwenga, Fizi, Walikale, Lubero, Beni, Masisi, and Rutshuru).4
Between May 2012 and November 2013, a new armed group, the M23, established its own control
of a large territory, and created their administration, which included a Ministry of the Interior,
of Foreign Affairs, and of Agriculture. Armed groups systematically govern territory, it is thus no
surprise that they are aware of the challenges to administer such territory: “When you wage war,
when you occupy a territory, you have to administrate it, control it, and secure it” (Col. Sultani
Makenga, M23).5 To finance their operations, armed groups collect taxes on economic activity in
the territory they control. To fill their ranks, armed groups frequently recruit civilians. To obtain
intelligence, they regularly cooperate with well-connected civilians who share information.
Several authors have documented how armed factions deployed very similar modes of gover-
nance to those of the colonial and post-colonial state, relying on local authorities — in particular
village Chiefs — to mobilize resources and maintain a decentralized form of government (Hoff-
mann, Vlassenroot, and Marchais, 2016, Morvan, 2005). For example, the Mayi-Mayi Padiri, one
of the largest factions of the second Congolese War, instituted a highly centralized administration,
the “administration des forets”, whereby village Chiefs were tasked with collecting taxes and re-
4In Shabunda, the Raia-Mutombokis controlled 95% of the territory in 2012. See for instancehttp://radiookapi.net/actualite/2013/02/28/shabunda-la-milice-raia-mutomboki-occupe-95-du-territoire-selon-son-administrateur/.
5http://www.timesfreepress.com/news/local/story/2012/sep/22/congo-m23-rebels-accused-forming-parallel-governme/88678/
8

cruiting labor for the organization (Hoffmann, 2014, Morvan, 2005). Preparatory research carried
out for this project suggests that numerous distinct armed factions also practice various forms of
indirect rule, and that their practices vary in response to the opportunities they face in different
areas. Table 1 presents the type of governance arrangements by armed groups in 239 villages of
North and South Kivu where we collected such data. Covering the years 1995 to 2012, the sample
captured 508 episodes of armed group rule at the level of a village. The table shows that there is
substantial variation in the type of institution chosen, both across and within groups. The FDLR
is disproportionately more likely to create direct rule, the Congolese Army and the Mayi-Mayi’s
to create indirect rule, and the Raia Mutomboki to share power with traditional Chiefs. Further-
more, across episodes but within armed group, all groups recorded both indirect rule, direct rule,
and shared arrangements.
3 Conceptualizing the analysis of indirect rule
In this section, we present the conceptual framework for analyzing indirect rule. Before doing, so
we begin with an example that crystalizes the trade-offs faced by rulers of armed groups governing
foreign populations.
3.1 Motivating Example: Indirect rule by the Nduma Defense of
Congo
The example of the Nduma Defense of Congo-Guidon crystalizes the essence of the argument.6.
The region that came under control of the NDC, like many rural parts of eastern DRC, is
marked by extremely difficult terrain. Establishing and maintaining military control over such
areas is costly, one which neither the colonial nor post-colonial state were able to achieve (Herbst,
2000). Thus, with limited financial, logistical and military resources, the geographical allocation
of military resources is a crucial strategic and financial imperative, and one which can determine
the fate of a non-state rebel group. In turn, the distribution of these resources can affect the
6This example draws extensively on work conducted for Sanchez de la Sierra (2017). It draws on qualitativeinterviews with villagers, village leaders, village elders, as well as combatants and commanders (active and inactive)of the following groups between February and July 2015: Nduma Defense of Congo Guidon, Mayi-Mayi Padiri,Raia Mutomboki, Mayi-Mayi Uvira, M23, Mayi-Mayi APCLS. The following section summarizes the result fromethnographic interviews.
9

armed faction’s administrative capacity, and, when armed group rule extends in time, have far
reaching consequences in terms of political, economic and social trajectories of entities subjected
to armed group rule.
Among the numerous reasons invoked by commanders and members of armed groups to explain
the distribution of military means, military strategy and the need to mobilize resources taxes and
labour feature most prominently. This is not particularly surprising given the limitations armed
groups face in terms of finances and military capacity, but also the context of extreme poverty:
generating revenue is vital both for the survival of the armed group as an enterprise, but also for
its members and their dependents. The NDC deploys soldiers and weapons in strategic locations,
in order to be able to counter attacks enemy factions.7 A significant part of the resources are
devoted to controlling the the mines and the larger trading centers. According to the former T5
(director of communications) of the NDC, the NDC initially sent delegations to all the villages
that fell under its control, with the intention of leaving 1-2 soldiers per village. Following the
territorial expansion of the group, troops were soon concentrated in the larger urban centers and
around the mining areas, resulting in strong geographical imbalances in the distribution of military
and administrative resources.8 The distribution of resources echoes the highly unequal geographic
distribution of military and administrative resources by both the colonial and post-colonial states,
which faced similar logistical constraints and objectives (Boone, 2007, Herbst, 2011).
The NDC’s modes of administration of economic, social and political activity also reflected
the necessity of establishing legitimacy for the group’s rule over civilian populations. Like many
of the rebel groups that have controlled territory in eastern DRC, the NDC set up an elaborate
apparatus of taxation and resource extraction (Sanchez de la Sierra, 2017, Stearns, 2011). The
right to access mining sites is taxed, as well as their daily production (by searching and weighting
each creuseur’s production at the exit of the mining site), a mode of taxation which armed groups
have applied extensively throughout the region (Sanchez de la Sierra, 2017). Another mechanism
to obtain revenue from the mines is the imposition of a day of “Salongo” each week to all creuseurs
in each mine, during which all the diggers are required to dig for minerals and hand over the day’s
production to the group. Such taxation practices required a significant presence of soldiers in and
7In particular the FDLR, the Alliance des Patriotes pour un Congo Libre et Souverain (APCLS), and theCongolese Army
8“We weren’t very interested in villages with no mining activity and with a small population; Where there weremines, or in the larger centers with a strong population, that is where you could find most of our soldiers.” Thisargument is developed more comprehensively in Sanchez de la Sierra (2017).
10

around the mining sites and favoring much more intrusive and direct’ modes of administration.
While each mine has a President Directeur General (PDG), in charge of production and the or-
ganization of miners, the PDG is closely monitored by the NDC’s emissaries, to which he owed
full accountability. PDGs who didn’t fully comply with the group’s orders are killed and replaced,
either by more complacent intermediaries or directly by members of the NDC. Thus, the high
revenue streams generated by mining activity, and the difficulty to observe gold output (Sanchez
de la Sierra, 2017), prompt more direct forms of military and administrative control over that sec-
tor of the economy. The group taxes trade by setting up roadblocks and fining the access to local
markets, as well as agricultural and hunting activity by imposing taxes on agricultural production,
windmill taxes, taxes on the production of local alcoholic beverages (Kasiksi) and hunting taxes.
The collection of these taxes relies on intermediaries, usually representatives of these sectors, but
revenue streams are then highly centralized into the administration of the group (the Bureau 1),
which is in charge of counting and verifying all taxation revenues.
The head tax is the most significant tax collected by the group, however. Called the effort
de guerre’ (war effort), such tax is imposed on all adults of the territory. The collection of such
tax relies on local chiefs, echoing the historical role of local chiefs in the mobilization of resources.
Throughout the NDC’s territory, all adults are compulsorily required to pay 1,000 Congolese
Francs per month.Local chiefs are tasked with reporting the number of residents to the group,
and then collecting the taxes monthly. The group sends a “technical team” to conduct a village
census. Once the taxes are collected, the group’s envoys distribute jetons’ (tokens) to the village
chief, which the chief has to then distribute to the residents in exchange for the tax — such token
can then be used to prove they had indeed paid the tax. Small groups of soldiers are tasked with
carrying checks in the villages, and any person who isn’t able to present a token received 50 to
100 lashes, and is asked to a fine of 50-100 000 Congolese Francs (US$50-100), a prohibitive sum
for extremely poor rural households. Those who refused to comply are hanged or decapitated.
Like many others in the region, the NDC relies heavily on intermediaries to collect resources,
setting up rudimentary forms of indirect rule’ types of governance configurations. Furthermore,
the group established what it calls ‘cadres civils” or “cadres politiques” (Civilian or political lead-
ers), enrolling the territorial administrator of Walikale, and appointing a political director, to
supervise political and civilian administration. These cadres were tasked, among other things,
with verifying that the information on the population size of villages provided by local chiefs to
11

the NDC was correct. Similarly, the group set up its own police force. Rather than developing an
entirely new police force, the group enrolled all existing Congolese National Police officers in the
areas they controlled, and required them to continue doing their work, albeit as NDC police and
not national police. Along with the village chiefs, civilian administrators and police officers were
also tasked with reporting the presence of Rwandophone residents in the area.9
Thus, the group often relies on pre-existing local authorities, cadres, and chiefs, to administer
its rule. However, the heavy burden of taxation imposed by the group, and the extent of harass-
ment by its soldiers meant that civilians and authorities were often reluctant to fully collaborate
with the group. When discovered by the group, reluctance or resistance, either passive or active,
entailed immediate sanctions that ranged from public beatings or lashings to executions. The
existing authorities of a given area were only kept if they were “trustworthy, and followed closely
to orders of the movement.”
However, while replacing former state and police authorities or other local leaders is relatively
straightforward, replacing local chiefs who show reluctance to comply with the group’s rule is
more difficult. Replacing a customary chief would immediately entail a loss in the group’s military
strength and legitimacy: “we could not replace a customary chief, because that would be going
against our ancestors; the strength with which we fought came directly from our ancestors; the
customary chiefs are the representatives of our ancestors, so going against them is automatically
going against the movement.”10
The NDC respects important traditional chiefs, less so for less important chiefs. In the village
of Kashumba, a detachment of the NDC was sent out in early 2012 with the task of recruiting
soldiers for the group and encouraging’ populations to comply with the head tax. At their arrival
in Kashumba, they noted that the village had organized a local chapter of the Raia Mutomboki, an
ad-hoc grassroots armed movement that had started in 2011 in the territory of Shabunda, South
Kivu, and spread throughout South and North Kivu (Stearns and Vogel, 2015). Upon arrival of
9The NDC considered all Rwandophone civilians to be supporters of Rwandan armed groups, which theywere trying to defeat and chase out of the territory. When discovered either by the group our reported by itsintermediaries, Rwandophones are assassinated by the group.
10When the NDC started seizing territory in Walikale, the Mwami of Walikale, Mwami Kitanguru Serafin, fledto Goma because of the recurrent fighting, and stayed in Goma for the period, leaving the offices of the chiefdomempty. However, he had appointed an interim, Mwami Blaise Tumbiwa, who, despite not being the recognizedruler, nevertheless bore a level of legitimacy by interim. Conscious of the importance of being associated with thecustomary authorities, the NDC made substantial efforts to be close to Blaise Tumbiwa: “we needed to be veryclose to Mwami Blaise, so we were in constant contact. We would visit him in his house and he would visit us, andhe would help us with the cause.”
12

the NDC detachment, the Raia Mutomboki pleaded allegiance to the NDC, most likely because
of their superior military capacity. Through discussions with the elders held the village’s barza,
however, the NDC commander was informed that the village chief had told his population that
his role was not to be a host for any visitors (the NDC) and collect taxes on behalf of them, but
rather to receive taxes himself as a result of his traditional authority and ownership over land.
Irritated by what he heard, the NDC commander ordered his troops to heavily lash the chief,
and beat him to a point of near-death. The next morning, he convened a reunion with the entire
village, and further lashed and beat up the chief in front of his population, stating that the chief
had brought this upon himself by refusing to follow the group’s “ideology.”11
Coercive actions towards local chiefs weaken the group’s legitimacy. Although the group’s
leaders and a majority of its membership were natives of Walikale, which conferred to them a
substantial advantage over groups perceived as foreigners (in particular the FDLR). In order to
assert the legitimacy of their claims to rule and mobilize resources, the group deployed a range of
narratives, rituals and practices. Public meetings were organized after the conquest of a village,
and then regularly throughout the group’s presence in an area. The purpose of such meetings was
to assert the group’s coercive power by putting troop numbers and weapons on display, but also
to expose the group’s “ideology.”12
3.2 Conceptual framework
In light of this qualitative evidence we develop a set of conjectures. The following approach draws
on existing theoretical literature (Bates, 1987, Padro I Miquel and Yared, 2012), as well as a
vast historical documentation — which includes extensive descriptions of these trade-offs faced
by rulers in feudal Europe (Greif, 2008), the Roman Empire, as well as a large number of other
well-known historical episodes of states and Empires.
Consider a ruler/armed group, and a local leader. The objective of the group is to extract as
11Assassinating chiefs, similarly, posed a problem of succession. For chiefs tied to the custom, the group had tofollow the customary procedure of appointing the chief’s successor among his lineage. This could generate conflictsof succession, in which the group would give support and often impose a successor who seemed compliant to theircause.
12A video obtained by one of the authors of one of the group’s public meetings in the town of Pinga shows thatthe group’s leaders in this case Sheka himself would deploy extensive efforts to convince the population of therighteousness and legitimacy of the movement’s objective’s and rule over the village, resorting to chants, invitinglocal customary authorities to publicly give their backing to the group, and arguing that the group’s presence wouldenhance cooperation and development within the village.
13

much rents as possible from the territory under control, for direct consumption, as well as to finance
the group operations and territorial expansion. The local leader cares about his own consumption,
and may also value the payoff of the population under his control — whether through repeated
interaction or as a private valuation of the social good in a static setting. The armed group has
guns and can obtain compliance of the local population using coercion. However, coercion has
limits: the group cannot obtain compliance of all dimensions of effort from the population (effort
not to share intelligence or not to poison the group, for instance). The leader has a technological
advantage over the group: he has local legitimacy. Legitimacy can be thought of as a lower cost of
obtaining popular compliance. It can be modeled simply as a self-sustaining equilibrium, whereby
it is in the interest of each villager to comply with the chief (within well-defined limits) given
that everyone is complying with the Chief and that others sanction deviators, as in Bates (1987)
and Greif (2008). Whichever is the source, legitimacy is then internalized and has psychological
expression — a feature we use in the second part of this study. In the absence of the group, the
Chief chooses a level of extraction to maximize his objective function. When the group controls the
polity, the group can enlist the Chief as his agent, and offer the Chief a contract that maximizes the
resources extracted for the group. Instead, the group can at a fixed cost, create an administration
and vertically integrate governance of the village into the group’s organization. This framework
yields three conjectures.
First, a superior “technology” of Chiefs to extract resources from their community renders the
co-optation of Chiefs (indirect rule) more attractive. Their technology depends on the sources of
their power — Chiefs who follow the traditional succession dynasties, who have been enthroned
through a traditional ceremony, who have bigger supernatural powers, and who the dead ancestors
have explicitly approved as a legitimate Chief have an advantage over the rest of Chiefs. In the
presence of incomplete contracts, they are able to solve hidden action problems and engender
collective action and taxation, appealing to the mystical foundations of their power. Furthermore,
Chiefs who share the ethnicity of the villagers, while the armed groups do not, have a drastic
advantage over the group at mobilizing resources in their communities — this is dramatically true
for the case of armed groups that are of Tutsi or Hutu backgrounds.
Second, since creating a village administration entails a fixed cost — the group must build the
social networks and acquire the information that is required to administer the village — groups
that govern for longer periods of time will be more likely to prefer developing an administration
14

of direct rule to circumvent the agency problems present in the cheap indirect rule mode of
governance. Furthermore, as the group’s rule extends over time, the cost of creating direct rule
decreases, since the informational disadvantage they have over the chief decreases over time —
learning.
Third, investing in a costly village administration exposes the group to risk. Specific locations,
at certain points in time are close to territorial boundaries, where control is contested by enemy
groups and the state. Such locations are temporarily less attractive for direct rule, since the state
(or the competing armed group) is more likely to destroy armed groups’ capacity militarily.
Finally, the weaker is the bargaining power of the Chief vis-a-vis the armed group, the more
attractive it is for the armed group to co-opt the Chief. Chiefs that can easily be succeeded by
equally legitimate local leaders should be more likely to be co-opted, since they can be exploited
more. Furthermore, the armed group will take actions to reduce the power and the outside option
of village Chiefs in an effort to increase the rent they can afford to extract. For instance, the
armed groups often try to undermine the technological advantage of Chiefs by creating their own
sources of legitimacy. They can achieve this by imposing their own traditional doctors and witches
and killing those who connect with dead ancestors and who support the Chief. We are able to
observe all such episodes with high level of accuracy since 1995, as our qualitative evidence and
cross-referencing suggests.
In this paper, we focus on the first two conjecture, which we can test using the data we
collected.
4 The data
This section describes the data collection, and presents the main variables used in this study. The
data is a subset of the data collected in Sanchez de la Sierra (2017), and focuses on detailed map-
ping the history direct and indirect rule arrangements. The data collection strategy is described
extensively in Sanchez de la Sierra (2017).
15

4.1 Approach to data collection
The data focuses on 105 villages of Eastern Congo in the province of North Kivu. The data
collection protocol contemplates the following data collection design in 7 days in each village to
reduce measurement error and strategic misreporting of information.
First, the surveyors identify a group of “history specialists” on the first day in the village. In
practice, the history specialists are individuals who best master the village social history. Surveyors
identify them easily due to the local tradition of oral history: history specialists are often village
elders. Surveyors then train the history specialists on how to collect historical data. In each
subsequent day, the surveyors monitor how the history specialists collect data. In the last day in
each village the surveyors hold a day-long meeting with the history specialists, where they confront
the data to additional data collected by the surveyors themselves from other sources. The data
from this meeting is the main source of data used in this study. Second, to address the possibility
of recall error and systematic reporting bias by the history specialists, the surveyors implement
6 household surveys in private during the 7 days. In each household survey, they reconstruct
the history of the village during a 4 hours discussion. Third, the survey implemented during
the day-long interview with the history specialists at the end of the village visit has multiple
sources for key variables, which we use as cross-validation. Fourth, the surveyors implement an
exhaustive set of time cues to reduce measurement error associated with years (de Nicola and
Gine, 2014). Surveyors use common knowledge regional events as a reference to locate the events
reported by the respondents in time. Anecdotal evidence suggests this strategy was very effective
at identifying years with little or no uncertainty. Fifth, survey questions focus on transitions and
events easy to memorize. Sixth, surveyors draft a qualitative report in each village, where they
describe the history of the village, all groups that held a monopoly of violence, their activities and
their motivations. To draft these reports, surveyors use the information acquired in the different
surveys, as well as additional in-depth interviews with combatants, ex-combatants, and other
civilians.
4.2 Measuring armed groups’ control and institutions of governance
We focus on armed actors who control a given village for at least one month. Surveyors and
villagers usually refer to a group that controls a village as its “organization of security” in the
16

village. These are a very common phenomenon in Eastern Congo. Villagers easily distinguish
between such situations and, for instance, marauding bandits, who may be stationed in other
villages but who came to pillage in this village.
Using the same strategy, we obtain detailed information for all Chiefs that were present in
the village since 1990 and all groups that had any kind of control of the village on the following
outcomes. First, we collected the dates when a group controlled the village and properties of the
group, including ethnic composition, kinship ties with the Chief and local population, internal
organization of the group, and all types of administrative capacity created by the group. Second,
for each Chief, we document the history of contracts they had with armed groups (the “institu-
tion”), the details on the deliverables expected by the group (for instance, collection of poll taxes,
mobilization of recruits, gathering of information, lobbying to gain the population support for the
group, superstitions), the performance on such dimensions (delivery) the prevailing threats on the
Chief, as well as any instance of realized sanctions of the Chiefs and their details. We also collect
data on all taxes paid by villagers, and how tax collection is organized, as well as the history
of the mobilization of recruits and when these happen, how they are organized. Third, for each
Chief, we obtained dates of throning and departure, causes of throning and departure, network
data, land ownership data, and information on the availability of successors at any point in time.
With the geographic coordinates collected during the survey, we linked this data to geographical
shapefiles we obtained from the Referentiel Geographique Commun.13 This source contains the
map of the road network of the DRC, all airports (including small landing lanes), the location of
forests, rivers, lakes, and the regional capitals.
In addition, for each armed group episode, to examine the details of the administrations armed
groups created to rule their territory using direct rule, we gather detailed yearly information about
the episodes in which armed groups create their own administration. We also observe the types of
taxes they create, their amounts and frequency, the agencies they create, the staffing, the admin-
istration of justice, the creation of intelligence agencies to combat tax evasion, and the creation
of armed groups’ economic monopolies (of beer, liquors, and cigarettes), which are mechanisms
often used by armed groups to extract revenue from their territory when they rule directly.
13See Referentiel Geographique Commun (2010).
17
4.3 Measuring the psychological expressions of Chiefs’ legitimacy
Legitimacy, even in its most mechanical definition as a self-enforcing equilibrium (Tilly, 1985), is
likely to be internalized and thus have psychological implications — of positive or negative atti-
tudes towards ruling Chiefs. Measuring legitimacy is challenging, mostly because it is a loosely
defined concept, and because most self-reported measures are likely subject to self-reported bi-
ases, both through the conscious processes they activate, and through social desirability biases
arising from the presence of the surveyor. We focus on the unconscious positive and negative
associations that villagers hold towards individual Chiefs, and towards traditional institutions in
general. To measure the unconscious associations of the population towards armed groups and
leaders, we administer Implicit Association Tests (IAT), to a random sample of villagers in each
village. IAT’s were developed in the psychology literature (Bluemke and Friese, 2008, Greenwald,
McGhee, and Schwartz, 1998, Nosek, Greenwald, and Banaji, 2006) and recently introduced in
economics (Lowes, Nunn, Robinson, and Weigel, 2015a,b). In particular, we administered the IAT
to capture implicit associations towards armed groups that are in the region, armed groups that
controlled the village, all Chiefs of the village since 1990, traditional institutions in general, as
well as the Congolese state.
IAT’s, administered usually on a computer, allow eliciting unconscious attitudes between pairs
of objects. The left of the screen shows a smiling (sad) face, and the right a sad (smiling) face.
Subjects are then presented with a dozen of faces that appear sequentially at the center of the
screen, and have to sort such faces (smiling or sad) to the left or right of the screen, so that
smiling faces are sorted to the side where there is a smiling face, and vice versa. There is a strong
association between smiling faces that appear in the center, and the smiling face on the side, which
makes sorting intuitive and fast. In the next round, a photo of the face of the Chief is displayed
on one side, below one of the side faces, and the task is repeated. In a third sequence, the face of
the Chief is presented on the opposite side and the task is repeated. If subjects are asked to sort
smiles to smiles in the presence of the Chief’s face next to the smiling face on the side, this would
be much less intuitive and would take longer if the subject has a negative association towards the
Chief. In contrast, if the photo of the Chief would be displayed below a sad face, sorting sad faces
that appear in the center towards the sad face on the side would be more intuitive if subjects
negatively associate with the Chief. This pattern is systematically present for images that clearly
generate negative associations (such as spiders, snakes): subjects take much longer and make more
18

mistakes when they have to associate smiling faces to the side of the smiling face if a “bad” image
is displayed below the smiling face on the side. In contrast, subjects will make less mistakes if the
“bad” image is displayed below a sad face: sorting sad faces to sad faces is easier because “bad”
images are associated with sad faces. This is what Nosek, Greenwald, and Banaji (2006) propose
as a measure of so-called system 1 in dual process theory, implicit attitudes towards an object,
before they are rationalized by so-called system 2 and without the subject’s awareness of them.
Figure 8 presents the results of this benchmark implicit association tests.
Prior to administering the IAT’s, we obtained in each village the detailed names of the village
Chiefs since 1990, and recorded all possible names, accompanied with “Chief” prior to implemen-
tation. Surveyors then went back to the 106 villages and visited a random sample of households
that had lived in the village since 1990 (and hence lived through all Chiefs). Surveyors admin-
istered the IAT’s to these households on tablets. In addition to sound IAT’s, for current Chiefs,
we obtained the Chief’s approval to have their photo taken and then displayed in an IAT to be
implemented on households. To collect implicit attitudes towards groups, showing armed groups’
images in the IAT posed a risk. Instead, we systematically recorded the names of all the possible
groups that have been active since 1990, and implemented IAT’s using sounds for the name of
each armed group that was ever in the village as well as a set of 12 major groups administered
commonly in all villages. Since group names are known, we provided the surveyor with a list of
armed groups’ names, from where they choose which ones to implement. In this draft, we present
the results from the classic IAT’s using the photo of the village chief, thus we restrict the analysis
to chiefs that are still in charge today.
5 Defining and measuring indirect rule
Traditional chiefs: the rule of the custom
Figure 1 presents basic data on the information we collected about chiefs. We covered 106 villages
since 1950, and obtain a dataset of 456 chiefs of Nord Kivu. The upper left panel shows the
distribution of the number of chiefs recorded in each village since 1950. The modal number is 3,
and a group of villages experience a high turnover of chiefs, having up to 10 chiefs since 1950. The
upper right panel shows the usual length of reign, ranging from 1 to 60 years. The median length
19

of reign is 10 years, and the mean reign lasts 15 years. The bottom left panel shows the percentage
of land that belongs to the chief. The distribution is bimodal, indicating that chiefs often either
own all the land, or no land at all. The variation in land ownerships provides a useful proxy for
the sources of chief power. Finally, the lower right panel shows the causes of chiefs’ turnover. The
majority of chiefs go because of natural deaths due to illness and age. A significant number of
chiefs died assassinated, by firearm, poisoned or bewitched.
Armed Groups territorial control
Following the methodology used in Sanchez de la Sierra (2017), we consider a village to be con-
trolled by an armed group when an armed actor holds a stable monopoly of violence for a significant
period (usually at least a few months).14 We collect the number of months of each armed group
episode, 7 of them are shorter than 6 months. We observe 258 armed group episodes in 106 villages
by 42 different armed groups.
Armed groups’ episodes of governance vary starkly in their motives, and origins. Sanchez de la
Sierra (2017) examines two categories of armed groups: armed groups that originated in the vil-
lage and external groups that come from outside. The literature on the Kivus notes in contrast
to South Kivu, North Kivu mostly experienced rule by external groups. Our data supports this
claim: only 10 episodes of armed groups that originated in the respective village, while the pro-
portion is larger for Sud Kivu.15
Figure 2 presents basic data on the episodes of armed groups’ rule in the villages of the sample.
The upper left panel shows the frequency with which villages experience armed groups’ governance
episodes since 1990. The median occurrence is 3 distinct episodes since 1990, with some villages
experiencing up to 6 episodes. The length of control varies from 1 to 25 years. The median stay of
a group is 3 years, and the mean is 4 years. The resulting number of years a village is “occupied”
by an armed organization since 1990 is presented in the lower left panel. While some villages are
occupied for the entire period, the median occupation length is 10 years, and the mean is 15 years.
14This definition was applied while collecting the data however, surveyors were instructed to also include armedgroup episodes of shorter duration as long as the armed group intended to stay in the village.
15We exclude these 10 episodes from the analysis for straightforward reasons: firstly, homegrown armed groupsare likely to have very different objectives and strategies with regards to governing the village making it difficult tocombine both cases under the theoretical framework of external armed groups who come in to govern. Secondly,chiefs are often heavily involved in the organization of homegrown groups. Including them blurs the line betweendirect and indirect rule. Nonetheless our results hold when we include these cases).
20

Finally, the lower right panel shows the groups who rule in the different territories of Nord Kivu
in the data. Walikale, a remote territory, has experienced the largest exposure to armed groups’
rule, mostly dominated by the RCD, the MM (Mayi-Mayi regional militia), the Congolese Army
(FARDC) battalions, and a large number of other groups. In the period, the Congolese Army is
largely absent from the villages in the sample in the territory of Rutshuru, Masisi, Beni, and to
a lesser extent, Lubero. Figure 3 shows the evolution of territorial control in the villages in the
sample, and their production sites, by militia, external armed groups, and army battalions.
Armed groups’ direct rule and indirect rule: dimensions and trade-offs
Measuring direct and indirect rule is challenging, because there is no natural dichotomy in the
institutional design by the armed groups. We thus propose a systematic approach, that constructs
vectors on a number of well-defined relevant dimensions, that reflect the choices of armed groups
and chiefs along each of the dimensions.
To operationalize direct rule, we break down institutions into: extraction of resources (taxa-
tion and tribute), extraction of labor services (recruitment), legitimation (efforts to indoctrinate
the population in support of the group), administration of the village, the allocation of political
power, the provision of public services, and the regulation of economic activity. Table 1 presents
the data of the political dimension for Nord Kivu and Sud Kivu, since it is the only rule variable
that already existed in the Sud Kivu datasets. of 508 total armed groups’ episodes, in 32% the
chief has the political power, in 20% the political power is shared, and in 38% the power is in
the hands of the group. Note that consistent with qualitative research on eastern Congo, North
Kivu is remarkably organized with direct rule, and Sud Kivu with indirect rule along this political
dimension. Figure 4 presents the data along each of these dimensions — the data is in year*village
observations for each episode of armed groups’ rule.
For the collection of taxes, we observe whether the group receives a head tax, and whether the
head tax is collected by the group directly. We also observe whether the group raises a toll tax, a
mill tax, a market tax, and whether the group creates forced debt — all these sources of revenue
are always directly organized by the group, so their mere existence is an indication of direct rule.
However, head tax is often organized by the chief for the group, since the head tax is the tax that
generates most resentments among the population, and where legitimacy is crucial to maximize
extraction. More than 70% of groups raise a head tax, and about half of them collect the head
21
tax directly. Groups organize toll taxes, mill taxes, market taxes, and forced debt between 10%
and 60% of cases, whereby toll tax and market tax are raised in more than 50% of cases.
For the mobilization of labor services, we observe who recruited new members for the group,
and whether the chief encouraged recruitments. The chief is involved in recruitment in approxi-
mately 20% of cases, but the group recruits directly themselves in 55% of village*year observations
of episodes of armed group rule. For legitimation, the group is directly engaged in organizing pro-
paganda campaigns for the group in 40% of cases, and organizes rituals in 30% of observations.
The group also hunts local witches, to replace them with their own witch doctors, in 17% of vil-
lage*year observations.
For the properties of the armed groups’ administration, we observe whether the armed group
administers the village, the presence of written documents for administration, a written consti-
tution, written contracts, written official communications by the group, and the existence of a
group seal. We also observe whether the group administers justice. In 75% of cases, the group
administers the village directly, and organize justice for the village. Surprisingly, written official
documents by the group and a group official seal exist in the majority of cases in which the group
administers the village.
For the allocation of political power, we observe who holds the political power in the village:
in 55% of the cases, the political power is in the hands of the group, while it is either shared with
the chief, or entirely delegated to the chief in 45% of cases. The military presence of the group
equals approximately 10 armed men on average, per village*year of armed group rule.
To measure the provision of public service, the group provinces security in almost 50% of the
time, but only rarely provides health, education, roads, or other public or private services (ap-
proximately 5% of the time).
Finally, for economic regulation, the group regulates traffic 50% of the time, create a local
market only 8 times in the sample, regulate private firms 7% of the time, and is directly engaged
in trade in 10% of cases.
To operationalize indirect rule, we break down the pressure exerted by the group on the tradi-
tional chief along 5 dimensions: extraction of resources, extraction of labor services, legitimation
efforts, administration, and political power. For taxation and tribute, the chief is involved in tax
collection of the poll tax in 65% of the time an armed group is ruling. For recruitment, in 10% of
cases, the chief is directly involved in recruitment, and 55% of observations have an armed group
22

recruiting directly. For legitimation, while 25% of the time, propaganda campaigns are organized
by the chief for the group, 40% of the time it is the group directly. For administration, the chief
only administers the village, or justice, in 20-25% of cases. Finally, for political power, the chief
has all the political power in 20% of cases, and shares the power with the group in another 22%
of cases.
We operationalize this categorization by first projecting all activities into their respective di-
mension, for instance taxation for the taxation variables. We do so using principal component
analysis. Equipped with one variable for each dimension of direct and indirect rule, we then
construct a z-score index for indirect rule, and a second for direct rule.16 We can thus interpret
regression results as increases in one standard deviation of the normalized score. We present the
results on each of the indirect rule, and direct rule, dimensions, in addition to the standardized
scores.
Figure 6 shows the proportion of observations in which a group is seen as legitimate, and the
types of resistance that the group faced. A group is legitimate in 30% of cases. Groups rarely
face peaceful resistance or demonstrations, but do face popular armed resistance in 20% of cases.
While bewitching and poisoning of groups’ members is extremely rare (although not unobserved
in the data), the most common form of resistance is passive resistance: population fleeing the
village. Displacements occur in 35% of cases in which an armed group exerts stable influence in
the village. Note, however, that displacements generally occur the first year of armed group’s rule,
following the first attack by the group, which is usually aimed at deterring resistance, signaling
strength, and punishing villagers who have collaborated with the competing group who formerly
controlled the village.17
6 When is direct rule preferred to indirect rule?
This section presents the results on the analysis of the determinants of indirect rule.
16The z-score index normalizes each of the dimensions by subtracting their mean and dividing by their standarddeviation, then adds the normalized dimensions, and normalizes the sum again. We end up with one normalizedvariable for indirect rule, and another for direct rule, whose interpretation in a regression is straightforward, sinceit has mean zero and standard deviation of one.
17Groups understand attacking their own tax base is not a very intelligent idea.
23

6.1 Empirical strategy
The large number of village level arrangements that armed groups develop in eastern Congo to
rule individual villages allows us to exploit yearly within village, within Chief, as well as within
armed group variation across years to explain the formation of indirect rule institutions, of direct
rule, and of armed rule in general. In particular, we examine, within armed groups episodes, across
villages, and using year fixed effects how changes in the ethnicity of the village population, Chief,
and armed group, determine the type of institution the armed group ends up creating.
As an illustration, to estimate the impact of the ethnicity of the armed group, and of the chief,
at the time of designing institutions on the type of rule that emerges, we implement the following
OLS regression:
INDIRECTi = α + β1COETHNICAG,Vit + β2COETHNIC
C,Vi + ε
where the observations are restricted to the first year of the group. The indexes AG, V, C stand
respectively for armed group, village, and chief, and i = 1, ..., 256 stands for the armed group’s
episode. We examine additional determinants by replacing COETHNIC with the corresponding
variables. We include armed organization fixed effects (there are 46) to account for the fact that
certain organizations have systematically different ethnicities than the villages they control.
To estimate the effect of armed groups’ tenure on the institutions they create, we use the data
that contains all years for each armed groups’ episode, and the evolution of the institutions over
time, within each episode. To account for any unobserved constant heterogeneity at the group
level that may correlate with institutional choice, we include armed group’s episode fixed effects.
To account for the fact that more tenure correlates with years, we also include year fixed effects.
Since episode is more disaggregated than armed organization, we do not need to include armed
organization fixed effects. We also project the institutional variables on group tenure year effects,
controlling for year fixed effects as well as episode fixed effects.
6.2 Results
We first present the results of the initial conditions, and then, the results of the time/tenure
effects. For the initial conditions, we focus on ethnicity, kinship networks, and the allocation of
24

land property rights in the village. For the time dimensions, we examine the role of learning and
expectations. To do so, we examine the role of the number of years the armed group has been
ruling, and the number of years the chief has been ruling.
6.2.1 Initial conditions and endogenous insitutional choice
We first examine the role of the relative advantage of the chief in terms of its “social technology”
vis a vis the armed group. We proxy for social ties with the population using the coethnicity of
the chief and the population it governs, as well as the coethnicity of the armed group and the
population to govern. An armed group that is foreign to the village faces a substantial disadvantage
if they want to rule directly and may be more tempted to rule through the chiefs. Furthermore,
chiefs who are not coethnics of their villagers may have a worse “technology.”
Table 2 presents the results of regressing initial direct rule on the coethnicity dummies. Clearly,
chiefs who share ethnicity with their population do not tend to be replaced by the group. If the
chief shares ethnic ties with the population, taxation is less likely to be organized by the group, so
are public services, regulation of economic activity, justice, and political power. Overall, episodes
in which the starting chief is coethnic with his population have direct rule indices which are 1.7
standard deviations lower. Table 3 shows the corresponding results for the indirect rule dimensions.
Correspondingly, if the chief at the starting year of an armed group episode shares ethnic ties with
the population, the armed group is more likely to delegate the governance tasks to the chief,
especially administration and justice. Overall, chiefs who share ethnic ties with the population
at the start of an armed group episode have indirect rule indices that are 1.2 standard deviations
higher than the rest.
To examine other forms of chiefs’ ties with their population, Table 4 presents the results on
kinship connections between the chief and village families. While there is no clear relationship
that emerges, chiefs who are well connected with their villagers are less likely to engage in taxation
for the group, and more likely to organize legitimation campaigns for the group. When chiefs are
better connected with the villagers, the group is more likely to have a larger force in the village,
and to administer the village directly while letting the political power in the hands of the chiefs.
Table 5 presents the results using as a predictor of chief power the proportion of land owned
by the chief in 1998. Since chiefs who concentrate land ownership may have more coercive power,
but may be disliked by the population, the theoretical expectations are ambiguous. Furthermore,
25
chiefs who have strong power can undermine the surplus extracted by the armed group. Thus
armed groups may be tempted to rely on the local chief, but at the same time to undermine their
power, through, for instance, substituting their rule through direct rule. Table 5 suggests that
chiefs who own the land are less likely to be allowed to organize justice, administer the village,
organize recruitments, or hold political power, thus less likely to be used for indirect rule. The
group is also more likely to provide services, administer justice, and hold the political power
themselves. This suggests that armed groups dislike to delegate tasks to chiefs who concentrate
land ownership, consistent with the conjecture that armed groups struggle more to extract rents
from chiefs that are too powerful.
6.2.2 Learning about the village
We then show the results on armed groups’ tenure. Over time, armed groups should have the
means, and the desire, to invest in institutions of direct rule. Table 6 shows the results from the
main specification. We regress the institutional variables on year effects, armed group episode
fixed effects, and on armed groups’ tenure. The upper panel shows that group tenure significantly
increases direct rule along the dimension of taxation, administration of the village, organization
of justice, and military presence in the village. Overall, an additional year of tenure in the village
increases the direct rule index by .5 standard deviations. The lower panel shows the identical re-
gression for the indirect rule index. While group tenure also increases the organization of taxation
through indirect rule (thus suggesting that taxation is heavier over time), the tenure of armed
groups reduces the reliance on chiefs for legitimation efforts, administration of the village, orga-
nization of justice. Overall, an additional year of tenure by the armed group reduces the indirect
index in .38 standard deviations.
Figure 7 presents the year coefficients for an additional year of armed group’s tenure. We
project the institutional variables on year effects, armed groups’ episodes fixed effects, and dum-
mies indicating the number of years of armed group’s tenure. Panel A presents the results on the
indirect rule index, panel B for the direct rule index, and panel C for the difference between the
two. The red lines indicate the upper and lower bounds of the 95% confidence intervals. Clearly,
additional years of armed groups’ tenure consistently decrease the reliance on indirect rule, and
increase the investments in direct rule.
Also chiefs may increase their ability to mobilize resources over time. Thus, armed groups who
26

aim to start a governance episode when facing an experienced chief may be more tempted to rely
on the chief. Table 7 presents the results of the initial tenure of the chief at the start of the armed
group episode. Clearly, armed groups are more likely to delegate administration and justice to
well experienced chiefs, but the results on the direct and indirect rule indices are insignificant.
This section has shown that armed groups vary substantially in the type of institutions of
governance they create and has provided a few reasonable explanations for why they might vary.
While they are more likely to rely on chiefs who share ethnic ties with their villages, and are thus
more legitimate and more effective at mobilizing resources, they tend to rely less on the chiefs if
the armed group has already ethnic ties with the population, thus needing less the rule of the local
chief. Furthermore, the armed groups on average always invest in creating institutions of direct
rule over time. The longer they stay in power, consistently, the more they penetrate into the day
to day life by creating direct rule along most dimensions of governance.
7 Long-run implications of indirect rule
We examine the impact on a Chief of being part of indirect rule on measures of legitimacy col-
lected in today’s implicit association tests. For each village, we compute the number of years a
current chief has been in power, and for each year, we compute an indirect rule index. For years
in which no armed group was present, we need to have a comparable measure for indirect rule.
Thus, we compress the indirect and direct rule indexes to scores from zero to one, and assign the
value zero to years in which no armed group is ruling. We then sum the indirect rule scores for
all years a chief has ruled, thus obtaining an effective indirect rule index for the current chief —
or alternatively, a weighted sum of the years under indirect rule, where more intense indirect rule
year is weighted more heavily. We also use survey based measures of support for the current chief,
and implicit association tests aimed at capturing unconscious biases in favor and against the chief.
We run the following specification:
BIASi = α + β1
t=Ti∑t=1
Indirectti +
t=Tj∑t=1
Directti + εi
where Indirect and Directtj are the indirect rule and direct rule indices for chief i in year t of
the chief episode. The dependent variable BIASi is a standardized z-score for the IAT bias against
27

chief i. Note that each chief has different tenure, hence receives a different number of elements
of the sum. Clearly, if chiefs who enjoy more positive support are also more “productive” from
the perspective of the group, examining today’s support for the chief, which is post-treatment,
is endogenous to selection into indirect rule by different types of chiefs. In particular, if there is
positive selection, in the sense that chiefs that enjoyed better popular support are more likely to
be hired as agents for the group as part of an indirect rule arrangement, were we to find a negative
association between participation into indirect rule and support today, the selection effect would be
working against the erosive effects of indirect rule on legitimacy. We thus examine the association
between participation into indirect rule, and popular support today, in order to obtain an upper
bound of the effect of indirect rule on legitimacy.
Figures 8 and 9 present the benchmarking results for validity of the implicit association tests.
Images that are expected to be negative receive a negative bias score in the implicit association
tests (snakes, and armed groups known to be disliked).
Figure 6 report the outcomes of armed groups’ legitimacy. Overall, 30% of group episodes are
associated with a rule of an armed group that is legitimate. Since survey self reported responses can
be subject to bias, we use both survey responses and implicit association tests in the regressions.
Tables 8 and 9 present the results, using respectively the implicit association tests and the
survey based variables. Both tables present the results of regressing a measure of support for
the chief on each dimension of indirect, and direct rule. Table 8 shows that indirect rule along
the political dimension is associated with a higher standardized implicit association tests score,
indicating a positive bias in favor of the chief. Since chiefs that evoke positive biases are more likely
to be selected for indirect rule, this specification clearly produces a biased coefficient. However, the
coefficient has a positive bias, indicating that if there is a negative effect of indirect rule on the bias
towards the chief, such negative effect is not sufficient to swap the sign of the coefficient. The result
on the overall indirect rule index similarly is positive and marginally significant. Table 9 replicates
this result using instead the survey based variable of support (love) for the chief. The results are
identical, albeit the positive effect of indirect rule on support for the chief turn significant in the
following dimensions: taxation, administration, political, public service. Similarly to the previous
table, the coefficient on chief recruitments, the most drastic form of indirect rule, is negative,
albeit not significant.18
18Future versions of this research will examine the entire history of chiefs in the village, and control for initiallevels of chief’s legitimacy. They will further use variation over time in the trade-offs faced by armed groups as an
28

8 Discussion: measurement error due to recall
Recall data can contain mistakes and respondents may resort to inference to reconstruct memory.
This can lead to measurement error.19
8.1 Track record of recall data collection and lessons
While many municipalities lack written records of administrative data, due to the weakness of the
central bureaucracy, historical events are meticulously kept and transmitted orally across gener-
ations in Eastern Congo. The strategy proposed in this paper is, in fact, not new, and responds
to the cultural context of Eastern Congo. Historians, anthropologists, and economists have a long
track record of working with this cultural feature, called oral history, to learn about the past of
these societies, and discussing the biases that may arise (Acemoglu, Reed, and Robinson, 2013,
Newbury, 1992, Sanchez de la Sierra, 2017, Vansina, 1978, 2005).20Villages in Eastern Congo have
a group of “Elders” responsible for narrating the history of their community. Elders usually trans-
mit the historical information of their village and tribe in weekly community meetings where the
entire village has to attend, the “Barza”. Furthermore, every evening, the ”Chief” of the household
narrates the history of the family to his descendants around the fire. There is a very strong norm
of transmission, precisely because these communities usually lack written records. The safeguards
that we describe next in this section were designed precisely in response to the concerns that may
arise with the type of recall data that is transmitted in oral history societies, and draw mostly on
the methodology developed in Sanchez de la Sierra (2017).
First, it is well known in the cognitive sciences that as the time period of recall widens, self-
reported answers from the past converge to the mean of the real distribution (Tourangeau, Rips,
and Rasinski, 2000a,b). This implies that the magnitude of measurement error increases for events
back in time. The survey data thus likely under-estimates historical volatility and the response to
external shocks.21 Second, bad years are recalled with more mistakes (de Nicola and Gine, 2014,
Tourangeau, Rips, and Rasinski, 2000a).
There are ways to reduce measurement error in recall data. First, researchers in social psy-
instrument for each chief’s exposure to indirect rule.19Classical error decreases precision and can lead to bias in linear probability models (Hausman, 2001).20Scott (2009) discusses oral history traditions.21Note that recall data is, on average, correct, since the reported distribution is centered around the true mean.
29

chology frequently resort to time cues. Time cues are common knowledge events that are designed
to allow the respondent and surveyor to identify the time at which a given reported event oc-
curred. The literature in psychology suggests that times cues substantially reduce measurement
error about the timing of events.22 Second, examining recall data on income, de Nicola and Gine
(2014) find that recalling changes is easier than recalling levels. A similar fact is documented for
recalling events vs. levels (Kjellsson, Clarke, and Gerdtham, 2014). Finally, the literature suggests
that male household heads who are the owners of the productive assets provide more accurate re-
sponses (de Nicola and Gine, 2014). We draw on these lessons before designing safeguards against
measurement error during the data collection design in Sanchez de la Sierra (2017) and replicate
and extend this methodology in this paper. We describe such safeguards next.23
8.2 Safeguards against measurement error due to recall
The oral history literature warns against the risk that surveyors may have biases, which could
influence how questions are asked, primed, and even how the they are recorded. Training, and
all external communications of the project mention that the major objective of the project is
to reconstruct the socio-economic history of the province of Sud-Kivu in order to better ground
future policy on evidence.
A second risk is the bias of respondents. Drawing on the lessons from the cognitive sciences
literature, the survey protocol was designed precisely to safeguard against biases that may arise
from eyewitnesses. The data collection activities for one observation were planed to take 7 days,
consisting of multiple activities designed to reduce recall error. We designed such activities pre-
cisely to address the following concerns: (biased) measurement recall error about what happened
by individual respondents; measurement recall error about when events happened (telescoping);
heterogeneity in response accuracy. First, recall error may be larger for events further in the
past, and bad times may be recalled worse. Furthermore, the anthropology literature in turn
suggests that the information retained by the elite may have a political agenda. Because the main
variables are about a common event, not about individuals, we can rely on triangulation methods
22See, for instance Brown, Shevell, and Rips. (1986), and Conway and Bekerian (1987). de Nicola and Gine(2014) compare surveys with and without time cues and find no significant improvement as a result of time cues,but note that irrelevant time cues can increase measurement error.
23Another concern with this literature is survivor bias. Since the unit of analysis is the municipality, andmunicipalities do not disappear over the period of study, this is not the major threat to validity in this paper.
30

used in the qualitative social sciences, which consist of verifying information from multiple sources,
and in multiple methods (Rothbauer, 2008). Surveyors first collect information directly from a
group of 5-10 individuals (including Chief, elders, and mining sector experts), who themselves
also are trained to triangulate information. These individuals are trained and monitored each of
7 days, and the final gathering of information occurs the last day. In addition, surveyors con-
duct 8 in-depth surveys in private, 4 hours long with each household. In each household survey,
they reconstruct the history of the village during a 4 hours discussion in private with a randomly
selected adult.24 Furthermore, the surveyors every day conduct qualitative surveys with various
actors in the village, which they then type in the computer for the researchers to individually
verify each observation. Triangulating information from multiple sources allows the surveyors to
reduce the measurement error — an application of the law of large numbers to the multiple signals
they receive about the municipality’s history. In addition, triangulation also allows them to verify
information in private from individuals who are not from the elite, since the elite may have its own
agenda.25 This approach allowed me to secure that by the end of the week, before the day-long in-
terview with the history specialists, the surveyors had no doubts about the history of the village,
including knowledge of what facts may have been sensitive through the intimate conversations
with households.26 Second, de Nicola and Gine (2014) suggest that male respondents who are
owners of the assets of production provide more accurate answers. In this context, households
are led by household “chiefs”, who are the owners of the households productive assets. To take
advantage of this, we administered the 8 household surveys exclusively on adult male respondents.
Third, to improve the precision of reported dates, we instructed the surveyors to implement an
exhaustive set of time cues to reduce measurement error associated with the years. The time cues
reflect well-known historical events that affected the whole region and that were fine-tuned for
this specfic study of North Kivu. To develop these cues, we consulted surveyors and local experts.
Informal evidence suggests this strategy was very effective at identifying years.27 Finally, since
the psychology literature suggests that events and transitions are much easier to recall, and based
24To improve the quality of this information, respondents were allowed to ask for another household memberfor help about village history facts, but had to remain in private for any other question.
25In the reports, surveyors note explanations for patterns in the data and provide descriptions of how the banditsand civilians perceive their relationship. Also, this allows me to wash out the biases that may arise if the eliteparticularly benefited from the shock and was able to recall events around the shock better.
26An important cultural factor that may limit the replicability of this study in civil war contexts outside theCongo is that individuals are extremely communicative, especially about armed groups.
27A respondent may not know the year at which she got married, but she always knows if it was after Mobutu,and before the RCD took Bukavu, in which case it could only be 1997.
31

on Sanchez de la Sierra (2017), the survey questionnaire was re-designed so that survey questions
focus on transitions, rather than levels, and events easy to memorize. For instance, respondents
are not asked to report, every year their wealth, or every year the type of governance in the village.
Instead, surveyors asked “Was there ever an organization of security/stationary bandit in this vil-
lage?” If yes, the surveyor proceeds: “let’s begin with the first of these organizations” and first
focuses on emphasizing the respondent’s memory by identifying well the group and its properties.
Convinced that the respondent has narrowed down her imagination onto such stationary bandit
episode and the resulting governance arrangements, the surveyor then proceeds to ask about when
the group started, and which years it begun which governance activity.28
By the end of the week of data collection in each municipality, learning was so effective that
additional sources brought basically no change in our priors.
8.3 Measuring the measurement error due to recall
Sanchez de la Sierra (2017) benchmarked the data collected to data collected using other exist-
ing sources of knowledge, including knowledge from historians as well as the ACLED datasets.
Figures 3 plots the survey-based measures of armed groups’ presence collected in this study, and
pooled with the same data as collected in the foundational Sud Kivu study. Figure 11 plots attacks
measured in the Sud Kivu study on years. Both figures show that the data reflect perfectly the
well-known phases of the DRC conflict.29
Second, using the attacks data of the Sud Kivu study Sanchez de la Sierra (2017) took ad-
vantage of an alternative, data source for violent events, ACLED.30, Sanchez de la Sierra (2017)
assigns the number of attacks recorded that year in ACLED in the proximity of the municipality,
for each municipality*year observation.31 Sanchez de la Sierra (2017) compares this data to the
survey data on attacks at the municipality graphically. Figure 11 shows that the ACLED dataset
28Once the memory of one group was activated, the “marginal cost” of recalling additional events about thatgroup was close to zero, but transitioning between groups was the costliest and could exhaust respondents quickly.
29For a detailed description, see Sanchez de la Sierra (2017).30This dataset has been used for the DRC context, notably by Maystadt, De Luca, Sekeris, and Ulimwengu
(2014), Koenig, Rohner, Thoenig, and Zilibotti (2015), and Parker and Vadheim (2016)31Geo-coded violent events of ACLED were assigned to circles of varying diameter around the survey munici-
palities. ACLED data focuses on violent events and is based on news reports. The ACLED dataset contains 3,500violence events since 1997, coded by type of event. When an event falls in circles of more than one village, event wasassigned to all corresponding villages. ACLED reports details about the type of event. To construct the variable“attack” from ACLED, the total of events recorded by ACLED were taken, and all events that are not attacks foreach year*village observation were subtracted. The non-violent events are: strategic movements, riots, non violenttransfer of territory, non violent events, and whether an armed changes headquarters.
32

systematically reports less battles than the Sud Kivu survey, and that such gap is especially strong
during the Second Congo War. The ACLED data seems to under-report the most important waves
of the conflict. This provides additional confidence in the precision of this data.32 Having matched
the two data sources, Sanchez de la Sierra (2017) also addressed measurement error issues for-
mally in a regression framework, and estimated that there is basically no bias in the survey data
to examine the effect of shocks in the past, as compared to the benchmark of the ACLED data.33
9 Conclusion
This paper examines the type of governance institutions created by armed groups since 1990 in
a sample of 106 villages of Nord Kivu. We find that armed groups vary richly in the type of
institutions they create, along multiple dimensions. We propose an approach to systematically
operationalize the type of armed group’s governance along an indirect rule vector, and a direct rule
vector. We find that armed groups are more likely to choose indirect rule when they do not have
ethnic ties with the village population, and when the traditional chief instead has ethnic ties with
the population, and is hence, better able as an agent for the group. We further find that over time,
however, armed groups consistently create institutions of direct rule, progressively penetrating all
aspects of the political and economic life of the village as years under control increase. Using
implicit association tests and survey data, we find no evidence to sustain that exposure to indirect
rule undermines the support for the chief.
References
Acemoglu, D., I. N. Chaves, P. Osafo-Kwaako, and J. A. Robinson (2014): “Indirect
Rule and State Weakness in Africa: Sierra Leone in Comparative Perspective,” Working Paper
20092, National Bureau of Economic Research.
Acemoglu, D., T. Reed, and J. A. Robinson (2013): “Chiefs: Elite Control of Civil So-
ciety and Economic Development in Sierra Leone,” Working Paper 18691, National Bureau of
Economic Research.
32The attacks data are currently being cleaned. An updated figure will include the North Kivu data.33For a detailed discussion, see Sanchez de la Sierra (2017).
33

Arjona, A., N. Kasfir, and Z. C. Mampilly (2017): Rebel governance in civil war.
Bates, R. (1987): Essays on the political economy of rural Africa. University of California Press,
California.
Besley, T., and T. Persson (2009): “The Origins of State Capacity: Property Rights, Taxa-
tion, and Politics,” American Economic Review, 99(4), 1218–44.
Bluemke, M., and M. Friese (2008): “Reliability and Validity of the Single-Target IAT
(STIAT): Assessing Automatic Affect Toward Multiple Attitude Objects,” European Journal
of Social Psychology, 38, 977–997.
Boone, C. (2003): Political topographies of the African state : territorial authority and institu-
tional choice. Cambridge University Press.
Boone, C. (2007): Political Topographies of the African State: Territorial Authority and Insti-
tutional Choice. Cambridge University Press, Cambridge.
Brown, N., S. Shevell, and L. Rips. (1986): Public memories and their personal context.
Cambridge University Press.
Chretien, J. (2000): L’Afrique des grands lacs - Deux Mille Ans d’histoire. Aubier.
Conway, M., and D. Bekerian (1987): “Organization in autobiographical memory,” Memory
and Cognition, 119(15(2)).
de Nicola, F., and X. Gine (2014): “How accurate are recall data? Evidence from coastal
India,” Journal of Development Economics, 106(C), 52–65.
Engelbert, P., and D. Tull (2013): “Republique Democratique du Congo: Terrains disputes
(Introduction to special issue of Politique Africaine),” Politique Africaine, 129.
Flannery, K., and J. Marcus (2012): The Creation of Inequality: how our prehistoric ances-
tors set the stage for monarchy, slavery, and empire. Harvard University Press.
Fund For Peace (2013): “Failed states Index,” Policy report, Fund For Peace.
34

Greenwald, A. G., D. E. McGhee, and J. L. K. Schwartz (1998): “Measuring individual
differences in implicit cognition: The Implicit Association Test,” Journal of Personality and
Social Psychology, 74, 14641480.
Greif, A. (2008): “Towards a political economy of implementation,” in Institutions and economic
performance, ed. by E. Helpman, pp. 17–63. Harvard Univ. Press.
Hausman, J. (2001): “Mismeasured Variables in Econometric Analysis: Problems from the Right
and Problems from the Left,” The Journal of Economic Perspectives, 15(4), 57–67.
Hechter, M., and N. Kabiri (2010): “Attaining social order in Iraq,” in Order, Conflict, and
Violence, ed. by S. N. Kalyvas, I. Shapiro, and T. Masoud, pp. 43–74. Cambridge University
Press, Cambridge.
Herbst, J. (2011): States and Power in Africa: Comparative Lessons in Authority and Control.
Princeton University Press, New Heaven and London.
Hoffmann, K. (2014): Ethnogovernmentality: The Making of Ethnic Territories and Subjects in
Eastern Congo : Ph.D. Dissertation. Doctoral School of Society and Globalisation, Department
of Society and Globalisation, Roskilde University.
Hoffmann, K., K. Vlassenroot, and G. Marchais (2016): “Taxation, Stateness and
Armed Groups: Public Authority and Resource Extraction in Eastern Congo,” Development
and Change, 47(6), 1434–1456.
Kalyvas, S. N. (2006): The logic of violence in civil war. Cambridge University Press.
Kjellsson, G., P. Clarke, and U.-G. Gerdtham (2014): “Forgetting to remember or re-
membering to forget: A study of the recall period length in health care survey questions,”
Journal of Health Economics, 35, 34 – 46.
Koenig, M., D. Rohner, M. Thoenig, and F. Zilibotti (2015): “Networks in Conict:
Theory and Evidence from the Great War of Africa,” Working paper.
Lowes, S., N. Nunn, J. A. Robinson, and J. Weigel (2015a): “The Evolution of Culture
and Institutions: Evidence from the Kuba Kingdom,” Workin Paper.
35

(2015b): “Understanding Ethnic Identity in Africa: Evidence from the Implicit Associ-
ation Test (IAT),” American Economic Review Papers and Proceedings, 105, 340–345.
Mamdani, M. (1996): Citizen and Subject: Contemporary Africa and the Legacy of Late Colo-
nialism. Princeton University Press, Princeton.
(2012): Define and Rule: Native as Political Identity. Harvard University Press.
Mampilly, Z. C. (2011): Rebel rulers insurgent governance and civilian life during war. Cornell
University Press.
Maystadt, J.-F., G. De Luca, P. G. Sekeris, and J. Ulimwengu (2014): “Mineral re-
sources and conflicts in DRC: a case of ecological fallacy?,” Oxford Economic Papers, 66(3),
721–749.
Morvan, H. (2005): Reinventer le quotidien : la cohabitation des populations civiles et des
combattants mai-mai au Kivu : analyse d’enquetes menees a Bunyakiri, Sud-Kivu, Republique
Democratique du Congo, de janvier a mai 2003. Uppsala Life and Peace institute.
Nest, M. (2011): Coltan. Polity Press, Cambridge, UK.
Newbury, D. (1992): Kings and Clans: Ijwi Island and the Lake Kivu Rift, 17801840. University
of Wisconsin Press; 1St Edition editio.
(2009): The Land Beyond the Mists: Essays on Identity and Authority in Precolonial
Congo and Rwanda. Ohio University Press.
Nosek, B. A., A. G. Greenwald, and M. R. Banaji (2006): “The Implicit Association Test
at age 7: A methodological and conceptual review,” in Social psychology and the unconscious:
The automaticity of higher mental processes, ed. by J. A. Bargh. Psychology Press, New York.
Padro I Miquel, G., and P. Yared (2012): “The Political Economy of Indirect Control *,”
The Quarterly Journal of Economics, 127(2), 947–1015.
Parker, D. P., and B. Vadheim (2016): “Resource Cursed or Policy Cursed? U.S. Regulation
of Conflict Minerals and Violence in the Congo,” Journal of the Association of Environmental
and Resource Economics, forthcoming.
36

Referentiel Geographique Commun (2010): “Donnees Administratives and Donnees
Physiques,” Data source, Referentiel Geographique Commun.
Rothbauer, P. (2008): “Triangulation,” .
Sanchez de la Sierra, R. (2014): “On the Ends of the State,” Unpublished.
(2017): “On the origin of states: Stationary Bandits and Taxation in Eastern Congo,”
Unpublished.
Scott, J. (2009): The Art of Not Being Governed: An Anarchist History of Upland Southeast
Asia. Yale University, New Heaven and London.
Stearns, J. (2011): Dancing in the Glory of Monsters. Public Affairs, New York, NY.
Stearns, J., and C. Vogel (2015): The Landscape of Armed Groups in Eastern Congo. Center
on International Cooperation at New York University, New York.
Tilly, C. (1985): “War Making and State Making as Organized Crime,” in Bringing the State
Back In, ed. by T. S. Peter Evans, Dietrich Rueschemeyer, Cambridge. Cambridge University
Press.
(1990): Coercion, Capital and European States. Blackwell, Cambridge, MA.
Tourangeau, R., L. Rips, and K. Rasinski (2000a): Pillars of Prosperity: The Political
Economics of Development Clusters. Cambridge University Press.
(2000b): “Remembering what happened: Memory errors and survey reports,” vol. 29.
US: Lawrence Erlbaum Associates Publishers.
United Nations Security Council (2002): “Final Report of the Panel of Experts on the
Illegal Exploitation of Natural Resources and Other Forms of Wealth of the Democratic Republic
of Congo,” Policy report.
Vansina, J. (1978): The Children of Woot: A History of the Kuba Peoples. University of Wis-
consin Press, Madison.
(2005): Antecedents to Modern Rwanda: The Nyiginya Kingdom. University of Wisconsin
Press, Madison.
37

Verweijen, J. (2013): “Military Business and the Business of the Military in the Kivus,” Review
of African Political Economy, 40(135), 67–82.
Wood, E. J. (2003): Insurgent collective action and civil war in El Salvador. Cambridge Univer-
sity Press.
A Figures
Figure 1: Descriptive statistics of traditional chiefs
Notes: The upper left panel presents the distribution of the number of chiefs across time,for each village, recordedin the survey, since 1990. The upper right panel presents the distribution of the typical reign length for a chief inthe sample in years. The lower left panel presents the proportion of land owned by the chief today. The lower rightpanel presents the distribution of the causes of chiefs’ death.
38

Figure 2: Descriptive statistics of episodes of armed groups
Notes: The upper left panel shows the number of armed group episodes per village since 1990 in each village. Theupper right panel shows the distribution of the duration of control for each armed group’s episode. The lower leftpanel presents the distribution of the years under armed group control per village. The lower right panel shows theoccurrence of different armed groups by territory.
39

Figure 3: Composition of armed actors across the period
All mining sites and support villages in Sud Kivu and Nord Kivu sample (n=650)
Notes: This figure graphs the proportion of sites in the sample under the control of armed actors on year usingthe data from this study in Nord Kivu, pooled with the data from Sud Kivu. The dashed vertical lines indicatethe start and end of the Second Congo War. The state integrated local armed groups into the national army after2003, only partially changing their structures of command or autonomy. The distinction between the CongoleseArmy and irregular armed groups is thus often blurred. Source: Sanchez de la Sierra (2017).
40

Figure 4: Dimensions of direct rule
Panel A: Taxation and tribute Panel B: Recruitment campaigns
Panel C: Legitimation Panel D: Administration
Panel E: Political power Panel F: Public servic
Panel G: Economic regulation
Notes: This figure shows the mean of the various dimensions of the direct rule vector. The panels restrict the datato the years in which an armed group is ruling in the village. Panel A shows the proportion of years under anarmed group’s episode in which a head tax is collected for the group, and where the armed group is charged tocollect the head tax. Panel B shows the proportion of recruitments for the group organized by the group. Panel Cshows the legitimation efforts for the group tasked to the group. Panel D shows the proportion of years in whichthe village administration was managed directly by the group. Panel E shows the distribution of political powerwhen armed groups control a village. Panel F shows the proportion of years in which armed groups deliver publicservices. Panel G shows the proportion of years in which armed groups regulated the local economy.
41

Figure 5: Dimensions of indirect rule
Panel A: Taxation and tribute Panel B: Recruitment campaigns
Panel C: Legitimation Panel D: Administration
Panel E: Political power
Notes: This figure shows the mean of the various dimensions of the indirect rule vector. The panels restrict thedata to the years in which an armed group is ruling in the village. Panel A shows the proportion of years under anarmed group’s episode in which a head tax is collected for the group, and where the chief is charged to collect thehead tax. Panel B shows the proportion of recruitments for the group organized by the chief. Panel C shows thelegitimation efforts for the group tasked to the chief. Panel D shows the proportion of years in which the villageadministration is left in the chief’s hands. Panel E shows the distribution of political power when armed groupscontrol a village.
42
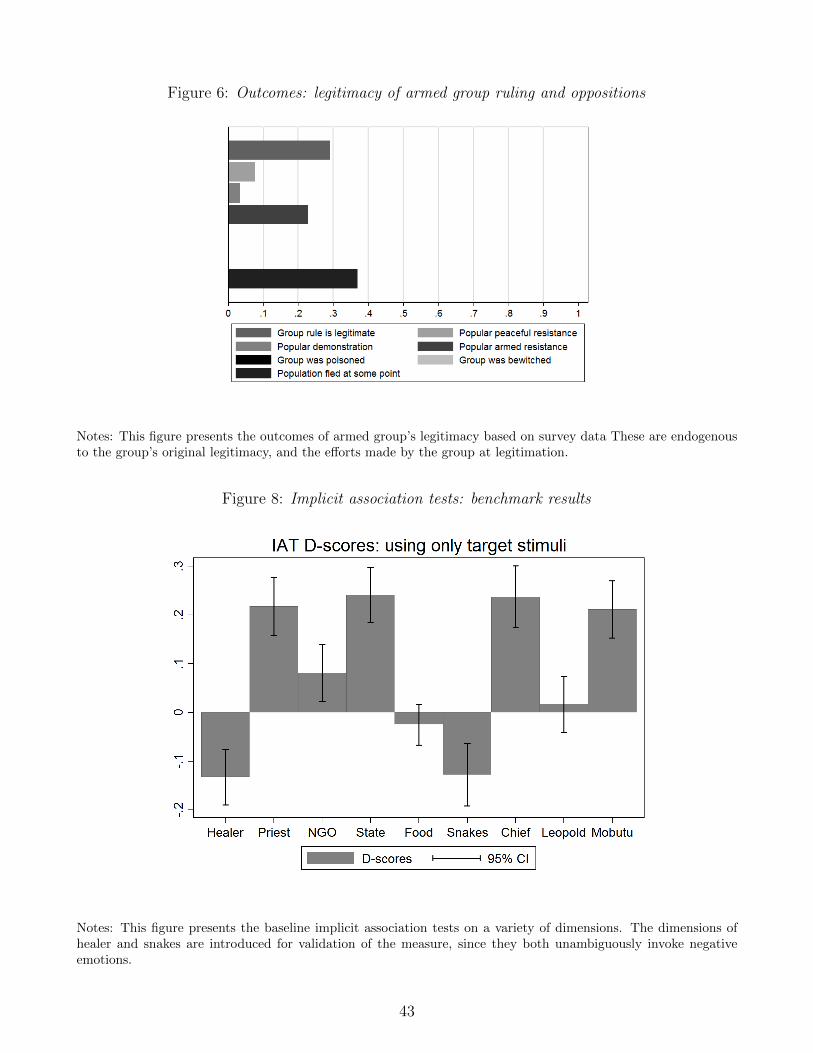
Figure 6: Outcomes: legitimacy of armed group ruling and oppositions
Notes: This figure presents the outcomes of armed group’s legitimacy based on survey data These are endogenousto the group’s original legitimacy, and the efforts made by the group at legitimation.
Figure 8: Implicit association tests: benchmark results
Notes: This figure presents the baseline implicit association tests on a variety of dimensions. The dimensions ofhealer and snakes are introduced for validation of the measure, since they both unambiguously invoke negativeemotions.
43

Figure 7: Effects of armed group’s tenure on type of rule
Panel A: Indirect rule index Panel B: Direct rule index
-4.5
-4
-3.5
-3
-2.5
-2
-1.5
-1
-0.5
0
2 3 4 5 6 7 8 9 10
Co
effi
cien
t m
agn
itu
de
-ef
fect
of
add
itio
nal
yea
r o
n in
dir
ect
rule
in
dex
Years since start of armed group episode in village - with episode fixed effects and year fixed effects
0
1
2
3
4
5
6
7
8
2 3 4 5 6 7 8 9 10
Co
effi
cien
t m
agn
itu
de
-ef
fect
of
add
itio
nal
yea
r o
n d
irec
t ru
le i
nd
exYears since start of armed group episode in village - with episode fixed effects and year fixed effects
Panel C: Direct rule index - Indirect rule index
0
2
4
6
8
10
12
2 3 4 5 6 7 8 9 10
Co
effi
cien
t m
agn
itu
de
-ef
fect
of
add
itio
nal
yea
r o
n d
iffe
ren
ce:
dir
ect
rule
ind
ex-
ind
irec
t ru
le in
dex
Years since start of armed group episode in village - with episode fixed effects and year fixed effects
Notes: This figure shows the effect of additional years of armed groups’ tenure on the type of institution created.In all figures, we regress the governance indices on armed group episode fixed effects, on year fixed effects, andon group tenure fixed effects. The group tenure variable indicates how many years, after the start, have elapsedsince the group controls the village, for each specific armed group episode. The figures present the coefficient oneach group tenure year dummy. Thus, the value on the vertical axis indicates the magnitude of the effect of anadditional year of tenure in the village on the governance indices.
44

Figure 9: Implicit association tests: armed groups’ results
Notes: This figure presents the implicit association tests for authorities Overall, associations are slightly morepositive for the Congolese army, the traditional chiefs, and the Congolese state than for any armed group or thecolonial state, but the differences are not significant. The least negatives armed groups are the raia mutombokisand the RCD, while those generating the most negative assocaitons are the M23, the FDLR and the Mayi Mayis.
45

Figure 10: Recorded violent Events and known historical rebellions (Sanchez de la Sierra, 2017)
Notes: This figure plots the number of attacks on the sample villages by different armed organization identified in the survey for each year and uses wellknown dates for known historical rebellions as a benchmark. The left axis indicates the number of attacks recorded in the sample by armed actors of agiven armed organization, and the horizontal axis indicates the year. The dates of the attacks recorded from the survey coincide exactly with well knownhistorical rebellions, which are marked by the vertical lines. The thin dotted line indicates attacks by the AFDL, the thick solid black line indicates attacksby the RCD, the black thick dashed line indicates the number of attacks by the Mayi-Mayi’s, the thin dahed line with triangles indicates the number ofattacks by the FDLR and the thin dashed line with crosses indicates the number of attacks by the Raia Mutomboki. Correspondingly, the vertical blue lineat 1996 marks the period of the AFDL rebellion as known from history; the black vertical dotted lines at 1998 and 2003 bound the Second Congo War; thevertical dotted line indicates the date of the CNDP offensive, the green vertical dashed line at 2009 marks the Kimia II military intervention, which resultedin massive pillage operations by the FDLR to acquire resources as their financial base was being disrupted, and the red vertical dashed line at 2011 indicatesthe known year of the emergence of the Raia Mutomboki. While the number of recorded attacks is larger in the data, the source used in this figure is theattacks module, which focuses on the details of the major attacks on the village, and which has extensive details about the attack (perpetrator identity,group size, hour of the attack, activities in village, types of violence and amounts stolen).
46

Figure 11: Classical measurement error due to recall? Survey and ACLED violent events (Sanchez de la Sierra, 2017)
Notes: This figure plots the number of attacks on the sample villages I recorded in the survey, as well as the number of attacks recorded by ACLED whichare located in the neighborhood of the survey villages. I represent the total number of attacks recorded in the survey with the solid line, and the numberof attacks recorded from ACLED in the neighborhood of my survey villages with the dashed lines, for different perimeters around the villages. To assignbattles recorded by ACLED to the survey villages, I computed the number of geo-located ACLED battles that were located within a given perimeter of thesurvey village. The dashed lines report the results using the number of events of ACLED near the village using circles of radius 10km, 5 km, and 2 km.The solid line, obtained with data from this survey, matches to well-known phases of the Congo Conflict. The number of attacks rises in 1998 drastically,with the beginning of the Second Congo War, and in 2000 during the coltan shock. Attacks then decrease with the post-conflict period, and rise again in2009, 2010. This last rise is the rise in attacks by the FDLR in response to the Kimia II military operation by the Congolese Army (see Sanchez de la Sierra(2014)). In contrast to the survey data, the geo-referenced ACLED dataset does not capture these trends, especially for the First and Second Congo Wars.This provides additional confidence in the attacks data from the survey and suggests the ACLED data may not be suitable for geo-located analyses duringthe Congo wars.
47

B Tables
Table 1: Modes of armed groups’ governance (Sud Kivu and North Kivu, pooled)
Distribution of governance episode by major groupType of rule frequency percentage Mayi-Mayis RCD Raia M. Army FDLR other
Any rule 508 100% 126 106 38 130 43 65Indirect rule 164 32% 40 30 11 70 4 9Shared rule 100 20% 23 24 17 22 5 9Direct rule 192 38% 53 46 9 15 22 47Unknown 52 10% 10 6 1 23 12 0
Total villages 239
Notes: This table presents the distribution of political power across armed groups episodes of governance in NorthKivu and Sud Kivu. While there is significant variation in the type of rule along this dimension, there is also largevariation within armed groups and across villages and periods. The dimension of political power is the only onethat is also found in the Sud Kivu pilot sample.
48

Table 2: Impact of ethnicity - direct rule
(1) (2) (3) (4) (5) (6) (7) (8) (9) (10)DIRECT DIRECT DIRECT DIRECT DIRECT DIRECT DIRECT DIRECT DIRECT DIRECT
VARIABLES taxation recruitment legitimation service regulation admin justice political size INDEX
Coethnic Group-Villagers -0.03 0.08 0.16 0.37** -0.22 -0.02 0.23 0.18 -0.15 0.15(0.14) (0.10) (0.18) (0.16) (0.16) (0.18) (0.17) (0.18) (0.20) (0.61)
Coethnic Village-Chief -0.29** -0.02 -0.16 -0.36** -0.44*** -0.30* -0.44*** -0.44** 0.03 -1.98***(0.14) (0.10) (0.17) (0.15) (0.16) (0.17) (0.16) (0.17) (0.19) (0.58)
Constant 0.46*** 0.53*** 0.46*** 0.12 0.43*** 0.10 0.31** 0.54*** 0.05 2.97***(0.13) (0.09) (0.16) (0.15) (0.15) (0.16) (0.15) (0.16) (0.18) (0.54)
Observations 198 198 198 198 198 198 198 189 198 189R-squared 0.61 0.26 0.63 0.28 0.47 0.49 0.44 0.41 0.39 0.52Year FE YES YES YES YES YES YES YES YES YES YESA. G. FE YES YES YES YES YES YES YES YES YES YES
Notes: This table shows the OLS regressions of the direct rule vector on the coethnicity between the ruling armed group and villagers, and the coethnicityof the villagers and the chief. All regressions use armed group’s episode fixed effects and year fixed effects.
49

Table 3: Impact of ethnicity - indirect rule
(1) (2) (3) (4) (5) (6) (7)Indirect Indirect Indirect Indirect Indirect Indirect Indirect
VARIABLES taxation recruitment legitimation admin justice political INDEX
Coethnic Group-Villagers 0.16 -0.01 0.31 -0.16 -0.23 -0.11 0.05(0.15) (0.18) (0.22) (0.15) (0.17) (0.15) (0.49)
Coethnic Village-Chief 0.05 0.13 -0.06 0.35** 0.44*** 0.25* 1.07**(0.15) (0.17) (0.21) (0.14) (0.16) (0.14) (0.47)
Constant 0.18 -0.13 0.10 -0.42*** -0.31** -0.35** -0.89**(0.14) (0.16) (0.20) (0.14) (0.15) (0.14) (0.44)
Observations 198 198 198 198 198 189 189R-squared 0.47 0.37 0.25 0.50 0.44 0.44 0.30Year FE YES YES YES YES YES YES YESA. G. FE YES YES YES YES YES YES YES
Notes: This table shows the OLS regressions of the indirect rule vector on the coethnicity between the ruling armed group and villagers, and the coethnicityof the villagers and the chief. All regressions use armed group’s episode fixed effects and year fixed effects.
50

Table 4: Impact of chief’s kinship with villagers on governance mode during armed group’s episode- direct rule
(1) (2) (3) (4) (5) (6) (7) (8) (9) (10)DIRECT DIRECT DIRECT DIRECT DIRECT DIRECT DIRECT DIRECT DIRECT DIRECT
VARIABLES taxation recruitment legitimation service regulation admin justice political force INDEX
Kinship village-chief (# families) -0.09* 0.05 0.06 0.01 -0.09 0.23*** -0.09 -0.15** 0.13* 0.10(0.05) (0.03) (0.06) (0.03) (0.06) (0.06) (0.06) (0.06) (0.07) (0.21)
Constant 0.50*** 0.36*** 0.15 -0.17** 0.32* -0.84*** 0.23 0.65*** -0.33 1.12*(0.15) (0.10) (0.19) (0.08) (0.17) (0.18) (0.18) (0.18) (0.21) (0.64)
Observations 176 176 176 176 176 176 176 169 176 169R-squared 0.61 0.28 0.59 0.22 0.44 0.54 0.46 0.40 0.37 0.48Year FE YES YES YES YES YES YES YES YES YES YESA. G. FE YES YES YES YES YES YES YES YES YES YES
(1) (2) (3) (4) (5) (6) (7)Indirect Indirect Indirect Indirect Indirect Indirect Indirect
VARIABLES taxation recruitment legitimation admin justice political INDEX
Kinship village-chief (# families) -0.10* -0.01 0.15** -0.05 0.09 0.02 0.12(0.05) (0.06) (0.07) (0.05) (0.06) (0.05) (0.17)
Constant 0.55*** 0.03 -0.33 -0.04 -0.23 -0.22 -0.29(0.16) (0.19) (0.22) (0.17) (0.18) (0.16) (0.51)
Observations 176 176 176 176 176 169 169R-squared 0.42 0.38 0.28 0.44 0.46 0.41 0.30Year FE YES YES YES YES YES YES YESA. G. FE YES YES YES YES YES YES YES
Notes: This table shows the OLS regressions of the direct rule and indirect rule vectors on the strength of the kinship connections between the villagers andthe chief, for each armed group ruling episode. All regressions use armed group’s episode fixed effects and year fixed effects.
51

Table 5: Impact of chief’s land ownership on governance mode
(1) (2) (3) (4) (5) (6) (7) (8) (9) (10)DIRECT DIRECT DIRECT DIRECT DIRECT DIRECT DIRECT DIRECT DIRECT DIRECT
VARIABLES taxation recruitment legitimation service regulation admin justice size political INDEX
Chief-owned land (prop), 1998 0.01 0.03 -0.05 0.26* 0.13 -0.43*** 0.56*** -0.12 0.51*** 0.41(0.13) (0.09) (0.15) (0.14) (0.14) (0.16) (0.15) (0.19) (0.16) (0.59)
Constant 0.20** 0.54*** 0.36*** -0.20** -0.05 0.08 -0.40*** 0.15 -0.05 1.14***(0.09) (0.06) (0.10) (0.10) (0.10) (0.11) (0.11) (0.13) (0.11) (0.42)
Observations 202 202 202 202 202 202 202 202 190 190R-squared 0.57 0.26 0.63 0.32 0.43 0.49 0.47 0.32 0.42 0.44Year FE YES YES YES YES YES YES YES YES YES YESA. G. FE YES YES YES YES YES YES YES YES YES YES
(1) (2) (3) (4) (5) (6) (7)Indirect Indirect Indirect Indirect Indirect Indirect Indirect
VARIABLES taxation recruitment legitimation admin justice political INDEX
Chief-owned land (prop), 1998 0.15 -0.40** 0.04 -0.30** -0.56*** -0.40*** -1.61***(0.13) (0.16) (0.19) (0.14) (0.15) (0.14) (0.46)
Constant 0.17* 0.21* 0.04 0.00 0.40*** 0.09 1.02***(0.09) (0.11) (0.13) (0.10) (0.11) (0.10) (0.33)
Observations 202 202 202 202 202 190 190R-squared 0.48 0.35 0.20 0.43 0.47 0.43 0.32Year FE YES YES YES YES YES YES YESA. G. FE YES YES YES YES YES YES YES
Notes: This table shows the OLS regressions of the direct rule and indirect rule vectors on the proportion of land owned by the chief in the village prior tothe conflicts, in 1998. The proportion of the land owned by the chief is a proxy for chief power. We chose the variable in 1998 to avoid using instead thecurrent proportion, which is endogenous to the armed groups’ rule episodes. All regressions use armed group’s episode fixed effects and year fixed effects.
52

Table 6: Impact of armed group’s tenure on governance mode - direct rule
(1) (2) (3) (4) (5) (6) (7) (8) (9) (10)DIRECT DIRECT DIRECT DIRECT DIRECT DIRECT DIRECT DIRECT DIRECT DIRECT
VARIABLES taxation recruitment legitimation service regulation admin justice political force INDEX
Group’s tenure (# years) 0.17*** 0.00 -0.03 0.01 0.02 0.01** 0.19*** 0.00 0.16*** 0.49***(0.02) (0.00) (0.03) (0.02) (0.02) (0.00) (0.02) (0.00) (0.02) (0.07)
Constant 1.65*** 0.51 -0.01 -0.22 0.15 0.03 1.83*** 0.04 1.56*** 5.76***(0.28) (0.00) (0.42) (0.29) (0.27) (0.04) (0.33) (0.00) (0.34) (1.00)
Observations 1,002 1,002 1,002 1,002 1,002 1,002 1,002 931 1,002 931R-squared 0.94 1.00 0.86 0.93 0.94 1.00 0.91 1.00 0.90 0.95Year FE YES YES YES YES YES YES YES YES YES YESA.G. Episode FE YES YES YES YES YES YES YES YES YES YES
(1) (2) (3) (4) (5) (6) (7)Indirect Indirect Indirect Indirect Indirect Indirect Indirect
VARIABLES taxation recruitment legitimation admin justice political INDEX
Group’s tenure (# years) 0.08*** 0.00 -0.22*** -0.05** -0.19*** -0.00 -0.39***(0.02) (0.01) (0.04) (0.02) (0.02) (0.00) (0.05)
Constant 0.75** 0.11 -2.38*** -0.36 -1.83*** 0.00 -3.71***(0.30) (0.17) (0.53) (0.30) (0.33) (0.00) (0.78)
Observations 1,002 1,002 1,002 1,002 1,002 931 931R-squared 0.93 0.98 0.78 0.93 0.91 1.00 0.91Year FE YES YES YES YES YES YES YESA.G. Episode FE YES YES YES YES YES YES YES
Notes: This table shows the OLS regressions of the direct rule and indirect rule vectors on the armed group’s tenure in the village for each specific episode.All regressions use armed group’s episode fixed effects and year fixed effects.
53

Table 7: Impact of chief’s tenure on governance mode - direct rule
(1) (2) (3) (4) (5) (6) (7) (8) (9) (10)DIRECT DIRECT DIRECT DIRECT DIRECT DIRECT DIRECT DIRECT DIRECT DIRECT
VARIABLES taxation recruitment legitimation service regulation admin justice political force INDEX
Chief years in power -0.02** 0.01 -0.01 0.01 0.01 0.01 -0.02** -0.01 -0.01 -0.03(0.01) (0.00) (0.01) (0.01) (0.01) (0.01) (0.01) (0.01) (0.01) (0.03)
Constant 0.04 0.59 0.70 -0.32 0.01 0.05 0.47 -0.07 0.33 2.37(0.67) (0.52) (0.83) (0.92) (0.91) (0.99) (0.85) (0.97) (1.11) (3.24)
Observations 164 164 164 164 164 164 164 156 164 156R-squared 0.79 0.54 0.80 0.50 0.60 0.66 0.65 0.58 0.52 0.66Year FE YES YES YES YES YES YES YES YES YES YESA. G. FE YES YES YES YES YES YES YES YES YES YES
(1) (2) (3) (4) (5) (6) (7)Indirect Indirect Indirect Indirect Indirect Indirect Indirect
VARIABLES taxation recruitment legitimation admin justice political INDEX
Chief years in power -0.01 -0.01 -0.01 0.01* 0.02** 0.01 0.02(0.01) (0.01) (0.01) (0.01) (0.01) (0.01) (0.03)
Constant 0.26 0.47 0.92 -0.22 -0.47 0.49 1.45(0.77) (0.98) (1.15) (0.78) (0.85) (0.74) (2.60)
Observations 164 164 164 164 164 156 156R-squared 0.67 0.59 0.50 0.65 0.65 0.63 0.54Year FE YES YES YES YES YES YES YESA. G. FE YES YES YES YES YES YES YES
Notes: This table shows the OLS regressions of the direct rule and indirect rule vectors on the number of years that the chief was in power prior to the startof the armed group’s episode. All regressions use armed group’s episode fixed effects and year fixed effects.
54

Table 8: Impact of indirect and direct rule exposure on today’s support towards the chief - Implicit association tests
(1) (2) (3) (4) (5) (6) (7) (8) (9)IAT IAT IAT IAT IAT IAT IAT IAT IAT
VARIABLES Chief Chief Chief Chief Chief Chief Chief Chief Chief
Indirect tax 0.02(0.04)
Direct tax -0.04(0.06)
Indirect recruit -0.01(0.03)
Direct recruit 0.01(0.02)
Indirect legitimation -0.01(0.02)
Direct legitimation 0.02(0.05)
Indirect admin 0.02(0.02)
Direct admin -0.02(0.02)
Indirect justice 0.02(0.03)
Direct justice -0.01(0.01)
Indirect political 0.03**(0.01)
Direct political -0.01(0.01)
Direct service 0.05(0.17)
Direct regulation -0.04(0.03)
Indirect rule -0.04(0.05)
Direct rule 0.02(0.05)
Constant 0.02 -0.01 -0.01 0.01 0.01 -0.04 -0.01 0.03 0.02(0.07) (0.07) (0.07) (0.08) (0.08) (0.07) (0.06) (0.06) (0.07)
Observations 383 383 383 383 383 383 383 383 383R-squared 0.00 0.00 0.00 0.01 0.00 0.01 0.00 0.00 0.00Year FE YES YES YES YES YES YES YES YES YESArmed Group FE YES YES YES YES YES YES YES YES YES
Notes: This table shows the OLS regressions of the households’ implicit association tests on the indirect rule vectors. All regressions cluster at the villagelevel since there are multiple respondents per village (all other regressions have only one data source per village). Armed group fixed effects are included inall regressions.
55

Table 9: Impact of indirect rule exposure on today’s support towards the chief - survey self-reported love for chief
(1) (2) (3) (4) (5) (6) (7) (8) (9)Chief Chief Chief Chief Chief Chief Chief Chief Chief
VARIABLES loved loved loved loved loved loved loved loved loved
Indirect tax 0.04**(0.02)
Direct tax -0.07**(0.03)
Indirect recruit -0.03(0.02)
Direct recruit 0.01*(0.00)
Indirect legitimation -0.01(0.01)
Direct legitimation 0.02*(0.01)
Indirect admin 0.01*(0.01)
Direct admin -0.01(0.01)
Indirect justice 0.01**(0.00)
Direct justice -0.00(0.00)
Indirect political 0.01**(0.00)
Direct political -0.00(0.00)
Direct service 0.03(0.02)
Direct regulation -0.01(0.01)
Indirect rule -0.02(0.02)
Direct rule 0.01(0.02)
Constant 0.98*** 0.96*** 0.94*** 0.96*** 0.96*** 0.94*** 0.94*** 0.96*** 0.97***(0.02) (0.02) (0.03) (0.03) (0.03) (0.03) (0.03) (0.02) (0.03)
Observations 448 448 448 448 448 448 448 448 448R-squared 0.20 0.08 0.03 0.05 0.02 0.01 0.00 0.01 0.03Year FE YES YES YES YES YES YES YES YES YESArmed Group FE YES YES YES YES YES YES YES YES YES
Notes: This table shows the OLS regressions of the villages’ love for the chief on the indirect rule vectors. All regressions include armed group level fixedeffects.
56