indicators of economic need in the milwaukee metro area
TRANSCRIPT

University of Wisconsin MilwaukeeUWM Digital Commons
ETI Publications Employment and Training Institute
2010
Indicators of Economic Need in the MilwaukeeMetro Area: July 2010 UpdateLois M. QuinnUniversity of Wisconsin - Milwaukee, [email protected]
John PawasaratUniversity of Wisconsin - Milwaukee, [email protected]
Follow this and additional works at: https://dc.uwm.edu/eti_pubsPart of the Public Policy Commons, and the Work, Economy and Organizations Commons
This Technical Paper is brought to you for free and open access by UWM Digital Commons. It has been accepted for inclusion in ETI Publications byan authorized administrator of UWM Digital Commons. For more information, please contact [email protected].
Recommended CitationQuinn, Lois M. and Pawasarat, John, "Indicators of Economic Need in the Milwaukee Metro Area: July 2010 Update" (2010). ETIPublications. 33.https://dc.uwm.edu/eti_pubs/33

The Greater Milwaukee Foundation is a family of over 1,000 individual charitable funds, each created by donors to serve the charitable causes of their choice. Grants from these funds serve people throughout Milwaukee, Waukesha, Ozaukee and Washington counties and beyond. Started in 1915, the Foundation is one of the oldest and largest community foundations in the world. The University of Wisconsin-Milwaukee Employment and Training Institute addresses workforce training, transportation, and education needs of low-income and unemployed workers in Wisconsin through applied research, policy development, and technical assistance.
Indicators of Economic Need in the Milwaukee Metro Area: July 2010 Update
Employment conditions have modestly improved with two months of lower unemployment rates estimated in April and May 2010 for all four counties (Milwaukee, Washington, Waukesha and Ozaukee), 10,550 more residents employed (May compared to March), declines in the laid-off workforce receiving unemployment insurance payments in June, and fewer home foreclosure filings in June. Use of government safety nets continues at a very high level.
- One in 3 children (under age 19) in the metro area is currently without private health insurance and enrolled
in BadgerCare Plus. Most of that enrollment is concentrated in Milwaukee County where 1 out of every 2 children is enrolled in this federal/state health insurance program.
Concentration of Children (under age 19) Enrolled in BadgerCare Plus
Children Enrolled Concentration Milwaukee County 122,743 1 in 2 Washington County 5,938 1 in 6 Waukesha County 11,658 1 in 8 Ozaukee County 2,605 1 in 8 4-county metro area 142,944 1 in 3
- The unemployment rate for the metro area (which had been worsening since October 2009) improved in
April and May of 2010, dropping from 9.8% in March to 8.2% in May. The unemployment rate improved in all four counties, with an estimated 10,551 more residents holding jobs in May than in March.
Improvements in Unemployment Rates and Number of Residents with Jobs
Unemployment by County
March 2010
May 2010
Est. Increase in # of Residents with Jobs
Milwaukee County 10.5% 9.0% +6,098 Washington County 9.9% 7.7% +635 Waukesha County 8.8% 7.1% +2,836 Ozaukee County 8.1% 6.5% +982 4-county metro area 9.8% 8.2% +10,551
- Most of the job growth (86%) has been in the private sector, led by service providing firms (54%) and then goods producing companies (32%), according to the Department of Labor Current Employment Statistics (CES) data. The remaining job growth (14%) was in government jobs (mostly for federal census workers).
- The metro area workforce on layoff and receiving unemployment insurance payments dropped to 66,600 the third week in April, but passed 73,400 again in early May and then went down to 62,500 in late June. The volatility of the UI rolls suggests that job security remains a critical concern for employed workers.
- Meanwhile the metro area showed fewer home foreclosure filings in June than in any previous months in 2010. In the first six months of 2010 foreclosure filings were down in Milwaukee, Ozaukee and Washington counties but up by 17% over last year at this time in Waukesha County.

Indicators of Economic Need in the Milwaukee Metropolitan Area: July 2010 Update 2
The unemployment rate for the metro area improved from 9.8% in March of 2010 to 8.2% in May. All four counties showed improvements in employment in both April and May.
Unemployment Rate for the Milwaukee Metro Area4.
2 4.7
4.8
4.8
4.0 4.3 5.
0
4.9
5.0
4.7
4.7 5.
3 5.7
7.2
8.2
9.0
9.0
9.8
9.5
9.3
8.5
8.2 8.4 8.6
9.6
9.6 9.8
8.5
8.28.
9
3
4
5
6
7
8
9
10
11
12
Dec Jan
Feb
Mar
Apr
May
Jun
Jul
Aug
Sep Oct
Nov
Dec Jan
Feb
Mar
Apr
May
Jun
Jul
Aug
Sep Oct
Nov
Dec Jan
Feb
Mar
Apr
May
2007 2008 2009 2010
Data source: Wisconsin Department of Workforce Development, unadjusted rates. Some rates may be state modifications of original postings.
Indicators of Economic Need in the Milwaukee Metropolitan Area: July 2010 Update 3
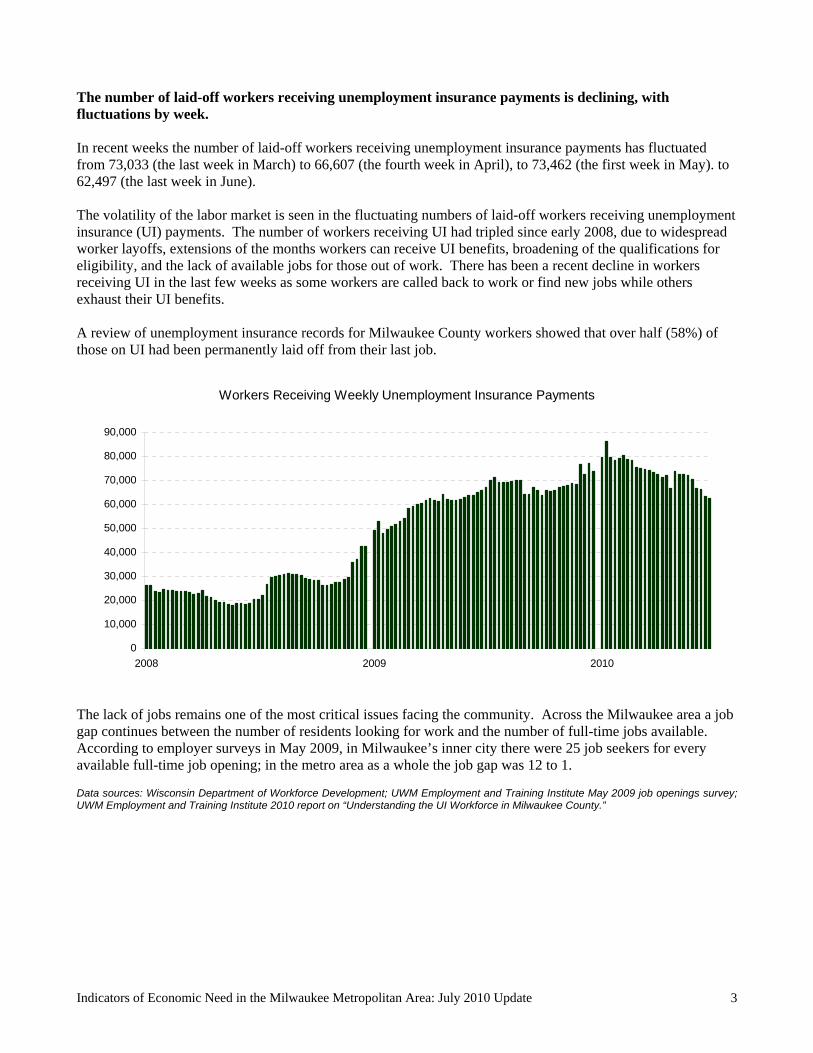
The number of laid-off workers receiving unemployment insurance payments is declining, with fluctuations by week. In recent weeks the number of laid-off workers receiving unemployment insurance payments has fluctuated from 73,033 (the last week in March) to 66,607 (the fourth week in April), to 73,462 (the first week in May). to 62,497 (the last week in June). The volatility of the labor market is seen in the fluctuating numbers of laid-off workers receiving unemployment insurance (UI) payments. The number of workers receiving UI had tripled since early 2008, due to widespread worker layoffs, extensions of the months workers can receive UI benefits, broadening of the qualifications for eligibility, and the lack of available jobs for those out of work. There has been a recent decline in workers receiving UI in the last few weeks as some workers are called back to work or find new jobs while others exhaust their UI benefits. A review of unemployment insurance records for Milwaukee County workers showed that over half (58%) of those on UI had been permanently laid off from their last job.
Workers Receiving Weekly Unemployment Insurance Payments
0
10,000
20,000
30,000
40,000
50,000
60,000
70,000
80,000
90,000
2008 2009 2010
The lack of jobs remains one of the most critical issues facing the community. Across the Milwaukee area a job gap continues between the number of residents looking for work and the number of full-time jobs available. According to employer surveys in May 2009, in Milwaukee’s inner city there were 25 job seekers for every available full-time job opening; in the metro area as a whole the job gap was 12 to 1. Data sources: Wisconsin Department of Workforce Development; UWM Employment and Training Institute May 2009 job openings survey; UWM Employment and Training Institute 2010 report on “Understanding the UI Workforce in Milwaukee County.”

Indicators of Economic Need in the Milwaukee Metropolitan Area: July 2010 Update 4
Fewer mass layoffs were reported in June 2010. Since January 2008 Milwaukee area companies have reported 11,739 mass layoffs and plant closing job notices to the state. The largest numbers of mass job losses were in Oak Creek, Milwaukee, Wauwatosa, Menomonee Falls, West Allis, Waukesha and Port Washington. One firm in Washington County issued a mass lay-off notice affecting 50 workers in June. The unemployment rolls indicate that additional worker layoffs are continuing not involving whole plants or large segments of firms’ workforce at one time. Generally, business establishments (with at least 50 workers) must report anticipated worker reductions under a “mass layoff” (i.e., a reduction of at least 25% of the workforce) or “plant closing” (i.e., a permanent or temporary shutdown of an establishment).
New Mass Layoff and Plant Closing Notices
230
700
210
128
119 34
7
1,35
6
139
428
155
583
457
464
257
555
628
169
770
486
269
732
432
103
77 26
178 38
3
344
362
50
0
500
1,000
1,500
2,000
Jan
Feb
Mar
Apr
May
Jun
Jul
Aug
Sep Oct
Nov
Dec Jan
Feb
Mar
Apr
May
Jun
Jul
Aug
Sep Oct
Nov
Dec Jan
Feb
Mar
Apr
May
Jun
2008 2009 2010
Data source: Wisconsin Department of Workforce Development. Historic data are updated.
The housing crisis is not over. Since January 2008 there have been 22,053 court foreclosure filings. Foreclosure filings in circuit courts in Milwaukee, Waukesha, Washington and Ozaukee counties totaled 8,142 in 2008 and 9,437 in 2009 and showed 4,474 more filings in the first six months (January-June) of 2010. While Ozaukee, Milwaukee and Washington counties saw declines in foreclosures in 2010 through June compared to a year ago (14%, 7% and 4% declines, respectively), Waukesha County recorded a 17% increase (January-June 2010 compared to the first six months of 2009). All four counties had fewer foreclosure filings in June than in earlier months of 2010. Several factors are exacerbating the housing crisis: high numbers of residents out of work, low housing prices, families and landlords with unaffordable mortgages (many subprime), interest rates still increasing on ARMs (adjustable rate mortgages), and the inability of many owners to refinance their loans.
Foreclosure Court Filings
864
720 88
5
952
1,06
0
969 1,
212
1,52
2
1,51
91,
426 1,82
3 2,30
0
2,11
8
1,92
5
1,80
0 2,29
9
2,36
6
2,28
52,
461
2,32
5
2,30
8
2,16
6
0
500
1,000
1,500
2,000
2,500
3,000
3,500
Q1
Q2
Q3
Q4
Q1
Q2
Q3
Q4
Q1
Q2
Q3
Q4
Q1
Q2
Q3
Q4
Q1
Q2
Q3
Q4
Q1
Q2
2005 2006 2007 2008 2009 2010
Data source: Wisconsin Consolidated Court Automation Program (CCAP). Some of these homes do not ultimately result in foreclosure and some properties may have multiple court filings listed.

Indicators of Economic Need in the Milwaukee Metropolitan Area: July 2010 Update 5
One out of 7 residents in metro Milwaukee is using FoodShare benefits to help with their grocery bills. Increasing numbers of residents are requesting FoodShare benefits (formerly food stamps) to help meet their basic food needs, and enrollments are at their highest level in the last quarter century in the four-county metro area. By May 2010, over 233,000 area residents were using the food program. Over the last 2 years over 78,000 more residents sought out FoodShare assistance. In May FoodShare benefits averaged $120 per recipient in Milwaukee County and $103 per recipient in the suburban (Waukesha, Ozaukee and Washington) counties.
FoodShare Recipients
155,
327
155,
913
157,
025
159,
736
161,
680
170,
218
165,
174
167,
713
169,
185
172,
692
175,
840
178,
281
182,
251
186,
760
191,
053
197,
566
203,
512
208,
712
212,
662
216,
068
217,
100
219,
844
222,
174
223,
540
226,
347
228,
680
230,
445
232,
124
233,
407
140,000
160,000
180,000
200,000
220,000
240,000
260,000
280,000
Jan
Feb
Mar
Apr
May
Jun
Jul
Aug
Sep Oct
Nov
Dec Jan
Feb
Mar
Apr
May
Jun
Jul
Aug
Sep Oct
Nov
Dec Jan
Feb
Mar
Apr
May
2008 2009 2010
Data source: Wisconsin Department of Health Services

Indicators of Economic Need in the Milwaukee Metropolitan Area: July 2010 Update 6
BadgerCare Plus enrollments totaled 236,700 residents in May. 1 out of every 3 children (under age 19) in the metro area is enrolled in the program. In May 2010 enrollments of Milwaukee area residents in the BadgerCare Plus health care insurance program included 142,944 children (under age 19); 67,743 parents and caretakers, 5,356 pregnant women; and 20,674 single (i.e., non-caretaker) adults. In the four-county area 1 out of every 3 children has no private health insurance and is enrolled in BadgerCare Plus; in Milwaukee County 1 out of every 2 children is enrolled in BadgerCare Plus. The recent decline in total enrollments is due to a 20% drop in the number of single (i.e., non-caretaker) adults enrolled in the Core Plan since January, due to the temporary statewide cap placed on the Core Plan. Legislation signed by Governor Jim Doyle in late April will open up enrollments for single adults and extend coverage beginning in July.
BadgerCare Plus Enrollees
236,708238,365238,828238,295
235,579
232,849229,289
225,220218,338
216,069210,477
206,852204,959
202,125199,954
196,562195,277
180,687180,596180,819
178,300178,611
176,934177,012176,753
175,332175,543
177,700161,062
MayAprMarFebJan
DecNovOctSepAugJul
JunMayAprMarFebJan
DecNovOctSepAugJul
JunMayAprMarFeb
Jan*
2010
2009
2008
Data source: Wisconsin Department of Health Services. *January 2008 totals are for period before the BC+ program was implemented.
Indicators of Economic Need in the Milwaukee Metropolitan Area: July 2010 Update 7
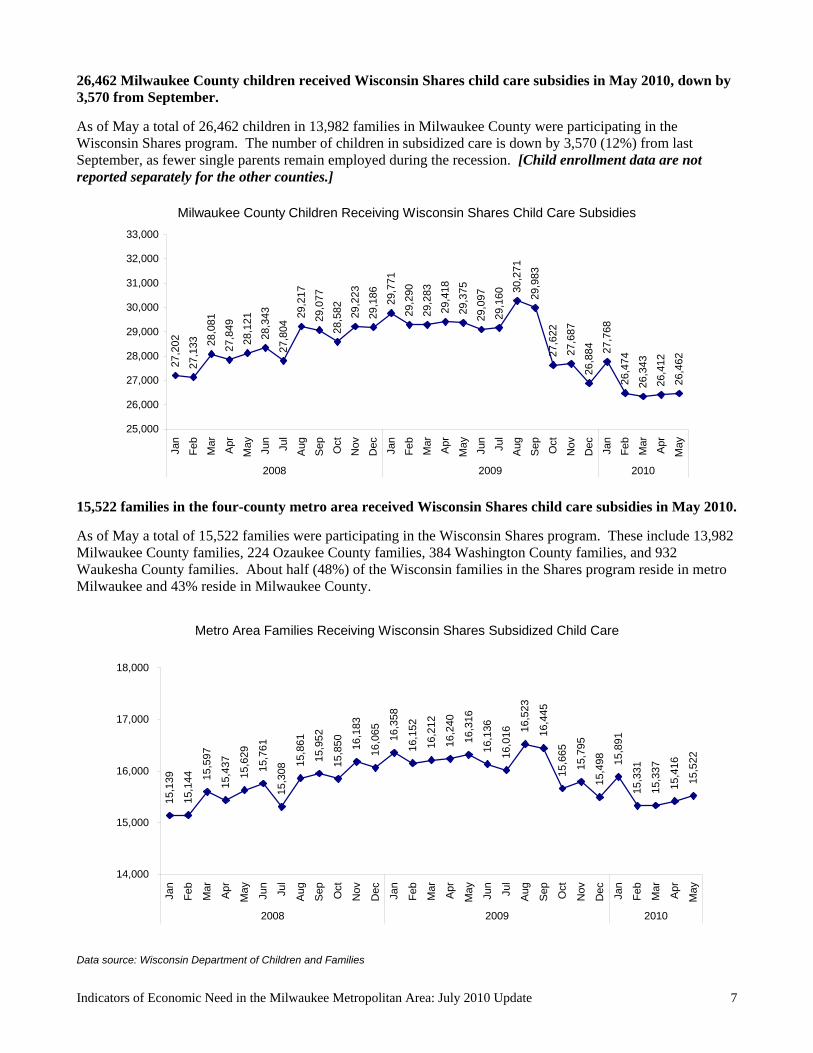
26,462 Milwaukee County children received Wisconsin Shares child care subsidies in May 2010, down by 3,570 from September.
As of May a total of 26,462 children in 13,982 families in Milwaukee County were participating in the Wisconsin Shares program. The number of children in subsidized care is down by 3,570 (12%) from last September, as fewer single parents remain employed during the recession. [Child enrollment data are not reported separately for the other counties.]
Milwaukee County Children Receiving Wisconsin Shares Child Care Subsidies
27,2
02
27,1
33 28,0
81
27,8
49
28,1
21
28,3
43
27,8
04
29,2
17
29,0
77
28,5
82 29,2
23
29,1
86
29,7
71
29,2
90
29,2
83
29,4
18
29,3
75
29,0
97
29,1
60
30,2
71
29,9
83
27,6
22
27,6
87
26,8
84 27,7
68
26,4
74
26,3
43
26,4
12
26,4
62
25,000
26,000
27,000
28,000
29,000
30,000
31,000
32,000
33,000
Jan
Feb
Mar
Apr
May
Jun
Jul
Aug
Sep Oct
Nov
Dec Jan
Feb
Mar
Apr
May
Jun
Jul
Aug
Sep Oct
Nov
Dec Jan
Feb
Mar
Apr
May
2008 2009 2010
15,522 families in the four-county metro area received Wisconsin Shares child care subsidies in May 2010.
As of May a total of 15,522 families were participating in the Wisconsin Shares program. These include 13,982 Milwaukee County families, 224 Ozaukee County families, 384 Washington County families, and 932 Waukesha County families. About half (48%) of the Wisconsin families in the Shares program reside in metro Milwaukee and 43% reside in Milwaukee County.
Metro Area Families Receiving Wisconsin Shares Subsidized Child Care
15,1
39
15,1
44 15,5
97
15,4
37
15,6
29
15,7
61
15,3
08
15,8
61
15,9
52
15,8
50
16,1
83
16,0
65 16,3
58
16,1
52
16,2
12
16,2
40
16,3
16
16,1
36
16,0
16 16
,523
16,4
45
15,6
65
15,7
95
15,4
98 15,8
91
15,3
31
15,3
37
15,4
16
15,5
22
14,000
15,000
16,000
17,000
18,000
Jan
Feb
Mar
Apr
May
Jun
Jul
Aug
Sep Oct
Nov
Dec Jan
Feb
Mar
Apr
May
Jun
Jul
Aug
Sep Oct
Nov
Dec Jan
Feb
Mar
Apr
May
2008 2009 2010
Data source: Wisconsin Department of Children and Families

Indicators of Economic Need in the Milwaukee Metropolitan Area: July 2010 Update 8
W-2 income support cases were up to 8,194 in May, up 67% since January 2008. In May 8,194 Milwaukee area families received “W-2” cash income under the federal TANF program (Temporary Assistance for Needy Families) replacing AFDC. In the last month 626 more families began receiving W-2 cash assistance. W-2 enrollments still remain low compared to the tens of thousands of laid-off workers receiving unemployment insurance. Many unemployed single parents have exhausted their UI benefits or did not qualify for UI checks because they left their jobs voluntarily and then were unable to find other work, had not worked a sufficient number of weeks and hours prior to layoff, or their prior employment was informal and not part of the UI system.
W-2 Payment Cases
4,91
2
4,73
6
4,64
2
4,55
6
4,51
0
4,43
3
4,47
3
4,48
7
4,51
5
4,64
4
4,69
4
4,89
5
4,91
5
4,97
3
5,03
1
5,21
7
5,30
1
5,51
2
5,65
6
5,78
2
5,87
6
6,08
4
6,33
1
6,59
7
6,67
6
6,79
0
7,15
5
7,56
8
8,19
4
0
2,000
4,000
6,000
8,000
10,000
Jan
Feb
Mar
Apr
May
Jun
Jul
Aug
Sep Oct
Nov
Dec Jan
Feb
Mar
Apr
May
Jun
Jul
Aug
Sep
t
Oct
Nov
Dec Jan
Feb
Mar
Apr
May
2008 2009 2010
Data source: Wisconsin Department of Children and Families
Prepared for the Greater Milwaukee Foundation by Lois Quinn, University of Wisconsin-Milwaukee Employment and Training Institute (7/7/2010).
“Vital Signs” are updated monthly at www.greatermilwaukeefoundation.org. For additional research on labor force needs and safety nets, see the Employment and Training Institute website at www.eti.uwm.edu.

The Greater Milwaukee Foundation is a family of over 1,000 individual charitable funds, each created by donors to serve the charitable causes of their choice. Grants from these funds serve people throughout Milwaukee, Waukesha, Ozaukee and Washington counties and beyond. Started in 1915, the Foundation is one of the oldest and largest community foundations in the world. The University of Wisconsin-Milwaukee Employment and Training Institute addresses workforce training, transportation, and education needs of low-income and unemployed workers in Wisconsin through applied research, policy development, and technical assistance.
Indicators of Economic Need in Milwaukee County: July 2010 Update
Economic conditions continued to show modest improvements as the unemployment rate for Milwaukee County residents went down for the second month -- from 10.5% in March, to 9.0% in May. The estimated number of residents with employment increased by 6,098 and the number of city of Milwaukee residents with jobs increased by 3,568. The number of laid-off workers receiving unemployment insurance payments instead of pay checks declined each week in June -- down to 43,702, the week ending June 26th as workers found new employment and others ran out of UI benefits. No new plant closings or mass layoffs were reported by Milwaukee County firms in June. Home foreclosure filings slowed in June 2010. Foreclosure filings in Milwaukee County in the first six months of 2010 were down 7% over last year (January-June). The increasing reliance on government safety nets is seen in the growth of BadgerCare Plus, where 58,000 residents have been added to the program since January 2008. Currently, 1 out of every 2 children/youth (under age 19) in Milwaukee County is without private health insurance and using the BadgerCare Plus health insurance program subsidized by federal and state funds. The unemployment rate for Milwaukee County declined to 9.0% in May 2010, down from above 10% in January-March. An estimated 6,098 more workers were employed in May than in March. The unemployment rate in Milwaukee County improved for the second month. The unemployment rate improved in the city of Milwaukee (down to 10.7% in May, compared to 12.3% in March) and in the suburbs (down to 6.5% in May, compared to 7.7% in March).
Unemployment Rate: Milwaukee County Residents
5.4
5.4
4.6 5.
0
5.7
5.7 5.9
5.5
5.5 6.
1 6.4
7.7
8.8 9.
4
9.3 9.5
10.2
10.0
9.4
9.2
9.2
9.2
10.3
10.2 10
.5
9.3
9.0
5.4
10.3
4
5
6
7
8
9
10
11
12
Jan
Feb
Mar
Apr
May
Jun
Jul
Aug
Sep Oct
Nov
Dec Jan
Feb
Mar
Apr
May
Jun
Jul
Aug
Sep Oct
Nov
Dec Jan
Feb
Mar
Apr
May
2008 2009 2010
Data source: Wisconsin Department of Workforce Development, unadjusted rates. Some rates may show state modifications of original postings.

Indicators of Economic Need in Milwaukee County: July 2010 Update 2
In the city of Milwaukee unemployment was estimated at 10.7% in May 2010, down from rates of over 12% in January-March. The state estimates that 3,568 more city residents had jobs in May than in March.
Unemployment Rates for City of Milwaukee Residents
12.3
10.7
7
8
9
10
11
12
13
Jan
Fe
b
Ma
r
Apr
Ma
y
Jun
Jul
Aug
Sep Oct
No
v
De
c
Jan
Fe
b
Ma
r
Apr
Ma
y
2009 2010
Data source: Wisconsin Department of Workforce Development, rates as posted on 5/31/2010.
43,700 laid-off workers received unemployment insurance payments at the end of June, down from 53,600 in January. The number of workers in Milwaukee County laid off from their jobs and receiving weekly unemployment insurance benefits rather than paychecks dropped from 50,086 in mid-May to 43,702 at the end of June as workers found employment and others exhausted their UI benefits. The lack of jobs is one of the most critical issues facing the community. Across the Milwaukee area a job gap continues between the number of residents looking for work and the number of full-time jobs available. According to employer surveys, in Milwaukee’s inner city there are 25 job seekers for every available full-time job opening; in Milwaukee County as a whole the job gap is 13 to 1.
Laid-Off Workers Receiving Unemployment Insurance Payments
0
10,000
20,000
30,000
40,000
50,000
60,000
2008 2009 2010
Data sources: Wisconsin Department of Workforce Development; UWM Employment and Training Institute May 2009 job openings survey.

Indicators of Economic Need in Milwaukee County: July 2010 Update 3
No plant layoff or mass closing notices were reported in June 2010. A total of 7,935 mass layoff and plant closing notices were reported to the state by firms in Milwaukee County from January 2008 through May 2010. The largest numbers of layoffs have been in Milwaukee, Oak Creek, Wauwatosa, and West Allis. In June 2010 no new notices were issued. Generally, business establishments (with at least 50 workers) must report anticipated worker reductions under a “mass layoff” (i.e., a reduction of at least 25% of its workforce) or “plant closing” (i.e., a permanent or temporary shutdown of an establishment).
New Plant Closings and Mass Layoff Notices
176
645
128
31
164
1,35
3
44
186
85
471
457
380
134
431
417
169
625
486
269 41
3
51 107
383
233
97
0
500
1,000
1,500
2,000
Jan
Feb
Mar
Apr
May
Jun
Jul
Aug
Sep Oct
Nov
Dec Jan
Feb
Mar
Apr
May
Jun
Jul
Aug
Sep Oct
Nov
Dec Jan
Feb
Mar
Apr
May
Jun
2008 2009 2010
Data source: Wisconsin Department of Workforce Development. Historic data is updated.

Indicators of Economic Need in Milwaukee County: July 2010 Update 4
The housing crisis continues. Since January 2008 there have been 16,919 court foreclosure filings. Circuit court foreclosure filings on homes in Milwaukee County totaled 6,465 in 2008, 7,177 in 2009, and 3,277 from January through June of 2010. There has been a modest slowdown (3.8%) in total foreclosure filings in the first six months of 2010 compared to the same period in 2009. Milwaukee County had 74% of the June foreclosure cases in the four-county area, with Waukesha County showing 16% of foreclosure. Several factors are exacerbating the housing crisis: high numbers of residents out of work, low housing prices, families and landlords with unaffordable mortgages (many subprime), interest rates still increasing on ARMs (adjustable rate mortgages), and the inability of many owners to refinance their loans.
Foreclosure Court Filings
648
564 72
6
764
840
731 95
7 1,21
8
1,19
6
1,13
0 1,49
0 1,86
8
1,68
6
1,53
1
1,42
0 1,82
8
1,78
7
1,74
9
1,85
8
1,78
3
1,66
8
1,60
9
0
500
1,000
1,500
2,000
2,500
Q1
Q2
Q3
Q4
Q1
Q2
Q3
Q4
Q1
Q2
Q3
Q4
Q1
Q2
Q3
Q4
Q1
Q2
Q3
Q4
Q1
Q2
2005 2006 2007 2008 2009 2010
Data source: Wisconsin Consolidated Court Automation Program (CCAP). Some of these homes do not ultimately result in foreclosure and some properties may have multiple court filings listed.
The number of Milwaukee County residents using food stamps has passed 208,000. One in five Milwaukee County residents is now using FoodShare benefits (the federal food stamp program) to help meet their basic food needs. In May of 2010, enrollments reached 208,296 – once again their highest level in the last quarter century in Milwaukee County. The average FoodShare benefit is $120 per recipient.
FoodShare Recipients
142,
641
142,
938
143,
637
146,
036
147,
790
155,
965
150,
878
153,
148
154,
579
157,
512
160,
263
162,
310
165,
668
169,
251
172,
671
178,
259
183,
419
188,
014
191,
496
194,
584
195,
351
197,
602
199,
575
200,
694
202,
652
204,
503
205,
798
207,
100
208,
296
125,000
150,000
175,000
200,000
225,000
250,000
Jan
Feb
Mar
Apr
May
Jun
Jul
Aug
Sep Oct
Nov
Dec Jan
Feb
Mar
Apr
May
Jun
Jul
Aug
Sep Oct
Nov
Dec Jan
Feb
Mar
Apr
May
2008 2009 2010
Data source: Wisconsin Department of Health Services

Indicators of Economic Need in Milwaukee County: July 2010 Update 5
One out of every 2 children is enrolled in BadgerCare Plus. In May 2010 a total of 200,770 Milwaukee County residents were enrolled in the BadgerCare Plus health care insurance program. One in 5 Milwaukee County residents and 1 in 2 children (under age 19) does not have private health insurance and now relies on this federal/state health insurance program. Enrollments are down from February and March due to temporary statewide caps on the number of single adults eligible for the program’s Core Plan. Recent legislation signed by the governor at the end of April will open up enrollments for single adults, with coverage beginning in July. The BadgerCare Plus enrollments include 122,743 children, 55,710 adult caretakers, 4,510 pregnant women, and 17,807 single (i.e., non-caretaker) adults. Given the current caps on the Core Plan, the number of single adults on BadgerCare Plus declined by 22% since the beginning of the year while all other categories (children, caretakers and pregnant women) showed increases since January.
BadgerCare Plus Enrollees
200,770202,649203,387203,374
201,351
199,076196,343
193,198187,727
186,019181,487
178,750177,181
175,015173,730
171,215170,415
156,518156,573157,028
155,036155,382
154,248154,512154,347
153,517154,105
156,149142,585
MayAprMarFebJan
DecNovOctSepAugJul
JunMayAprMarFebJan
DecNovOctSepAugJul
JunMayAprMarFebJan*
2010
2009
2008
Data source: Wisconsin Department of Health Services. *January 2008 totals are for period before the BC+ program was implemented.

Indicators of Economic Need in Milwaukee County: July 2010 Update 6
26,462 Milwaukee County children received Wisconsin Shares child care subsidies in May 2010.
As of May a total of 26,462 children in 13,982 families in Milwaukee County were participating in the Wisconsin Shares program. The number of children in subsidized care in down by 3,521 (12%) from last September, as fewer single parents remain employed during the recession.
Milwaukee County Children Receiving Wisconsin Shares Child Care Subsidies
27,2
02
27,1
33 28,0
81
27,8
49
28,1
21
28,3
43
27,8
04
29,2
17
29,0
77
28,5
82 29,2
23
29,1
86 29,7
71
29,2
90
29,2
83
29,4
18
29,3
75
29,0
97
29,1
60
30,2
71
29,9
83
27,6
22
27,6
87
26,8
84 27,7
68
26,4
74
26,3
43
26,4
12
26,4
62
25,000
26,000
27,000
28,000
29,000
30,000
31,000
32,000
33,000
Jan
Feb
Mar
Apr
May
Jun
Jul
Aug
Sep Oct
Nov
Dec Jan
Feb
Mar
Apr
May
Jun
Jul
Aug
Sep Oct
Nov
Dec Jan
Feb
Mar
Apr
May
2008 2009 2010
As of May 2010 13,982 families in the county were receiving child care subsidies, down from a high of 14,958 families receiving child care support in August 2009.
Families Receiving Wisconsin Shares Subsidized Child Care
13,5
43
13,5
37
13,9
85
13,8
16
14,0
15
14,1
18
13,7
17
14,2
30
14,2
73
14,2
30 14,5
37
14,4
78 14,7
27
14,5
71
14,6
70
14,7
22
14,7
35
14,6
05
14,4
81
14,9
58
14,8
81
14,1
62
14,2
75
13,9
94
14,3
74
13,8
56
13,8
36
13,9
01
13,9
82
13,000
14,000
15,000
16,000
Jan
Feb
Mar
Apr
May
Jun
Jul
Aug
Sep Oct
Nov
Dec Jan
Feb
Mar
Apr
May
Jun
Jul
Aug
Sep Oct
Nov
Dec Jan
Feb
Mar
Apr
May
2008 2009 2010
Data source: Wisconsin Department of Children and Families

Indicators of Economic Need in Milwaukee County: July 2010 Update 7
W-2 income support cases are up by 67% since January 2008, but still low compared to the unemployment rolls. In May Milwaukee County 8,036 families received “W-2” cash income under the federal TANF program (Temporary Assistance for Needy Families) replacing AFDC. Still, relatively few families receive monthly income support under W-2 compared to the numbers of laid-off workers receiving weekly unemployment insurance checks (over 44,000). Many unemployed single parents do not qualify for UI checks because they had exhausted their UI benefits or they had left their jobs voluntarily and then were unable to find other work, had not worked a sufficient number of weeks and hours prior to layoff, or their prior employment was informal and not part of the UI system.
Data source: Wisconsin Department of Children and Families
Prepared for the Greater Milwaukee Foundation by Lois Quinn, University of Wisconsin-Milwaukee Employment and Training Institute (7/6/2010).
“Vital Signs” are updated monthly at www.greatermilwaukeefoundation.org. For additional research on labor force needs and safety nets, see the Employment and Training Institute website at www.eti.uwm.edu.
W-2 Payment Cases
4,80
2
4,63
5
4,54
1
4,45
4
4,40
2
4,32
3
4,36
3
4,37
5
4,40
3
4,53
1
4,57
4
4,76
9
4,79
3
4,84
5
4,90
5
5,08
3
5,16
9
5,37
7
5,51
3
5,64
0
5,72
8
5,93
5
6,17
7
6,44
2
6,52
4
6,63
9
7,00
5
7,42
0
8,03
6
0
2,000
4,000
6,000
8,000
10,000
12,000
Jan
Feb
Mar
Apr
May
Jun
Jul
Aug
Sep Oct
Nov
Dec Jan
Feb
Mar
Apr
May
Jun
Jul
Aug
Sep
t
Oct
Nov
Dec Jan
Feb
Mar
Apr
May
2008 2009 2010

The Greater Milwaukee Foundation is a family of over 1,000 individual charitable funds, each created by donors to serve the charitable causes of their choice. Grants from these funds serve people throughout Milwaukee, Waukesha, Ozaukee and Washington counties and beyond. Started in 1915, the Foundation is one of the oldest and largest community foundations in the world. The University of Wisconsin-Milwaukee Employment and Training Institute addresses workforce training, transportation, and education needs of low-income and unemployed workers in Wisconsin through applied research, policy development, and technical assistance.
Indicators of Economic Need in Ozaukee County: July 2010 Update
Economic conditions are better in Ozaukee County than in the other three counties of the metro area. Unemployment, which had climbed up to 8.1% in March, improved to 6.5% in May of 2010 as an estimated 635 more residents were employed. The number of laid-off workers received weekly unemployment insurance (UI) payments rather than paychecks dropped from 3,074 in late March to 2,425 by late June. Meanwhile the housing crisis has slowed -- with foreclosure filings in circuit court down 14% in the first six months of 2010 compared to the same period (January-June) in 2009. Government safety nets are still assisting nearly 5,000 Ozaukee County residents: 3,412 are using the federal FoodShare program to help pay their grocery bills, and 4,875 are relying on the federal/state BadgerCare Plus program for health insurance. Currently, 1 out of 8 children has no private health insurance and is enrolled in BadgerCare Plus. The number of families receiving “W-2” payments (N=18) remains very low. The housing crisis continues. Since January 2008 there have been 622 court foreclosure filings. Circuit court foreclosure filings on homes in Ozaukee County totaled 208 in 2008, 284 in 2009, and 130 from January through June of 2010. The good news – foreclosure filings in Ozaukee County are down by 14% in 2010 compared to the same time period (January-June) of 2009.
Foreclosure Court Filings
26
16 2
4 30
28
26
36
32 34
29 3
54
7
47 5
65
2 53
77
75
72
60 6
86
2
0
20
40
60
80
100
Qtr
1Q
tr2
Qtr
3Q
tr4
Qtr
1Q
tr2
Qtr
3Q
tr4
Qtr
1Q
tr2
Qtr
3Q
tr4
Qtr
1Q
tr2
Qtr
3Q
tr4
Qtr
1Q
tr2
Qtr
3Q
tr4
Qtr
1Q
tr2
2005 2006 2007 2008 2009 2010
Data source: Wisconsin Consolidated Court Automation Program (CCAP). Some of these homes do not ultimately result in foreclosure and some properties may have multiple court filings listed.
Indicators of Economic Need in Ozaukee County: July 2010 Update 2
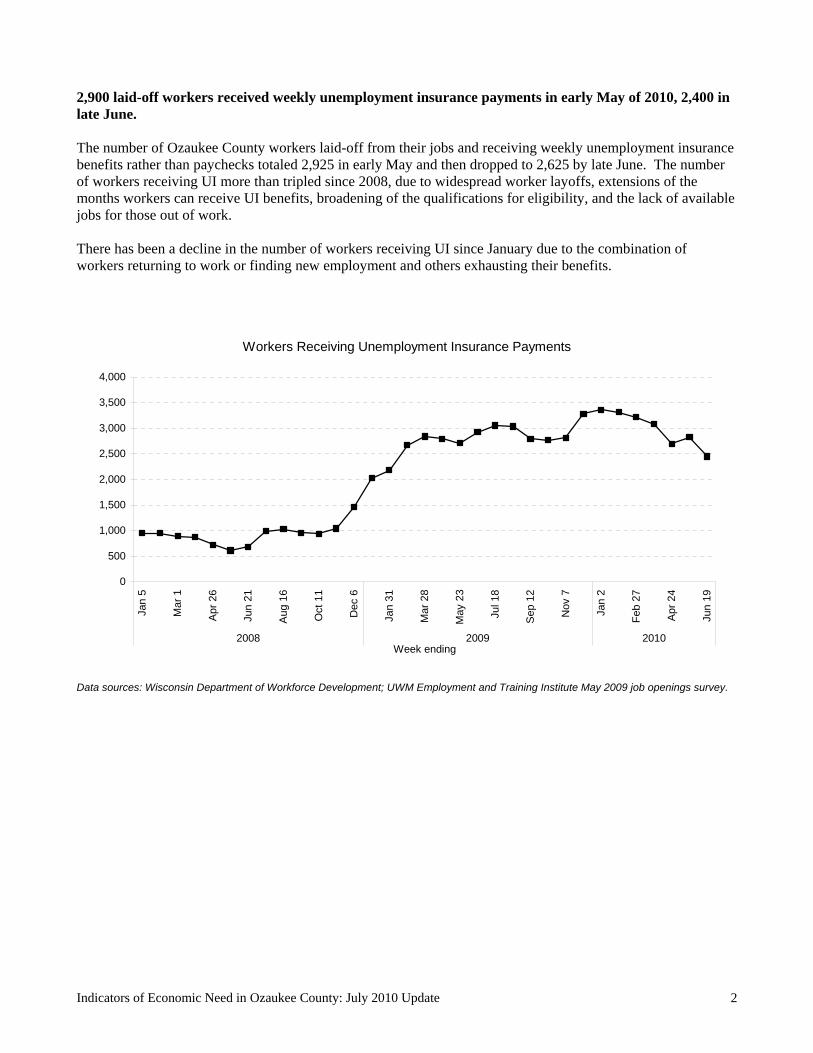
2,900 laid-off workers received weekly unemployment insurance payments in early May of 2010, 2,400 in late June. The number of Ozaukee County workers laid-off from their jobs and receiving weekly unemployment insurance benefits rather than paychecks totaled 2,925 in early May and then dropped to 2,625 by late June. The number of workers receiving UI more than tripled since 2008, due to widespread worker layoffs, extensions of the months workers can receive UI benefits, broadening of the qualifications for eligibility, and the lack of available jobs for those out of work. There has been a decline in the number of workers receiving UI since January due to the combination of workers returning to work or finding new employment and others exhausting their benefits.
Workers Receiving Unemployment Insurance Payments
0
500
1,000
1,500
2,000
2,500
3,000
3,500
4,000
Jan
5
Mar
1
Apr
26
Jun
21
Aug
16
Oct
11
Dec
6
Jan
31
Mar
28
May
23
Jul 1
8
Sep
12
Nov
7
Jan
2
Feb
27
Apr
24
Jun
19
2008 2009 2010Week ending
Data sources: Wisconsin Department of Workforce Development; UWM Employment and Training Institute May 2009 job openings survey.

Indicators of Economic Need in Ozaukee County: July 2010 Update 3
No firms announced plant closings or mass layoffs in June. A total of 750 workers have received mass layoff notices from employers in Ozaukee County since January 2008, with the largest numbers in Port Washington, Cedarburg and Mequon. Generally, business establishments (with at least 50 workers) must report anticipated worker reductions under a “mass layoff” (i.e., a reduction of at least 25% of its workforce) or “plant closing” (i.e., a permanent or temporary shutdown of an establishment).
New Plant Closings and Mass Layoff Notices33
88
158
27
70
15
78
117
64
100
0
50
100
150
200
Jan
Feb
Mar
Apr
May
Jun
Jul
Aug
Sep Oct
Nov
Dec Jan
Feb
Mar
Apr
May
Jun
Jul
Aug
Sep Oct
Nov
Dec Jan
Feb
Mar
Apr
May
Jun
2008 2009 2010
Data source: Wisconsin Department of Workforce Development.
The unemployment rate was estimated at 6.5% in May 2010, down from 8.1% in March. Unemployment remains lower in Ozaukee County than in the other three counties of the metro area. The estimated unemployment rate in May 2010 was 6.5% in Ozaukee County compared to 7.1% in Waukesha County, 7.7% in Washington County, and 9.0% in Milwaukee County.
Unemployment Rate
3.6 3.8 3.8
3.0 3.2
4.0 4.03.7 3.5 3.6
4.34.9
6.1
7.37.9
7.5
8.68.0 8.0
7.46.9 6.7 6.9
8.07.7
8.1
6.7 6.5
3.1
7.7
0
1
2
3
4
5
6
7
8
9
10
Dec Jan
Feb
Mar
Apr
May
Jun
Jul
Aug
Sep Oct
Nov
Dec Jan
Feb
Mar
Apr
May
Jun
Jul
Aug
Sep Oct
Nov
Dec Jan
Feb
Mar
Apr
May
2007 2008 2009 2010
Data source: Wisconsin Department of Workforce Development, unadjusted rates. Some rates may be state modifications of original postings.
Indicators of Economic Need in Ozaukee County: July 2010 Update 4
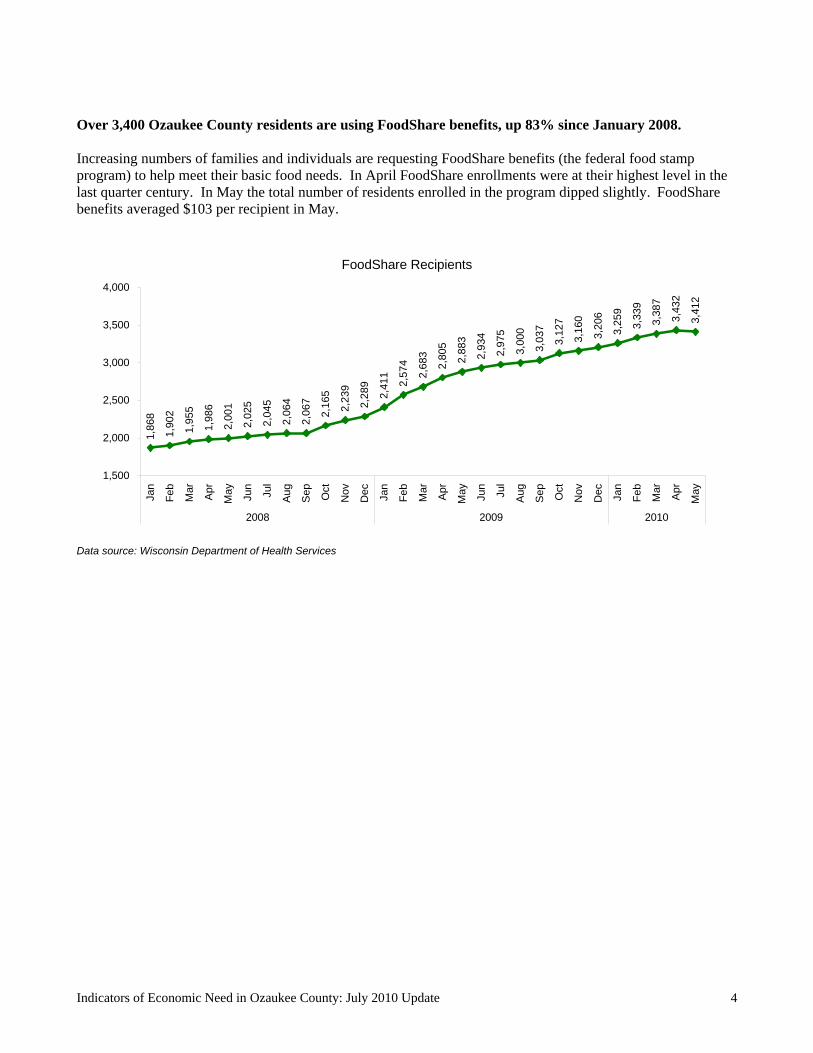
Over 3,400 Ozaukee County residents are using FoodShare benefits, up 83% since January 2008. Increasing numbers of families and individuals are requesting FoodShare benefits (the federal food stamp program) to help meet their basic food needs. In April FoodShare enrollments were at their highest level in the last quarter century. In May the total number of residents enrolled in the program dipped slightly. FoodShare benefits averaged $103 per recipient in May.
FoodShare Recipients
1,86
8
1,90
2
1,95
5
1,98
6
2,00
1
2,02
5
2,04
5
2,06
4
2,06
7
2,1
65
2,2
39
2,2
89 2,41
1
2,57
4
2,68
3
2,80
5
2,88
3
2,93
4
2,97
5
3,00
0
3,03
7
3,12
7
3,16
0
3,20
6
3,25
9
3,33
9
3,38
7
3,43
2
3,41
2
1,500
2,000
2,500
3,000
3,500
4,000
Jan
Feb
Mar
Apr
May
Jun
Jul
Aug
Sep Oct
Nov
Dec Jan
Feb
Mar
Apr
May
Jun
Jul
Aug
Sep Oct
Nov
Dec Jan
Feb
Mar
Apr
May
2008 2009 2010
Data source: Wisconsin Department of Health Services

Indicators of Economic Need in Ozaukee County: July 2010 Update 5
BadgerCare Plus enrollments rose to 4,875 residents in May 2010. 1 out of 8 children in the county have no private health insurance and are now using BadgerCare Plus. The number of lower-income Ozaukee County residents on BadgerCare Plus has nearly doubled since January 2008. In May 2,605 children (under age 19); 1,731 parents and caretakers; 96 pregnant women; and 443 single adults were enrolled in the program. Single adult enrollments were down by 3% since January, given temporary statewide caps on enrollment in this program.
BadgerCare Plus Enrollees
4,8754,840
4,7774,723
4,642
4,6024,454
4,3224,085
4,0433,900
3,7763,767
3,6893,563
3,4713,420
3,2783,262
3,2213,1093,105
3,0463,035
3,0152,958
2,9062,914
2,485
MayAprMarFebJan
DecNovOctSepAugJul
JunMayAprMarFebJan
DecNovOctSepAugJul
JunMayAprMarFeb
Jan*
2010
200
920
08
Data source: Wisconsin Department of Health Services. *January 2008 totals are for period before the BC+ program was implemented.

Indicators of Economic Need in Ozaukee County: July 2010 Update 6
224 Ozaukee County families receiving child care subsidies. In the first five months of 2010 an average of 218 families received child care subsidies under the Wisconsin Shares program, down slightly from the 226 average of families receiving subsidies in 2009.
Families Receiving Wisconsin Shares Subsidized Child Care
238
240 24
2
242
240
238
225
241
238
220
236
226
239
234
229
228
228
225
215
216 22
0 228
226
226
221
211 21
4 218 22
4
175
200
225
250
275
300
Jan
Feb
Mar
Apr
May
Jun
Jul
Aug
Sep Oct
Nov
Dec Jan
Feb
Mar
Apr
May
Jun
Jul
Aug
Sep Oct
Nov
Dec Jan
Feb
Mar
Apr
May
2008 2009 2010
Data source: Wisconsin Department of Children and Families

Indicators of Economic Need in Ozaukee County: July 2010 Update 7
Almost no Ozaukee County families receive W-2 income support. Few families receive monthly income support under W-2 (Wisconsin’s Temporary Assistance for Needy Families program replacing AFDC). Only 18 families were on W-2 cash assistance in May 2010 compared to several thousand laid-off workers receiving weekly unemployment insurance checks.
W-2 Payment Cases
14
107 8
12
1618
21
17 16 17 17
1316
14 13 12 11 11 10
1517
1411 12
1416 16
18
0
5
10
15
20
25
30
Jan
Fe
bM
ar
Apr
Ma
yJu
nJu
lA
ugS
ep Oct
No
vD
ec
Jan
Fe
bM
ar
Apr
Ma
yJu
nJu
lA
ugS
ep
tO
ctN
ov
De
c
Jan
Fe
bM
ar
Apr
Ma
y
2008 2009 2010
Data source: Wisconsin Department of Children and Families
Prepared for the Greater Milwaukee Foundation by Lois Quinn, University of Wisconsin-Milwaukee Employment and Training Institute (7/7/2010).
“Vital Signs” are updated monthly at www.greatermilwaukeefoundation.org. For additional research on labor force needs and safety nets, see the Employment and Training Institute website at www.eti.uwm.edu.

The Greater Milwaukee Foundation is a family of over 1,000 individual charitable funds, each created by donors to serve the charitable causes of their choice. Grants from these funds serve people throughout Milwaukee, Waukesha, Ozaukee and Washington counties and beyond. Started in 1915, the Foundation is one of the oldest and largest community foundations in the world. The University of Wisconsin-Milwaukee Employment and Training Institute addresses workforce training, transportation, and education needs of low-income and unemployed workers in Wisconsin through applied research, policy development, and technical assistance.
Indicators of Economic Need in Washington County: July 2010 Update
Economic conditions continue to challenge Washington County residents, but with some improvements now seen. The unemployment rate, which had been worsening since October, improved from the estimated 9.9% rate in March 2010 to 7.7% in May. An estimated 982 more residents were employed in May than in March. The number of laid-off workers receiving weekly unemployment insurance (UI) payments rather than paychecks dropped from over 6,300 in early March to 4,700 in late June. Meanwhile the housing crisis continues -- with 1,256 housing foreclosure filings in circuit court in the first six months of 2010. Government safety nets are assisting over 10,000 residents: 7,946 residents are now using the federal FoodShare program to help pay their grocery bills, and 10,530 are relying on the federal/state BadgerCare Plus program for medical insurance. (One in 6 children in the county is enrolled in BadgerCare Plus.) The number of families receiving “W-2” payments (N=35) remains very low. The housing crisis is not over. Since January 2008 there have been 1,256 court foreclosure filings. Circuit court home foreclosure filings on homes in Washington County totaled 418 in 2008, 566 in 2009, and 272 from January through June of 2010. The number of foreclosure filings to date this year is down slightly (4%) over filings in the first six months of 2009. Several factors are exacerbating the housing crisis: high numbers of residents out of work, low housing prices, families and landlords with unaffordable mortgages (many subprime), interest rates still increasing on ARMs (adjustable rate mortgages), and the inability of many owners to refinance their loans.
Foreclosure Court Filings
5443 39 44
5874 75 76 79 85 79
107
109
107
8212
0 142
142
131 15
1
133
139
0
50
100
150
200
Qtr
1Q
tr2
Qtr
3Q
tr4
Qtr
1Q
tr2
Qtr
3Q
tr4
Qtr
1Q
tr2
Qtr
3Q
tr4
Qtr
1Q
tr2
Qtr
3Q
tr4
Qtr
1Q
tr2
Qtr
3Q
tr4
Qtr
1Q
tr2
2005 2006 2007 2008 2009 2010
Data source: Wisconsin Consolidated Court Automation Program (CCAP). Some of these homes do not ultimately result in foreclosure and some properties may have multiple court filings listed.
Indicators of Economic Need in Washington County: July 2010 Update 2
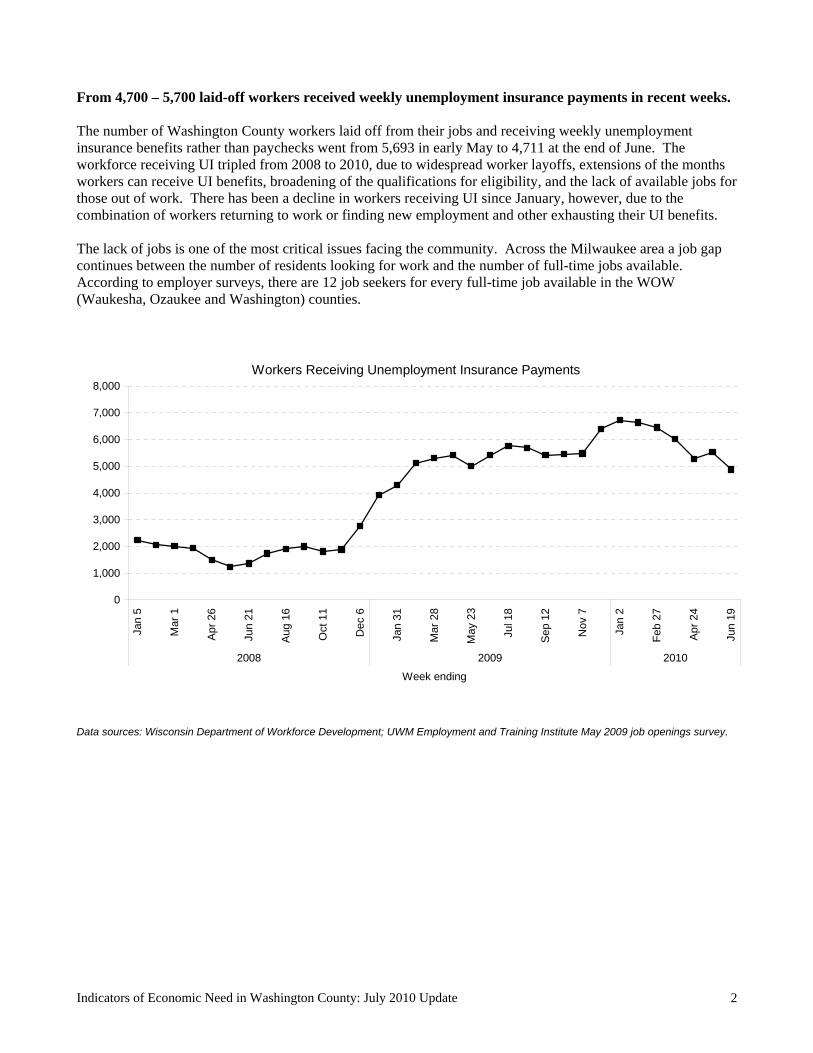
From 4,700 – 5,700 laid-off workers received weekly unemployment insurance payments in recent weeks. The number of Washington County workers laid off from their jobs and receiving weekly unemployment insurance benefits rather than paychecks went from 5,693 in early May to 4,711 at the end of June. The workforce receiving UI tripled from 2008 to 2010, due to widespread worker layoffs, extensions of the months workers can receive UI benefits, broadening of the qualifications for eligibility, and the lack of available jobs for those out of work. There has been a decline in workers receiving UI since January, however, due to the combination of workers returning to work or finding new employment and other exhausting their UI benefits. The lack of jobs is one of the most critical issues facing the community. Across the Milwaukee area a job gap continues between the number of residents looking for work and the number of full-time jobs available. According to employer surveys, there are 12 job seekers for every full-time job available in the WOW (Waukesha, Ozaukee and Washington) counties.
Workers Receiving Unemployment Insurance Payments
0
1,000
2,000
3,000
4,000
5,000
6,000
7,000
8,000
Jan
5
Mar
1
Apr
26
Jun
21
Aug
16
Oct
11
Dec
6
Jan
31
Mar
28
May
23
Jul 1
8
Sep
12
Nov
7
Jan
2
Feb
27
Apr
24
Jun
19
2008 2009 2010
Week ending
Data sources: Wisconsin Department of Workforce Development; UWM Employment and Training Institute May 2009 job openings survey.

Indicators of Economic Need in Washington County: July 2010 Update 3
One Washington County firm issued a mass layoff notice in June. In June one manufacturing firm in Hartford reported an anticipated mass layoff affecting 50 workers. Most area mass plant closings and layoffs have been concentrated in Milwaukee and Waukesha counties, although Washington County plant closings and mass layoffs have been reported in West Bend, Germantown, and Hartford. Since 2008 Washington County companies have had the lowest number of mass layoffs and plant closings in the metro area. The UI rolls indicate that worker layoffs are continuing but not necessarily involving whole plants or large segments of firms’ workforce at one time. Generally, business establishments (with at least 50 workers) must report anticipated worker reductions under a “mass layoff” (i.e., a reduction of at least 25% of its workforce) or “plant closing” (i.e., a permanent or temporary shutdown of an establishment).
New Mass Layoff and Plant Closing Notices
38
81
30
71
50
0
20
40
60
80
100
Jan
Feb
Mar
Apr
May
Jun
Jul
Aug
Sep Oct
Nov
Dec Jan
Feb
Mar
Apr
May
Jun
Jul
Aug
Sep Oct
Nov
Dec Jan
Feb
Mar
Apr
May
Jun
2008 2009 2010
Data source: Wisconsin Department of Workforce Development. Historic data is updated.
The unemployment rate was 7.7% in May 2010, an improvement over the 9.9% rate in March. The unemployment rate in Washington County improved for the second month as an estimated 982 more residents had jobs in May compared to March.
Unemployment Rate
3.7 4.
3 4.6
4.6
3.7
3.7 4.
2
4.1
4.1
3.9
4.0 4.
6 5.4
7.1
8.4
9.5
8.8
9.7
9.3
9.0
8.2
7.9
8.0 8.
4
9.6
9.7 9.9
8.1
7.7
9.0
0
2
4
6
8
10
12
Dec Jan
Feb
Mar
Apr
May
Jun
Jul
Aug
Sep Oct
Nov
Dec Jan
Feb
Mar
Apr
May
Jun
Jul
Aug
Sep Oct
Nov
Dec Jan
Feb
Mar
Apr
May
2007 2008 2009 2010
Data source: Wisconsin Department of Workforce Development, unadjusted rates. Some rates may be state modifications of original postings.

Indicators of Economic Need in Washington County: July 2010 Update 4
Almost 8,000 Washington County residents are using FoodShare benefits, nearly double the number enrolled in January 2008. Increasing numbers of Washington County residents have requested FoodShare benefits (the food stamp program) to help meet their basic food needs. Enrollments in April were at their highest level in the last quarter century. The number dipped slightly in May. FoodShare benefits averaged $101 per recipient in May.
FoodShare Recipients
4,11
1
4,20
5
4,38
8
4,45
2
4,48
8
4,55
5
4,55
5
4,60
5
4,63
4
4,79
9
4,91
7
5,03
3
5,30
6
5,66
0
5,94
1
6,29
7
6,46
3
6,74
1
6,99
6
7,06
9
7,07
6
7,12
4
7,20
6
7,25
0
7,60
7
7,73
0
7,93
4
8,00
2
7,94
6
3,000
4,000
5,000
6,000
7,000
8,000
9,000
Jan
Feb
Mar
Apr
May
Jun
Jul
Aug
Sep Oct
Nov
Dec Jan
Feb
Mar
Apr
May
Jun
Jul
Aug
Sep Oct
Nov
Dec Jan
Feb
Mar
Apr
May
2008 2009 2010
Data source: Wisconsin Department of Health Services

Indicators of Economic Need in Washington County: July 2010 Update 5
BadgerCare Plus enrollments have climbed to 10,530 residents. 1 in 6 children in the county has no private health insurance and is using BadgerCare Plus. Over 4,800 lower-income residents have been added to the BadgerCare Plus health care insurance program since January 2008. In May the BadgerCare Plus enrollments included 5,938 children (under age 19), 3,608 parents and caretakers, 242 pregnant women, and 742 single (i.e., non-caretaker) adults. Enrollments of single adults in the Core Plan are down by 3% since January given temporary statewide caps on single adult enrollments. One out of every 6 children in Washington County is now enrolled in BadgerCare Plus.
BadgerCare Plus Enrollees
10,53010,442
10,33910,199
10,066
9,8889,719
9,4999,125
8,9708,696
8,4088,243
8,0437,843
7,5737,364
7,1677,1657,134
6,9987,004
6,9176,8526,841
6,7036,5716,625
5,671
MayAprMarFebJan
DecNovOctSepAugJul
JunMayAprMarFebJan
DecNovOctSepAugJul
JunMayAprMarFeb
Jan*
2010
2009
2008
Data source: Wisconsin Department of Health Services. *January 2008 totals are for period before the BC+ program was implemented.

Indicators of Economic Need in Washington County: July 2010 Update 6
384 Washington County families receive child care subsidies. In May 2010 384 families in Washington County received child care subsidies under the Wisconsin Shares program, down from a high of 453 families receiving support for child care in Fall of 2008.
Families Receiving Wisconsin Shares Subsidized Child Care
422
420
451
433
436
437
418
418
446
436
453
443
447
437
429
418 42
6
422
422
418 43
0
399
388
385 39
0
382 38
7 392
384
350
400
450
500
Jan
Feb
Mar
Apr
May
Jun
Jul
Aug
Sep Oct
Nov
Dec Jan
Feb
Mar
Apr
May
Jun
Jul
Aug
Sep Oct
Nov
Dec Jan
Feb
Mar
Apr
May
2008 2009 2010
Data source: Wisconsin Department of Children and Families

Indicators of Economic Need in Washington County: July 2010 Update 7
Only 35 Washington County families received W-2 income support in May 2010. Relatively few families receive monthly income support under “W-2” (Wisconsin’s Temporary Assistance for Needy Families program replacing AFDC). Only 35 families were on W-2 cash assistance in May 2010 compared to over 4,800 workers on lay-off and receiving weekly unemployment insurance checks. Many unemployed single parents do not qualify for UI checks because they have exhausted their UI benefits or they had left their jobs voluntarily and then were unable to find other work, had not worked a sufficient number of weeks and hours prior to layoff, or their prior employment was informal and not part of the UI system.
W-2 Payment Cases
20 2225 27 28 25
31 33 33 33 32 34 3330
34 35 35 3337 36
39 41 43 45 44 43 4136 35
0
10
20
30
40
50
60
Jan
Feb
Mar
Apr
May Jun
Jul
Aug Sep Oct
Nov
Dec Jan
Feb
Mar
Apr
May Jun
Jul
Aug
Sep
t
Oct
Nov
Dec Jan
Feb
Mar
Apr
May
2008 2009 2010
Data source: Wisconsin Department of Children and Families
Prepared for the Greater Milwaukee Foundation by Lois Quinn, University of Wisconsin-Milwaukee Employment and Training Institute (7/7/2010).
“Vital Signs” are updated monthly at www.greatermilwaukeefoundation.org. For additional research on labor force needs and safety nets, see the Employment and Training Institute website at www.eti.uwm.edu.

The Greater Milwaukee Foundation is a family of over 1,000 individual charitable funds, each created by donors to serve the charitable causes of their choice. Grants from these funds serve people throughout Milwaukee, Waukesha, Ozaukee and Washington counties and beyond. Started in 1915, the Foundation is one of the oldest and largest community foundations in the world. The University of Wisconsin-Milwaukee Employment and Training Institute addresses workforce training, transportation, and education needs of low-income and unemployed workers in Wisconsin through applied research, policy development, and technical assistance.
Indicators of Economic Need in Waukesha County: July 2010 Update
Economic conditions continue to challenge Waukesha County residents. Home foreclosure filings in circuit court are up 17% (January-June 2010) compared to the first six months of 2009. By May 2010, over 20,500 residents lacking private health insurance had enrolled in BadgerCare Plus, and 13,750 residents were using the FoodShare program to help meet their grocery costs. At the same time the number of families receiving “W-2” payments remains very low. One positive note: An estimated 2,836 more county residents had jobs in May compared to March 2010. The unemployment rate, which was estimated at 8.8% in March (the highest level in the last 20 years), improved to 7.1% in May. No new plant closings or mass layoffs were announced in the county in June. The unemployment rate for Waukesha County was 7.1% in May 2010, the second month of improvements in unemployment since October 2009.
Unemployment Rate
4.1
4.0
3.3
3.5 4.
1
3.9
3.9
3.7
3.7 4.
3 4.8
6.2 7.
1 7.9
7.6
7.7 8.0
8.0
7.4
7.1
7.1 7.5 8.
5 8.7
8.8
7.4
7.1
3.9
8.3
0
2
4
6
8
10
12
Jan
Feb
Mar
Apr
May
Jun
Jul
Aug
Sep Oct
Nov
Dec Jan
Feb
Mar
Apr
May
Jun
Jul
Aug
Sep Oct
Nov
Dec Jan
Feb
Mar
Apr
May
2008 2009 2010
Data source: Wisconsin Department of Workforce Development, unadjusted rates. Some rates may be state modifications of the original postings.
The estimated unemployment rate for city of Waukesha residents improved from 11.4% in March to 9.3% in May.

Indicators of Economic Need in Waukesha County: July 2010 Update 2
11,600 laid-off workers received weekly unemployment insurance payments at the end of June. The number of Waukesha County workers laid off from their jobs and receiving weekly unemployment insurance benefits rather than paychecks has fluctuated from 14,392 at the beginning of April to 11,659 the last week in June. The number of workers receiving UI had tripled since January of 2008, due to widespread worker layoffs, extensions of the months workers can receive UI benefits, broadening of the qualifications for eligibility, and the lack of available jobs for those out of work. There has been a recent decline in workers receiving UI due to the combination of some workers returning to work or finding new employment and others exhausting their UI benefits. The lack of jobs is one of the most critical issues facing the community. Across the Milwaukee area a job gap continues between the number of residents looking for work and the number of full-time jobs available. According to employer surveys, there are 12 job seekers for every full-time job available in the WOW (Waukesha, Ozaukee and Washington) counties.
Workers Receiving Unemployment Insurance Payments
0
2,000
4,000
6,000
8,000
10,000
12,000
14,000
16,000
18,000
20,000
2008 2009 2010
Data sources: Wisconsin Department of Workforce Development; UWM Employment and Training Institute May 2009 job openings survey.

Indicators of Economic Need in Waukesha County: July 2010 Update 3
No new mass layoffs or plant closings were announced in June. Since January 2008 companies in Waukesha County have reported anticipated plant closings and mass layoffs to the state affecting 2,182 workers. Mass job losses have been reported in Menomonee Falls, Waukesha, Brookfield, Pewaukee, New Berlin, Muskego and Hartland. Generally, business establishments (with at least 50 workers) must report anticipated worker reductions under a “mass layoff” (i.e., a reduction of at least 25% of the workforce) or a “plant closing” (i.e., a permanent or temporary shutdown of an establishment).
New Mass Layoff and Plant Closing Notices
5417
177
25 368
242
11269 45
12494
319
432
7326 26
111165
0
100
200
300
400
500
600
Jan
Feb
Mar
Apr
May
Jun
Jul
Aug
Sep Oct
Nov
Dec Jan
Feb
Mar
Apr
May
Jun
Jul
Aug
Sep Oct
Nov
Dec Jan
Feb
Mar
Apr
May
Jun
2008 2009 2010
Data source: Wisconsin Department of Workforce Development. Historic data is updated.
The housing crisis is worsening in Waukesha County with court foreclosure filings up 17% over last year at this time. Since January 2008 there have been 3,256 court foreclosure filings. Circuit court foreclosure filings on homes in Waukesha County totaled 1,051 in 2008; 1,410 in 2009; and 795 from January through June of 2010. There were 116 more foreclosure filings this year to date than in January-June of 2009. By contrast, Ozaukee, Milwaukee and Washington counties are showing fewer foreclosures than in 2009 (year to date). Several factors are exacerbating the housing crisis: high numbers of residents out of work, low housing prices, families and landlords with unaffordable mortgages (many subprime), interest rates still increasing on ARMs (adjustable rate mortgages), and the inability of many owners to refinance their loans.
Foreclosure Court Filings
136
97 96 114
134
138
144 19
6
210
182 21
9
238 27
6
231
246 29
8
360
319
400
331
439
356
0
100
200
300
400
500
Qtr
1
Qtr
2
Qtr
3
Qtr
4
Qtr
1
Qtr
2
Qtr
3
Qtr
4
Qtr
1
Qtr
2
Qtr
3
Qtr
4
Qtr
1
Qtr
2
Qtr
3
Qtr
4
Qtr
1
Qtr
2
Qtr
3
Qtr
4
Qtr
1
Qtr
2
D 2006 2007 2008 2009 2010
Data source: Wisconsin Consolidated Court Automation Program (CCAP). Some of these homes do not ultimately result in foreclosure and some properties may have multiple court filings listed.

Indicators of Economic Need in Waukesha County: July 2010 Update 4
13,753 Waukesha County residents are using FoodShare benefits, double the number in January 2008. Increasing numbers of Waukesha County residents are requesting FoodShare benefits (formerly food stamps) to help meet their basic food needs. The number of residents receiving food stamp benefits has increased every month in the past 2 years. Enrollments are at their highest level in the last quarter century in Waukesha County. FoodShare benefits averaged $104 per recipient in Waukesha County in May.
FoodShare Recipients
6,70
7
6,86
8
7,04
5
7,26
2
7,40
1
7,67
3
7,69
6
7,89
6
7,90
5
8,21
6
8,42
1
8,64
9
8,86
6
9,27
5
9,75
8
10,2
05
10,7
47
11,0
23
11,1
95
11,4
15
11,6
36
11,9
91
12,2
13
12,3
90
12,8
29
13,1
08
13,3
26
13,5
90
13,7
53
4,000
6,000
8,000
10,000
12,000
14,000
16,000
Jan
Feb
Mar
Apr
May
Jun
Jul
Aug
Sep Oct
Nov
Dec Jan
Feb
Mar
Apr
May
Jun
Jul
Aug
Sep Oct
Nov
Dec Jan
Feb
Mar
Apr
May
2008 2009 2010
Data source: Wisconsin Department of Health Services

Indicators of Economic Need in Waukesha County: July 2010 Update 5
BadgerCare Plus enrollments rose to 20,533 residents in May. 1 in 8 children in the county is enrolled in the program. In May BadgerCare Plus enrollments included 11,658 children, 6,685 parents and caretakers, 508 pregnant women, and 1,682 single (i.e., non-caretaker) adults in the Core Plan. Since January 2008, 10,200 more Waukesha County residents have been added to the BadgerCare Plus health care insurance program. Enrollments of single adults in the Core Plan dropped by 2% since January given temporary statewide caps on enrollment in the Core Plan. One out of every 8 children (under age 19) in Waukesha County has no private health insurance and is now enrolled in BadgerCare Plus.
BadgerCare Plus Enrollees
20,53320,434
20,32519,999
19,520
19,28318,773
18,20117,401
17,02716,394
15,91815,768
15,37814,818
14,30314,078
13,72413,596
13,43613,15713,120
12,72312,61312,550
12,15411,96112,012
10,321
MayAprMarFebJan
DecNovOctSepAugJul
JunMayAprMarFebJan
DecNovOctSepAugJul
JunMayAprMarFeb
Jan*
2010
2009
200
8
Data source: Wisconsin Department of Health Services. *January 2008 totals are for period before the BC+ program was implemented.

Indicators of Economic Need in Waukesha County: July 2010 Update 6
932 Waukesha County families receive child care subsidies. In May 2010 932 families in Washington County received child care subsidies under the Wisconsin Shares program, the highest level in the last year.
Families Receiving Wisconsin Shares Subsidized Child Care
936
947
919 94
6
938 96
8
948 97
2 995
964
957
918 94
5
910
884
872
927
884 89
8 931
914
876 90
6
893 90
6
882 90
0
905 93
2
800
900
1,000
1,100
Jan
Feb
Ma
r
Apr
May
Jun
Jul
Aug
Sep Oct
Nov
Dec Jan
Feb
Ma
r
Apr
May
Jun
Jul
Aug
Sep Oct
Nov
Dec Jan
Feb
Ma
r
Apr
May
2008 2009 2010
Data source: Wisconsin Department of Children and Families

Indicators of Economic Need in Waukesha County: July 2010 Update 7
Very few Waukesha County families receive W-2 income support. Relatively few families receive monthly income support under W-2 (Wisconsin’s Temporary Assistance for Needy Families program replacing AFDC). Only 105 families were on W-2 cash assistance in May 2010 compared to over ten thousand laid-off workers receiving weekly unemployment insurance checks. Many unemployed single parents do not qualify for UI checks because they have exhausted their UI benefits or they had left their jobs voluntarily and then were unable to find other work, had not worked a sufficient number of weeks and hours prior to layoff, or their prior employment was informal and not part of the UI system.
W-2 Payment Cases
7669 69 67 68 69
61 58 62 6471 75 76
82 7886 85
91 95 96 94 9197 99 96 94 93 96
105
0
25
50
75
100
125
150
Jan
Feb
Mar
Apr
May
Jun
Jul
Aug
Sep Oct
Nov
Dec Jan
Feb
Mar
Apr
May
Jun
Jul
Aug
Sep
t
Oct
Nov
Dec Jan
Feb
Mar
Apr
May
2008 2009 2010
Data source: Wisconsin Department of Children and Families Prepared for the Greater Milwaukee Foundation by Lois Quinn, University of Wisconsin-Milwaukee Employment and Training Institute (7/7/2010).
“Vital Signs” are updated monthly at www.greatermilwaukeefoundation.org. For additional research on labor force needs and safety nets, see the Employment and Training Institute website at www.eti.uwm.edu.