indicators of disaster risk – information needs washington dc, august 18, 2005 kari keipi, idb
TRANSCRIPT
Indicators of Disaster Risk – Information Needs
Washington DC, August 18, 2005
Kari Keipi, IDBwww.iadb.org/sds/env

Risk Profile for Latin America and the Caribbean
During the past 30 years disasters have annually caused US3.2 billion in physical losses – half or more of the total annual loan commitment of the IDB in recent years.

Why the IDB has invested resources in developing DRM indicators:
To whom and for what?
The Bank is challenged to keep up with disaster losses experienced by its Borrowing Members.
The indicators developed is a necessary tool to generate knowledge and awareness of the importance of this risk both within the IDB and with borrowing governments and thus integrate DRM into the IDB’s Country Programming and portfolio management.

The “Americas Program” Indicators have on a pilot basis been developed for 12 countries.
Argentina, Chile, Colombia, Costa Rica, Dominican Republic, Ecuador, El Salvador, Guatemala, Jamaica, Mexico, Peru, and Trinidad and Tobago.
Unlike most existing risk indices, the new indicators can be easily interpreted by a wide range of decision-makers in different fields, rather than only by experts.
Based on composite indicators, the system consists of four major measures. The Disaster Deficit Index The Local Disaster Index The Prevalent Vulnerability Index Risk Management Index (Institutional)

The Disaster Deficit Index
Formula: Macroeconomic loss / supply of funding.
Supply sources: Insurance Disaster reserve funds Aid and donations New taxes Budgetary reallocations External credit Internal credit
*****************Lesson learned: the person seeking for these data must
have training as an economist
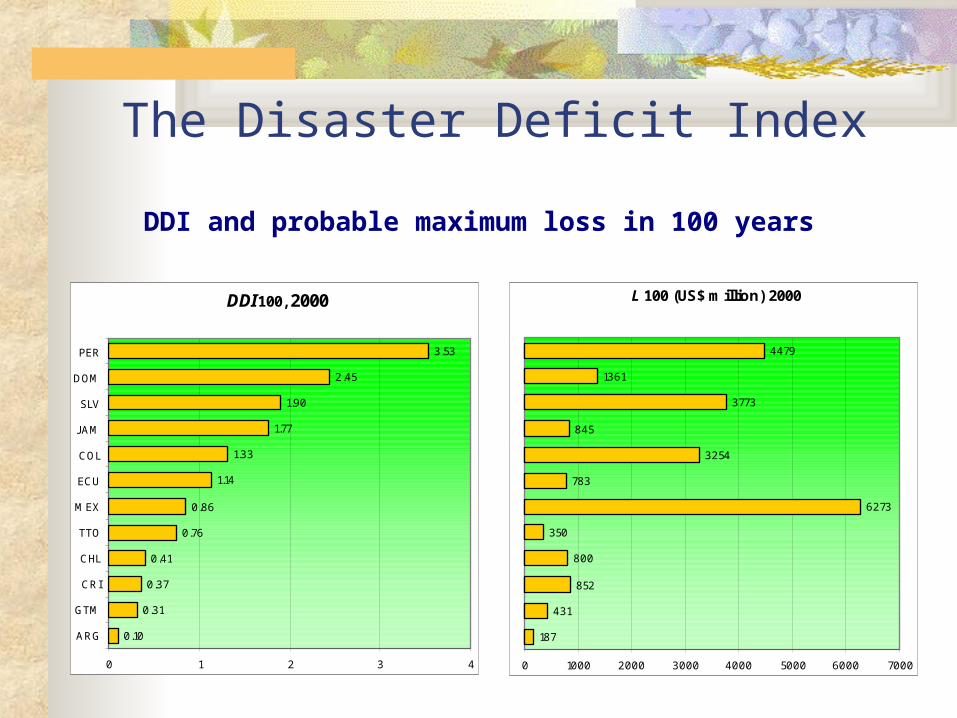
The Disaster Deficit Index
DDI and probable maximum loss in 100 years
DDI100, 2000
0.10
0.31
0.37
0.41
0.76
0.86
1.14
1.33
1.77
1.90
2.45
3.53
0 1 2 3 4
ARG
GTM
CRI
CHL
TTO
MEX
ECU
COL
J AM
SLV
DOM
PER
L 100 (US$ million) 2000
187
431
852
800
350
6273
783
3254
845
3773
1361
4479
0 1000 2000 3000 4000 5000 6000 7000

Local Disaster Index The Local Disaster Index evaluates risks from the accumulated
damage caused by recurrent, small-scale disasters. The index takes into account three variables:
Deaths, Number of affected people, and Economic loss in housing and crops
***********************************Lessons learned: 1. Deaths and no. of damaged houses are the easiest to identify2. Official or published information has not necessarily been more
reliable than “informally” obtained data 3. EMDAT and DesInventar complement each other4. DesInventar has been a very useful source for municipal data for
Local Disaster Index

Local Disaster Index
LDI 1996-2000
19
46
65
58
82
90
33
43
67
74
25
24
12
2
44
35
13
42
78
61
84
20
11
4
15
59
20
41
75
39
50
41
32
0 50 100 150 200 250
TTO
J AM
PER
CRI
MEX
CHL
ECU
COL
SLV
DOM
ARG
GTM
IDL.K
IDL.AIDL.L

Prevalent Vulnerability Index PVI is an average of three types of composite indicators
Exposure and susceptibility (susceptible population, assets, investment, production, livelihoods, essential patrimony, and human activities)
Socio-economic fragility (poverty, human insecurity, dependency, illiteracy, social disparities, unemployment, inflation, debt and environmental deterioration).
Lack of resilience (inverted treatment of: human development levels, human capital, economic redistribution, governance, financial protection, collective perceptions, preparedness to face crisis situations, and environmental protection).
***********************Lessons learned:Continuous time series data on poverty and social disparities have been
the most difficult to obtain

Methodology Issues To whom and for what do we
develop/provide data and indicators? How do we define sub-indeces and weights? How is reliability or validity tested? Will the procedures be inductive or
deductive? Use of subjective data when objective
information is not available? Should all the data be quantitative?
Data Issues Which methods are available to
procure data when this is not officially published?
What methods are to be employed to ensure that data is comparable (between countries)?
What measures should be taken when data is missing?
How do we generate confidence in the estimates produced?
The extent to which the indicator represents reality and are relevant to development policy
Which are the exposed elements? (Stocks and flows, indirect impacts)
Distribution of losses? (public-private, poor-rich)
Relevance of maximum probable event vs. smaller often recurring event (the 500 year event vs. the 3 year event)?