indicator kriging porosity maps of upper miocene ... · pdf filepresed by equation 1. it means...
TRANSCRIPT

37
Tomislav Malvić1, Karolina Novak2,*, Kristina Novak Zelenika1
1INA-Industry of Oil Plc., Šubićeva 29, Zagreb, Croatia 2INA-Industry of Oil Plc., Av. V. Holjevca 10, Zagreb, Croatia 3Faculty of Mining, Geology and Petroleum Engineering, Pierottijeva 6, Zagreb, Croatia *Corresponding author. E-mail: [email protected]
Received: November 26, 2014
Accepted: February 2, 2015
Original scientific paper
AbstractThere are geologically and geostatistically analysed two, presently, the most interesting Upper Miocene sandstone Croatian hydrocarbon reservoirs in the Sava Depression regarding injection of carbon-dioxide. The intention is increasing oil recovery and, simultaneous-ly, keeps part of injected CO2 permanently in depleted reservoirs. Lithologically, both reservoirs are domi-nantly fine to medium-grained sandstones, with very restricted pelitic content, where silt, clay and marl fractions are increased only in laterally marginal parts. Lithostratigraphically (informally) those two reser-voirs are named as “Gamma 3” (older, here analysed as reservoir “A”) and “Gamma 4” (younger, here as res-ervoir “B”), both belonging to the Iva Member, i.e. the Ivanić Grad Formation. Indicator Kriging had been used to map probabilities to obtain different porosities that indicated on different lithofacies.
Key words: sandstones, Indicator Kriging, porosity, Upper Miocene, Sava Depression, Croatia
IzvlečekV dveh na Hrvaškem sedaj najobetavnejših zgornje-miocenskih rezervoarjih ogljikovodikov so geološko in geostatistično preiskali možnost vtiskanja ogljikovega dioksida. Cilj je bil povečati izkoristek črpanja nafte, hkrati pa v izpraznjenih rezervoarjih trajno uskladišči-ti del vtisnjenega CO2.. Litološko sta oba rezervoarja v pretežno drobno do srednjezrnatih peščenjakih z zelo podrejenim pelitskim deležem, pri čemer so meljaste, glinene in laporne frakcije znatneje zastopane le bočno v obrobnih delih. Na osnovi litostratigrafije so rezer-voarja neformalno poimenovali “Gama 3” (starejši, označen kot rezervoar “A”) in “Gama 4” (mlajši, označe-ni kot rezervoar “B”). Oba pripadata členu Iva, tj. Ivanićgradski formaciji. Za kartiranje verjetnosti nas-topanja različnih poroznosti, ki indicirajo različne lito-faciese, so uporabili metodo indikatorskega krigiranja.
Ključne besede: peščenjaki, indikatorsko krigiranje, poroznost, zgornji miocen, Posavska kadunja, Hrvaška
Indicator Kriging porosity maps of Upper Miocene sandstones, Sava Depression, Northern CroatiaIndikatorsko krigiranje poroznosti zgornjemiocenskih peščenjakov v Posavski kadunji v severni Hrvaški
Malvić, T., Novak, K., Novak Zelenika, K.
38
RMZ – M&G | 2015 | Vol. 62 | pp. 37–45
Introduction
In Croatia, the projects for CO2 transport and storage can be successfully applied in order to (a) increase oil recovery from “mature” sand-stone reservoirs and on a commercial basis, (b) permanent store CO2 with the purpose of greenhouse gas (abbr. GHG) emission reduc-tion. The CO2 generated from combustion of fossil fuels or produced during production of oil or natural gas is injected into hydrocarbon reservoirs with the aim of increasing oil recov-ery for more then 30 years, where recovery could be averagely increased for 10–14 %[1, 2]. Currently several dozen of the Enhanced Oil Recovery (abbr. EOR) projects are operating worldwide[3–5].The CO2 trapping in the subsurface depends on reservoir pressure, temperature and properties of cap rock. Reservoirs suitable for application of the EOR methods could be described by the following characteristics[6–8]: (a) oil viscosity < 12 mPa s, (b) oil density 825–865 kg/m3, (c) residual oil saturation, Sor > 25 %, (d) ini-tial reservoir pressure > 100 bar. In addition CO2 mineral trapping can increase volume of trapped gas for few percentages[9]. Generally, sediments deeper than 800 m provide natural reservoir pressure sufficient to keep the CO2 in supercritical state. The quality of cap rocks is very important factor for fluid storage into sub-surface reservoirs[10].Assessment of applicability of CO2 injection into Croatian oil fields was conducted in the ‘70s and ‘80s of the last century, mostly through a pilot project on limited part of the Ivanić Field[11–13]. Its results led to a decision on imple-mentation of the EOR project, but also initiated further geological modelling of sandstone res-ervoirs possibly and partially saturated with CO2. In the case of the Ivanić Field considered are medium to fine-grained sandstone reser-voirs, more than 10 m thick, and still in produc-tion as oil reservoirs (but largely exhausted). The age is Upper Pannonian. There is planned to inject 400 000 m3/d of CO2 collected onto gas-processing plant Molve. The results could be twofold: (a) enhanced oil recovery and (b) reducing of CO2 emission[14, 15]. A model of injected gas behaviour is based on an analysis of several geological variables,
including fluid properties and chemical reac-tions. However, it is important to understand distribution of porosity and permeability, as probably two important variables, within the reservoir. Geostatistical methods for reservoir mapping could be divided into deterministical and stochastical ones. Deterministical provide “the most probable” solution from available data, sometimes described like in Kriging based simulation as the median or “zero-realisation” when it is later applied in simulation. The most probable means that there are also other possi-bilities in representation of surface, which are “located” in uncertainty range typical for input dataset. It resulted in set of equiprobable reali-sations where selection of representative ones is based on several techniques, but no one of them favour any realisation as more probable. This study shows applications of Indicator Kriging (abbr. IK) probability maps, as deter-ministical method, in estimation of porosity and permeability. Such data are derived from Upper Miocene sandstone reservoirs into the Ivanić Field, planned for injection of CO2. Pre-sented models are the first of such estimation made for those sandstones and consequently this is the first application of indicator transfor-mation into analyses of CO2 target reservoirs in Croatia.
Geological description of the study area within the Sava DepressionDuring Late Pannonian and Early Pontian many depressional areas along the entire Pannonian Basin System were re-extended due to the ther-mal subsidence as result of 2nd transtensional phase[16–18]. Depositional spaces for the accom-modation of a huge volume of sandy material were created, and the main sandstone hydro-carbon reservoirs were deposited[19]. Turbidites were dominant clastic transport mechanism in the Croatian part of the Pannonian Basin Sys-tem (abbr. CPBS) during that time, originated from the Eastern Alps and transported through the Vienna Basin, the Styrian Basin and the Mura Depression, more to the east in several re-deposition phases, when it eventually en-tered into the Sava Depression[4, 17, 20–22]. Due to long transport only the medium and fine-grained sands and silts reached the depression, where in the calm periods, when turbiditic cur-
Indicator Kriging porosity maps of Upper Miocene sandstones, Sava Depression, Northern Croatia
39
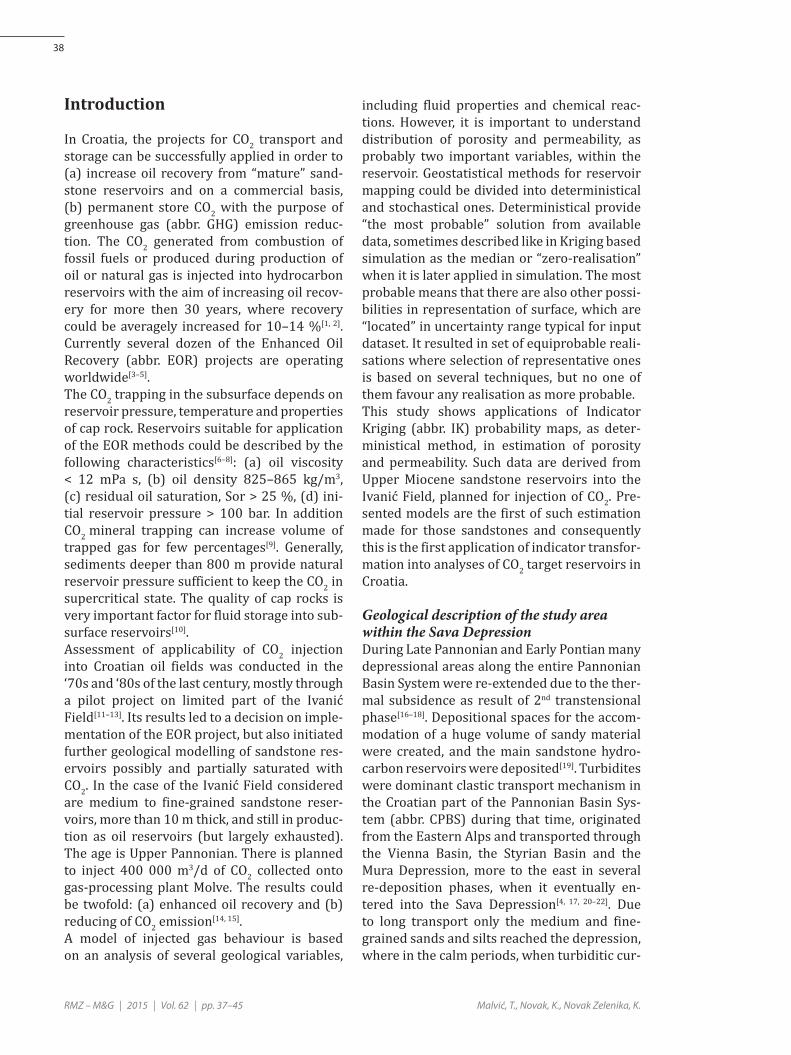
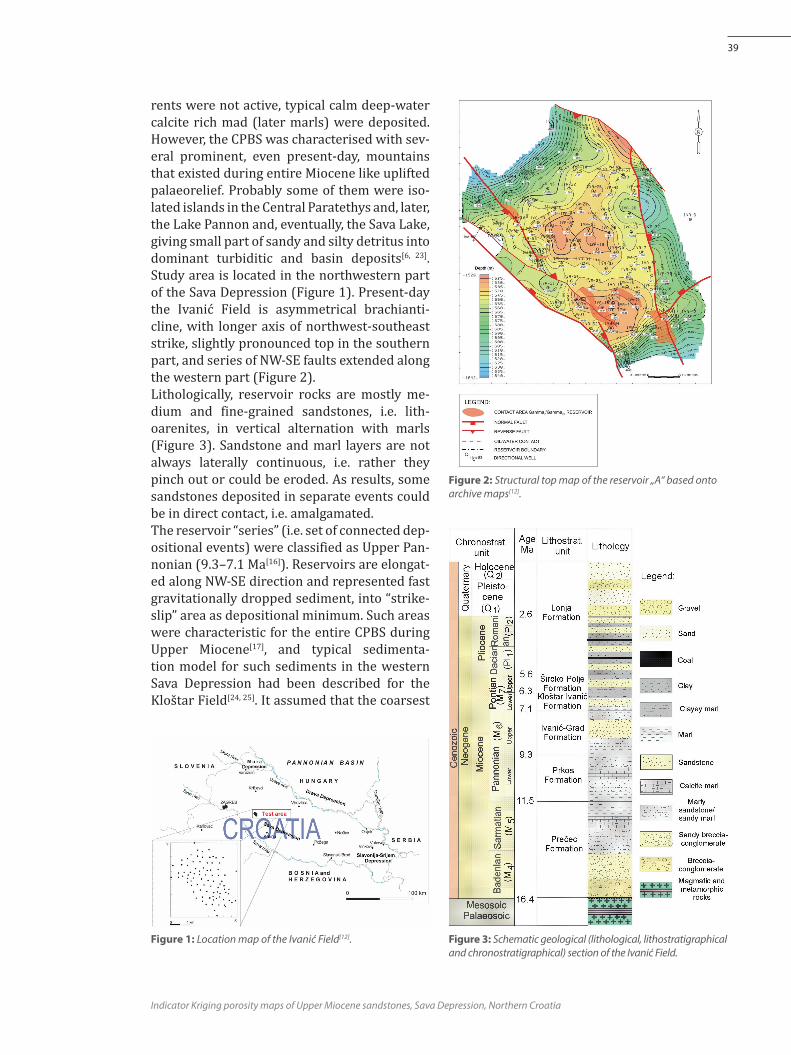
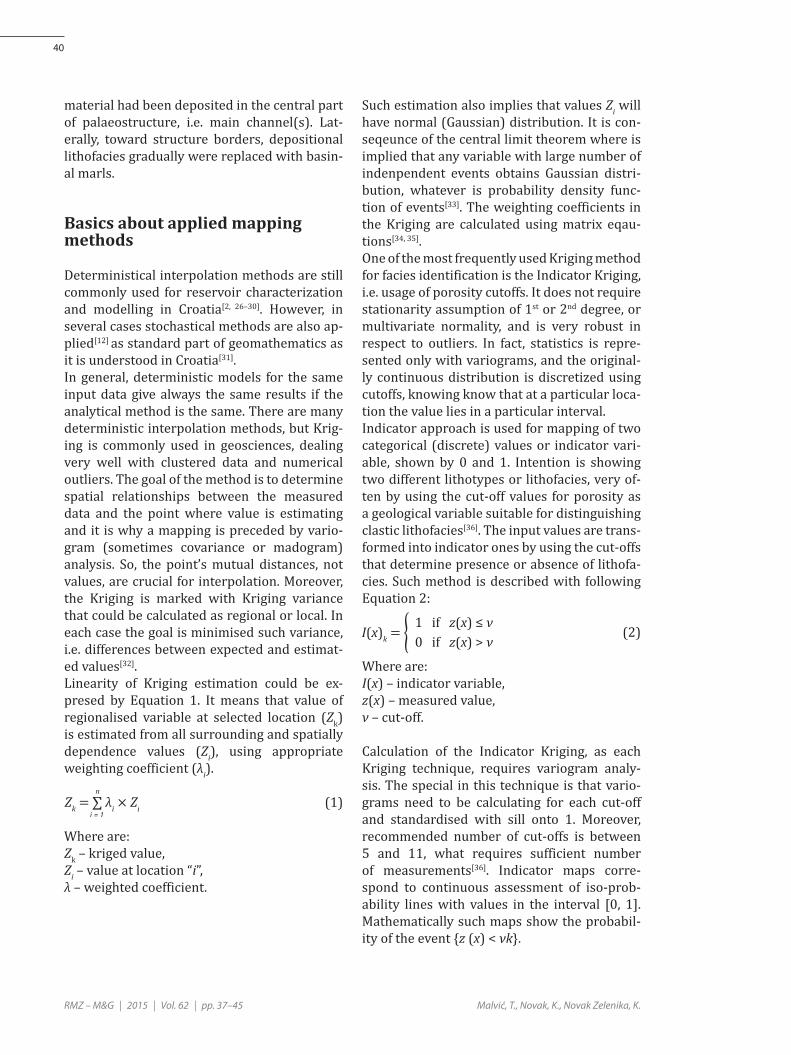
rents were not active, typical calm deep-water calcite rich mad (later marls) were deposited. However, the CPBS was characterised with sev-eral prominent, even present-day, mountains that existed during entire Miocene like uplifted palaeorelief. Probably some of them were iso-lated islands in the Central Paratethys and, later, the Lake Pannon and, eventually, the Sava Lake, giving small part of sandy and silty detritus into dominant turbiditic and basin deposits[6, 23]. Study area is located in the northwestern part of the Sava Depression (Figure 1). Present-day the Ivanić Field is asymmetrical brachianti-cline, with longer axis of northwest-southeast strike, slightly pronounced top in the southern part, and series of NW-SE faults extended along the western part (Figure 2). Lithologically, reservoir rocks are mostly me-dium and fine-grained sandstones, i.e. lith-oarenites, in vertical alternation with marls (Figure 3). Sandstone and marl layers are not always laterally continuous, i.e. rather they pinch out or could be eroded. As results, some sandstones deposited in separate events could be in direct contact, i.e. amalgamated. The reservoir “series” (i.e. set of connected dep-ositional events) were classified as Upper Pan-nonian (9.3–7.1 Ma[16]). Reservoirs are elongat-ed along NW-SE direction and represented fast gravitationally dropped sediment, into “strike-slip” area as depositional minimum. Such areas were characteristic for the entire CPBS during Upper Miocene[17], and typical sedimenta-tion model for such sediments in the western Sava Depression had been described for the Kloštar Field[24, 25]. It assumed that the coarsest
Figure 1: Location map of the Ivanić Field[12].
Figure 2: Structural top map of the reservoir „A“ based onto archive maps[12].
Figure 3: Schematic geological (lithological, lithostratigraphical and chronostratigraphical) section of the Ivanić Field.
Malvić, T., Novak, K., Novak Zelenika, K.
40
RMZ – M&G | 2015 | Vol. 62 | pp. 37–45
material had been deposited in the central part of palaeostructure, i.e. main channel(s). Lat-erally, toward structure borders, depositional lithofacies gradually were replaced with basin-al marls.
Basics about applied mapping methods
Deterministical interpolation methods are still commonly used for reservoir characterization and modelling in Croatia[2, 26–30]. However, in several cases stochastical methods are also ap-plied[12] as standard part of geomathematics as it is understood in Croatia[31]. In general, deterministic models for the same input data give always the same results if the analytical method is the same. There are many deterministic interpolation methods, but Krig-ing is commonly used in geosciences, dealing very well with clustered data and numerical outliers. The goal of the method is to determine spatial relationships between the measured data and the point where value is estimating and it is why a mapping is preceded by vario-gram (sometimes covariance or madogram) analysis. So, the point’s mutual distances, not values, are crucial for interpolation. Moreover, the Kriging is marked with Kriging variance that could be calculated as regional or local. In each case the goal is minimised such variance, i.e. differences between expected and estimat-ed values[32]. Linearity of Kriging estimation could be ex-presed by Equation 1. It means that value of regionalised variable at selected location (Zk) is estimated from all surrounding and spatially dependence values (Zi), using appropriate weighting coefficient (λi).
(1)
Where are: Zk – kriged value,Zi – value at location “i”,λ – weighted coefficient.
Such estimation also implies that values Zi will have normal (Gaussian) distribution. It is con-seqeunce of the central limit theorem where is implied that any variable with large number of indenpendent events obtains Gaussian distri-bution, whatever is probability density func-tion of events[33]. The weighting coefficients in the Kriging are calculated using matrix eqau-tions[34, 35]. One of the most frequently used Kriging method for facies identification is the Indicator Kriging, i.e. usage of porosity cutoffs. It does not require stationarity assumption of 1st or 2nd degree, or multivariate normality, and is very robust in respect to outliers. In fact, statistics is repre-sented only with variograms, and the original-ly continuous distribution is discretized using cutoffs, knowing know that at a particular loca-tion the value lies in a particular interval. Indicator approach is used for mapping of two categorical (discrete) values or indicator vari-able, shown by 0 and 1. Intention is showing two different lithotypes or lithofacies, very of-ten by using the cut-off values for porosity as a geological variable suitable for distinguishing clastic lithofacies[36]. The input values are trans-formed into indicator ones by using the cut-offs that determine presence or absence of lithofa-cies. Such method is described with following Equation 2:
(2)
Where are: I(x) – indicator variable,z(x) – measured value,ν – cut-off.
Calculation of the Indicator Kriging, as each Kriging technique, requires variogram analy-sis. The special in this technique is that vario-grams need to be calculating for each cut-off and standardised with sill onto 1. Moreover, recommended number of cut-offs is between 5 and 11, what requires sufficient number of measurements[36]. Indicator maps corre-spond to continuous assessment of iso-prob-ability lines with values in the interval [0, 1]. Mathematically such maps show the probabil-ity of the event {z (x) < νk}.

Indicator Kriging porosity maps of Upper Miocene sandstones, Sava Depression, Northern Croatia
41
Input datasetsInput datasets consisted of 16 wells with po-rosity and permeability values of the reservoirs “A” and “B” (Table 1 and 2). Porosities were cal-culated from the log analyses and cored inter-vals. Permeabilities were obtained by unsteady state method at a constant oil/water viscosity ratio and applying a constant differential pres-sure across the core samples. After correction for overburden pressure, depth correlation of log analyses and coring data was performed. Several cut-offs were defined for probability mapping:
― In reservoir “A”: < 15 %, 15–19 %, 19–22 %, 22–24 % and > 24 % for porosity, and < 40 × 10–3 µm2, 40–50 × 10–3 µm2, 50–60 × 10–3 µm2, 60–70 × 10–3 µm2, 70–80 × 10–3 µm2 and > 80 × 10–3 µm2 for permeability.
― In reservoir “B”: < 10 %, 10–15 %, 15–20 %, 20–23 % and> 23 %, and < 1 × 10⁻³ µm2, 1–5 × 10⁻³ µm2, 5–20 × 10–3 µm2, 35–75 × 10–3 µm2 and > 75 × 10–3 µm2. Histograms are shown in Figure 4.
Indicator Kriging porosity subsurface maps and correlation between porosity and permeabilityPetrophysical parameters were mapped by the Indicator Kriging and obtained are probabili-ty maps for certain interval. Porosity intervals 19–22 % for reservoir “A” (Map 1) and 20–23 % for reservoir “B” (Map 2) are chosen as the best representing for extension of medium-grained reservoir sandstones. For reservoir “A” is also derived E-type map that shows the most prob-able values of porosity (Map 3). Correlation be-tween porosity and permeability was calculat-ed using Pearson’s correlation coefficient, and coefficient of determination. The value for the reservoir “A” reservoir is R = 0.76 and R2 = 0.57 retrospectively (Figure 5) and for reservoir “B” 0.89 and 0.79 (Figure 6).The both values are qualitatively “high” and can described stronger linear dependence between two analysed variables, especially for reservoir “B”. Furthermore, both reservoirs are result of deeper lake sedimentary processes. Later, area was subdued to compaction. However, there were not existed processes that could
Well Porosity(%)
Horizontal permeability(10–3 µm2)
Well 1 21.03 LIQUIDATEDWell 2 18.68 56.22Well 3 22.65 76.40Well 4 18.23 39.90Well 5 20.20 LIQUIDATEDWell 6 14.32 41.40Well 7 21.32 52.40Well 8 18.93 48.09Well 9 22.03 70.68Well 10 17.27 60.14Well 11 24.21 81.01Well 12 23.13 62.50Well 13 20.95 49.74Well 14 22.08 67.20Well 15 19.80 60.93Well 16 21.12 58.11
Well Porosity(%)
Horizontal permeability(10–3 µm2)
Well 1 1.90 LIQUIDATEDWell 2 0.81 1.39Well 3 5.10 4.07Well 4 19.78 32.85Well 5 0.00 LIQUIDATEDWell 6 0.00 0.91Well 7 0.00 1.39Well 8 0.00 1.20Well 9 8.62 10.39Well 10 23.76 77.38Well 11 1.99 2.54Well 12 23.13 34.36Well 13 12.07 15.83Well 14 19.09 29.40Well 15 0.00 1.63Well 16 21.27 36.37
Table 1: Input dataset for the reservoir “A” Table 2: Input dataset for the reservoir “B” reservoir

Malvić, T., Novak, K., Novak Zelenika, K.
42
RMZ – M&G | 2015 | Vol. 62 | pp. 37–45
Map 1: Probability map for the porosity interval 19–22 % of reservoir “A” .
Map 2: Probability map for the porosity interval 20–23 % of reservoir “B”.
Figure 4: Histograms of defined classes for the reservoirs “A” and “B” porosity and permeability.
Histogram of number of data in cut-off defined classes of “Gamma 3“ porosity X axis: porosity (%), Y axis: number of data)
Histogram of number of data in cut-off defined classes of “Gamma 4“ porosity (X axis: porosity (%), Y axis: number of data)
Histogram of number of data in cut-off defined classes of “Gamma 3“ porosity (X axis: permeability (10-3 µm2), Y axis: number of data)
Histogram of number of data in cut-off defined classes of “Gamma 4“ porosity (X axis: permeability (10-3 µm2), Y axis: number of data)

Indicator Kriging porosity maps of Upper Miocene sandstones, Sava Depression, Northern Croatia
43
result in secondary porosity (tectonic caused fracturing) or filling pores with dissolved ma-terials. So, the primary porosity played main role in fluid distribution, what is favourable for linear relation between porosity and permea-bility. The larger correlation between porosity and permeability in reservoir “B” is probably reflection of generally narrow range of both values in analysed lithological sequence, what is consequence of more uniform depositional environment.
Results and conclusions
Analysed sandstone reservoirs were created in brackish, lacustric depositional environments of the Lake Pannon. The mineral content is rep-resented with quartz, dolomite rock fragments, micas, K-feldspars and cement. The texture is medium to fine-grained with porosity mostly between 15 % and 25 % and average permea-bility between 50 and 60 × 10–3 µm2. Those val-ues can be considered as typical for the Upper Miocene sandstones in the Sava Depression. Depositional environment included periodical-ly active regional turbidites during Late Panno-nian and Early Pontian stages. However, here are marked intervals between 19 % and 23 % as the most representative for describing depositional area of typical channel, medium-grained sandstone lithofacies. Those are the best lithology for fluid flow and injec-tion into analysed reservoirs. For this purpose those intervals are mapped into two reservoirs planned for CO2 injection. The results (Maps 1 and 2) shows areas where such turbiditic litho-facies could be certainly followed. However, the maps are biased with elongated “bull-eyes” ef-fect, what is not favourable feature for interpre-tation. It could be override using approximately omnidirectional variogram model, with larger ranges, but it was not observed in data itself. So, presented Indicator Kriging probability maps are considered as the most representa-tive and useful for planning pilot injection.The last Map 3 is direct porosity map of the res-ervoir “A”, but interpolated using Ordinary and Indicator Kriging algorithms simultaneously.
Figure 5: Porosity and permeability regression line for reservoir “A”.
Figure 6: Porosity and permeability regression line for reservoir “A”.
Map 3: Indicator Kriging E-type map of reservoir “A” porosity, based on the equation of Ordinary Kriging.

Malvić, T., Novak, K., Novak Zelenika, K.
44
RMZ – M&G | 2015 | Vol. 62 | pp. 37–45
It was possible using algorithm that indicator probability maps considered as the “weights” for the more precise application of the Ordi-nary Kriging.Interestingly, not each “bull-eye” shape was characterised with maximal probabilities or di-rect porosity estimated values. It is directed re-flection of palaeo-depths of each such “micro” strike-slip on the bottom of the Ivanić Structure during Upper Pannonian, where some of them were deeper and “collected” the coarser de-tritus (mostly on the east and southeast) then other ones.
Acknowledgments
This work represents part of a multidisci-plinary geological research project entitled “Development of geomathematical methods for analysis of Neogene depositional environ-ments in the Croatian part of Pannonian Basin System” (head T. Malvić), financially support-ed by the University of Zagreb in programme “Supporting of researching 2” in the 2013, the licensed version of WinGslib had been used for mapping.
References
[1] Awan, A. R., Teigland, R., Kleppe, J. (2008): A Sur-vey of North Sea Enhanced-Oil-Recovery Projects Initiated During the Years 1975 to 2005. SPE Res. Eval. & Eng., 11 (3), pp. 497–512.
[2] Balić, D., Velić, J. & Malvić, T. (2008): Selection of the most appropriate interpolation method for sandstone reservoirs in the Kloštar oil and gas field. Geologia Croatica, 61 (1), pp. 27–35.
[3] Bennaceur, K., Monea, M., Sakurai, S., Gupta, N., Ramakrishnan, T. S., Whittaker, S., Randen, T. (2004): CO2 capture and storage a solution within. Oilfield Review, 16 (3), pp. 44–61.
[4] Ma, J., Morozov, I. (2010): AVO modeling of pres-sure-saturation effects in Weyburn CO2 sequestra-tion. The Leading Edge, 29 (2), pp. 178–183, doi: 10.1190/1.3304821.
[5] White, D. (2009): Monitoring CO2 storage during EOR at the Weyburn-Midale Field. The Leading Edge, 2 (7), pp. 838–842, doi: 10.1190/1.3167786.
[6] Sarapa, M. (1981): Utjecaj ugljičnog dioksida na svojstva i iscrpak nafte (Influence of carbon-diox-ide on oil properties and recovery) Mag. Thesis. University of Zagreb: Faculty of Mining, Geology and Petroleum Engineering 1981; 171 p.
[7] Sečen, J. (2006): Enhance oil recovery methods (Metode povećanja iscrpka nafte) (1st ed.). Zagreb: INA-Industry of Oil Plc 2007, pp. 273–364.
[8] Stalkup, F.I. (1980): Carbon Dioxide Miscible Flooding: Past, Present, And Outlook for the Future. Journal of Petroleum Technology, 30 (8), 1102–1112, doi: 10.2118/7042-PA.
[9] Lu, J., Wilkinson, M. & Haszeldine, R. S. (2011): Carbonate cements in Miller field of the UK North Sea: a natural analogue for mineral trapping in CO2 geological storage. Environmental Earth Sci-ences, 62 (3), pp. 507–517.
[10] Bauer, S., Class, H., Ebert, M., Gotze, H., Holzheid, A., Kloditz, O., Rosenbaum, S., Rabbel, W. & Scha-fer, D. (2012): Modelling, Parameterization, and Evaluation of Monitoring Methods for CO2 Storage in Deep Saline Formations the CO2 MoPa Project. Environmental Earth Sciences, doi: 10.1007/s1266-012-1707-y.
[11] Goričnik, B., Domitrović, D. (2003): Laboratori-jska istraživanja primjenjivosti CO2 procesa na naftnim poljima u Republici Hrvatskoj (Labora-tory researching of applicability of CO2 processes in oil fields in Republic of Croatia). Naftaplin, 1, pp. 5–12.
[12] Novak, K., Malvić, T., Velić, J., Simon, K. (2013): Increased hydrocarbon recovery and CO2 storage in Neogene sandstones, a Croatian example: part II. Environ Earth Sciences, 71 (8), pp. 1866–6280, doi:10.1007/s12665-013-2756-6.
[13] Perić, M., Kovač, S. (2003): Simulacijska studija procesa povećanja iscrpka nafte (EOR-proce-sa) istiskivanjem ugljik-dioksidom primjenom višekomponentnog modela COMP III (Simulation Study of Enhanced Oil Recovery Process by CO2 injection Applying a Multi-component COMP III). Naftaplin, 1, pp. 13–25.
[14] Novak Zelenika, K., Velić, J., Malvić, T. (2013): Local sediment sources and palaeoflow directions in Upper Miocene turbidites of the Pannonian Basin System (Croatian part), based on mapping of reservoir properties. Geological quarterly, 57 (1), pp. 17–30.
[15] Novosel, D. (2005): Rezultati projekta pokusnog istiskivanja nafte utiskivanjem ugljičnog dioksida na Naftnom polju Ivanić (The project results of

Indicator Kriging porosity maps of Upper Miocene sandstones, Sava Depression, Northern Croatia
45
test oil replacement by carbon dioxide on the Ivanić oil field). Naftaplin, 1, pp. 51–60.
[16] Haq, B. U., Eysinga, F. W. B. (1998): Geological Time Table (5th ed.). Amsterdam: Elsevier Sci-ence, (Wall Chart).
[17] Malvić, T. (2012): Review of Miocene shallow marine and lacustrine depositional environments in Northern Croatia. Geological Quarterly, 56 (3), pp. 493–504.
[18] Malvić, T., Velić, J. (2011). Neogene Tectonics in Croatian Part of the Pannonian Basin and Reflec-tance in Hydrocarbon Accumulations. In: New Frontiers in Tectonic Research: At the Midst of Plate Convergence, Schattner, U. (eds.), InTech, Rijeka 2011, pp. 215–238.
[19] Velić, J. (2007): Geologija ležišta nafte i plina (Ge-ology of oil and gas reservoirs). Faculty of Mining, Geology and Petroleum Engineering, University of Zagreb 2007; 342 p.
[20] Rögl, F. (1998): Palaeographic Consideration for Mediterranean and Paratethys Seaways (Oligocene to Miocene). Ann. Naturhist. Mus. Wien 99A 1998; pp. 279–310.
[21] Vrbanac, B. (1996): Palaeostructural and sedimen-tological analyses of Upper Pannonian sediments Ivanić Grad Formation in the Sava Depression. Doctoral Thesis. University of Zagreb: Faculty of Mining, Geology and Petroleum Engineering 1996; 121 p.
[22] Vrbanac, B., Velić, J., Malvić, T. (2010): Sedimen-tation of deep-water turbidites in the SW part of the Pannonian Basin. Geologica Carpathic, 61 (1), 55—69, doi: 10.2478/v10096-010-0001-8.
[23] IEA GHG Weyburn CO2 Monitoring & Storage project Summary Report 2000–2004. Petroleum Technology research Centre, Regina 2004. Avail-able on: <http://www.ptrc.ca/siteimages/Summa-ry_Report_2000_2004.pdf>.
[24] Novak Zelenika, K., Cvetković, M., Malvić, T., Velić, J. & Sremac, J. (2013): Sequential Indicator Simulations maps of porosity, depth and thick-ness of Miocene clastic sediments in the Kloštar Field, Northern Croatia. Journal of Maps, 9 (4), pp. 550–557.
[25] Novak Zelenika, K. (2012): Deterministički i stohastički geološki modeli gornjomiocenskih pješčenjačkih ležišta u naftno-plinskom polju Kloštar (Deterministic and stohastic geological models of Upper Miocene sandstones reservoirs at the Kloštar oil and gas field). Doctoral Thesis,
University of Zagreb: Faculty of Mining, Geology and Petroleum Engineering 2012, 190 p.
[26] Cvetković, M., Velić, J., Malvić, T. (2009): Applica-tion of neural networks in petroleum reservoir lithology and saturation prediction. Geologia Croatica, 62 (2), pp. 115–121.
[27] Malvić, T. (2005): Rezultati geostatističkog kar-tiranja poroznosti polja zapadnog dijela Dravske depresije (Molve, Kalinovac, Stari Gradac). Nafta, 56 (12), pp. 472–476.
[28] Malvić, T. (2006): Middle Miocene Depositional Model in the Drava Depression Described by geostatistical porosity and thickness maps (case study: Stari Gradac-Barcs Nyugat Field). Rudar-sko-geološko-naftni zbornik, 18, pp. 63–70.
[29] Malvić, T., Balić, D. (2009): Linearnost i Lagrange-ov linearni multiplikator u jednadžbama običnoga kriginga (Linearity and Lagrange Linear Multipli-cator in the Equations of Ordinary Kriging). Nafta, 60 (1), pp. 31–43.
[30] Malvić, T., Đureković, M. (2003): Application of methods: Inverse distance weighting, ordinary kriging and collocated cokriging in porosity eval-uation, and comparison of results on the Beničan-ci and Stari Gradac fields in Croatia. Nafta, 54 (9), pp. 331–340.
[31] Lapaine, M., Malvić, T. (2009): Geomathematics be-tween Mathematics and Geosciences. Annual of the Croatian Academy of Engineering, 12, pp. 51–67.
[32] Isaaks, E., Srivastava, R. (1989): An Introduction to Applied Geostatistics. New York: Oxford University Press Inc. 1989; 580 p.
[33] Geiger, J. (2006): The behaviour of Sequential Gaussian Simulation in the limits. Xth Congress of Hungarian Geomathematics, (May 18–20. 2006), Morahalom, Hungary.
[34] Deutsch, C. V., Journel, A. G. (1997): GSLIB: Geosta-tistical Software Library and User’s Guide (2nd ed.). New York: Oxford University Press Inc. 1997; 369 p.
[35] Hohn, M. E. (1988): Geostatistics and Petroleum Geology. New York: Van Nostrand Reinhold 1998; 400 p.
[36] Novak Zelenika, K., Malvić, T. & Geiger, J. (2010): Mapping of the Late Miocene sandstone facies us-ing Indicator Kriging. Nafta, 61 (5), pp. 225–233.