indicative valuation of unilever nv and plc
DESCRIPTION
Indicative share Valuation of Unilever NV and PLC by analysing the sector, firm, ratios and using the DDM, RIM, DCF and relative valuation methods.TRANSCRIPT

Unilever Indicative Valuation
25th April 2014
Module: Investment Analysis Project (BEAM048)
Module Co-‐coordinator: Jamie Stevenson
Supervisor: Dr. Angela Christidis
Student Number: 630058387
Candidate Number: 008016
Cohort: 2013-‐2014
Word Count: 5063 words (excluding tables, graphs, glossary, formula, appendix)

BEAM048 008016
2
Contents Glossary of Abbreviations and symbols ...................................................................................................... 3
1. Executive summary ...................................................................................................................................... 4 2. Introduction .................................................................................................................................................. 5 3. FMCG sector analysis .................................................................................................................................. 7
3.1 Cost and Profit margins 3.2 Sales volume 3.3 Consumer spending 3.4 Demography 3.5 Social and economic development 3.6 Competition
4. Company Analysis ..................................................................................................................................... 11 4.1 Segment Analysis 4.2 Geographical Analysis 4.3 Risk Profile
5. Financial Ratios ......................................................................................................................................... 14 6. Valuation .................................................................................................................................................... 16
6.1 Dividend Discount model and residual income model 6.2 Discounted cash flow 6.3 Relative Valuation
6.3.1 Price to Earnings Ratio 6.3.2 Altman Z-Score
7. Conclusion and Recommendation ............................................................................................................. 21 Formulae .............................................................................................................................................. 22
Bibliography ........................................................................................................................................ 23
Appendix 1. World Map of Private label .................................................................................................................. 25 2. SWOT Analysis ................................................................................................................................... 26 3. Ratios ................................................................................................................................................... 27 4. Forecasts and Common size analysis ................................................................................................... 29 5. Cost of equity and WACC calculation ................................................................................................. 32 6. Regression for beta .............................................................................................................................. 33 7. Global outlook for growth of GDP 2014-2025 .................................................................................... 34 8. Free cash flow and net debt forecasting ............................................................................................... 35 9. Price Earnings Ratio ............................................................................................................................ 35

BEAM048 008016
3
Glossary for Abbreviations and Symbols
AEX Amsterdam Stock Exchange
AMET Africa, Middle East and Turkey
CAPM Capital Asset Pricing Model
CEO Chief Executive officer
COGS Cost of goods sold
DMS Dimson, Marsh and Staunton
DPS Dividend Per share
EPS Earnings per share
FCF Free Cash flow
FCFF Free cash flow of the firm
FMCG Fast moving consumer goods
FTSE Financial Times Stock Exchange
GDP Gross domestic Product
LSE London Stock Exchange
NAMET South-east Asia, Australasia, South Asia, North Africa, Middle East, Turkey
NBER National Bureau of Economic Research
NPV Net Present Value
OECD Organization for Economic Co-operation and Development
P&G Procter and Gamble
PESTEL Political, economical, social, technological, environmental and legal.
PV Present Value
ROA Return on Assets
ROE Return on Equity
RUB Russia, Ukraine and Belarus
USG Underlying sales growth
UVG Underlying volume growth
VUCA Volatile, uncertain, complex and ambiguous market
WACC Weighted average cost of capital
WFPI World food price index
€ Euro
Δ Change

BEAM048 008016
4
1. Executive Summary This report presents valuation of The Unilever Group taking into account, Unilever PLC (LSE, London) and Unilever NV (AEX, Netherlands) as they operate as a single legal entity, headed by the same Board of Directors and linked with an equalization agreement according to which shareholders of either companies share the same dividends, benefits and rights as the other.
Highlights 2014, similar to 2013 is expected to be volatile and complex but with developing markets growing and developed markets recovering, opportunities seem to make space. As the inflation continues to rise and profit margins reduce, Unilever tries to increase reach in the emerging markets with continuous efforts to become sustainable. Key Points:
• Unilever aims to double sales turnover and reduce carbon footprint by 2020 through its operations, which may be an unrealistic goal.
• It has strong ROE, asset and PPE turnover ratios as compared to competitors.
• It has a high debt structure, which may affect stock prices and investor returns as the Federal Reserve plan to increase interest rate.
• By increasing focus towards the emerging markets, it would be strongly affected by the growth in the emerging markets and exchange rate fluctuation.
• Unilever has a payout ratio of about 54%, which could be affected as it ventures into the emerging markets in order to finance growth.
Market Overview
With improving economy, investors shift to better performing stocks as compared to stocks that have a stable growth in the need for higher profits, of which FMCG firms are considered historically stable. With the shifting consumption patterns and demography, firms are looking at new markets to increase sales as the mature developed markets show slow growth. Moving to the emerging markets is assumed to push sales volume that may ultimately improve firm position and figures.
Valuation Summary
Recommendation as on 25th April, 2014
HOLD
52-week Price range (€) 26.97 – 33.09
Average daily volume 3022690
Shares Outstanding 2840 million
Beta 0.6067 (NV), 0.6743 (PLC)
Adjusted Beta 0.7365 (NV), 0.7817 (PLC)
Market Capitalization (€) 74.24 billion
Historic P/E 15.79
Prospective P/E 14.77
Altman Z-score 3.28
Date (25th April, 2014) Unilever (€)
Current Price 30.1
Suggested Valuation Price 30.5
Target Range 29.6- 32.2
.

BEAM048 008016
5
2. IntroductionThe fast moving consumer goods industry includes non-food and food consumer products such as beverages, food and household products that are generally purchased on small-scale consumer decisions and pushed by heavy advertising and promotion. Large volumes sold define the success of the product and profits. Amidst the global crises, the FMCG sector has been considered to perform stably in comparison with other sectors (Figure 1), as individuals would probably postpone a holiday than ignore basic hygiene or meals. Thus they are considered to hold value even in extreme market conditions.
Figure 1: Margin Performance by sector
Note:The chart displays weighted EBITDA margin performance on the Forbes Global 2000 of the top 50 companies. Source: Capital IQ.
Unilever is one of the world’s strongest FMCG Company that manufactures and sells personal care, home care and foods and refreshments. It has a global presence in 190 countries and annual
sales of approximately €49.8 billion (2013) with over 400 brands.
• Founded in 1929 by the Merger of two companies, Margarine Unie and Lever Sunlight.
• Developed worldwide activities by building or purchasing factories in Japan, Argentina, Brazil, Thailand, Indonesia and India (1929-1933).
• Developed “Path to Growth” strategy and reduced number of brands from 1600 to 400. Concentrated production in 150 key sites (1999 onwards).
• Paul Polman was appointed as the CEO (2009).
Unilever follows a strategically designed strategy “The Compass” focusing on long-term sustainable growth of the firm. Through this, the firm has been able to expand its profits margins with tight capital management, resulting in increased gross profit margins. It aims to double its revenue along with reducing its carbon footprint by half which suggests major implication on the future policies and cash flow of the firm.
The increasing VUCA and currency fluctuations strongly impact the growth potential of the firm that may affect the financials. Limited growth from the developed markets like Europe and US and increasing growth in the developing economies, has significantly weakened consumer confidence. Even with reduced growth, Unilever’s personal and homecare segment have shown improvements, with the emerging markets accounting for about 57% of the market share.
Table 1: Category Overview
UN
ILE
VE
R
Personal Care
14 E
uro
Bill
ion
Bra
nds
• Driven by hair care, skin cleaning and deodorants. • Market share rising in Latin America, NAMET, RUB and North America. • Launch of TRESemme in Brazil added €150M to the annual turnover.
Home Care
• Consistent turnover of 17% over half a decade. • Market share rose due to laundry products in Europe, China and South
Africa. • Core Operating Margin up by 0.5% due to the new home care business
model.
Food And
Refreshments
• Market share has seen a decline due to mixed performance in volume gains in dressing, decline in savory, and stabilization in spreads market.
• Aggressive price competition in the ice-cream market in developed countries.
• 100% palm oil being sourced sustainably.

BEAM048 008016
6
Turnover Based on Category and Geography
Source: Unilever Annual Report Note: NAMET includes Asia while AMET does not. Currently 57% of Unilever’s market share is in the emerging markets, where the culture to packaged food is evolving suggesting a reduced turnover effect on the food and refreshments market (Figure 2). Personal care is gradually rising which can be accounted due to the shift in personal hygiene and awareness. Observing the geographical returns (Figure 3), consistent growth over the past years is seen. By the end of 2009, the expectations of the retrieval of the Euro crisis had faded away, which resulted in a slight decline in the turnover in Europe, but Unilever has been able to stabilize the growth. The North American market has been able to perform stably, with slight growth from the emerging markets where the companies aims to focus towards. Price Correlation
Source: Data from Bloomberg By observing the two graphs, it can be seen that the prices of Unilever PLC and NV have moved in positive correlation with their respective markets. This is because Unilever forms a major portion of these markets. Unilever PLC currently weighs 1.74% on the FTSE100 (UK) and Unilever NV weights 12.33% on the AEX index (Netherlands). Being important shares on the stock markets, their returns would have a significant impact on the comparable markets. The market risk of stocks is also not very high by being at 0.67 and 0.61, respectively.
Source: Data from Bloomberg
-‐0.2
-‐0.15
-‐0.1
-‐0.05
0
0.05
0.1
0.15
9/1/2002
1/14/2004
5/28/2005
10/10/2006
2/22/2008
7/6/2009
11/18/2010
4/1/2012
8/14/2013
12/27/2014
Simple return
Time
Figure 4: Price correlation between simple returns of Unilever PLC and FTSE100 ULVR LN Equity
-‐0.3
-‐0.2
-‐0.1
0
0.1
0.2
9/1/2002
1/14/2004
5/28/2005
10/10/2006
2/22/2008
7/6/2009
11/18/2010
4/1/2012
8/14/2013
12/27/2014
Simple Re
turn
Figure 5: Price correlation between simple returns of Unilever NV and AEX UNA NA Equity AEX Index

BEAM048 008016
7
3. FMCG Sector Analysis The industry forces affecting vary depending on the changing focus of Unilever. In the long run, demographic, economic and social development would result in significant changes while cost and profit margins, volumes sold and consumer spending would affect the current trends considering competitor performance. 3.1 Cost and Profit Margins
With the increasing pressure on the industry, rising costs and price competition, slow growth in the FMCG sector is experienced. Firms have regionally increased prices by 4-15% depending on the cost and this could continue to rise with increasing commodity prices. Though the cost of palm oil and copra (raw materials for the production of soaps) declined by 30% and 20% respectively, the exchange rate fluctuations countered the potential benefit. As the value of the currency in India, Brazil and Mexico fall, the cost of importing the raw materials is rising such as the recent decline in the value of the Rupee has made petroleum-based raw material more expensive in India due to which prices of certain personal care products have increased. The gap between the annual earnings and inflation is bridging over the years due to the fading effect of the recession. As the economy improves, the earnings would possibly grow above inflation, suggesting potential benefits for the firms.
This price increase would affect the consumer spending, as the earnings have not risen in proportion with the inflation (UK) (Figure 6), this may reduce the demand for goods. Although prices have increased, inflation has countered the rise in profit margins and share performance for the firms (Figure 7). The sector looks vulnerable to improving performance as investors may shift to sectors showcasing better returns.
Figure 6: Earnings v/s Inflation (CPI) as a % of previous year
Note: Graph shows the median full-time gross weekly earnings and inflation measured by the CPI. Source: Annual Survey of Hours and earnings, Office of National statistics (UK). Figure 7: Low margin growth impacting share performance
Source: EY margin Unlocked Report. EY analysis from S&P Central IQ. Start of period A long-term trend between the changing WFPI and oil price has also been observed (Figure 8). Based on this trend, it can be assumed that the food prices move along the oil price movements, which is because fuel is a direct cost for manufacturing and selling. This trend could significantly affect future food prices, thus affecting industry profitability. Considering the aims of Unilever to reduce its carbon footprint by 50% and doubling its sales growth by 2020 in order to be the market leader, it could look at alternatives sources of energy such as renewables which could help it counter the oil price increase affect. Considering the forecasted energy demand (Figure 9), the demand for renewable sources is expected to see the strongest increase in the next two decades.

BEAM048 008016
8
Source: Food and Agriculture organization of the United Nations and Energy Information Administration. According to PWC (2010), there has been a market pull for environmentally sound products in the last few years. Unilever’s acts to increase use of sustainable resources could also help growth along with possible reduced cost.
Figure 9: Growth in Total Primary Energy Demand
Source: International Energy Agency, 2012 3.2 Sales Volumes Volumes, due to considerably low profit margins mainly drive the profitability of the sector. In terms of value, the FMCG sector continues to grow. It grew by 4.2% (globally), higher than the annual world GDP, of which only 1.3% was due to volumes. Unilever’s food and refreshment category (Figure 10) was able to keep the USG to around 8% (2013), but the UVG fell significantly– stable revenue due to price mechanism. Most FMCG categories displayed a reduced volume growth while the firm was able to stabilize the revenue growth. The reduced volumes sold could also be due to the increasing purchase of private labels that has negatively impacted the national brands.
Source: Unilever Annual report
3.3 Consumer spending
According to the OECD (2014), the reduced economic growth and increasing unemployment globally, has hurt consumer confidence. Though the recession has officially ended in 2009, budgeting is still the core of many households, where the customers have settled for conservative purchase behavior as the “New Normal”. Furthermore, a report by Neilsen (Q4 2013) stated that the spending intentions of individuals by the end 2013 had been conservative, fueled with sluggish wages increase, which was compensated with rising costs. This has resulted in downgrading to cheaper goods, especially in Europe, resulting in the 1% increase in value share for private labels in 2011 as compared to 2010. Positively, though FMCG consists of about 25% (Q3 2012) (Figure 11) of the annual household budget, it is not the first choice to cutbacks. Reports have suggested that during inflationary markets, the consumer spending on day-to-day groceries may increase, as people tend to spend more on entertaining at home. But, what portion of this falls in the pockets of the branded FMCG companies is the question as increasing sales of private labels are eating into the profit margins of national brands.
Private labels account for about 16% of the global FMCG market. They offer lower prices and competitive quality, which showcases a potential advantage during inflationary conditions. This is a common phenomenon in Switzerland, UK, Spain, Poland, Germany and Netherlands (Figure 12). The graph (Figure 13) though represents data from 1972-1990; the continuous trend during this duration represents reducing disposable income, alongside increasing expenditure on private labels,
0
100
200
300
2000
2001
2002
2003
2004
2005
2006
2007
2008
2009
2010
2011
2012
2013
$/ba
rrel and
Inde
x Price
Figure 8: Comparison between WFPI and oil prices
Brent Oil Spot Price ($ per Barrel) World Food Price Index U.S. Crude Oil Price ($ per Barrel)
-‐4
-‐2
0
2
4
6
8
10
12
2010 2011 2012 2013
Fig 10: UVG/USG of food and refreshments category UVG
USG

BEAM048 008016
9
which could be the current scenario as well. This may affect the shares and profits of the FMCG giants as 85% of the global consumers claim that rising food prices will affect their grocery purchase decisions (Neilson, 2013) and only 27% are interested in switching to national brands as the economy improves (Deloitte, 2013) which could result in extensive price competition, further reducing profit margins.
Figure 11: Percent share of Spend by sector, YTD
Source: Nielsen (Q3, 2012) Figure 12: Global Private Label penetration (% of grocery sales)
Source: International Market Bureau, 2013 The relative low exposure of private labels in emerging markets such as China, Africa, India, Eastern Europe and Latin America supports Unilever’s strategy on focusing on the emerging markets (Appendix 1). This trend is also due to the low importance of hypermarkets and supermarkets as they account for only 23% of the FMCG sales as compared to 70% in the developed markets. Though Unilever does not only rely on large retail chains, but improved infrastructure would support sales.
Figure 13: Personal disposable income against private label market share
Source: MIT Sloan Management Review, 1993 3.4 Demography According to the United Nations estimates, the world population in the spring of 2024 will be about 8 billion (Worldometers.info, 2014) as against the 7.2 billion in 2014. This will though happen gradually, but with the rise in population, there will be a switch in demands from the current locations to the potential markets as most of the middle-class growth is expected in the Asia-Pacific region which will account for more than 85% through 2020 (Figure 14).
*Global middle class: People whose daily expenditure falls are $10 - $100 in terms of Purchasing Power Parity. Source: OECD Development centre, 2010. Companies would need to shift their focus to cater to needs of this demographic shift and obtain a market position to take control of the market, resulting in higher shareholder value that would be encouraged with long-term planning and foreseeing future trends. The developed markets would be concentrated with the mature individuals
525
1740
3228
0
1000
2000
3000
4000
5000
6000
2009 2020 2030
Popu
la8o
n (in
millions)
Figure 14: Global middle class Growth North America
Europe
Central and South America
Asia-‐Pacific
Sub-‐saharan Africa
Middle east and North Africa

BEAM048 008016
10
generally above 40 years of age and would thus need products suiting their specific needs while a younger generation would be seen in the developing markets where the fertility rate is still stronger than that of the developed markets. 3.5 Social and Economic development
With the change in consumer attitudes, a new market has evolved where shoppers have become conscious of what they pick before consumption. This gives new opportunities to increase sales volume and develop or redesign to (Iriworldwide.com, 2013a) “cleaner” foods, which are healthier to consume, suiting the needs of the customers. The social shift between the role of men and women, with increasing number of men shopping gives a changing focus for firms as a change in the product which is smarter, better and faster could be beneficial.
As per the Consumer Products Outlook (Deloitte, 2014), the eroding brand loyalty for the FMCG category has affected sales of the competing national brands as compared to the private labels or less expensive brands with 88% U.S consumers stating private labels to be at par with national brands. This is a great challenge for national brands as most of the consumers are taking cautionary measures with recessionary mindsets. This impact may increase in the long run as private labels improve quality and the society turns indifferent between them. Studies by Rabobank (2011) have forecasted that the private label may turn to about 50% of the total food consumption retail by 2025, which could be a huge threat to national brands like Unilever and Nestle at least in the mature markets.
3.6 Competition
Nestle and P&G are the biggest competitors to Unilever. P&G concentrates on the personal and home care segment while Nestle’s expertise is in the food and refreshment category and Unilever operates in both the markets. Alongside, the firms have a wide range of differences in terms of business model where P&G achieves 61% of its sales from the developed markets consisting of North America, Western Europe and Japan as compared to 43% of Unilever. It also continues to invest in the developed markets while Unilever is shifting focus to the emerging markets. Meanwhile, a single country contributes no more
10% of revenue for Nestle with just 28% sales in Asia, Oceania and Africa. Though Nestle and Unilever share similar goals of profitability with sustainability, P&G prioritizes innovation and productivity.
Comparatively low exposure of Nestle, P&G and private labels in the emerging markets gives Unilever a strong position to strengthen its base. Alternatively, Unilever would have to indulge in extensive investments to build the needed infrastructure in as a large population still occupies the rural areas, restricting accessibility, whose advantage could later be exploited by the competitors, making the entry expensive for Unilever. A comparative financial position is analyzed later.

BEAM048 008016
11
4. Company Analysis 4.1 Segment Analysis Table 2: Category financial breakdown
2009 2010 2011 2012 2013 Revenue
Personal Care 30% 31% 33% 35% 36% Home Care 17% 17% 18% 18% 18% Food and Refreshments
53% 51% 49% 47% 46%
Operating Income Personal Care 37% 36% 39% 42% 41% Home Care 12% 7% 7% 8% 7% Food and Refreshments
51% 56% 53% 50% 52%
Source: Unilever Annual Report Figure 15: Actual and forecasted revenue contribution by segment
Note: Forecast based on historical values and personal judgment.
In the past five years, the company has been able to increase its revenue from personal care, which is due to acquisition of multiple brands and increase in public awareness towards personal hygiene. Considering the shift towards emerging markets, where the need for personal hygiene is increasing; the contribution of personal care is expected to grow before stabilizing. It showcases increasing operating income due to the high profit margins and brand loyalty associated with the personal care products like shampoo, soaps, deodorants, etc., in which Unilever operates in the premium category as well such as Toni & Guy.
Alongside, stable revenue from the home care segment have been experienced over the last half-decade. It could be assumed that the future growth
would also be at the same rate. The profit margins have reduced over the years due to increasing price competition from local brands and lack of innovative and differentiated products which could result in reduced revenue in future as the company may invest little in the home care market as it adds the least value to the business.
The food and refreshment category have been contributing the largest operating income over the years, but a decline could be experienced in future as Unilever increases focus on the emerging markets, where the culture to consume packed food is weak with increasing popularity of natural food products. Unilever could make significant profits from the developed markets by focusing on the production of healthier consumables. As Unilever shifts its focus on the changing market trend and the emerging markets accept packaged food, their revenue could substantially increase.
Considering the above factors that would affect the FMCG industry, the firm may innovate some products to reduce the environmental affects. This may result in competition, but as Unilever shifts its focus on the emerging markets where P&G and Nestle are less focused and the demographic shift, the revenue could alter.
0%
20%
40%
60%
80%
100%
2009
2010
2011
2012
2013
2014
2015
2016
2017
2018
2019
2020
Revenu
e
Personal Care Home Care Food and Refreshments

BEAM048 008016
12
4.2 Geographical Analysis Table 3: Geographical Financial breakdown
2009 2010 2011 2012 2013 Revenue
Asia Africa 37% 40% 41% 40% 40% Americas 32% 33% 33% 33% 33% Europe 30% 27% 26% 27% 27%
Operating Income Asia Africa 38% 36% 34% 38% 37% Americas 37% 34% 35% 35% 38% Europe 25% 30% 31% 27% 25%
Source: Unilever Annual Report
Based on the changing demand patterns, Asia and Africa showcase increasing demand in the recent years as most of the regions in these markets are yet emerging and are expected to develop in future. Also, with improved employment opportunities and quality of life, individuals would spend on quality products for daily needs. Considering this, the performance of Asia and Africa are expected to be the major focus, driving growth.
Though Asia and Africa are expected to result in about 43% of the sales in future, Europe and America are still considered important as some of their regions are still developing. Furthermore, the developed markets cannot be ignored in this context as they contribute heavily to the revenues of Unilever at about 43% in 2013, but the growth in the developed markets is close to maturity. It would have to change the product focus in these regions as discussed earlier.
Currently, emerging markets contribute about 56% to the annual revenue. The company hopes to change this to 75% by 2020. If the firm is able to achieve this goal, it may result in losing a major segment in the developed markets, which it needs to defend from the competitors and increasing trend of private labels. Though the firm has increased their revenue from Asia and Africa (a major part of the emerging markets), the operating income has not suggested similar results. This is due to difference in economic pressures and exchange rate fluctuations where the emerging markets have recently suffered. Unilever currently invests in forward contracts of traded commodities to reduce this exposure, but this increases the risk of the firm as derivate could negatively affect the firm by increasing liquidity, credit and market risk. Unilever has to consider such external risks while
making investments as the developed markets are currently providing promising operating income but with proportionally lower revenue.
BEAM048 008016
13
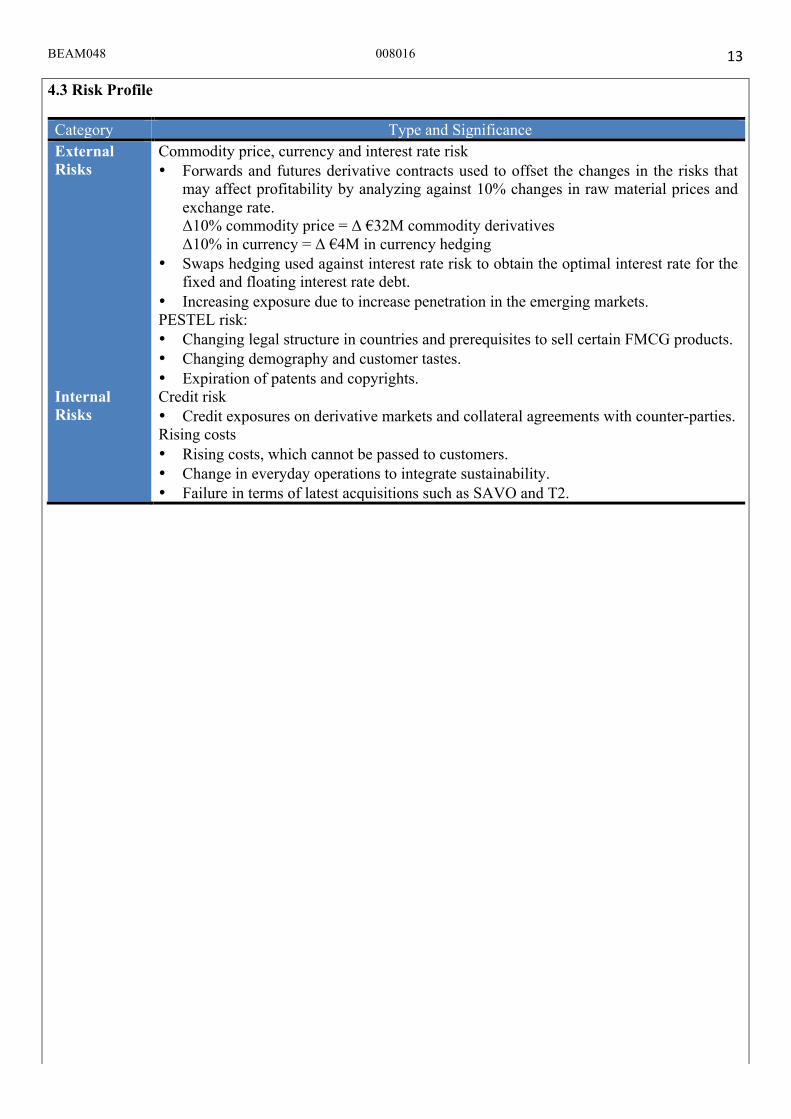
4.3 Risk Profile Category Type and Significance External Risks
Commodity price, currency and interest rate risk • Forwards and futures derivative contracts used to offset the changes in the risks that
may affect profitability by analyzing against 10% changes in raw material prices and exchange rate. Δ10% commodity price = Δ €32M commodity derivatives Δ10% in currency = Δ €4M in currency hedging
• Swaps hedging used against interest rate risk to obtain the optimal interest rate for the fixed and floating interest rate debt.
• Increasing exposure due to increase penetration in the emerging markets. PESTEL risk: • Changing legal structure in countries and prerequisites to sell certain FMCG products. • Changing demography and customer tastes. • Expiration of patents and copyrights.
Internal Risks
Credit risk • Credit exposures on derivative markets and collateral agreements with counter-parties. Rising costs • Rising costs, which cannot be passed to customers. • Change in everyday operations to integrate sustainability. • Failure in terms of latest acquisitions such as SAVO and T2.

BEAM048 008016
14
5. Financial Ratios (Appendix 3)
5.1 Profitability and Asset Utilization Ratio Figure 16: Profitability Ratios
Unilever performed either at par or better than its competitors. The profitability ratios (Figure 16) have been considerably stable, with Unilever showing a better ROA and ROE as compared to Nestle and P&G; suggesting a better utilization of resources, even with a slightly lower net profit margin. The ratios of Nestle in 2010 can be seen as an outlier as by selling Alcon eye care to Novartis, it experienced a dramatic rise in net profits. Unilever’s high ROE could be due to
higher debt employment as compared to its competitors. The asset utilization ratios (Figure 17), though in terms of value, P&G and Nestle have a higher asset base, Unilever is able to utilize its assets better, suggesting much efficient use of the available resources and generating higher revenue per unit invested. A better asset turnover positively affects the ROE, due to which the ROE of Unilever is higher than its competitors.
Figure 17: Asset Utilization Ratio
0
0.1
0.2
0.3
0.4
0.5
2009 2010 2011 2012 2013
Net profit margin
0
0.2
0.4
2009 2010 2011 2012 2013
ROA
Unilever P&G Nestle 0
0.1
0.2
0.3
0.4
0.5
0.6
2009 2010 2011 2012 2013
ROE
0
0.2
0.4
0.6
0.8
1
1.2
2009 2010 2011 2012 2013
Asset Turnover
0
1
2
3
4
5
6
7
2009 2010 2011 2012 2013
PPE Turnover
Unilever
P&G
Nestle

BEAM048 008016
15
5.2 Solvency Ratios and Liquidity Ratio Figure 18: Solvency and Liquidity ratio
Unilever displays a high debt proportion against its industry peers. This position though advisable as debt is cheaper than equity, may not be healthy as its interest coverage capacity is lower than its competitors. Also, shareholder interests may be compromised to meet debt liabilities. Considering a high debt structure, it should be able to have higher interest coverage. But since the firm’s interest coverage is consistently higher than 10, it does not give any sign of bankruptcy. If the unemployment rate fell below 6.5%, Federal reserve (UK) plan to increase interest rates which could affect the ability of the firm to pay its interest as it follows a fixed and floating debt rate. In 2013, a 1% rise in interest rate would have increased the finance cost by €7M, due to which the net profit would be relatively reduce. The cash cycle of P&G has been consistently higher than its
peers, suggesting a weaker position while Nestle is experiencing a favourable position with a negative cash cycle while Unilever’s cash cycle is not very high which could be due to different business models. By observing figure 19 it can be observed that in the recent years the growth rate of the companies has been extremely fluctuating. Though Unilever’s growth rates were higher than its peers until 2012, a sudden decline has been observed in 2013 along with a decline in the COGS growth rate. Considering about 56% of the annual revenue is from the emerging markets where the wages are generally lower than the developed markets, the price sensitivity of customers to the premium Unilever brands would be high. It would have to consider such trends in future as it aims to sell about 75% of its products in emerging markets.
Figure 19: Growth Rate
0
0.5
1
1.5
2009 2010 2011 2012 2013
Debt to Equity Ratio
0
20
40
2009 2010 2011 2012 2013
Interest Coverage
Unilever P&G Nestle -‐40
-‐20
0
20
40
2009 2010 2011 2012 2013
Cash Cycle
-‐0.2
-‐0.1
0
0.1
0.2
2009
2010
2011
2012
2013
Sales g
rowth ra
te (%
)
Sales growth
-‐0.2
-‐0.1
0
0.1
0.2
0.3
2009
2010
2011
2012
2013
COGS growth
Unilever
P&G
Nestle

BEAM048 008016
16
6. Valuation Valuation Analysis Unilever is valued using the Discounted Dividend, Free Cash Flow of the Firm and Residual Income models. Considering the current market price, a HOLD recommendation is suggested, as there is a less than 2% difference between the suggested valuation and the current price.
It should be noted that,
• According to the NBER, a business cycle is about 5 years due to which this valuation relies on a 5-year moving average, along with prospective possible changes in order to consider future prospects.
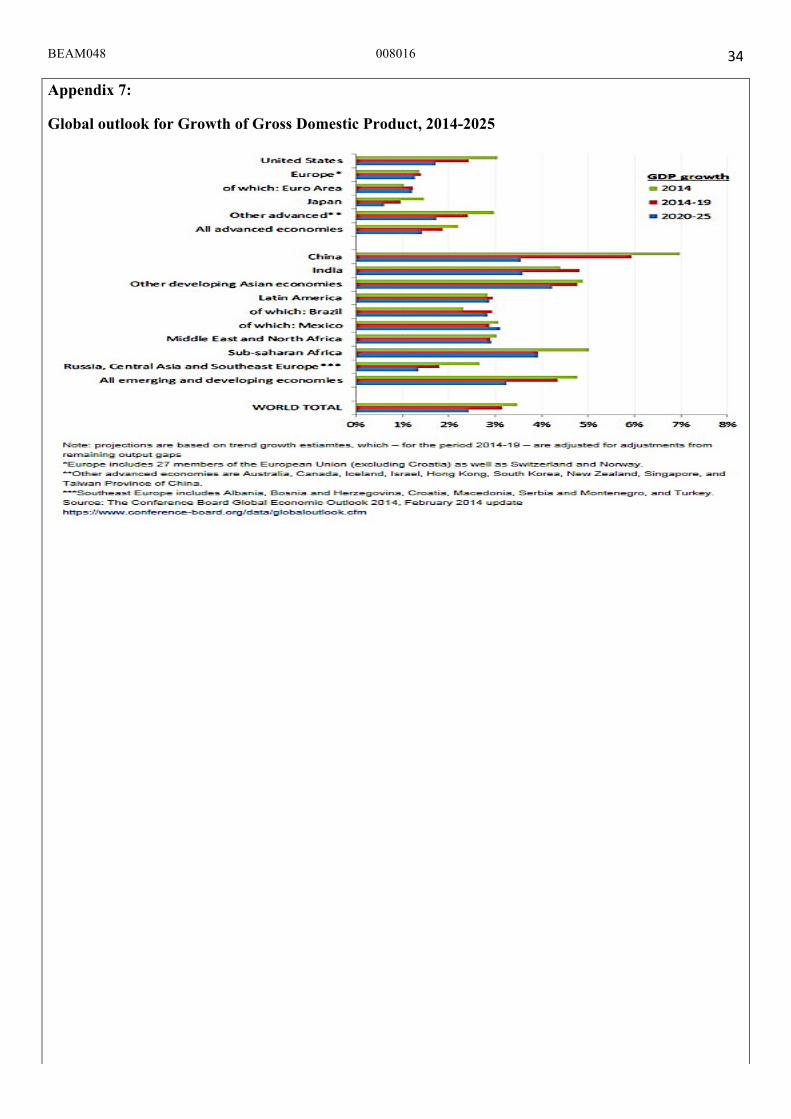
• The sales growth rate relies on the expected GDP of the emerging markets as Unilever aims to shift its focus on the emerging markets due to which this GDP will affect the growth of Unilever (Appendix 7).
• The world GDP is expected to grow at about 2.5% after 2020 (Appendix 7). As the growth may decline in perpetuity, 2% terminal growth rate is considered, though the firm will achieve this rate gradually and not immediately from 2020. Table 4: Equity Value (As on 25th April, 2014)
Valuation method
Equity Value
Indicative valuation
Target range
DDM 29.59 30.5 29.6- 32.2 RI 32.21
FCFF 29.72 Note: The target value is calculated by using equally weighted average to the three valuation methods.
6.1 Dividend Discount Model (DDM) and Residual Income Model (RI) DDM uses the estimated payout ratio of the firm while the RI model uses the income available after all liabilities and distribution of dividends. In order to incorporate the affects of the UK and Netherlands market, average cost of equity has been considered.
The key assumptions:
• Risk free rate of 3.36% (20 Year British Gilt) for Unilever PLC and 2.395% (20 Year Netherlands Government Bond) for Unilever NV is considered.
• Market premium is calculated by using the 20 years daily stock prices of FTSE 100 (5.13%) and AEX Index (6.95%) for the UK and Netherlands market respectively. This varies slightly from the DMS (2011) research, which suggests a market premium of 4.2% in Netherlands and 4.3% in UK as the paper considers 111 years while my analysis considers 20 years.
• Beta is calculated using the 20 years simple return of the stocks against the respective markets using the regression tool (Appendix 6).
• The adjusted beta is calculated to consider future volatility (Appendix 5).
• Cost of equity is calculated using the CAPM model whose average is used to value the firm (Appendix 5).
• An average cost of equity is used to calculate the equity charge.
• EPS of the firm has been extremely volatile. Considering the positive actions taken by the firm in terms of sustainability and growing market may help increase the stock price and dividends in the long run due to which 10% EPS growth rate has been considered.
• Payout ratio is 54.8% based on historical average. Since dividend payments are sticky, the firm may aim to retain the similar ratio in future.

BEAM048 008016
17
Table 5: DDM valuation for Unilever Unilever (€) 2014 2015 2016 2017 2018 2019 2020 Terminal
EPS 2.04 2.24 2.47 2.71 2.98 3.28 3.61 DPS 1.11 1.22 1.34 1.48 1.62 1.79 1.96 36.09 Year 1 2 3 4 5 6 7 PV factor 0.93 0.87 0.81 0.75 0.70 0.65 0.61 PV of DPS 1.03 1.06 1.08 1.11 1.13 1.16 1.19 21.84 Value of the share 29.594 Perpetuity growth rate 2.00% cost of equity 7.44% EPS Growth rate 10.00% Payout Ratio 54.38%
Table 6: Sensitivity Analysis of Unilever (DDM Valuation)
29.594 (€) 1.00% 1.25% 1.50% 1.75% 2.00% 2.25% 2.50% 2.75% 3.00%
6.0% 34.32 35.70 37.23 38.93 40.85 43.03 45.52 48.39 51.74 6.5% 31.02 32.12 33.32 34.65 36.13 37.78 39.64 41.74 44.15 7.0% 28.27 29.16 30.13 31.19 32.35 33.64 35.07 36.67 38.47 7.5% 25.95 26.68 27.47 28.33 29.26 30.29 31.42 32.66 34.05 8.0% 23.97 24.57 25.23 25.93 26.69 27.52 28.43 29.42 30.51 8.5% 22.25 22.76 23.30 23.89 24.52 25.21 25.95 26.75 27.63 9.0% 20.75 21.18 21.64 22.14 22.66 23.23 23.85 24.51 25.22 9.5% 19.42 19.80 20.19 20.61 21.06 21.53 22.05 22.60 23.19
Table 7: Residual Income Model Unilever (€) 2014 2015 2016 2017 2018 2019 2020 Terminal Equity 15111 15693 16478 17086 17843 18790 19264 Equity charge 1125 1168 1226 1271 1328 1398 1434 Net income 5088 5225 5341 5567 5812 6198 6308 Residual income 3963 4057 4115 4295 4484 4799 4874 89571 Year 1 2 3 4 5 6 7 Discount factor 0.93 0.87 0.81 0.75 0.70 0.65 0.61 PV of Residual Income 3688.91 3514.6 3317.9 3223.2 3132.1 3120 2949.1 54194.93 Total PV of Residual Income 77140.695 Book Value 14344 Value 91484.695 Shares Outstanding 2840 Value per share 32.2129 Cost of Equity 7.44% Terminal Growth Rate 2%
Table 8: Sensitivity Analysis of Unilever (RI Model)
32.21 1% 1.25% 1.50% 1.75% 2.00% 2.25% 2.50% 2.75%
4.0% 64.86 69.35 74.74 81.32 89.56 100.14 114.25 134.00 5.0% 48.17 50.40 52.95 55.89 59.32 63.37 68.23 74.18 6.0% 38.18 39.45 40.86 42.44 44.21 46.22 48.52 51.17 7.0% 31.53 32.32 33.17 34.12 35.15 36.30 37.57 38.99 8.0% 26.79 27.31 27.86 28.47 29.12 29.83 30.60 31.45 9.0% 23.24 23.60 23.98 24.38 24.82 25.28 25.78 26.33
10.0% 20.49 20.74 21.01 21.29 21.59 21.91 22.25 22.62

BEAM048 008016
18
6.2 Free cash flow of the firm model (FCFF)
Table 9: Free cash flow of the firm model
Note: See appendix 8 for calculation of free cash flow and Net debt. Table 10: Sensitivity Analysis of Unilever (RI Model)
29.72 1% 1.25% 1.50% 1.75% 2% 2.25% 2.50% 2.75%
4.0% 46.04 49.71 54.11 59.49 66.22 74.87 86.41 102.56 5.0% 33.66 35.55 37.71 40.20 43.10 46.53 50.65 55.69 6.0% 26.24 27.36 28.60 29.99 31.54 33.31 35.33 37.66 7.0% 21.30 22.02 22.81 23.67 24.61 25.66 26.82 28.12 8.0% 17.78 18.27 18.80 19.37 19.99 20.67 21.40 22.21 9.0% 15.14 15.49 15.86 16.26 16.69 17.15 17.65 18.19
10.0% 13.08 13.34 13.62 13.91 14.22 14.55 14.90 15.28
The FCFF model values the firm based on the available cash flow and is discounted at the WACC.
Assumptions:
• The FCFF is calculated based on estimated future scenarios and historical trends (Appendix 8) that would in turn affect the residual income.
• An average WACC of the Unilever PLC and Unilever NV have been used (Appendix 5)
The sensitivity table of the three models suggests the possible variation in the equity value with the fluctuation in the terminal growth rate and cost of equity or WACC.
Considering the equalization agreement between Unilever NV and Unilever PLC, investors could invest in Unilever PLC based on the indicative valuation of Unilever NV by using appropriate exchange rates, as the calculations includes the affects of the risk in the UK market as well.
DCF Valuation 2014 2015 2016 2017 2018 2019 2020 Terminal FCF 4394 3514 3746 3828 4191 4525 4527 107210 Year 1 2 3 4 5 6 7 Discount factor 0.94 0.89 0.83 0.79 0.74 0.70 0.66 PV of FCF 4137 3115 3125 3007 3099 3150 2967 70264 Sum of PV of FCF 92863 Net debt -8456 Value of equity 84407 Shares outstanding 2840 Value per share (€) 29.72 WACC 6.22% Terminal Growth rate 2.00%

BEAM048 008016
19
6.3 Relative Valuation
6.3.1 Price to Earnings (PE) Ratio
The Price to earnings ratio is calculated dividing the last annual share price by the EPS per share (Appendix 9). Unilever’s PE Ratio is compared against P&G and Nestle, as they are the strongest competitors to Unilever.
Table 11: PE ratio 2009 2010 2011 2012 2013 Unilever 17.4 14.2 16.2 16.9 15.8 P&G 13.5 14.9 16.2 17.8 20.2 Nestle 17.2 5.4 18.2 18.6 20.8
The PE ratio suggests the ‘X’ times the investors are willing to pay for the stock. It can be observed that the PE ratio of Unilever and its competitors have been more or less similar (disregarding the sudden decline in Nestle’s PE by selling Alcon Eye) in the past, but Unilever’s PE has seen a decline in last two years. A higher PE ratio suggests that the investors expect the stock to
grow faster than the stock with a lower PE ratio, which could be because Unilever has a large portion of debt as compared to the book equity value, which increases the financial risk. It should be noted that the PE fell when Unilever turned towards sustainability (2010), which could suggest investor sentiments about large future expenses. Considering this, the investors may be unwilling to invest enough in Unilever as compared to P&G and Nestle. In order to understand the position of Unilever further, its prospective PE ratio is calculated based on EPS (2014) and share price as on 25th April 2014 (14.77) which suggests a rise in negative investor sentiment over the change in the Unilever’s position. The PE ratio is observed to slightly increase when the indicative valuation stock price is considered at 14.96 proposing an improvement in shareholder sentiments in future, which is still lower than the PE of the competing firms. This position may hopefully overturn as Unilever’s ROE and asset turnover is higher than that of its competitor, due to which, in future the firm’s PE may rise. The fall in investor sentiment may also be due to improving economy due to which they may wish to invest faster growing firms than stable industries.
By observing the increasing EPS in the DDM model, it should be noted that, as the EPS of the firm increases, the PE ratio could eventually decrease. Thus the firm may have to work towards improving its stock price by using the available assets bringing it to a stronger competitive position.
Table 12: Price Sensitivity Analysis of PE ratio of Unilever 15.8 1.3 1.6 1.9 2.2 2.5 2.8 3.1 3.4 3.7 4.0 4.3 4.6
24 18.46 15.00 12.63 10.91 9.60 8.57 7.74 7.06 6.49 6.00 5.58 5.22 25 19.23 15.63 13.16 11.36 10.00 8.93 8.06 7.35 6.76 6.25 5.81 5.43 26 20.00 16.25 13.68 11.82 10.40 9.29 8.39 7.65 7.03 6.50 6.05 5.65 27 20.77 16.88 14.21 12.27 10.80 9.64 8.71 7.94 7.30 6.75 6.28 5.87 28 21.54 17.50 14.74 12.73 11.20 10.00 9.03 8.24 7.57 7.00 6.51 6.09 29 22.31 18.13 15.26 13.18 11.60 10.36 9.35 8.53 7.84 7.25 6.74 6.30 30 23.08 18.75 15.79 13.64 12.00 10.71 9.68 8.82 8.11 7.50 6.98 6.52 31 23.85 19.38 16.32 14.09 12.40 11.07 10.00 9.12 8.38 7.75 7.21 6.74 32 24.62 20.00 16.84 14.55 12.80 11.43 10.32 9.41 8.65 8.00 7.44 6.96 33 25.38 20.63 17.37 15.00 13.20 11.79 10.65 9.71 8.92 8.25 7.67 7.17 34 26.15 21.25 17.89 15.45 13.60 12.14 10.97 10.00 9.19 8.50 7.91 7.39 35 26.92 21.88 18.42 15.91 14.00 12.50 11.29 10.29 9.46 8.75 8.14 7.61
0.0
5.0
10.0
15.0
20.0
25.0
2009 2010 2011 2012 2013
Figure 20: PE Ratio
Unilever Procter and Gamble Nestle

BEAM048 008016
20
6.3.2 Altman Z-score The Altman Z-score suggests the possibility of a firm to go bankrupt in the near future for the competing firms. Table 13: Altman Z-score
2009 2010 2011 2012 2013 Unilever 3.21 3.22 2.85 3.26 3.28 P&G 2.52 2.79 2.67 2.74 2.98 Nestle 3.27 3.89 3.12 3.03 3.50
Theoretically, an Altman Z-score of above 2.99 suggests low probability of bankruptcy, while an Altman Z-score of below 1.8 suggests a high probability of bankruptcy. Considering the model, Unilever showcases a safe position, which may support investor interest and help increase share price, but it would still have to strongly compete with Nestle whose score is higher.

7. Conclusions and Recommendation Relatively, by using the DCF, DDM and RI model, a similar stock price is estimated, according to which Unilever is fairly priced and must be held. In case of fluctuation in any of the assumption, such as rise in costs due to inflation or change in bank contracts, or a fall in growth rate, the value of Unilever would have to be reanalyzed in order to achieve a significant value.
Though the valuation model suggests that Unilever is fairly priced, its falling P/E ratio is of concern as this could strongly affect its liquidity as investors may choose to invest in competitor stocks. Also, a payout ratio of about 54% in the long run may be difficult to sustain, since the firm may have to let go positive NPV projects, which could harm the long-run profitability of the firm in order to sustain the payout ratio. As Unilever is
now aiming to strengthen its position in the emerging markets, positive projects could improve the profitability that may ultimately increase stock price and suggest a stronger position. Unilever may have to work on increasing capital gains and use cash/equity for profitable acquisitions and building supply-chain network to improve further accessibility. Also, it would have to improve its interest coverage capacity since it does not plan to reduce the debt proportion in the near future. The rising interest rates could further worsen the situation.
The sector took a defensive position during rough times, but as the economy prospers, it may not be the first choice for many investors. By investing in innovation, the firm might be able to capture more value than otherwise expected.

BEAM048 008016
22
Formulae
• 𝑁𝑒𝑡 𝑝𝑟𝑜𝑓𝑖𝑡 𝑚𝑎𝑟𝑔𝑖𝑛 = !"# !"#$%&!"#"$%"
• 𝐴𝑠𝑠𝑒𝑡 𝑡𝑢𝑟𝑛𝑜𝑣𝑒𝑟 = !"#"$%" (!)!"#$% !""#$" (!!!)
• 𝑅𝑒𝑡𝑢𝑟𝑛 𝑜𝑛 𝐴𝑠𝑠𝑒𝑡 = !"# !"#$%& !"#$%&!""#$ !"#$%&'#
• 𝐿𝑒𝑣𝑒𝑟𝑎𝑔𝑒 = !"#$% !""#$"!!!"#!!"#$% !"#$%&
• 𝑅𝑒𝑡𝑢𝑟𝑛 𝑜𝑛 𝑒𝑞𝑢𝑖𝑡𝑦 = 𝑟𝑒𝑡𝑢𝑟𝑛 𝑜𝑛 𝑎𝑠𝑠𝑒𝑡 ∗𝑙𝑒𝑣𝑒𝑟𝑎𝑔𝑒
• 𝑁𝑢𝑚𝑏𝑒𝑟 𝑜𝑓 𝑑𝑎𝑦𝑠 𝑟𝑒𝑐𝑒𝑖𝑣𝑎𝑏𝑙𝑒 = !"#"$%&'(")
!"#"$%"∗ 365
• 𝑁𝑢𝑚𝑏𝑒𝑟 𝑜𝑓 𝑑𝑎𝑦𝑠 𝑃𝑎𝑦𝑎𝑏𝑙𝑒 = !"#"$%&'
!"#$ !" !""#$ !"#$∗
365
• 𝑁𝑢𝑚𝑏𝑒𝑟 𝑜𝑓 𝑑𝑎𝑦𝑠 𝑖𝑛𝑣𝑒𝑛𝑡𝑜𝑟𝑦 = !"#$"%&'(!"#$ !" !""# !"#$
∗365
• 𝐶𝑎𝑠ℎ 𝑐𝑜𝑛𝑣𝑒𝑟𝑠𝑖𝑜𝑛 𝑐𝑦𝑐𝑙𝑒 =
𝑁𝑢𝑚𝑏𝑒𝑟 𝑜𝑓 𝑑𝑎𝑦𝑠 𝑟𝑒𝑐𝑒𝑖𝑣𝑎𝑏𝑙𝑒 +𝑁𝑢𝑚𝑏𝑒𝑟 𝑜𝑓 𝑑𝑎𝑦𝑠 𝑖𝑛𝑣𝑒𝑛𝑡𝑜𝑟𝑦 −𝑁𝑢𝑚𝑏𝑒𝑟 𝑜𝑓 𝑑𝑎𝑦𝑠 𝑝𝑎𝑦𝑎𝑏𝑙𝑒
• 𝑃𝑙𝑎𝑛𝑡, 𝑝𝑟𝑜𝑝𝑒𝑟𝑡𝑦 𝑎𝑛𝑑 𝑒𝑞𝑢𝑖𝑝𝑚𝑒𝑛𝑡 𝑃𝑃𝐸 𝑡𝑢𝑟𝑛𝑜𝑣𝑒𝑟 =
!"#"$%! (!)!"# !!" (!!!)
• 𝐶𝑢𝑟𝑟𝑒𝑛𝑡 𝑟𝑎𝑡𝑖𝑜 = !"##$%& !""#$!"##$%& !"#$"!%"&'
• 𝑄𝑢𝑖𝑐𝑘 𝑅𝑎𝑡𝑖𝑜 = (!"#!!!!!"# !"#$ !"#$%&'$"&%)!"##$%& !"#$"!"%"&'
• 𝐶𝑎𝑠ℎ 𝑟𝑎𝑡𝑖𝑜 = !"#!!"##$%& !"#$"!"%"&'
• 𝐷𝑒𝑏𝑡 𝐸𝑞𝑢𝑖𝑡𝑦 𝑅𝑎𝑡𝑖𝑜 =(!"#!!"##$%& !"#$"!%"&'!!"##$%& !"#$"!%"&')
!"##$%& !""#$"
• 𝐼𝑛𝑡𝑒𝑟𝑒𝑠𝑡 𝑐𝑜𝑣𝑒𝑟𝑎𝑔𝑒 𝑅𝑎𝑡𝑖𝑜 = !"#$%&'() !"#$%&
!"#$%$&# !"#!$%!
• 𝑂𝑝𝑒𝑟𝑎𝑡𝑖𝑛𝑔 𝑝𝑟𝑜𝑓𝑖𝑡 𝑚𝑎𝑟𝑔𝑖𝑛 = !"#$%&'() !"#$%&
!"#"$%"
• 𝐶𝑜𝑠𝑡 𝑜𝑓 𝑔𝑜𝑜𝑑𝑠 𝑠𝑜𝑙𝑑 𝑔𝑟𝑜𝑤𝑡ℎ 𝑟𝑎𝑡𝑒 =
!"#$ !" !""#$ !"#$ !!"#$ !" !""#$ !"#$ !!!
− 1
• 𝑆𝑎𝑙𝑒𝑠 𝑔𝑟𝑜𝑤𝑡ℎ 𝑟𝑎𝑡𝑒 = !"#$! !!"#$! !!!
− 1
• 𝑊𝐴𝐶𝐶 = 𝐵𝑅! 1 − 𝑡 + 𝑆𝑅! B= Debt
Rb= Cost of debt T= Corporate Tax rate
S= Equity Rs= Cost of equity
• 𝐶𝑜𝑠𝑡 𝑜𝑓 𝐸𝑞𝑢𝑖𝑡𝑦 𝐶𝐴𝑃𝑀 = 𝑟! + 𝛽(𝑟! − 𝑟!) rf= risk free rate
β= beta rm= Market return
• 𝐴𝑙𝑡𝑚𝑎𝑛 𝑍 − 𝑠𝑐𝑜𝑟𝑒 (𝑀𝑎𝑛𝑢𝑓𝑎𝑐𝑡𝑢𝑟𝑖𝑛𝑔 𝑓𝑖𝑟𝑚𝑠) =
1.2𝐴 + 1.4𝐵 + 3.3𝐶 + 0.6𝐷 + 0.99𝐸
𝐴 =𝑤𝑜𝑟𝑘𝑖𝑛𝑔 𝑐𝑎𝑝𝑖𝑡𝑎𝑙𝑇𝑜𝑡𝑎𝑙 𝑎𝑠𝑠𝑒𝑡𝑠
𝐵 =𝑟𝑒𝑡𝑎𝑖𝑛𝑒𝑑 𝑒𝑎𝑟𝑛𝑖𝑛𝑔𝑠
𝑡𝑜𝑡𝑎𝑙 𝑎𝑠𝑠𝑒𝑡𝑠
𝐶 =𝐸𝑎𝑟𝑛𝑖𝑛𝑔𝑠 𝑏𝑒𝑓𝑜𝑟𝑒 𝑖𝑛𝑡𝑒𝑟𝑒𝑠𝑡 𝑎𝑛𝑑 𝑡𝑎𝑥
𝑎𝑠𝑠𝑒𝑡𝑠
𝐷 =𝑀𝑎𝑟𝑘𝑒𝑡 𝑣𝑎𝑙𝑢𝑒 𝑜𝑓 𝑒𝑞𝑢𝑖𝑡𝑦
𝑡𝑜𝑡𝑎𝑙 𝑙𝑖𝑎𝑏𝑖𝑙𝑡𝑖𝑒𝑠
𝐸 =𝑆𝑎𝑙𝑒𝑠
𝑇𝑜𝑡𝑎𝑙 𝑎𝑠𝑠𝑒𝑡𝑠
Altman Z-score table Score Zone
Z > 2.99 Safe Zone 1.8 < Z < 2.99 Grey Zone Z < 1.8 Distress Zone
• 𝑃𝑟𝑖𝑐𝑒 𝐸𝑎𝑛𝑖𝑛𝑔 𝑟𝑎𝑡𝑖𝑜 =
!"#$ !"#$%&' !!!"#$% !"#$% (!""#$%)!"#$%$&'
• 𝐴𝑑𝑗𝑢𝑠𝑡𝑒𝑑 𝑏𝑒𝑡𝑎 = 0.33 + (0.67 ∗ 𝑏𝑒𝑡𝑎)
BEAM048 008016
23
Bibliography
• Agarwal, S. 2013. HUL increases prices of soaps, toothpaste, skincare products. [online] Available at: http://www.livemint.com/Industry/ZJX8r5zQUSpzi4BhtAEAXL/HUL-increases-prices-of-soaps-toothpaste-skincare-products.html?ref=dd [Accessed: 18 Feb 2014].
• Conroy, P. and Nanda, R. 2013. The 2013 American Pantry Study. [report] Deloitte, p. 8. • Convenience Store Decisions. 2013. Rising Food Prices Impacting Grocery Choices - Convenience Store
Decisions. [online] Available at: http://www.csdecisions.com/2013/10/08/rising-food-prices-impacting-grocery-choices/ [Accessed: 20 Feb 2014].
• Corporatewatch.org. n.d. Unilever : Overview. [online] Available at: http://www.corporatewatch.org/?lid=257 [Accessed: 12 Feb 2014].
• Datta, D. 2013. FMCG will perform in bad times. [online] Available at: http://www.business-standard.com/article/pf/fmcg-will-perform-in-bad-times-113110900796_1.html [Accessed: 12 Feb 2014].
• Dimson, E., Marsh, P. and Staunton, M., 2011. Equity Premia Around the World. [online] Papers.ssrn.com. Available at: <http://papers.ssrn.com/sol3/papers.cfm?abstract_id=1940165> [Accessed 19 Apr. 2014].
• Earnings rise slower than inflation. 2014. [online] BBC News. Available at: <http://www.bbc.co.uk/news/business-25347403> [Accessed 19 Apr. 2014].
• EY - FMCG companies need to drive margins as economy turns. 2014. [online] Ey.com. Available at: <http://www.ey.com/US/en/Newsroom/News-releases/News-FMCG-companies-need-to-drive-margins-as-economy-turns> [Accessed 19 Apr. 2014].
• EY - Unlocking margins in consumer products. 2014. [online] Ey.com. Available at: <http://www.ey.com/GL/en/Industries/Consumer-Products/EY-Unlocking-margins-in-consumer-products> [Accessed 19 Apr. 2014].
• Global Consumer Confidence Increases One Point to 92 in Q3 2012 | Nielsen. 2012. [online] Nielsen.com. Available at: <http://www.nielsen.com/us/en/press-room/2012/global-consumer-confidence-increases-one-point-to-92-in-q3-2012.html> [Accessed 19 Apr. 2014].
• Global Economic Outlook | The Conference Board. 2014. [online] Conference-board.org. Available at: <https://www.conference-board.org/data/globaloutlook.cfm> [Accessed 19 Apr. 2014].
• Herbert, R. 2013. Key Facts 2013. [online] Available at: http://keyfacts2013.europanel.com/#page-3 [Accessed: 20 Feb 2014].
• Hoch, S. and Banerji, S. 1993. When Do Private Labels Succeed? | MIT Sloan Management Review. [online] Available at: http://sloanreview.mit.edu/article/when-do-private-labels-succeed/ [Accessed: 22 Feb 2014].
• Hoch, S. and Banerji, S., 1993. When Do Private Labels Succeed? | MIT Sloan Management Review. [online] MIT Sloan Management Review. Available at: <http://sloanreview.mit.edu/article/when-do-private-labels-succeed/> [Accessed 19 Apr. 2014].
• Iriworldwide.com. 2013a. IRI Introduces NutriLink Segmentation to Provide Key Insights Into Consumers’ Attitudes Toward Health, Diet and Nutrition - IRI. [online] Available at: http://www.iriworldwide.com/NewsEvents/PressReleases/ItemID/1832/View/Details.aspx [Accessed: 18 Feb 2014].
• Iriworldwide.com. 2013b. IRI Debuts SilverLink Segmentation to Provide Insight Into the Attitudes and Behaviors of the Aging Population - IRI. [online] Available at: http://www.iriworldwide.com/NewsEvents/PressReleases/ItemID/1833/View/Details.aspx [Accessed: 18 Feb 2014].
• Iriworldwide.com. 2013c. IRI MarketPulse Survey Finds Consumers Settling into "New Normal" - IRI. [online] Available at: http://www.iriworldwide.com/NewsEvents/PressReleases/ItemID/1760/View/Details.aspx [Accessed: 20 Feb 2014].
• Is the world economy suffering from 'high-priced fuel syndrome'?. 2012. [online] The Christian Science Monitor. Available at: <http://www.csmonitor.com/Environment/Energy-Voices/2012/0927/Is-the-world-economy-suffering-from-high-priced-fuel-syndrome/(page)/4> [Accessed 19 Apr. 2014].
• Kent, M. 2012. Five mega-trends shaping customers. [online] Available at: http://www.bbc.co.uk/news/business-18503627 [Accessed: 20 Feb 2014].
• Kharas, H., 2010. The emerging middle class in developing countries. 2nd ed. [ebook] OECD Development centre, p.28. Available at: <http://www.oecd.org/development/pgd/44457738.pdf> [Accessed 19 Apr. 2014].
• Maiti, M. 2013. FMCG firms mull 5% price hike to ease pressure of rising input costs. [online] Available at: http://www.mydigitalfc.com/news/fmcg-firms-mull-5-price-hike-ease-pressure-rising-input-costs-440 [Accessed: 18 Feb 2014].

BEAM048 008016
24
• Nielsen.com. 2013. Nielsen: 85% of Global Online Respondents Say Rising Food Prices Will Impact Their Grocery Choices. [online] Available at: http://www.nielsen.com/us/en/press-room/2013/nielsen-85-of-global-online-respondents-say-rising-food-prices.html [Accessed: 18 Feb 2014].
• Pinto, V. 2013. FMCG firms effect steep price rises in December. [online] Available at: http://www.business-standard.com/article/companies/fmcg-firms-effect-steep-price-rises-in-december-113011500088_1.html [Accessed: 18 Feb 2014].
• Private Label – Where Does It Work, W., 2013. Private Label – Where Does It Work, Where Will It Work in Future?. [online] Euromonitor.com. Available at: <http://www.euromonitor.com/private-label-where-does-it-work-where-will-it-work-in-future-/report> [Accessed 19 Apr. 2014].
• PwC. 2013. Consumer packaged goods companies and retailers shift focus to new rules of consumer engagement, says 2013 Grocery Manufacturers Association-PwC US Report. [online] Available at: http://www.pwc.com/us/en/press-releases/2013/consumer-packaged-goods-companies.jhtml [Accessed: 18 Feb 2014].
• PwC. 2014. Retail and consumer. [online] Available at: http://www.pwc.co.uk/retail-consumer/index.jhtml [Accessed: 18 Feb 2014].
• Shukla, A. 2011. Washing Machines, refrigerators to cost more as FMCG firms mull price hike - Business Today. [online] Available at: http://businesstoday.intoday.in/story/washing-machines-refrigerators-other-fmcg-goods-to-cost-more-as-firms-mull-hike/1/13071.html [Accessed: 18 Feb 2014].
• Somvanshi, K. 2013. Rising raw material cost will pinch FMCG companies. [online] Available at: http://articles.economictimes.indiatimes.com/2013-08-29/news/41582426_1_mentha-oil-oil-prices-palm-oil [Accessed: 18 Feb 2014].
• UN News Service Section. 2011. UN News - World population projected to reach 9.6 billion by 2050 – UN report. [online] Available at: http://www.un.org/apps/news/story.asp?NewsID=45165#.UwNqD3lLHwI [Accessed: 20 Feb 2014].
• Western Europe - What You Need to Know to Grow Your Presence in the Market. 2010. [online] Ats-sea.agr.gc.ca. Available at: <http://www.ats-sea.agr.gc.ca/eur/5782-eng.htm> [Accessed 19 Apr. 2014].
• Worldometers.info. 2014. World Population Clock: 7 Billion People (2014) - Worldometers. [online] Available at: http://www.worldometers.info/world-population/ [Accessed: 18 Feb 2014].
• Zeiss, G., 2013. Between the Poles: IEA projects that global energy demand will increase by a third by 2035, emissions by 20%. [online] Geospatial.blogs.com. Available at: <http://geospatial.blogs.com/geospatial/2013/11/iea-projects-that-global-energy-demand-will-increase-by-a-third-by-2035-emissions-by-20.html> [Accessed 19 Apr. 2014].

BEAM048 008016
25
Appendix Appendix 1:
Category: Personal Care. Source: Euromonitor International (2013)

BEAM048 008016
26
Appendix 2: Sector and Business Overview (SWOT Analysis)
.
STRENGHTS Strong brand portfolio
Experienced management team in the field of FMCG Strong retail network to reach the ultimate consumers
Economies of scale due to global synergy 20000 listed patents suggesting development in terms of
research
WEAKNESS Rising costs reflected in the price increase
Low profit margins Value increased due to rise in prices and not volume
Lack of 1-to-1 connection with the consumers Inefficent brand maagement as only 25 brands account for
73% of the global revenue
OPPORTUNITIES New emerging market such as China, India, Russia, and Africa which accounts for about 50% of Unilever sales
Accentuate growth in online selling Improvement in the overall economic conditions of the
market Change in consumption trends
THREAT Unfavourable exchange rates
Rising power of private labels Fluctuations in the Oil price
Recessionary mindsets of the consumers Eroding brand loyalty
Slow infrastructural growth in emerging markets
SWOT

BEAM048 008016
27
Appendix 3: Ratios Unilever
20
09
2010
2011
2012
2013
2014
2015
2016
2017
2018
2019
2020
Profitability Ratio
Sales growth (%) -1.73 11.15 4.98 10.45 -2.98 3.00 3.70 4.50 4.50 4.50 5.00 2.5 COGS growth (%) -3.57 12.02 21.15 9.93 -4.75 -0.94 5.46 6.45 3.93 3.92 4.69 2.93 Operating Profit Margin (%)
12.6 14.3 13.8 13.6 15.1 14 13.9 13.8 13.8 13.8 13.9 13.9
ROA (%) 10.1 12.4 11.2 10.2 11.4 11.2 10.9 10.7 10.6 10.8 11 10.6 ROE (%) 36.78 38.11 31.92 33.83 34.72 35.47 34.58 34.04 33.78 34.02 34.73 33.57 Net Profit Margin (%)
9.19 10.39 9.95 9.42 10.57 9.92 9.82 9.61 9.58 9.58 9.72 9.66
Asset turnover 1.102 1.196 1.129 1.080 1.079 1.127 1.106 1.115 1.109 1.128 1.127 1.096 Leverage 3.633 3.068 2.842 3.324 3.045 3.173 3.183 3.177 3.178 3.149 3.169 3.172
Efficiency Ratio
Days receivable 31.43 34.1 35.45 31.55 35.41 33.59 34.02 34.00 33.71 34.15 33.9 33.96 Days payable 149.2 161.9 143.4 138.7 146.5 147.5 147.2 144.6 144.8 146.1 146.0 145.8 Inventory days 63.46 68.22 60.13 52.74 49.14 58.38 57.47 55.55 54.60 54.99 56.18 55.75 PPE turnover 6.69 6.66 5.92 5.85 5.27 5.49 5.69 5.95 6.21 6.49 6.82 6.987
Liquidity Ratio
Current ratio 0.932 0.918 0.797 0.768 0.697 0.802 0.784 0.770 0.763 0.763 0.776 0.771 Quick ratio 0.312 0.211 0.275 0.181 0.175 0.231 0.217 0.218 0.204 0.209 0.216 0.213 Cash ratio 0.228 0.170 0.194 0.156 0.131 0.175 0.166 0.165 0.159 0.159 0.165 0.163 Cash conversion cycle
-54.3 -59.6 -47.8 -54.4 -61.9 -55.5 -55.7 -55.0 -56.5 -57.0 -56.0 -56.0
Debt /Equity ratio 2.03 1.80 2.28 2.01 2.14 2.15 2.14 2.14 2.12 2.14 2.14 2.14 Interest coverage 8.47 16.09 17.06 13.04 14.18 13.48 13.88 14.41 14.99 15.65 16.55 16.87
*The ratios from 2014-2020 are based on forecasted income statement and balance sheet.

BEAM048 008016
28
Procter and Gamble (P&G) 2009 2010 2011 2012 2013
Profitability Ratio
Sales growth -6.18% 2.93% 2.74% 3.18% 0.58% COGS growth -2.14% -1.99% 5.12% 6.35% 0.09% Operating Profit Margin 20.05% 20.30% 19.11% 15.88% 17.21% ROA 9.33% 9.45% 9.31% 7.77% 8.55% ROE 19.33% 20.18% 19.52% 15.90% 17.83% Net Profit Margin 17.52% 16.13% 14.71% 12.85% 13.44% Asset turnover 0.53 0.59 0.63 0.60 0.64 Leverage 2.07 2.137 2.1 2.05 2.09
Efficiency Ratio
Days receivable 27.775 24.668 28.240 26.468 28.223 Days payable 56.415 69.797 73.460 68.194 75.507 Inventory days 64.906 61.451 67.572 57.870 59.437 PPE turnover 3.716 4.056 4.215 3.930 4.130
Liquidity ratio
Current ratio 0.709 0.773 0.805 0.880 0.799 Quick ratio 0.155 0.119 0.101 0.178 0.198 Cash ratio 0.155 0.119 0.101 0.178 0.198 Cash conversion cycle 36.265 16.323 22.352 16.144 12.153 Debt /Equity ratio 1.132 1.092 1.040 1.075 1.037 Interest coverage 11.321 16.936 18.646 17.285 21.711
Nestle
2009 2010 2011 2012 2013
Profitability Ratio
Sales growth -2.43% -12.49% -4.82% 7.35% 2.72% COGS growth -5.00% 3.01% -1.45% 7.64% 1.29% Operating Profit Margin 15.6% 16.9% 15% 14.9% 14.1% ROA 9.8% 30.9% 8.5% 9.0% 8.0% ROE 20.54% 69.98% 15.33% 18.01% 16.42% Net Profit Margin 17.52% 16.13% 14.71% 12.85% 13.44% Asset turnover 0.947 0.794 0.750 0.788 0.734 Leverage 2.092 2.268 1.805 2.009 2.063
Efficiency Ratio
Days receivable 34.203 36.904 41.572 38.716 37.012 Days payable 109.440 102.648 112.361 112.397 121.932 Inventory days 64.944 64.604 76.553 68.689 63.591 PPE turnover 4.767 4.075 3.908 3.752 3.476
Liquidity ratio
Current ratio 1.105 1.294 0.946 0.881 0.913 Quick ratio 0.147 0.539 0.227 0.241 0.214 Cash ratio 0.076 0.267 0.140 0.148 0.195 Cash conversion cycle -10.293 -1.140 5.764 -4.992 -21.329 Debt /Equity ratio 1.171 0.793 0.983 1.036 0.900 Interest coverage 21.072 17.913 23.791 24.254 22.531

BEAM048 008016
29
Appendix 4: Forecasts and Common Size Analysis Income Statement by Value
€ Actual Forecast 2009 2010 2011 2012 2013 2014 2015 2016 2017 2018 2019 2020
Turnover 39823 44262 46467 51324 49797 51291 53189 55582 58083 60697 63732 65325
Cost of Goods sold -20580 -23054 -27930 -30703 -29245 -28971 -30554 -32525 -33804 -35128 -36776 -37855
Gross profit 19243 21208 18537 20621 20552 22320 22634 23057 24279 25569 26956 27470
Selling and administrative expenses
-14223 -14869 -12104 -13644 -13035 -15160 -15249 -15376 -16276 -17196 -18084 -18410
Operating profit 5020 6339 6433 6977 7517 7160 7385 7680 8003 8372 8872 9060
Net Finance costs -593 -394 -377 -535 -530 -480 -504 -619 -653 -706 -698 -737
Share of net profit of joint ventures and associates
115 111 113 105 113 126 122 126 129 137 147 149
Other income from non-current investments
374 76 76 -14 14 42 32 20 29 35 33 32
Profit before Taxation
4916 6132 6245 6533 7114 6849 7036 7207 7509 7838 8354 8504
Taxation -1257 -1534 -1622 -1697 -1851 -1761 -1811 -1865 -1942 -2026 -2156 -2196
Net profit 3659 4598 4623 4836 5263 5088 5225 5341 5567 5812 6198 6308
Income Statement by Common Size Analysis
% Actual Forecast 2009 2010 2011 2012 2013 2014 2015 2016 2017 2018 2019 2020
Turnover growth rate
11.15 4.98 10.45 -2.98 3.00 3.70 4.50 4.50 4.50 5.00 2.50
COGS/turnover -51.68 -52.09 -60.11 -59.82 -58.73 -56.48 -57.45 -58.52 -58.20 -57.88 -57.70 -57.95
Selling and administrative expenses/ gross profit
-70.11 -70.11 -65.30 -66.17 -67.92 -67.37 -66.69 -67.04 -67.26 -67.09 -67.02
Net finance costs/ operating costs
-11.81 -6.22 -5.86 -7.67 -7.05 -6.70 -6.82 -8.06 -8.16 -8.43 -7.87 -8.13
Share of net profit/ of joint ventures and associates /Turnover
2.29 1.75 1.76 1.50 1.50 1.76 1.66 1.64 1.61 1.63 1.66 1.64
Other income/ from non-current investments / Turnover
7.45 1.20 1.18 -0.20 0.19 0.59 0.44 0.25 0.37 0.41 0.37 0.35
Taxation/ profit before taxation
-25.57 -25.02 -25.97 -25.98 -26.02 -25.71 -25.74 -25.88 -25.87 -25.84 -25.81 -25.83

BEAM048 008016
30
Balance Sheet by Value
€ Actual Forecast 2009 2010 2011 2012 2013 2014 2015 2016 2017 2018 2019 2020
Goodwill 12464 13178 14896 14619 13917 15342 15762 16456 16912 17750 18803 19219
Intangible assets 4583 5100 7017 7099 6987 6770 7200 7748 7962 8305 8676 8947
Property plant and equipment
6644 7854 8774 9445 9344 9281 9775 10285 10704 11189 11706 12035
Pension asset for funded schemes in surplus
759 910 1003 672 991 966 1000 1025 1035 1139 1181 1206
Deferred tax assets 738 607 421 1113 1084 869 885 957 1095 1110 1121 1157
Financial assets 478 535 505 513 435 545 564 581 602 610
Other non-currents assets
1017 1034 632 536 563 864 804 748 780 852 929 923
Total Non-current Assets
26205 28683 33221 34019 33391 34606 35860 37765 39052 40925 43018 44098
Inventories 3578 4309 4601 4436 3937 4634 4810 4950 5057 5292 5661 5782
Trade and current receivables
3429 4135 4513 4436 4831 4720 4957 5178 5365 5678 5918 6077
Current tax assets 173 298 219 217 217 250 265 257 268 285 303 309
Cash 2642 2316 3484 2465 2285 2950 2965 3137 3062 3257 3519 3577
Other financial assets
972 550 1453 401 760 935 904 996 886 1016 1085 1096
Non-current assets held for sale
17 876 21 192 92 10 96 89 107 89 88 106
Total Current Assets 10811 12484 14291 12147 12122 13499 13998 14607 14745 15617 16574 16948
Total Assets 37016 41167 47512 46166 45513 48105 49858 52372 53797 56542 59593 61045
Financial liabilities -2279 -2276 -5840 -2656 -4010 -3761 -4071 -4533 -4225 -4670 -4858 -5017
Trade payables and other current liabilities
-8413 -10226 -10971 -11668 -11735 -11709 -12323 -12885 -13415 -14062 -14714 -15116
Current tax liabilities
-487 -639 -725 -1129 -1254 -918 -1012 -1108 -1208 -1248 -1252 -1306
Provisions -420 -408 -393 -361 -379 -440 -435 -443 -457 -488 -518 -525
Liabilities associated with non-current assets for sale
0 -57 0 -1 -4 -14 -18 -8 -10 -12 -14 -14
Total Current Liabilities
-11599 -13606 -17929 -15815 -17382 -16841 -17858 -18977 -19315 -20481 -21356 -21979
Net Current Assets -788 -1122 -3638 -3668 -5260 -3342 -3861 -4370 -4571 -4864 -4782 -5031
Financial liabilities due after one year
7692 7258 7878 7565 7491 8458 8470 8799 9064 9577 10150 10330
Non-current tax liabilities
107 184 258 100 145 177 192 194 179 201 216 220
Pensions and post retirement healthcare liabilities
3341 2980 4206 4331 2968 3957 4031 4307 4349 4430 4822 4923
Provisions 729 886 908 846 892 946 983 1010 1040 1104 1162 1189
Deferred tax liabilities
764 880 1125 1393 1524 1795 1755 1667 1809 1939 2053 2068
Other non-current liabilities
248 295 287 400 296 337 353 368 390 394 421 432
Total non-current liabilities
12881 12483 14662 14635 13316 15670 15784 16345 16831 17645 18824 19162
Shareholder's equity 12065 14485 14293 15159 14344 15111 15693 16478 17086 17843 18790 19264
Non-controlling interests
471 593 628 557 471 483 522 572 564 573 622 640
Total Equity 12536 15078 14921 15716 14815 15594 16215 17050 17650 18416 19412 19904
Liabilities and Equity
37016 41167 47512 46166 45513 48105 49858 52372 53797 56542 59593 61045

BEAM048 008016
31
Balance Sheet by Common Size Analysis
% Actual Forecast
2009
2010
2011
2012
2013
2014
2015
2016
2017
2018
2019
2020
Goodwill/ turnover 31.3 29.8 32.1 28.5 28.0 29.9 29.6 29.6 29.1 29.2 29.5 29.4
Intangible assets/turnover 11.5 11.5 15.1 13.8 14.0 13.2 13.5 13.9 13.7 13.7 13.6 13.7
PPE/ turnover 16.7 17.7 18.9 18.4 18.8 18.1 18.4 18.5 18.4 18.4 18.4 18.4
Pension asset for funded schemes in surplus/ turnover
1.91 2.06 2.16 1.31 1.99 1.88 1.88 1.84 1.78 1.88 1.85 1.85
Deferred tax assets/ turnover 1.85 1.37 0.91 2.17 2.18 1.70 1.66 1.72 1.89 1.83 1.76 1.77
Financial assets/ turnover 0.00 0.00 1.03 1.04 1.01 1.00 0.82 0.98 0.97 0.96 0.94 0.93
Other non-current assets/ turnover 2.55 2.34 1.36 1.04 1.13 1.68 1.51 1.35 1.34 1.40 1.46 1.41
Inventory/ turnover 8.98 9.74 9.90 8.64 7.91 9.03 9.04 8.91 8.71 8.72 8.88 8.85
Trade and other current receivable/ turnover 8.61 9.34 9.71 8.64 9.70 9.20 9.32 9.32 9.24 9.36 9.29 9.30
Current tax assets/ turnover 0.43 0.67 0.47 0.42 0.44 0.49 0.50 0.46 0.46 0.47 0.48 0.47
Cash and cash equivalents/ turnover 6.63 5.23 7.50 4.80 4.59 5.75 5.57 5.64 5.27 5.37 5.52 5.48
Other financial assets/ turnover 2.44 1.24 3.13 0.78 1.53 1.82 1.70 1.79 1.52 1.67 1.70 1.68
Non-current assets held for sale/ turnover 0.04 1.98 0.05 0.37 0.18 0.02 0.18 0.16 0.18 0.15 0.14 0.16
Financial liabilities/ turnover -5.72 -5.14 -12.6 -5.17 -8.05 -7.33 -7.65 -8.16 -7.27 -7.69 -7.62 -7.68
Trade payable and other liabilities/ turnover -21.1 -23.1 -23.6 -22.7 -23.6 -22.8 -23.2 -23.2 -23.1 -23.2 -23.1 -23.1
Current tax liabilities/ turnover -1.22 -1.44 -1.56 -2.20 -2.52 -1.79 -1.90 -1.99 -2.08 -2.06 -1.96 -2.00
Provision/ turnover -1.05 -0.92 -0.85 -0.70 -0.76 -0.86 -0.82 -0.80 -0.79 -0.80 -0.81 -0.80
Liabilities directly associated with non-current assets held for sale/ turnover
0.00 -0.13 0.00 0.00 -0.01 -0.03 -0.03 -0.01 -0.02 -0.02 -0.02 -0.02
Financial liabilities due after one year/ turnover 19.3 16.4 17.0 14.7 15.0 16.5 15.9 15.8 15.6 15.8 15.9 15.8
Non-current tax liabilities/ turnover 0.27 0.42 0.56 0.19 0.29 0.35 0.36 0.35 0.31 0.33 0.34 0.34
Pensions and post retirement healthcare liabilities/ turnover
8.39 6.73 9.05 8.44 5.96 7.71 7.58 7.75 7.49 7.30 7.57 7.54
Provisions/ turnover 1.83 2.00 1.95 1.65 1.79 1.85 1.85 1.82 1.79 1.82 1.82 1.82
Deferred tax liabilities/ turnover 1.92 1.99 2.42 2.71 3.06 3.50 3.30 3.00 3.11 3.19 3.22 3.17
Other non-current liabilities/ turnover 0.62 0.67 0.62 0.78 0.59 0.66 0.66 0.66 0.67 0.65 0.66 0.66
Non-controlling interests/ net profit 12.9 12.9 13.6 11.5 8.95 9.50 10.0 10.7 10.1 9.86 10.0 10.2
Pensions and similar provisions less payments/ net profit
-28.1 -10.3 -12.0 -7.63 -7.28 -9.28 -9.04 -8.31 -8.48 -8.78 -8.65 -8.55
Provision less payments/ net profit -7.05 1.57 0.19 -0.89 2.39 0.82 0.63 0.74 1.14 0.83 0.84 0.89
Elimination of profits on disposals / net profit 0.36 -10.4 -4.65 -4.88 -13.8 -6.66 -8.06 -7.61 -8.20 -8.86 -7.88 -8.12
Non-cash charge for share-based compensation/ net profit
5.33 3.13 2.27 3.16 4.33 3.65 3.31 3.34 3.56 3.64 3.50 3.47
Other adjustments/net profit 1.59 1.07 0.17 0.27 -0.29 0.56 0.36 0.22 0.22 0.21 0.31 0.26
Income tax paid/taxation 76.3 86.6 73.2 99.0 97.5 86.5 88.6 89.0 92.1 90.7 89.4 89.9
Net capital expenditure -34.4 -37.0 -42.7 -49.9 -38.5 -40.5 -41.7 -42.7 -42.7 -41.2 -41.8 -42.0
Net interest and preference dividend paid -3.68 -2.93 -2.82 -2.37 -2.87 -2.93 -2.78 -2.76 -2.74 -2.82 -2.81 -2.78

BEAM048 008016
32
Appendix 5: Calculating Cost of Equity and WACC
Cost of Equity Unilever NV Unilever PLC Market return 9.34% 8.49% Beta (Using regression) 0.606728868 0.674255109 Adjusted beta 0.736508342 0.781750923 Risk free rate 2.40% 3.36% Cost of equity 7.51% 7.37% Average Cost of Equity 7.44%
WACC Unilever NV Unilever PLC CAPM 7.51% 7.37% Proportion of Market Value of equity 66.14% 84% Cost of debt 7.05% 7.05% Proportion of debt 33.86% 16% Tax rate 26.02% 26.02% WACC 6.73% 5.71% Average WACC 6.22%

BEAM048 008016
33
Appendix 6: Regression for Beta a) Unilever NV
Regression Statistics
Multiple R 0.41911649 R Square 0.175658632
Adjusted R Square
0.175488384
Standard Error
0.019146207
Observations 4844 ANOVA df SS MS F Significance
F
Regression 1 0.378227126 0.378227126 1031.780195 2.1475E-205 Residual 4842 1.77496695 0.000366577 Total 4843 2.153194077 Coefficients Standard
Error t Stat P-value Lower 95% Upper 95% Lower 95.0% Upper 95.0%
Intercept 0.00001679 0.000275136 0.061007639 0.951355643 -0.000522606 0.000556177 -0.000522606 0.000556177 X Variable 1 0.60673 0.018888656 32.12133551 2.1475E-205 0.569698526 0.643759211 0.569698526 0.643759211
The data analysis is based on the simple returns of stock data since 1994-2013 of Unilever NV and Amsterdam Stock Exchange. b) Unilever PLC
Regression Statistics
Multiple R 0.509450913
R Square 0.259540233 Adjusted R Square
0.259385938
Standard Error
0.013645892
Observations 4801 ANOVA df SS MS F Significance
F
Regression 1 0.313226004 0.313226004 1682.108375 0 Residual 4799 0.893623511 0.00018621 Total 4800 1.206849515 Coefficients Standard
Error t Stat P-value Lower 95% Upper 95% Lower 95.0% Upper 95.0%
Intercept 0.000258556
0.000196978 1.312611977 0.189376501 -0.000127612 0.000644723 -0.000127612 0.000644723
X Variable 1 0.67426 0.016439828 41.01351455 0 0.64202551 0.706484707 0.64202551 0.706484707
The data analysis is based on the simple returns of stock data since 1994-2013 of Unilever PLC and FTSE100.
BEAM048 008016
34
Appendix 7: Global outlook for Growth of Gross Domestic Product, 2014-2025

BEAM048 008016
35
Appendix 8: Free cash Flow and Net Debt Forecasting
FCF and Net debt
Actual Forecast 2009 2010 2011 2012 2013 2014 2015 2016 2017 2018 2019 2020
Net Profit 3659 4598 4623 4836 5263 5088 5225 5398 5641 5909 6260 6388 Taxation 1257 1534 1622 1697 1851 1761 1811 1885 1968 2059 2178 2224 Other Income -489 -187 -189 -91 -127 -168 -155 -145 -158 -171 -180 -180 Net finance costs 593 394 377 535 530 480 504 542 553 575 613 629 Depreciation, amortization and impairment
1032 993 1029 1199 1151 1205 1219 1279 1347 1405 1476 1508
Changes in working capital
1701 169 -177 822 200 612 -200 -201 -236 -99 -44 -121
Pensions and similar provisions less payments
-1028 -472 -553 -369 -383 -472 -472 -448 -478 -519 -542 -546
Provision less payments
-258 72 9 -43 126 42 33 40 65 49 52 57
Elimination of (profits) on disposals
13 -476 -215 -236 -725 -339 -421 -411 -462 -524 -493 -519
Non-cash charge for share-based compensation
195 144 105 153 228 185 173 181 201 215 219 222
Other adjustments 58 49 8 13 -15 29 19 12 13 13 20 17 Operating income 6733 6818 6639 8516 8099 8421 7735 8131 8451 8913 9559 9678 Income tax paid -959 -1328 -1187 -1680 -1805 -1523 -1604 -1677 -1813 -1868 -1946 -2001 Net capital expenditure
-1258 -1701 -1974 -2413 -2027 -2060 -2180 -2303 -2406 -2435 -2614 -2683
Net interest and preference dividend paid
-444 -424 -403 -360 -411 -443 -437 -454 -468 -502 -527 -535
Free cash flow 4072 3365 3075 4063 3856 4394 3514 3697 3764 4108 4472 4458 Total Financial liabilities
9971 9534 13718 10221 11501 12219 12541 13332 13289 14247 15008 15347
Cash and equivalents 2642 2316 3484 2465 2285 2950 2965 3137 3062 3257 3519 3577 Financial assets 972 550 1453 401 760 935 904 996 886 1016 1085 1096 Net debt -6357 -6668 -8781 -7355 -8456 -8333 -8672 -9200 -9342 -9975 -10404 -10674
Appendix 9: Price to Earnings Ratio
Unilever 2009 2010 2011 2012 2013 2014 (25th April, 2014)
2014 Indicative Valuation
Market Price per share 22.75 23.3 26.57 28.835 29.275 30.1 30.5 EPS 1.30 1.64 1.64 1.71 1.85 2.04 2.04 PE Ratio 17.435 14.238 16.210 16.885 15.797 14.766 14.96
Procter and Gamble 2009 2010 2011 2012 2013
Market Price per share 60.63 64.33 66.71 67.89 81.41 EPS 4.49 4.32 4.12 3.82 4.04 PE Ratio 13.503 14.891 16.192 17.772 20.151
Nestle 2009 2010 2011 2012 2013
Market Price per share 50.2 54.75 54 59.6 65.3 EPS 2.92 10.16 2.97 3.21 3.14 PE Ratio 17.192 5.3888 18.182 18.567 20.796