indian securities market review
DESCRIPTION
National Stock Exchange Review in indian marketTRANSCRIPT


Indian Securities Market
Volume XI 2008
This publication reviewsthe developments in the securities market in India
Online: www.nseindia.com
A R
evie
w
NATIONAL STOCK EXCHANGE OF INDIA LIMITED

Copyright © 2008 by National Stock Exchange of India Ltd. (NSE)Exchange Plaza, Bandra Kurla ComplexBandra (East), Mumbai 400 051 INDIA
All rights reserved. No part of this publication may be produced, stored in a retrieval system or transmitted in any form by any means, electronic, mechanical, photocopying, recording or otherwise without the written permission of NSE, except as stated below. Single photocopies of single chapters may be made for private study or research. Illustrations and short extracts from the text of individual chapters may be copied provided that the source is acknowledged and NSE is notifi ed.
This publication reviews the developments in the Indian Securities Market up to June 2008. The views expressed herein do not necessarily refl ect those of NSE. NSE does not guarantee the accuracy of the data included in this publication and accepts no responsibility whatsoever for any consequence of their use.
Orders for this issue and the back issues may be sent to:
Corporate CommunicationNational Stock Exchange of India LimitedExchange Plaza, Bandra Kurla ComplexBandra (East), Mumbai 400 051 INDIA
Indian Securities MarketA Review

www.nseindia.com
Contents ISMRi
Chapter 1 Securities Market in India – An Overview ....................................................................................1
Introduction ...................................................................................................................................1
Market Segments ........................................................................................................................... 1
International Scenario .................................................................................................................... 2
Key strengths of the Indian securities markets ................................................................................4
Market Participants ........................................................................................................................ 4
Investors............................................................................................................................... 4
Issuers .................................................................................................................................5
Intermediaries ...................................................................................................................... 6
Regulators ............................................................................................................................ 6
Secondary Market .......................................................................................................................... 8
Corporate Securities ............................................................................................................. 8
Shareholding Pattern .......................................................................................................... 11
Government Securities ....................................................................................................... 11
Derivatives Market ............................................................................................................. 11
Recent initiatives and developments in Indian Securities Markets ................................................13
Initiatives in the pipeline ............................................................................................................. 17
Research in Securities Market ...................................................................................................... 17
Role of NSE in Indian Securities Market .......................................................................................17
Technology and Application Systems in NSE ...............................................................................19
Policy debates ............................................................................................................................. 23
Regulatory Impact Assessment (RIA) ...................................................................................23
Chapter 2 Primary Market .......................................................................................................................... 26
Introduction .................................................................................................................................26
Trends ......... ...............................................................................................................................26
Policy Developments ................................................................................................................... 27
Amendments to Clause 41 of Equity Listing Agreement ......................................................27
Amendment to Clause 49 of the Listing Agreement ............................................................27
Introduction of Applications Supported by Blocked Amount (ASBA) Process ......................28
Market Design ............................................................................................................................. 28
Eligibility Norms ............................................................................................................... 29
Exemption from Eligibility Norms .......................................................................................29
C O N T E N T S

www.nseindia.com
ContentsISMR ii
Credit Rating for Debt Instruments .....................................................................................30
IPO Grading ....................................................................................................................... 30
Pricing of Issues ................................................................................................................. 30
Price Band ........................................................................................................................ 30
Contribution of Promoters and lock-in ................................................................................31
Pre-Issue Obligations .......................................................................................................... 31
Post-Issue Obligations ....................................................................................................... 32
Book Building ................................................................................................................... 33
e-IPOs ...............................................................................................................................33
Credit Rating ..................................................................................................................... 33
Merchant Banking ............................................................................................................. 33
Demat issues ..................................................................................................................... 34
Private Placement .............................................................................................................. 34
Market Outcome ........................................................................................................................ 34
Public Issues ..................................................................................................................... 34
Euro Issues ........................................................................................................................ 37
Performance of IPOs ......................................................................................................... 37
Book Building through On-line IPO System ......................................................................40
Debt Issues ........................................................................................................................ 40
Private Placement of Debt ................................................................................................. 40
Corporate Debt ................................................................................................................. 44
Policy Debates ........................................................................................................................... 44
Rating of IPOs ................................................................................................................... 44
Indian Depository Receipts ............................................................................................... 45
Chapter 3 Collective Investment Vehicles ................................................................................................... 55
Introduction ................................................................................................................................55
Mutual Funds ............................................................................................................................. 55
Trends ........... ............................................................................................................................. 56
Policy Developments .................................................................................................................. 56
Investment by Mutual Funds in Overseas Securities ..........................................................56
Standard warning in Advertisements by Mutual Funds .......................................................56
Entry Load for Mutual Funds ............................................................................................. 57
Removal of Initial issue expenses ......................................................................................57
Investments in Art Funds, funds/schemes launched by companies or any entity formed for the purpose .................................................................................................................. 57

www.nseindia.com
Contents ISMRiii
Market Design ............................................................................................................................ 58
Structure of Mutual Funds ................................................................................................. 58
Types of MFs/Schemes ...................................................................................................... 59
Regulation of Funds .......................................................................................................... 60
Constitution of a Mutual Fund , Asset Management Company ...........................................60
Code of Conduct ............................................................................................................... 60
Schemes of Mutual Funds ................................................................................................ 61
Registration of Mutual Funds ............................................................................................. 61
Advertisements Code by MFs ............................................................................................ 61
Investment Borrowing And Restrictions .............................................................................62
Market Outcome ........................................................................................................................ 63
Resource Mobilisation ....................................................................................................... 63
Assets under Management ................................................................................................. 67
Index Funds ...................................................................................................................... 69
Exchange Traded Funds .................................................................................................... 70
Gold Exchange Traded Fund ............................................................................................. 71
Collective Investment Schemes ................................................................................................... 71
Guidelines under CIS Regulations .....................................................................................72
Venture Capital Funds ................................................................................................................ 73
Regulations for VCFs ......................................................................................................... 73
Investment Condition & Restrictions ..................................................................................73
Prohibition on Listing ........................................................................................................ 74
Policy debates ............................................................................................................................ 75
Unit holding pattern of mutual funds .................................................................................75
Chapter 4 Capital Market ........................................................................................................................... 76
Introduction ................................................................................................................................76
Trading Mechanism .................................................................................................................... 76
Trends ......... ...............................................................................................................................76
Policy Developments .................................................................................................................. 77
Short selling and securities lending and borrowing ............................................................77
Introduction of Direct Market Access facility .....................................................................77
Market Design ............................................................................................................................ 79
Stock Exchanges ................................................................................................................ 79
Membership ...................................................................................................................... 80
Listing of Securities ........................................................................................................... 81
www.nseindia.com
ContentsISMR iv
Internet trading .................................................................................................................. 82
Trading Regulations .......................................................................................................... 83
Circuit Breakers ................................................................................................................. 84
Demat Trading .................................................................................................................. 85
Charges for Services .......................................................................................................... 85
Institutional Trades ............................................................................................................ 86
Index Services ................................................................................................................... 86
NSE Indices ....................................................................................................................... 86
BSE Indices ....................................................................................................................... 88
NSE Sectoral Indices .......................................................................................................... 90
BSE Sectoral Indices .......................................................................................................... 91
Market Outcome ........................................................................................................................ 96
Turnover – Growth and Distribution .................................................................................96
World Traded Value ........................................................................................................ 102
Market Capitalisation - Growth and Distribution .............................................................103
Market Movements ......................................................................................................... 105
Volatility ......................................................................................................................... 106
Returns in Indian Market ................................................................................................. 108
Exchange Traded Funds .................................................................................................. 110
Liquidity .......................................................................................................................... 110
Takeovers ........................................................................................................................ 112
CHAPTER 5 Capital Market - Clearing and Settlement ................................................................................117
Introduction .............................................................................................................................. 117
Clearing & Settlement Process .................................................................................................. 118
Settlement Cycle ............................................................................................................. 119
Dematerialised Settlement ............................................................................................... 120
Settlement Statistics ......................................................................................................... 120
Risk Management ..................................................................................................................... 121
Risk Containment Measures ............................................................................................ 121
Capital Adequacy ............................................................................................................ 122
On-Line Monitoring ........................................................................................................ 122
Inspection and Investigation ............................................................................................ 122
Margin Requirements ..................................................................................................... 122
Index-based Market-wide Circuit Breakers .......................................................................124
Settlement Guarantee Fund ............................................................................................. 124
www.nseindia.com
Contents ISMRv
CHAPTER 6 Debt Market ............................................................................................................................ 126
Introduction .............................................................................................................................. 126
Trends ........ .............................................................................................................................. 126
Market Segments ...................................................................................................................... 127
Policy Developments ................................................................................................................ 127
Union Budget 2008-09 .................................................................................................... 127
DIP Guidelines ................................................................................................................ 128
Amendments to Securities Contracts (Regulation) Act, 1956 (SCRA) to provide legal framework for trading of securitized debt ........................................................................128
Simplifi ed regulatory framework for issuance and listing of debt securities ......................129
SEBI notifi es SEBI (Public Offer and Listing of Securitised Debt Instruments) Regulations, 2008 ........................................................................................................... 129
Market Design .......................................................................................................................... 130
Government securities markets .......................................................................................130
Market Participants ................................................................................................ 130
Types & Issuers of Securities ..................................................................................131
Primary Issuance Process of Government Securities ...............................................132
Secondary Market – Trading System ......................................................................134
Types of Securities traded in the WDM Segment of NSE ........................................134
Clearing and Settlement .........................................................................................135
Corporate Bond Market ................................................................................................... 136
Market segments .................................................................................................... 136
Regulatory framework ............................................................................................ 136
Trade reporting platform ........................................................................................137
Trading platforms ................................................................................................... 137
Market Outcome ...................................................................................................................... 137
Primary Market ............................................................................................................... 137
Secondary Market ........................................................................................................... 140
WDM Products ......................................................................................................................... 151
Policy Debate ........................................................................................................................... 155
Repos in corporate bonds ................................................................................................ 155
CHAPTER 7 Derivatives Market ................................................................................................................... 158
Introduction .............................................................................................................................. 158
Global Derivatives Markets ...................................................................................................... 159
Derivatives market survey by WFE-May 2008 ...........................................................................163
Policy Developments ................................................................................................................ 164

www.nseindia.com
ContentsISMR vi
Comprehensive Guidelines on Derivatives trading by banks ...........................................164
Permission for acceptance of Foreign Sovereign Securities as collateral from Foreign Institutional Investors (FIIs) for Exchange Traded Derivative Transactions ........................165
Introduction of Mini derivative (Futures & Options) contract on Index (Sensex & Nifty) ...166
Introduction of Volatility Index ........................................................................................166
Long Term Options contracts on S&P CNX NIFTY ...........................................................166
Introduction of Futures and Options contracts on S&P CNX Defty Index .........................168
Market Design .......................................................................................................................... 168
Trading Mechanism ......................................................................................................... 168
Membership .................................................................................................................... 168
Contracts available .......................................................................................................... 168
Charges ........................................................................................................................... 169
Clearing and Settlement .................................................................................................. 169
Risk Management Framework ................................................................................................... 169
Risk Containment Measures ............................................................................................170
Eligibility Criteria for stock selection ...............................................................................170
Margins Requirements ..................................................................................................... 172
Exposure Monitoring and Position Limit ..........................................................................172
NSE – SPAN .................................................................................................................... 174
Market Design For Currency Derivatives ..................................................................................174
Eligibility criteria ............................................................................................................. 174
Position limits ................................................................................................................. 175
Margins ........................................................................................................................... 176
Charges ........................................................................................................................... 176
Market Outcome ...................................................................................................................... 176
Trading Volumes ............................................................................................................. 176
Open Interest .................................................................................................................. 179
Implied Interest Rate ....................................................................................................... 180
Implied Volatility ............................................................................................................ 181
Settlement ....................................................................................................................... 182
Policy Debates ......................................................................................................................... 183
CHAPER 8 Foreign Institutional Investors in India ....................................................................................186
Evolution of policy framework .................................................................................................. 186
Policy Developments ................................................................................................................ 188
Permission for Short selling of Equity Shares by SEBI registered FIIs .................................188

www.nseindia.com
Contents ISMRvii
FII investments in Debt Securities ....................................................................................188
Foreign investment in Commodity Exchanges .................................................................189
Foreign investment in Credit Information Companies ......................................................189
FII investments in Debt Securities ....................................................................................189
Market Design .......................................................................................................................... 190
Entities eligible to invest under FII route ..........................................................................190
Investment restrictions ..................................................................................................... 190
General Obligations And Responsibilities .......................................................................191
Allocation of Funds ......................................................................................................... 191
Private Placement with FIIs ............................................................................................. 191
Risk Management ..................................................................................................................... 192
Forward Cover & Cancellation and Rebooking ................................................................192
FII Position Limits In Derivatives Contracts ......................................................................192
Monitoring of investment position by RBI .......................................................................192
Margin Requirements ...................................................................................................... 192
Investment by FIIs under Portfolio Investment Scheme ..............................................................192
Market Outcome ...................................................................................................................... 193
Foreign Institutional Investments- Equity and Debt ..........................................................195
Share of FIIs in NSE Listed Companies .............................................................................197
Chapter 9 Knowledge Initiatives ............................................................................................................... 198
Quality Intermediation ............................................................................................................. 198
NSE’s Certifi cation in Financial Markets ..........................................................................198
CBSE- NSE Joint Certifi cation in Financial Markets ...........................................................200
NSE Blackboard Series .................................................................................................... 200
Research Initiatives ................................................................................................................... 200
NSE Research Initiative .................................................................................................... 200
Data Dissemination ......................................................................................................... 200
Investor Awareness and Education ............................................................................................ 202
Investor awareness efforts for Currency Derivatives .........................................................202
Investor Protection Fund ........................................................................................................... 202

www.nseindia.com
AbbreviationsISMR viii
ADB Asian Development Bank
ADRs American Depository Receipts
AIFIs All India Financial Institutions
ALBM Automated Lending and Borrowing Mechanism
ALBRS Automated Lending and Borrowing under Rolling Settlement
AMC Asset Management Company
AMFI Association of Mutual Funds in India
ASC Accounting Standards Committee
ASE Ahmedabad Stock Exchange
ATM At-The-Money
ATSs Alternative Trading system
B2B Business-to-Business
BIFR Board for Industrial and Financial Reconstruction
BIS Bank for International Settlement
BLESS Borrowing and Lending Securities Scheme
BMC Base Minimum Capital
BSE The Stock Exchange, Mumbai
CBDT Central Board of Direct Taxes
CC Clearing Corporation
CDs Certifi cate of Deposits
C&D Corporatisation and Demutualisation
CH Clearing House
CCIL Clearing Corporation of India Limited
CDSL Central Depository Services (India) Limited
CFM Carry Forward Margin
CFRS Carry Forward under Rolling Settlement
CIMC Collective Investment Management Company
CISs Collective Investment Schemes
CIVs Collective Investment Vehicles
CLA Central Listing Authority
CLF Collateralised Lending Facility
CM Clearing Member
CM Segment Capital Market Segment of NSE
CMIE Centre for Monitoring Indian Economy
A B B R E V I A T I O N S

www.nseindia.com
Abbreviations ISMRix
COSI Committee on Settlement Issues
COTI Committee of Trade Issues
CP Custodial Participant
CPs Commercial Papers
CPSS Committee on Payment and Settlement Issues
CRAs Credit Rating Agencies
CRISIL The Credit Rating Information Services of India Limited
CRR Cash Reserve Ratio
CSD Collateral Security Deposit
CSE Calcutta Stock Exchange
DCA Department of Company Affairs
DDBs Deep Discount Bonds
DEA Department of Economic Affairs
DFIs Development Financial Institutions
DIP Disclosure and Investor Protection
DNS Deferred Net Settlement
DPs Depository Participants
DRR Debenture Redemption Reserve
DSCE Debt Securities Convertible into Equity
DvP Delivery versus Payment
ECBs External Commercial Bodies
ECNS Electronic communication Networks
EDGAR Electronic Data Gathering, Analysis and Retrieval
EDIFAR Electronic Data Information Filing and Retrieval
EFT Eletronic Fund Transfer
ELN Equity Linked Notes
ELSS Equity Linked Saving Schemes
EPS Earning Per Share
ETFs Exchange Traded Funds
FIA Futures Industry Association
F&O Futures and Options
FCCBs Foreign Currency Convertible Bonds
FCDs Fully Convertible Debentures
FDI Foreign Direct Investment
FDRs Foreign Deposit Receipts
FDs Fixed Deposits
FEMA Foreign Exchange Management Act
FIBV International World Federation of Stock Exchanges

www.nseindia.com
AbbreviationsISMR x
FII Foreign Institutional Investment
FIIs Foreign Institutional Investors
FIMMDA Fixed Income Money Markets and Derivatives Association
FIs Financial Institutions
FMCG Fast Moving Consumer Goods
FMPs Fixed Maturity Plans
FoFs Fund of Funds
FPOs Further Public Offerings
FRAs Forward Rate Agreements
FSAP Financial Sector Assesment Program
FVCIs Foreign Venture Capital Investors
GDP Gross Domestic Product
GDRs Global Deposit Receipts
GDRs Gross Domestic Savings
GNP Gross National Product
GOI Government of India
G-Sec Government Securities
GSO Green Shoe Option
i-BEX ICICI Securities Bond Index
ICAI Institute of Chartered Accountants of India
ICICI Industrial Credit and Investment Corporation of India Limited.
ICSE Inter-Connected Stock Exchange of India Limited
IBRD International Bank for Reconstruction and Development
IDBI Industrial Development Bank of India
IDRs Indian Depository Receipts
IEPF Investors Education and Protection Fund
IFC International Finance Corporation
IFSD Interest Free Security Deposit
IIM Indian Institute of Management
IISL India Index Services and Products Limited
IMF International Monetary Fund
IOSCO International Organisation of Securities Commission
IDFC Infrastructure Development Finance Corporation
IPF Investor Protection Fund
IPOs Initial Public Offers
IRDA Insurance Regulatory and Development Authority
IRS Interest Rate Swap
ISIN International Securities Identifi cation Number

www.nseindia.com
Abbreviations ISMRxi
ISSA International Securities Services Association
IT Information Technology
ITM In-The-Money
JPC Joint Parliamentary Committee
LAF Liquidity Adjustment Facility
LIC Life Insurance Corporation of India Limited
MCFS Modifi ed Carry Forward System
MFs Mutual Funds
MFSS Mutual Fund Service System
MIBID Mumbai Inter-bank Bid Rate
MIBOR Mumbai Inter-bank Offer Rate
MMMF Money Market Mutual Fund
MNCs Multi National Companies
MOU Memorandum of Understanding
MoF Ministry of Finance
MTM Mark-To-Market
NASDAQ National Association of Securities Dealers Automated Quotation System
NAV Net Asset Value
NBFCs Non-Banking Financial Companies
NCAER National Council for Applied Economic Research
NCDs Non-convertible Debentures
NCDS Non-convertible Debt Securities
NCFM NSE’s Certifi cation in Financial Markets
NDS Negotiatied Dealing System
NEAT National Exchange for Automated Trading
NGOs Non-Government Organisations
NIBIS NSE’s Internet-based Information System
NIC National Informatics Centre
NPAs Non Performing Assets
NRIs Non Resident Indians
NSCCL National Securities Clearing Corporation of India Limited
NSDL National Securities Depository Limited
NSE National Stock Exchange of India Limited
OCBs Overseas Corporate Bodies
OECLOB Open Electronic Consolidated Limit Order Book
OLTL On-line Trade Loading
OPMS On-line Position Monitoring System
ORS Order Routing System

www.nseindia.com
AbbreviationsISMR xii
OSL Open Strata Link
OTC Over the Counter
OTCEI Over the Counter Exchange of India Limited
OTM Out-of the-Money
P/E Price Earning Ratio
PAN Permanent Account Number
PCDs Partly Convertible Debentures
PCM Professional Clearing Member
PDAI Primary Dealers Association of India
PDO Public Debt Offi ce
PDs Primary Dealers
PFI Public Finance Institution
PFRDA Pension Fund Redulatory Development Authority
PRI Principal Return Index
PRISM Parallel Risk Management System
PSUs Public Sector Undertakings
PV Present Value
QIBs Qualifi ed Institutional Buyers
RBI Reserve Bank of India
ROCs Registrar of Companies
RTGS Real Time Gross Settlement
SA Stabilising Agent
SAT Securities Appelate Tribunal
SBTS Screen Based Trading System
SCMRD Society for Capital Market Research and Development
S&P Standard and Poor’s
SAT Securities Appellate Tribunal
SC(R)A Securities Contracts (Regulation) Act, 1956
SC(R)R Securities Contracts (Regulation) Rules, 1957
SCBs Scheduled Commercial Banks
SDs Satellite Dealers
SEBI Securities and Exchange Board of India
SEC Securities Exchange Commission
SGF Settlement Guarantee Fund
SGL Subsidiary General Ledger
SGX-DT The Singapore Exchange Derivatives Trading Limited
SIPC Securities Investor Protection Corporation
SLB Securities Lending and Borrowing
www.nseindia.com
Abbreviations ISMRxiii
SLR Statutory Liquidity Ratio
SPAN Standard Portfolio Analysis of Risks
SDL State Development Loans
SPICE Sensex Prudential ICICI Exchange Traded Fund
SPV Special Purpose Vehicle
SROs Self Regulatory Orgaisations
SSS Securities Settlement System
STA Share Transfer Agent
STP Straight Through Processing
STRIPS Separate Trading of Registered Interest and Principal of Securities
SUS 99 Special Unit Scheme 99
T-Bills Treasury Bills
TDS Tax Deducted at Source
TM Trading Member
TRI Total Return Index
UIN Unique Identifi cation Number
UTI Unit Trust of India
VaR Value at Risk
VCFs Venture Capital Funds
VCUs Venture Capital Undertakings
VSAT Very Small Aperture Terminal
WAN Wide Area Network
WAP Wireless Application Protocol
WDM Wholesale Debt Market Segment of NSE
YTM Yield to Maturity
ZCYC Zero Coupon Yield Curve
www.nseindia.com
Securities Market in India – An Overview ISMR1
Securities Market in India – An Overview
Introduction
We are living in exciting times, witnessing a process of ever-increasing globalization and innovation in the fi nancial markets. This is bringing with it sophistication and thus a need to better understand fi nancial risks and develop tools to manage them. The fi nancial markets and institutions have undergone signifi cant changes keeping pace with the changing needs of market participants. Along side the rise of private fi nance, the fi nancial markets are seeing an enhanced role of National Governments through Sovereign Wealth Funds. Venture capital funds and hedge funds have added new dimension to the market dynamics.
India has not remained untouched by these developments worldwide. With its growing and increasingly complex market-oriented economy and increasing integration with global trade and fi nance, India’s fi nancial system has also innovated.
In the securities markets, organisational innovation has been witnessed with corporatisation and demutualization of all the stock exchanges; institutional innovations in the form of emergence of regulators, Self Regulatory Organizations and clearing corporations and more recently, market innovations through a short selling and Securities Lending and Borrowing Scheme, Direct Market Access, addressing of the legal, regulatory, tax and market design issues in the development of the corporate bond market in the country, provision of a legal framework for trading of securitized debt, quicker procedures for registration and operation by FIIs, making PAN as the sole identifi cation number for all transactions in securities market and new derivative products such as currency futures.
Market Segments
The securities market has two interdependent and inseparable segments, the new issues (primary) market and the stock (secondary) market. The primary market provides the channel for creation and sale of new securities, while the secondary market deals in securities previously issued. The securities issued in the primary market are issued by public limited companies or by government agencies. The resources in this kind of market are mobilized either through the public issue or through private placement route. It is a public issue if anybody and everybody can subscribe for it, whereas if the issue is made available to a selected group of persons it is termed as private placement. There are two major types of issuers of securities, the corporate entities who issue mainly debt and equity instruments and the government (central as well as state) who issue debt securities (dated securities and treasury bills).
The secondary market enables participants who hold securities to adjust their holdings in response to changes in their assessment of risks and returns. Once the new securities are issued in the primary market they are traded in the stock (secondary) market. The secondary market operates through two mediums, namely, the over-the-counter (OTC) market and the exchange-traded market. OTC markets are informal markets where trades are negotiated. Most of the trades in the government securities are in the OTC market. All the spot trades where securities are traded for immediate delivery and payment take place in the OTC market. The other option is to trade using the infrastructure provided by the stock exchanges. The exchanges in India follow a systematic settlement period. All the trades taking place over a trading cycle (day=T) are settled together after a certain time (T+2 day). The trades executed on exchanges are cleared and settled
www.nseindia.com
Securities Market in India – An OverviewISMR 2
by a clearing corporation. The clearing corporation acts as a counterparty and guarantees settlement. A variant of the secondary market is the forward market, where securities are traded for future delivery and payment. A variant of the forward market is Futures and Options market. Presently only two exchanges viz., National Stock Exchange of India Ltd. (NSE) and Bombay Stock Exchange (BSE) provides trading in the Futures & Options.
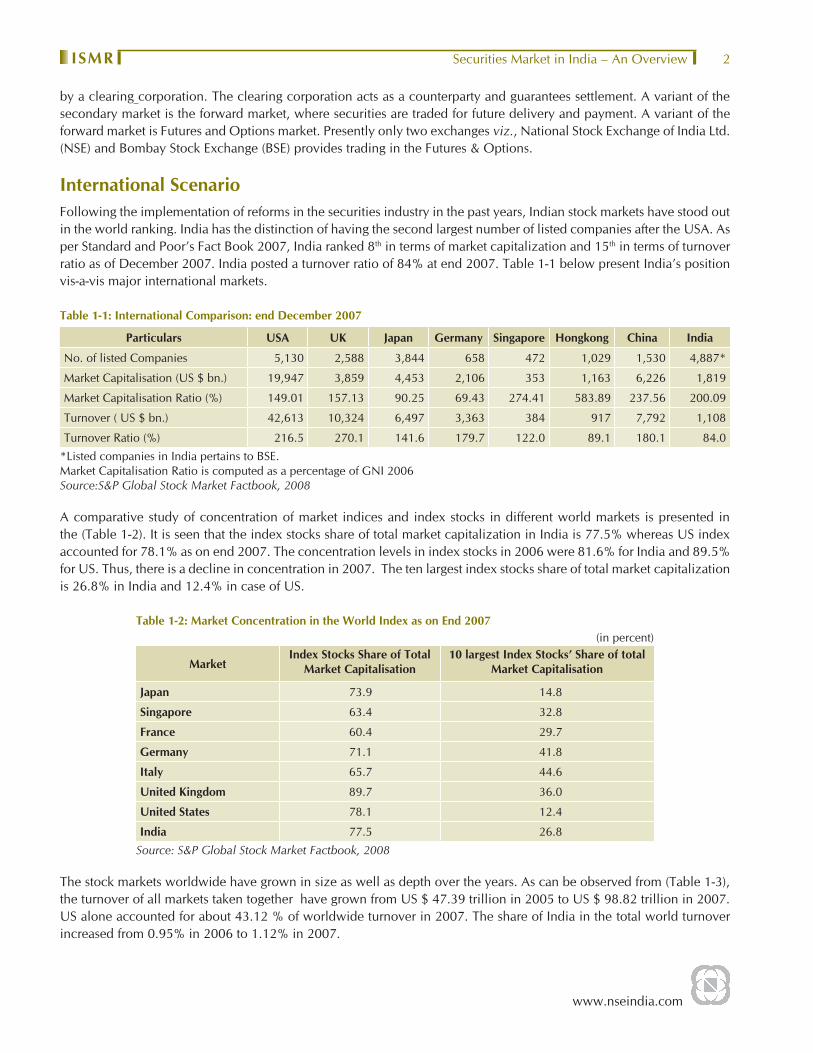
International ScenarioFollowing the implementation of reforms in the securities industry in the past years, Indian stock markets have stood out in the world ranking. India has the distinction of having the second largest number of listed companies after the USA. As per Standard and Poor’s Fact Book 2007, India ranked 8th in terms of market capitalization and 15th in terms of turnover ratio as of December 2007. India posted a turnover ratio of 84% at end 2007. Table 1-1 below present India’s position vis-a-vis major international markets.
Table 1-1: International Comparison: end December 2007
Particulars USA UK Japan Germany Singapore Hongkong China India
No. of listed Companies 5,130 2,588 3,844 658 472 1,029 1,530 4,887*
Market Capitalisation (US $ bn.) 19,947 3,859 4,453 2,106 353 1,163 6,226 1,819
Market Capitalisation Ratio (%) 149.01 157.13 90.25 69.43 274.41 583.89 237.56 200.09
Turnover ( US $ bn.) 42,613 10,324 6,497 3,363 384 917 7,792 1,108
Turnover Ratio (%) 216.5 270.1 141.6 179.7 122.0 89.1 180.1 84.0
*Listed companies in India pertains to BSE.Market Capitalisation Ratio is computed as a percentage of GNI 2006Source:S&P Global Stock Market Factbook, 2008
A comparative study of concentration of market indices and index stocks in different world markets is presented in the (Table 1-2). It is seen that the index stocks share of total market capitalization in India is 77.5% whereas US index accounted for 78.1% as on end 2007. The concentration levels in index stocks in 2006 were 81.6% for India and 89.5% for US. Thus, there is a decline in concentration in 2007. The ten largest index stocks share of total market capitalization is 26.8% in India and 12.4% in case of US.
Table 1-2: Market Concentration in the World Index as on End 2007(in percent)
MarketIndex Stocks Share of Total
Market Capitalisation10 largest Index Stocks’ Share of total
Market Capitalisation
Japan 73.9 14.8
Singapore 63.4 32.8
France 60.4 29.7
Germany 71.1 41.8
Italy 65.7 44.6
United Kingdom 89.7 36.0
United States 78.1 12.4
India 77.5 26.8
Source: S&P Global Stock Market Factbook, 2008
The stock markets worldwide have grown in size as well as depth over the years. As can be observed from (Table 1-3), the turnover of all markets taken together have grown from US $ 47.39 trillion in 2005 to US $ 98.82 trillion in 2007. US alone accounted for about 43.12 % of worldwide turnover in 2007. The share of India in the total world turnover increased from 0.95% in 2006 to 1.12% in 2007.

www.nseindia.com
Securities Market in India – An Overview ISMR3
Table 1-3: Market Capitalisation and Turnover for Major Markets (US $ million)
Country/RegionMarket Capitalisation (end of period) Turnover
2005 2006 2007 2005 2006 2007Developed Markets 36,183,389 42,916,705 46,300,864 41,693,067 59,258,415 82,455,174 Australia 804,074 1,095,858 1,298,429 616,115 826,285 1,322,822 Japan 4,736,513 4,726,269 4,453,475 4,997,414 6,252,470 6,497,193 UK 3,058,182 3,794,310 3,858,505 4,167,020 4,242,082 10,324,477 USA 16,970,865 19,425,855 19,947,284 21,509,979 33,267,643 42,613,206 All Emerging Markets 7,135,963 10,458,582 18,262,550 5,692,906 8,226,944 16,361,131 China 780,763 2,426,326 6,226,305 586,301 1,635,121 7,791,702 India 553,074 818,879 1,819,101 433,900 638,484 1,107,550 Indonesia 81,428 138,886 211,693 41,900 48,831 112,851 Korea 718,180 835,188 1,123,633 1,202,976 1,340,122 1,974,015 Malaysia 181,236 235,356 325,663 49,976 66,904 150,002 Philippines 40,153 68,382 103,224 6,951 11,243 29,251 Taiwan 515,980 654,858 723,687 716,471 894,553 1,272,432 World Total 43,319,352 53,375,287 64,563,414 47,385,973 67,485,359 98,816,305 US as % of World 39.18 36.39 30.90 45.39 49.30 43.12India as % of World 1.28 1.53 2.82 0.92 0.95 1.12
Source: S&P Global Stock Market Factbook, 2008
The market capitalization of all listed companies taken together on all markets stood at US $ 64.56 trillion in 2007 up from US $ 53.38 trillion in 2006. The share of US in worldwide market capitalization decreased from 36.39 % as at end-2006 to 30.90 % at end 2007, while Indian listed companies accounted for 2.82% of total market capitalization as at end 2007 (an increase from 1.53% at end of 2006).
According to the ‘World Development Indicators 2008’, World Bank there has been an increase in market capitalization as percentage of Gross Domestic Product (GDP) in some of the major country groups as is evident from (Table 1-4). The increase, however, has not been uniform across countries. The market capitalization as a percentage of GDP was the highest at 126.1% for the high income countries as at end 2006 and lowest for low income countries at 67%. The Middle income countries have shown a remarkable improvement in market capitalization to GDP ratio from 49.5% in 2005 to 74.2% in 2006.
Table 1-4: Select Stock Market Indicators
MarketsMarket Capitalisation as
% of GDP Turnover Ratio (%) Listed Domestic Companies
2004 2005 2006 2004 2005 2006 2007 2004 2005 2006 2007High Income 108.9 112.9 126.1 110.1 114.0 122.2 150.2 27,594 28,001 28,733 30,016 Middle Income 43.7 49.5 74.2 60.9 41.6 75.3 94.5 14,456 14,117 11,141 13,195 Low & Middle Income 43.8 50.1 73.3 72.4 53.7 78.2 94.3 22,444 20,873 17,263 20,106 East Asia & Pacifi c 41 41.3 85.1 103.5 50.0 123.1 163.5 3,582 3,794 3,525 4,080 Europe & Central Asia 32.8 45.8 66.7 37.9 59.0 68.5 64.1 7,776 7,023 4,490 6,070 Latin America & Caribbean 39.6 44.6 51.7 22.0 26.1 29.2 34.8 1,468 1,525 1,342 1,509 Middle East & N. Africa 37.1 49.1 48.9 64.4 16.5 27.0 28.3 1,803 1,627 1,078 1,443 South Asia 48.7 60.4 77.2 131.2 120.6 108.7 101.3 6,909 6,000 5,954 6,089 Sub-Saharan Africa 129.6 137.0 159.9 39.3 27.6 32.6 30.1 906 904 874 915 Low Income 44.5 54.2 67 130.5 107.6 96.6 93.3 7,988 6,756 6,122 6,911 India 56.1 68.6 89.8 115.5 93.6 96.4 95.9 4,730 4,763 4,796 4,887 World 96.3 99.6 113.9 72.4 53.7 78.2 94.3 50,038 48,874 49,946 50,212 Source: World Development Indicators 2008, World Bank.
www.nseindia.com
Securities Market in India – An OverviewISMR 4
Market capitalisation as percentage of GDP in India stood at 89.8 % as at end 2006. The turnover ratio, which is a measure of liquidity, was 150.2 % for high-income countries and 93.3% for low-income countries in 2007. The total number of listed companies stood at 30,016 for high-income countries, 13,195 for middle-income countries and 6,911 for low-income countries as at end-2007.
Key strengths of the Indian securities marketsThe key strengths of the Indian capital market include a fully automated trading system on all stock exchanges, a wide range of products, an integrated platform for trading in both cash and derivatives, and a nationwide network of trading through over 4,000 corporate brokers. The securities markets in India have made enormous progress in developing sophisticated instruments and modern market mechanisms.
The real strength of the Indian securities market lies in the quality of regulation. The market regulator, Securities and Exchange Board of India (SEBI) is an independent and effective regulator. It has put in place sound regulations in respect of intermediaries, trading mechanism, settlement cycles, risk management, derivative trading and takeover of companies. There is a well designed disclosure based regulatory system. Information technology is extensively used in the securities market. The NSE and BSE have most advanced and scientifi c risk management systems. The growing number of market participants, the growth in volume of securities transactions, the reduction in transaction costs, the signifi cant improvements in effi ciency, transparency and safety, and the level of compliance with international standards have earned for the Indian securities market a new respect in the world.
Market ParticipantsIn every economic system, some units, individuals or institutions, are surplus-generating, who are called savers, while others are defi cit- generating, called spenders. Households are surplus-generators and corporates and Government are defi cit generators. Through the platform of securities markets, the savings units place their surplus funds in fi nancial claims or securities at the disposal of the spending community and in turn get benefi ts like interest, dividend, capital appreciation, bonus etc. These investors and issuers of fi nancial securities constitute two important elements of the securities markets. The third critical element of markets are the intermediaries who act as conduits between the investors and issuers. Regulatory bodies, which regulate the functioning of the securities markets, constitute another signifi cant element of securities markets. The process of mobilisation of resources is carried out under the supervision and overview of the regulators. The regulators develop fair market practices and regulate the conduct of issuers of securities and the intermediaries. They are also in charge of protecting the interests of the investors. The regulator ensures a high service standard from the intermediaries and supply of quality securities and non-manipulated demand for them in the market.
Thus, the four important elements of securities markets are the investors, the issuers, the intermediaries and regulators.
InvestorsAn investor is the backbone of the capital markets of any economy as he is the one lending his surplus resources for funding the setting up of or expansion of companies, in return for fi nancial gain.
Households’ investment pattern
According to Reserve Bank of India (RBI) data, the household sector accounted for 80.5% of the Gross Domestic Savings in Fixed Income investment instruments during 2007-08, as against 84.5% in 2006-07 (Table 1-5). Mutual funds accounted for the bulk of securities markets investments with an absolute amount of Rs 568,000 million in 2007-08 against Rs. 398,030 million in 2006-07. 2007-08 saw huge investments in mutual funds to take advantage of the booming stock market. Besides, bank deposit rates were very low then.

www.nseindia.com
Securities Market in India – An Overview ISMR5
Table 1-5: Savings of Household Sector in Financial Assets(In per cent)
Financial Assets 2003-04 P 2004-05 P 2005-06 P 2006-07 P 2007-08#
Currency 11.2 8.5 8.7 8.6 10.9Fixed income investments 81.6 85.4 83.9 84.5 80.5 Deposits 38.8 37 47.4 55.30 56.5 Insurance/Provident/Pension Funds 27.3 28.9 24.2 24.10 25.7 Small Savings 15.5 19.5 12.3 5.1 -1.7Securities Market 7.5 6.0 7.2 6.9 8.5 Mutual Funds 1.2 0.4 3.6 5.20 7.7 Government Securities 7.5 4.9 2.4 0.2 -2 Other Securities -1.2 0.7 1.2 1.50 2.8Total 100 100 100 100 100
Source: RBI. Annual Report 2007-08P: Provisional Figures# Preliminary Estimates
IssuersPrimary Markets
An aggregate of Rs. 5,788,150 million (US $ 144,812 million) were raised by the government and corporate sector during 2007-08 as against Rs. 3,944,540 million (US $ 90,492 million) during the preceding year, an increase of 46.74%. Private placement accounted for 71.75% of the domestic resource mobilization by the corporate sector. (Table 1-6).
Table 1-6: Resource Mobilisation from the Primary Market
Issues 2006-07(Rs. mn)
2007-08(Rs. mn)
2006-07 (US $ mn)
2007-08(US $ mn)
Corporate Securities 1,942,560 3,228,310 44,564 80,768 Domestic Issues 1,772,510 2,962,750 40,663 74,124 Public Issues 313,850 837,070 7,200 20,942 Non-Govt. Public Companies 306,030 636,380 7,021 15,921 PSU Bonds -- -- -- -- Govt. Companies -- 25,160 -- 629 Banks & FIs 7,820 175,530 179 4,392 Private Placement 1,458,660 2,125,680 33,463 53,182 Euro Issues 170,050 265,560 3,901 6,644 Government Securities 2,001,980 2,559,840 45,928 64,044 Central Government 1,793,730 1,882,050 41,150 47,087 State Governments 208,250 677,790 4,777 16,957 Total 3,944,540 5,788,150 90,492 144,812
Source: RBI Annual Report 2007-08
The Indian market is getting integrated with the global market, though in a limited way through Euro Issues, since they were permitted access in 1992. Indian companies have raised about Rs. 265,560 million i.e. US $ 6,644 million during 2007-08 through American Depository Receipts (ADRs)/Global Depository Receipts (GDRs), an increase of 56.17% as compared with Rs.170,050 million ( US $ 3901 million) during 2006-07.
Of the total resources mobilized through the primary markets, the share of resources raised by the Government decreased from 51 % in 2006-07 to 42% in 2007-08. While the primary issues of the Central Government increased from Rs. 1,793,730 million in 2006-07 to Rs. 1,882,050 million in 2007-08, the resources raised by State Governments increased by 225% from Rs. 208,250 million in 2006-07 to Rs.677,790 million in 2007-08.
www.nseindia.com
Securities Market in India – An OverviewISMR 6
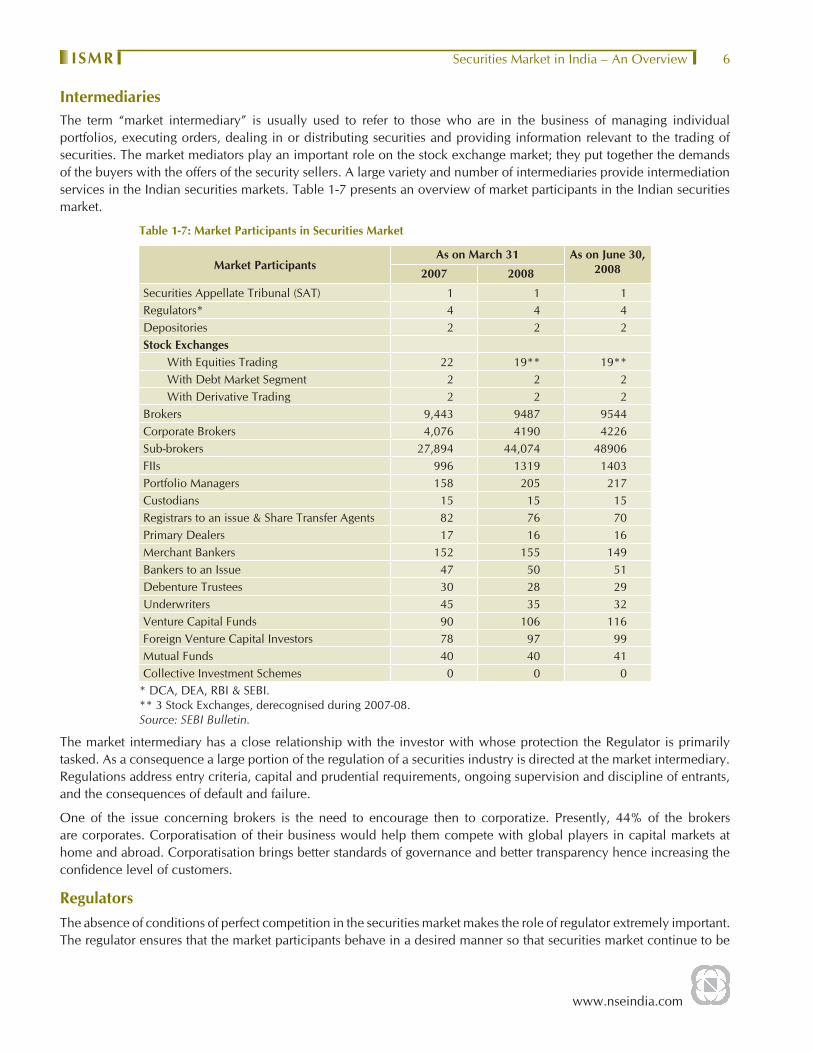
IntermediariesThe term “market intermediary” is usually used to refer to those who are in the business of managing individual portfolios, executing orders, dealing in or distributing securities and providing information relevant to the trading of securities. The market mediators play an important role on the stock exchange market; they put together the demands of the buyers with the offers of the security sellers. A large variety and number of intermediaries provide intermediation services in the Indian securities markets. Table 1-7 presents an overview of market participants in the Indian securities market.
Table 1-7: Market Participants in Securities Market
Market ParticipantsAs on March 31 As on June 30,
20082007 2008
Securities Appellate Tribunal (SAT) 1 1 1Regulators* 4 4 4Depositories 2 2 2Stock Exchanges With Equities Trading 22 19** 19** With Debt Market Segment 2 2 2 With Derivative Trading 2 2 2Brokers 9,443 9487 9544Corporate Brokers 4,076 4190 4226Sub-brokers 27,894 44,074 48906FIIs 996 1319 1403Portfolio Managers 158 205 217Custodians 15 15 15Registrars to an issue & Share Transfer Agents 82 76 70Primary Dealers 17 16 16Merchant Bankers 152 155 149Bankers to an Issue 47 50 51Debenture Trustees 30 28 29Underwriters 45 35 32Venture Capital Funds 90 106 116Foreign Venture Capital Investors 78 97 99Mutual Funds 40 40 41Collective Investment Schemes 0 0 0
* DCA, DEA, RBI & SEBI.** 3 Stock Exchanges, derecognised during 2007-08.Source: SEBI Bulletin.
The market intermediary has a close relationship with the investor with whose protection the Regulator is primarily tasked. As a consequence a large portion of the regulation of a securities industry is directed at the market intermediary. Regulations address entry criteria, capital and prudential requirements, ongoing supervision and discipline of entrants, and the consequences of default and failure.
One of the issue concerning brokers is the need to encourage then to corporatize. Presently, 44% of the brokers are corporates. Corporatisation of their business would help them compete with global players in capital markets at home and abroad. Corporatisation brings better standards of governance and better transparency hence increasing the confi dence level of customers.
Regulators The absence of conditions of perfect competition in the securities market makes the role of regulator extremely important. The regulator ensures that the market participants behave in a desired manner so that securities market continue to be

www.nseindia.com
Securities Market in India – An Overview ISMR7
a major source of fi nance for corporate and government and the interest of investors are protected.
The responsibility for regulating the securities market is shared by Department of Economic Affairs (DEA), Ministry of Company Affairs (MCA), Reserve Bank of India (RBI) and SEBI. The activities of these agencies are coordinated by a High Level Committee on Capital Markets. The orders of SEBI under the securities laws are appellable before a Securities Appellate Tribunal.
Most of the powers under the SCRA are exercisable by DEA while a few others by SEBI. The powers of the DEA under the SCRA are also con-currently exercised by SEBI. The powers in respect of the contracts for sale and purchase of securities, gold related securities, money market securities and securities derived from these securities and ready forward contracts in debt securities are exercised concurrently by RBI. The SEBI Act and the Depositories Act are mostly administered by SEBI. The rules under the securities laws are framed by government and regulations by SEBI. All these are administered by SEBI. The powers under the Companies Act relating to issue and transfer of securities and non-payment of dividend are administered by SEBI in case of listed public companies and public companies proposing to get their securities listed. The SROs ensure compliance with their own rules as well as with the rules relevant for them under the securities laws.
Regulatory framework
At present, the fi ve main Acts governing the securities markets are (a) the SEBI Act, 1992; (b) the Companies Act, 1956, which sets out the code of conduct for the corporate sector in relation to issuance, allotment and transfer of securities, and disclosures to be made in public issues; (c) the Securities Contracts (Regulation) Act, 1956, which provides for regulation of transactions in securities through control over stock exchanges (d) the Depositories Act, 1996 which provides for electronic maintenance and transfer of ownership of demat shares and (e) Prevention of Money Laundering Act, 2002.
Legislations
Capital Issues (Control) Act, 1947
The Act had its origin during the war in 1943 when the objective was to channel resources to support the war effort. It was retained with some modifi cations as a means of controlling the raising of capital by companies and to ensure that national resources were channeled into proper lines, i.e., for desirable purposes to serve goals and priorities of the government, and to protect the interests of investors. Under the Act, any fi rm wishing to issue securities had to obtain approval from the Central Government, which also determined the amount, type and price of the issue. As a part of the liberalisation process, the Act was repealed in 1992 paving way for market determined allocation of resources.
SEBI Act, 1992
The SEBI Act, 1992 was enacted to empower SEBI with statutory powers for (a) protecting the interests of investors in securities, (b) promoting the development of the securities market, and (c) regulating the securities market. Its regulatory jurisdiction extends over corporates in the issuance of capital and transfer of securities, in addition to all intermediaries and persons associated with securities market. It can conduct enquiries, audits and inspection of all concerned and adjudicate offences under the Act. It has power to register and regulate all market intermediaries and also to penalise them in case of violations of the provisions of the Act, Rules and Regulations made there under. SEBI has full autonomy and authority to regulate and develop an orderly securities market.
Securities Contracts (Regulation) Act, 1956
It provides for direct and indirect control of virtually all aspects of securities trading and the running of stock exchanges and aims to prevent undesirable transactions in securities. It gives Central Government regulatory jurisdiction over (a) stock exchanges through a process of recognition and continued supervision, (b) contracts in securities, and (c) listing of securities on stock exchanges. As a condition of recognition, a stock exchange complies with conditions prescribed by Central Government. Organised trading activity in securities takes place on a specifi ed recognised stock exchange.

www.nseindia.com
Securities Market in India – An OverviewISMR 8
The stock exchanges determine their own listing regulations which have to conform to the minimum listing criteria set out in the Rules.
Depositories Act, 1996
The Depositories Act, 1996 provides for the establishment of depositories in securities with the objective of ensuring free transferability of securities with speed, accuracy and security by (a) making securities of public limited companies freely transferable subject to certain exceptions; (b) dematerialising the securities in the depository mode; and (c) providing for maintenance of ownership records in a book entry form. In order to streamline the settlement process, the Act envisages transfer of ownership of securities electronically by book entry without making the securities move from person to person. The Act has made the securities of all public limited companies freely transferable, restricting the company’s right to use discretion in effecting the transfer of securities, and the transfer deed and other procedural requirements under the Companies Act have been dispensed with.
Companies Act, 1956
It deals with issue, allotment and transfer of securities and various aspects relating to company management. It provides for standard of disclosure in public issues of capital, particularly in the fi elds of company management and projects, information about other listed companies under the same management, and management perception of risk factors. It also regulates underwriting, the use of premium and discounts on issues, rights and bonus issues, payment of interest and dividends, supply of annual report and other information.
Prevention of Money Laundering Act, 2002
The primary objective of the Act is to prevent money-laundering and to provide for confi scation of property derived from or involved in money-laundering. The term money-laundering is defi ned as whoever acquires, owns, possess or transfers any proceeds of crime; or knowingly enters into any transaction which is related to proceeds of crime either directly or indirectly or conceals or aids in the concealment of the proceeds or gains of crime within India or outside India commits the offence of money-laundering. Besides providing punishment for the offence of money-laundering, the Act also provides other measures for prevention of Money Laundering. The Act also casts an obligation on the intermediaries, banking companies etc to furnish information, of such prescribed transactions to the Financial Intelligence Unit- India, to appoint a principal offi cer, to maintain certain records etc.
Rules and Regulations
The Government have framed rules under the SCRA, SEBI Act and the Depositories Act. SEBI has framed regulations under the SEBI Act and the Depositories Act for registration and regulation of all market intermediaries, and for prevention of unfair trade practices, insider trading, etc. Under these Acts, Government and SEBI issue notifi cations, guidelines, and circulars which need to be complied with by market participants. The SROs like stock exchanges have also laid down their rules and regulations.
Having discussed the various elements of securities market above the following section presents an overview of ‘Secondary Market’ segment of the Indian Securities Markets.
Secondary Market
Corporate Securities
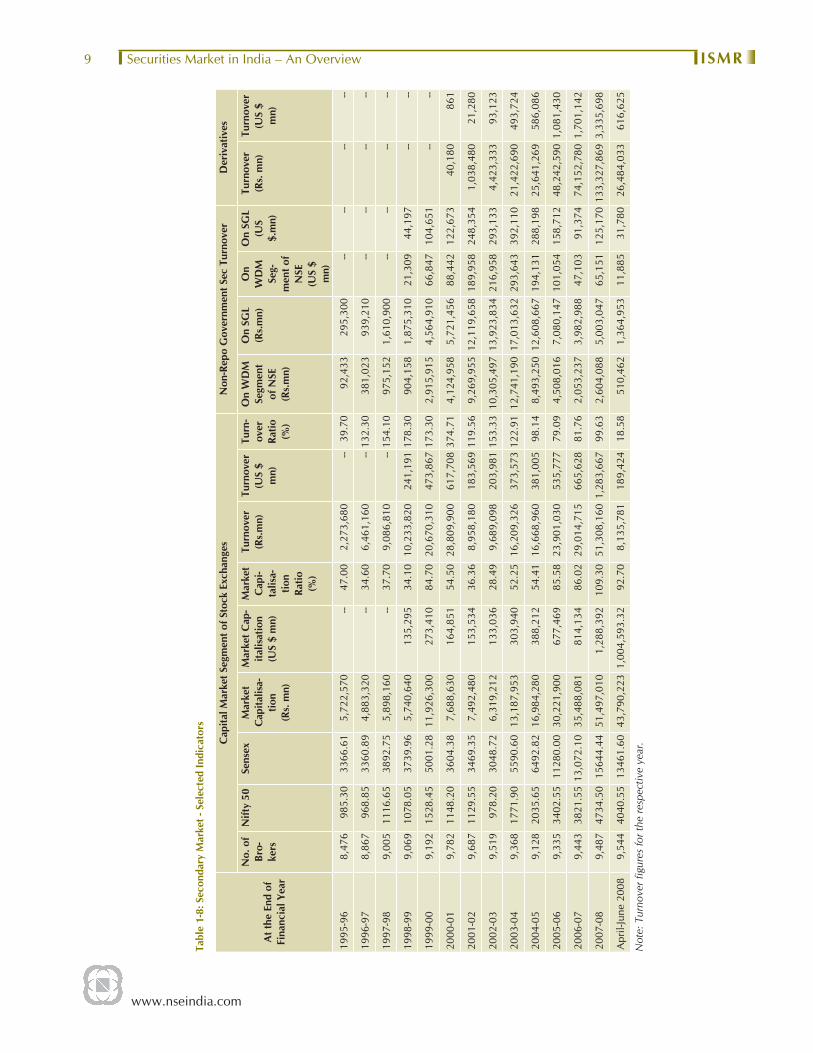
Exchanges in the country, offer screen based trading system. There were 9,487 trading members registered with SEBI as at end March 2008 (Table 1-8).
The market capitalization has grown over the period indicating more companies using the trading platform of the stock exchange. The All-India market capitalization was around Rs. 51,497,010 million (US $ 1,288,392 million) at the end of March 2008. The market capitalization ratio is defi ned as market capitalisation of stocks divided by GDP. It is used as a measure to denote the importance of equity markets relative to the GDP. It is of economic signifi cance since market is positively correlated with the ability to mobilize capital and diversify risk. The All- India market capitalisation ratio
www.nseindia.com
Securities Market in India – An Overview ISMR9
Tabl
e 1-
8: S
econ
dary
Mar
ket -
Sel
ecte
d In
dica
tors
At t
he E
nd o
f Fi
nanc
ial Y
ear
Cap
ital M
arke
t Seg
men
t of S
tock
Exc
hang
esN
on-R
epo
Gov
ernm
ent S
ec T
urno
ver
Der
ivat
ives
No.
of
Bro-
kers
Nift
y 50
Sens
exM
arke
t C
apita
lisa-
tion
(Rs.
mn)
Mar
ket C
ap-
italis
atio
n (U
S $
mn)
Mar
ket
Cap
i-ta
lisa-
tion
Ratio
(%
)
Turn
over
(Rs.
mn)
Turn
over
(US
$ m
n)
Turn
-ov
er
Ratio
(%
)
On
WD
M
Segm
ent
of N
SE(R
s.m
n)
On
SGL
(Rs.
mn)
On
WD
M
Seg-
men
t of
NSE
(US
$ m
n)
On
SGL
(US
$.m
n)
Turn
over
(Rs.
mn)
Turn
over
(US
$ m
n)
1995
-96
8,47
698
5.30
3366
.61
5,72
2,57
0--
47.0
02,
273,
680
--39
.70
92,4
3329
5,30
0--
----
--
1996
-97
8,86
796
8.85
3360
.89
4,88
3,32
0--
34.6
06,
461,
160
--13
2.30
381,
023
939,
210
----
----
1997
-98
9,00
511
16.6
538
92.7
55,
898,
160
--37
.70
9,08
6,81
0--
154.
1097
5,15
21,
610,
900
----
----
1998
-99
9,06
910
78.0
537
39.9
65,
740,
640
135,
295
34.1
010
,233
,820
241,
191
178.
3090
4,15
81,
875,
310
21,3
0944
,197
----
1999
-00
9,19
215
28.4
550
01.2
811
,926
,300
273,
410
84.7
020
,670
,310
473,
867
173.
302,
915,
915
4,56
4,91
066
,847
104,
651
----
2000
-01
9,78
211
48.2
036
04.3
87,
688,
630
164,
851
54.5
028
,809
,900
617,
708
374.
714,
124,
958
5,72
1,45
688
,442
122,
673
40,1
80 8
61
2001
-02
9,68
711
29.5
534
69.3
57,
492,
480
153,
534
36.3
68,
958,
180
183,
569
119.
569,
269,
955
12,1
19,6
58 1
89,9
58
248,
354
1,03
8,48
0 2
1,28
0
2002
-03
9,51
997
8.20
3048
.72
6,31
9,21
213
3,03
628
.49
9,68
9,09
820
3,98
115
3.33
10,3
05,4
9713
,923
,834
216,
958
293,
133
4,42
3,33
3 9
3,12
3
2003
-04
9,36
817
71.9
055
90.6
013
,187
,953
303,
940
52.2
516
,209
,326
373,
573
122.
9112
,741
,190
17,0
13,6
3229
3,64
339
2,11
021
,422
,690
493
,724
2004
-05
9,12
820
35.6
564
92.8
216
,984
,280
388,
212
54.4
116
,668
,960
381,
005
98.1
48,
493,
250
12,6
08,6
6719
4,13
128
8,19
825
,641
,269
586
,086
2005
-06
9,33
534
02.5
511
280.
0030
,221
,900
677,
469
85.5
823
,901
,030
535,
777
79.0
94,
508,
016
7,08
0,14
710
1,05
415
8,71
248
,242
,590
1,08
1,43
0
2006
-07
9,44
338
21.5
513
,072
.10
35,4
88,0
8181
4,13
486
.02
29,0
14,7
1566
5,62
881
.76
2,05
3,23
7 3
,982
,988
4
7,10
3 9
1,37
4 74
,152
,780
1,70
1,14
2
2007
-08
9,48
747
34.5
015
644.
4451
,497
,010
1,28
8,39
210
9.30
51,3
08,1
601,
283,
667
99.6
32,
604,
088
5,00
3,04
765
,151
125,
170
133,
327,
869
3,33
5,69
8
Apr
il-Ju
ne 2
008
9,54
440
40.5
513
461.
6043
,790
,223
1,00
4,59
3.32
92.7
08,
135,
781
189,
424
18.5
851
0,46
21,
364,
953
11,8
8531
,780
26,4
84,0
3361
6,62
5
Not
e: T
urno
ver fi
gur
es fo
r the
resp
ectiv
e ye
ar.

www.nseindia.com
Securities Market in India – An OverviewISMR 10
increased to 109.26 % in 2007-08 from 86.02 % in 2006-07. NSE Market Capitalisation ratio was 103.08 % during 2007-08 while BSE Market Capitalisation ratio was 109.01 %.
The trading volumes on stock exchanges have been witnessing phenomenal growth over the past years. The trading volume, which peaked at Rs.28,809,900 million (US $ 617,708 million) in 2000-01, posted a substantial fall of 68.91 % to Rs.8,958,180 million (US $ 183,569 million) in 2001-02. However, from 2002-03 onwards the trading volumes picked up. It stood at Rs.9,689,098 million (US $ 203,981 million) in 2002-03 and further witnessed a year-on-year increase of 67.29 % in 2003-04 standing at Rs.16,209,326 million (US $ 373,573 million). The upsurge continued and in 2006-07, the turnover showed an increase of 21.40 % to Rs.29,014,715 million (US $ 665,628 million) from Rs.23,901,030 million (US $ 535,777 million) in 2005-06. (Table 1-8)
During 2007-08, the trading volumes on the CM segment of Exchanges increased signifi cantly by 76.83% to Rs.51,308,160 million (US $ 1,283,667 million).
The relative importance of various stock exchanges in the market has undergone dramatic changes over a decade. The increase in turnover took place mostly at the big stock exchanges. The NSE yet again registered as the market leader with 90.27 % of total turnover (volumes on all segment) in 2007-08. Top 2 stock exchanges accounted for 99.99 % of turnover, while the rest 19 stock exchanges had negligible volumes during 2007-08 (Table 1-9).
Table 1-9: Growth and Distribution of Turnover on Stock Exchanges
Stock Exchanges 2001-02 (Rs. mn)
2002-03(Rs. mn)
2003-04(Rs. mn)
2004-05(Rs. mn)
2005-06(Rs. mn)
2006-07(Rs. mn)
2007-08(Rs.mn)
2007-08(US $ mn)
1 NSE 15,622,830 21,265,445 45,462,793 45,744,186 68,693,315 95,206,640 169,238,329 4,234,1342 BSE 3,093,156 3,165,516 5,146,730 5,357,913 8,160,830 10,167,917 18,233,239 456,1733 Calcutta 270,747 65,399 19,275 27,150 28,000 6,940 4,460 1124 Delhi 58,280 111 34 0 0 0 0 05 Ahmedabad 148,435 154,586 45,445 80 0 0 0 06 Uttar Pradesh 252,373 147,634 117,510 53,430 14,860 7,990 4,750 1197 Ludhiana 8,566 0 0 0 0 0 0 08 Pune 11,710 18 0 3 0 0 0 09 Bangalore 703 0 1 0 0 0 0 0
10 Hyderabad* 413 46 20 140 890 920 0 011 ICSE/ISE 554 648 1 0 0 0 0 012 Cochin 0 0 0 0 0 0 0 013 OTCEI 38 1 158 0.1 0 0 014 Madras 241 0 1,009 270 50 12 0 015 Madhya Pradesh 235 0 0 0 0 0 0 016 Magadh* 0 5 1 0 910 0 0 017 Vadodara 101 25 1 0 0 0 0 018 Gauhati 1 1 0 0 0 0 0 019 Bhubaneshwar 0 0 0 0 0 0 0 020 Coimbatore 266 0 0 0 0 0 0 021 SKSE* 0 0 0 0 0 0 0 022 Mangabre* 0 0 0 0 0 0 0 023 Jaipur 0 0 0 0 0 0 0 0
Total 19,468,650 24,799,434 50,792,977 51,183,172 76,898,855 105,390,419 187,480,778 4,690,537* 4 Stock Exchanges derecognised.Note: Turnover means total value of transactions of securities in all market segments of an Exchange. For NSE & BSE all three segments viz., CM, F&O and WDM are included.
The movement of the Nifty 50, the most widely used indicator of the market, is presented in Chart 1-1. The index movement has been responding to changes in the government’s economic policies, the increase in FII infl ows, etc.

www.nseindia.com
Securities Market in India – An Overview ISMR11
However, the year 2007-08 witnessed a favourable movement in the Nifty 50 Index, wherein it registered its all time high of 6357.10 in January 08, 2008. The point-to-point return of Nifty 50 was 23.89 % for 2007-08.
Chart 1-1: Movement of Nifty 50
Shareholding Pattern
In the interest of transparency, the issuers are required to disclose shareholding pattern on a quarterly basis. Table 1-10 presents the sectorwise shareholding pattern of the companies listed at NSE at end June 2008. It is observed that on an average the promoters held 57.45% of the total shares while non-promoters holding was 40.72%. Individual held 12.86% and the institutional holding (FIIs, MFs, VCFs-Indian and Foreign) accounted for 13.19%.
Government Securities
The trading in non-repo government securities has been declining considerably since 2004-05. The aggregate trading volumes in central and state government dated securities on SGL declined from Rs. 3,982,988 million (US $ 91,374 million) in 2006-07 to Rs.5,003,047million (US $ 125,170 million) in 2007-08 (Table 1-8).
Derivatives Market
The number of instruments available in derivatives has been expanded. To begin with, SEBI only approved trading in index futures contracts based on Nifty 50 Index and BSE-30 (Sensex) Index. This was followed by approval for trading in options based on these indices and options on individual securities and also futures on interest rates derivative instruments (91-day Notional T-bills and 10-year Notional 6% coupon bearing as well as zero coupon bonds). On NSE, there are futures and options based on benchmark index Nifty 50, CNX IT Index, Bank Nifty Index, CNX Nifty Junior, CNX 100, Nifty Midcap 50 and S&P CNX Defty as well as futures and options on 263 single stocks as of December 2008. On BSE, Futures and Options are based on BSE 30 Sensex, BSE Teck, BSE Bankex, BSE Oil & Gas, BSE Metal and BSE FMCG, as well as futures and options on 119 single stocks. The mini derivative (futures and options) contracts on Nifty 50 and Sensex were introduced for trading on January 1, 2008 while the long term Options on Nifty 50 were launched on March 3, 2008. The futures and options on Defty were introduced on December 10, 2008.
The total exchange traded derivatives witnessed a value of Rs.133,327,869 million (US $ 3,335,698 million) during 2007-08 as against Rs. 74,152,780 million (US $ 1,701,142 million) during the preceding year. NSE proved itself as the
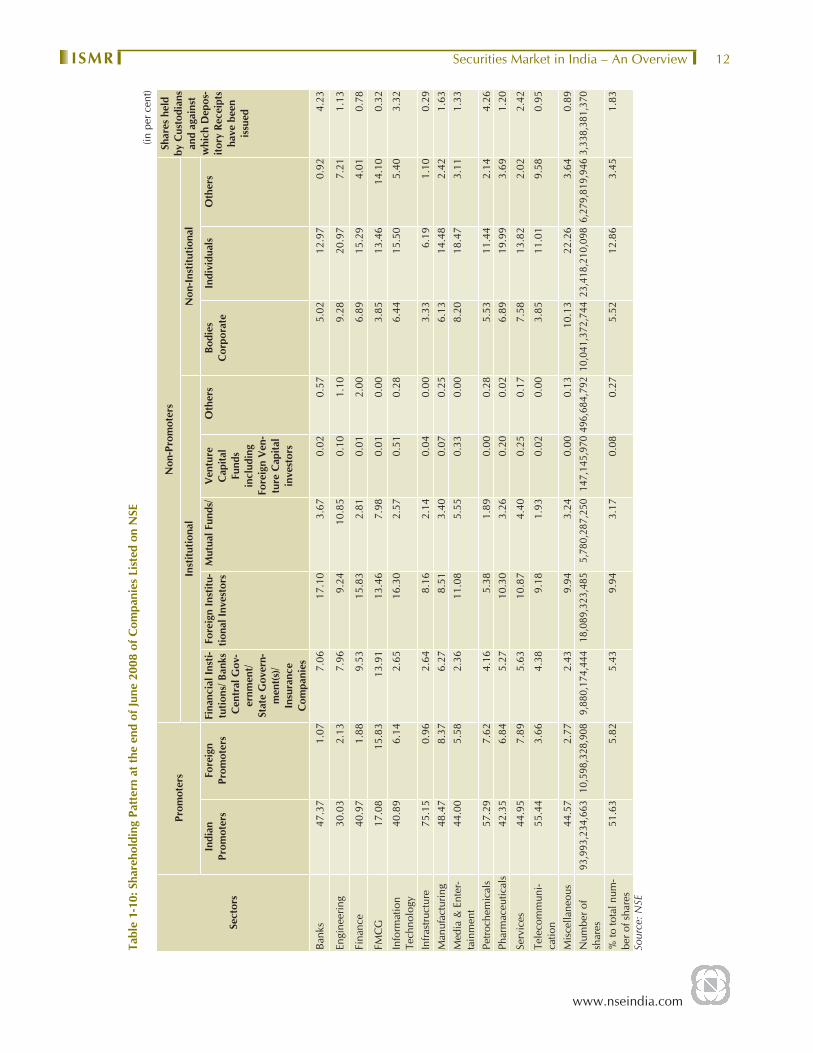
www.nseindia.com
Securities Market in India – An OverviewISMR 12
Tabl
e 1-
10: S
hare
hold
ing
Patt
ern
at th
e en
d of
June
200
8 of
Com
pani
es L
iste
d on
NSE
(in
per
cen
t)
Sect
ors
Prom
oter
sN
on-P
rom
oter
sSh
ares
hel
d by
Cus
todi
ans
and
agai
nst
whi
ch D
epos
-ito
ry R
ecei
pts
have
bee
n is
sued
Inst
itutio
nal
Non
-Inst
itutio
nal
Indi
an
Prom
oter
sFo
reig
n Pr
omot
ers
Fina
ncia
l Ins
ti-tu
tions
/ Ban
ks
Cen
tral
Gov
-er
nmen
t/ St
ate
Gov
ern-
men
t(s)/
Insu
ranc
e C
ompa
nies
For
eign
Inst
itu-
tiona
l Inv
esto
rs M
utua
l Fun
ds/
Ven
ture
C
apita
l Fu
nds
incl
udin
g Fo
reig
n V
en-
ture
Cap
ital
inve
stor
s
Oth
ers
Bodi
es
Cor
pora
teIn
divi
dual
sO
ther
s
Bank
s 4
7.37
1
.07
7.0
6 1
7.10
3
.67
0.02
0.5
7 5
.02
12.
97
0.9
2 4
.23
Engi
neer
ing
30.
03
2.1
3 7
.96
9.2
4 1
0.85
0.
10 1
.10
9.2
8 2
0.97
7
.21
1.1
3
Fina
nce
40.
97
1.8
8 9
.53
15.
83
2.8
1 0.
01 2
.00
6.8
9 1
5.29
4
.01
0.7
8
FMC
G
17.
08
15.
83
13.
91
13.
46
7.9
8 0.
01 0
.00
3.8
5 1
3.46
1
4.10
0
.32
Info
rmat
ion
Tech
nolo
gy
40.
89
6.1
4 2
.65
16.
30
2.5
7 0.
51 0
.28
6.4
4 1
5.50
5
.40
3.3
2
Infra
stru
ctur
e 7
5.15
0
.96
2.6
4 8
.16
2.1
4 0.
04 0
.00
3.3
3 6
.19
1.1
0 0
.29
Man
ufac
turin
g 4
8.47
8
.37
6.2
7 8
.51
3.4
0 0.
07 0
.25
6.1
3 1
4.48
2
.42
1.6
3 M
edia
& E
nter
-ta
inm
ent
44.
00
5.5
8 2
.36
11.
08
5.5
5 0.
33 0
.00
8.2
0 1
8.47
3
.11
1.3
3
Petro
chem
ical
s 5
7.29
7
.62
4.1
6 5
.38
1.8
9 0.
00 0
.28
5.5
3 1
1.44
2
.14
4.2
6 Ph
arm
aceu
tical
s 4
2.35
6
.84
5.2
7 1
0.30
3
.26
0.20
0.0
2 6
.89
19.
99
3.6
9 1
.20
Serv
ices
4
4.95
7
.89
5.6
3 1
0.87
4
.40
0.25
0.1
7 7
.58
13.
82
2.0
2 2
.42
Tele
com
mun
i-ca
tion
55.
44
3.6
6 4
.38
9.1
8 1
.93
0.02
0.0
0 3
.85
11.
01
9.5
8 0
.95
Mis
cella
neou
s 4
4.57
2
.77
2.4
3 9
.94
3.2
4 0.
00 0
.13
10.
13
22.
26
3.6
4 0
.89
Num
ber o
f sh
ares
93,9
93,2
34,6
63
10,5
98,3
28,9
08
9,88
0,17
4,44
4 18
,089
,323
,485
5,
780,
287,
250
147,
145,
970
496,
684,
792
10,0
41,3
72,7
44 2
3,41
8,21
0,09
8 6,
279,
819,
946
3,33
8,38
1,37
0
% to
tota
l num
-be
r of s
hare
s51
.63
5.82
5.43
9.94
3.17
0.08
0.27
5.52
12.8
63.
451.
83
Sour
ce: N
SE

www.nseindia.com
Securities Market in India – An Overview ISMR13
market leader contributing 98.18 % of the total turnover in 2007-08 in India. Not only in Indian scenario, but also in the global market NSE has created a niche for itself in terms of derivatives trading in various instruments (discussed in detail with statistics in chapter 7 on derivatives of this publication).
Recent initiatives and developments in Indian Securities Markets
Corporatisation and Demutualization of Stock Exchanges
To improve the governance mechanism of stock exchanges and to protect the interest of investors in securities market, corporatisation and demutualization of stock exchanges was mandated through an amendment to the Securities law in 2004. The benefi ts of demutualisation, other than correcting the confl icts of interests situation in governance of stock exchanges, include streamlining of business operations consistent with market needs, streamlined decision making by a professional management and capacity to raise capital which can be used to improve technology, seek innovations or acquisition of other markets.
Out of the 23 stock exchanges, 18 have since been corporatized and demutualised in 2007-08. One stock exchange, i.e. Hyderabad Stock Exchange, failed to demutualise by the due date and has therefore been de-recognized. Saurashtra Kutch Stock exchange, Mangalore Stock exchange and Magadh Stock exchange have been de-recognized for various irregularities/non compliances. As regards Coimbatore Stock Exchange which had sought voluntary withdrawal of recognition, the matter is sub-judice.
Corporate Bond Markets
The Government and regulators have well recognized that a well developed corporate bond market is essential for fi nancial system effi ciency, stability and overall economic growth. A well functioning bond market provides for fi nancial diversifi cation and facilitates necessary fi nancing not only for AAA-rated corporates but also less well known, sub-investment grade corporates and infrastructure developers. Considering that this market is not well developed in the country, the Government had set up a High-Level Expert Committee on Corporate Bonds and Securitisation (Patil Committee) to look in to legal, regulatory, tax and market design issues in the development of the corporate bond market. The Committee submitted its report to the Government in December, 2005. The Budget of 2006-07 announced that the Government has accepted the recommendations of the Report and that steps would be taken to create a single, unifi ed exchange-traded market for corporate bonds. The measures already taken in respect of implementation of the recommendations of the Patil Committee include:
(a) Amendment to the Securities Contracts (Regulation) Act, 1956 to include securitized instruments within the ambit of ‘securities’. (b) Amendment to the RBI Act to empower RBI to develop and regulate market for Repos in corporate bonds; (c) Enhancement of limit of FII Investment in corporate debt from US$ 0.5 bn to US$ 1.5 bn and further to US $ 3 bn.;(d) operationalising of trade reporting and trading platforms for corporate bonds at the major exchanges; (e) Waiver of TDS from corporate bonds traded on exchanges.
Foreign investment in stock exchanges
Foreign Investment upto 49% has been allowed in December 2006 in infrastructure companies in the securities markets, viz. stock exchanges, depositories and clearing corporations, with separate Foreign Direct Investment (FDI) cap of 26% and Foreign Institutional Investment (FII) cap of 23%.
National Institute of Securities Markets (NISM)
In the Budget of 2005-06, SEBI was authorized to set up NISM for teaching and training intermediaries in the securities markets and promoting research. NISM has since been set up and is functional. It has been set up as a public trust and is located in Mumbai, India.
The SEBI, by establishing NISM, has envisioned a large and far reaching vision to articulate the desire expressed by
www.nseindia.com
Securities Market in India – An OverviewISMR 14
the Indian government to promote securities market education and research. This vision presents an all encompassing educational initiative relevant for the securities markets of emerging nations. This is the fi rst unifi ed attempt of such magnitude and comprehension in the securities markets anywhere. It is a unique experiment in development of new branch of knowledge relevant for emerging securities markets. Towards accomplishing the desire of Government of India and vision of SEBI, NISM has launched an effort to deliver fi nancial and securities education at various levels and across various segments in India and abroad.
Securities Contracts (Regulation) Amendment Act, 2007
It was recognized that in India, the market for securitised debt remains underdeveloped. Despite two major initiatives, namely, the amendment of the National Housing Bank Act, 1987 (NHB Act) in 2000; and enactment of the Securitisation and Reconstruction of Financial Assets and Enforcement of Security Interest Act, 2002 (SARFAESI Act), the market did not pick up because the facility of trading on stock exchanges was not available. This was, in part due to the fact that securitisation transactions under the NHB Act were not covered under the defi nition of ‘securities’ in the SCR Act. As a result, buyers of securitised fi nancial instruments have few exit options.
Thus, the Securities Contracts Regulation Act, 1956 was amended in 2007 to include securitised instruments under the defi nition of ‘securities’ and provide for disclosure based regulation for issue of the securitized instruments and the procedure thereof. This has been done keeping in view that there is considerable potential in the securities market for the certifi cates or instruments under securitisation transactions. The development of the securitised debt market is critical for meeting the huge requirements of the infrastructure sector, particularly housing sector, in the country. Replication of the securities markets framework for these instruments would facilitate trading on stock exchanges and in turn help development of the market in terms of depth and liquidity.
PAN as the sole identifi cation number
The need for a Unique Identifi cation Number (UIN) for market participants in the securities markets was felt in the interest of enforcement action. Presently, a person has variety of identifi cation numbers such as Permanent Account Number (PAN) from CBDT, Depository Account Numbers from respective depositories, Bank Account Numbers from respective banks, MAPIN from SEBI, Unique Client Code from Exchanges, Director Identifi cation Number from MCA, etc. and there is no arrangement to link these numbers.
It was felt that the PAN issued by the CBDT could be a UIN for market participants. A PAN could identify all participants and the account managers (Depositories, Banks, Exchanges, Insurance Companies, Pension Fund Managers, Post Offi ces, and Intermediaries etc.) must use these numbers. Following a budget announcement to this effect in the budget of 2007-08, SEBI has declared PAN the sole identifi cation number for all transactions in securities market. It is an investor friendly measure as he does not have to maintain different identifi cation numbers for different kinds of transactions/different segments in fi nancial markets.
In the Budget of 2008-09 it was proposed that the requirement of PAN be extended to all transactions in the fi nancial market subject to suitable threshold exemption limits.
IPO grading
SEBI has made it compulsory for companies coming out with IPOs of equity shares to get their IPOs graded by at least one credit rating agency registered with SEBI from May 1, 2007. This measure is intended to provide the investor with an informed and objective opinion expressed by a professional rating agency after analyzing factors like business and fi nancial prospects, management quality and corporate governance practices etc. The grading would be disclosed in the prospectus, abridged prospectus and in every advertisement for IPOs.
Real Estate Mutual Funds
After careful and detailed deliberations and consultation process, SEBI approved the launch of Real Estate Mutual funds (REMFs) and accordingly made necessary amendments to the SEBI (Mutual Fund) Regulations 1996 in April, 2008.
www.nseindia.com
Securities Market in India – An Overview ISMR15
This product would allow retail investors to invest in real estate in a much more fl exible and convenient manner. A REMF has investment objective to invest directly or indirectly in real estate property. Real estate the largest asset class in the world, may serve as a hedge against other asset classes like debt or equity. By including it in ones portfolio, an investor reduces risk and can achieve stable returns. Unlike other asset classes, real estate rarely earns negative returns, and does not suffer high volatility. Over years, the value of real estate usually increases manifold. This also makes it a good hedge against infl ation. Real estate is a good long-term investment.
New derivative products
The Mini derivative Futures & Options contract was introduced for trading on S&P CNX Nifty on January 1, 2008 while the long term option contracts on S&P CNX Nifty were introduced for trading on March 3, 2008.
Volatility Index
With rapid changes in volatility in securities market from time to time, a need was felt for an openly available and quoted measure of market volatility in the form of an index to help market participants. On January 15, 2008, Securities and Exchange Board of India recommended Exchange to construct and disseminate the volatility index. Volatility Index is a measure, of the amount by which an underlying Index is expected to fl uctuate, in the near term, (calculated as annualised volatility, denoted in percentage e.g. 20%) based on the order book of the underlying index options. On April 08, 2008, NSE launched the Volatility Index, India VIX, based on the Nifty 50 Index Option prices. From the best bid-ask prices of Nifty 50 Options contracts, a volatility fi gure (%) is calculated which indicates the expected market volatility over the next 30 calendar days. The India VIX is a simple but useful tool in determining the overall volatility of the market
Short selling
There were regulatory restrictions in the Indian markets which enabled only retail investors to short sell. Thus, there was no level playing fi eld between various classes of investors. A need was felt to bridge this gap and provide equal leveraging opportunities for all classes of investors.
After due consultation process the SEBI laid down the broad framework to permit all classes of investors to short sell, in December, 2007. Certain conditions were imposed on the FIIs while undertaking a short selling transaction. These, inter-alia, include that borrowing of equity shares by FIIs would only be for the purpose of delivery into short sale and that the margin / collateral would be maintained by FIIs only in the form of cash. Simultaneously, the scope of the existing securities lending and borrowing scheme was widened into a full-fl edged lending and borrowing scheme enabling participation of all classes of investors, including retail investors. This short selling and securities lending and borrowing scheme was operationalised with effect from April 21, 2008.
Investment options for Navaratna and Miniratna Public Sector Enterprises
The Navaratna and Miniratna Public Sector Enterprises have been allowed to invest in public sector mutual funds subject to the condition that they would not invest more than 30% of the available surplus funds in equity mutual funds and the Boards of PSEs would decide the guidelines, procedures and management control systems for such investment in consultation with their administrative Ministries.
Investor Protection and Education Fund (IPEF)
SEBI has set up the Investor Protection and Education Fund (IPEF) with the purpose of investor education and related activities. SEBI has contributed a sum of Rs.10 crore toward the initial corpus of the IPEF from the SEBI General Fund. In addition following amounts will also be credited to the IPEF namely: (i) Grants and donations given to IPEF by the Central Government, State Governments or any institution approved by SEBI for the purpose of the IPEF;(ii) Interest or other income received out of the investments made from the IPEF; and (iii) Such other amount that SEBI may specify in the interests of the investors.
www.nseindia.com
Securities Market in India – An OverviewISMR 16
Direct Market Access
During April 2008, Securities & Exchange Board of India (SEBI) allowed the direct market access (DMA) facility to the institutional investors. DMA allows brokers to offer clients direct access to the exchange trading system through the broker’s infrastructure without manual intervention by the broker. DMA facility give clients direct control over orders, help in faster execution of orders, reduce the risk of errors from manual order entry and lend greater transparency and liquidity. DMA also leads to lower impact cost for large orders, better audit trails and better use of hedging and arbitrage opportunities through the use of decision support tools/algorithms for trading.
Cross Margining
Many trading members undertake transactions on both the cash and derivative segments of an Exchange. They keep separate deposits with the exchange for taking positions in two different segments. In order to improve the effi ciency of the use of the margin capital by market participants SEBI introduced cross margining for institutional investors in May 2008.
In December 2008, SEBI extended the cross margin facility across Cash and F&O segment to all the market participants. The salient features of cross margining are as under :
1. Cross margin is available across Cash and F&O segment and to all categories of market participants.
2. The positions of clients in both the Cash and F&O segments to the extent they offset each other shall be considered for the purpose of cross margining as per the following priority.
a) Index futures and constituent stock futures in F&O segment. b) Index futures and constituent stock positions in Cash segment. c) Stock futures in F&O segment and stock positions in Cash segment.
3. In order to extend the cross margin benefi t as per 2 (a) and (b) above, the basket of constituent stock futures/ stock positions shall be a complete replica of the index futures.
4. The positions in F&O segment for stock futures and index futures shall be in the same expiry month to be eligible for cross margin benefi t.
5. Positions in option contracts shall not be considered for cross margining benefi t.
6. The Computation of cross margin shall be at client level on an on-line real time basis.
7. For institutional investors the positions in Cash segment shall be considered only after confi rmation by the custodian on T+1 basis and on confi rmation by the clearing member in F&O segment.
8. The positions in the Cash and F&O segment shall be considered for cross margining only till the time the margins are levied on such positions.
9. The positions which are eligible for offset, shall be subject to spread margins. The spread margins shall be 25% of the applicable upfront margins on the offsetting positions
ASBA
To make the existing public issue process more effi cient, SEBI introduced a supplementary process of applying in public issues, viz, the ‘Applications Supported by Blocked Amount (ASBA) in July 2008. ASBA is an application containing an authorization to block the application money in the bank account, for subscribing to an issue. If an investor is applying through ASBA, his application money is debited from the bank account only if his/her application is selected for allotment after the basis of allotment is fi nalized, or the issue is withdrawn/failed .In case of rights issue his application money is debited from the bank account after the receipt of instruction from the registrars. The ASBA process is available in all public issues made through the book building route. In September 2008, the ASBA facility was extended to Rights Issue.

www.nseindia.com
Securities Market in India – An Overview ISMR17
Initiatives in the pipeline
Equity Finance for the Small and Medium Enterprises (SMEs)
SMEs in India have traditionally relied on debt fi nancing from banks and non-bank fi nancial institutions. In order to develop the equity market for SMEs, SEBI has decided to the creation of a separate exchange for the SMEs. It has decided that, to begin with there should be a single exchange for the SME sector for around 2-3 years to enable successful development of the market for SMEs.
In recognition of the need for making fi nance available to needy small and medium enterprises, the SEBI Board has decided to encourage promotion of dedicated exchanges and/or dedicated platforms of the exchanges for listing and trading of securities issued by SMEs. Multiple exchanges or platforms would provide the necessary competition in this space. SEBI will come out with a suitable framework for recognition and supervision of such exchanges/platforms. The enterprises with a post issue paid up capital of upto Rs. 25 crore would be listed on such exchanges / platforms and trading lot would be Rs. 1 lakh.
Framework for delisting of securities
The Securities Laws (Amendment) Act enacted in 2005 allowed delisting of securities necessitating the creation of a delisting framework. In order to provide statutory backing to delisting framework, Rules and Regulations are being fi nalized by the regualators. A simplifi ed procedure for delisting for small companies is being put in place.
Research in Securities MarketIn order to deepen the understanding and to assist in policy-making, SEBI has been promoting high quality research in the Indian capital market. Its monthly bulletin carries research articles pertaining to issues in the capital market. In order to improve market effi ciency further and to set international benchmarks in the securities industry, NSE also administers a scheme called the NSE Research Initiative. The objective of this initiative is to foster research to better design market microstructure. The NSE Research Initiative has so far come out with 44 Working Papers.
Testing and Certifi cation
With a view to improve the quality of intermediation, a system of testing and certifi cation has been used in some of the developed and developing markets. This ensures that a person dealing with fi nancial products has a minimum knowledge about them, the markets and regulations. As a result, not only the intermediaries benefi t due to the improvement in the quality of their services, but also the career prospectus of the certifi ed professionals is better. Thus, the confi dence of the investors in the market increases.
NSE has evolved a testing and certifi cation mechanism known as the National Stock Exchange’s Certifi cation in Financial Markets (NCFM). It is an on-line fully automated nation-wide testing and certifi cation system where the entire process from generation of question paper, testing, assessing, scores reporting and certifying is fully automated. It tests practical knowledge and skills, that are required to operate in fi nancial markets. A certifi cate is awarded to those personnel who qualify the tests, which indicates that they have a proper understanding of the market and skills to service different constituents of the market. It offers 17 securities market related modules.
Role of NSE in Indian Securities MarketIn Union of India Vs. Allied International Products Ltd. [ (1971) 41 Comp Cas 127 SC]: (1970) 3 SCC 5941), the Supreme Court of India has enunciated the role of the Stock Exchanges in these words:
“A Stock Exchange fulfi lls a vital function in the economic development of a nation: its main function is to ‘liquify’ capital by enabling a person who has invested money in, say a factory or railway, to convert it into cash by disposing off his shares in the enterprise to someone else. Investment in Joint stock companies is attractive to the public, because the value of the shares is announced day after day in the stock exchanges, and shares quoted on the exchanges are capable

www.nseindia.com
Securities Market in India – An OverviewISMR 18
of almost immediate conversion into money. In modern days a company stands little chance of inducing the public to subscribe to its capital, unless its shares are quoted in an approved stock exchange. All public companies are anxious to obtain permission from reputed exchanges for securing quotations of their shares and the management of a company is anxious to inform the investing public that the shares of the company will be quoted on the stock exchange”.
The stock exchange is really an essential pillar of the private sector corporate economy. It discharges three essential functions:
• First, the stock exchange provides a market place for purchase and sale of securities viz. shares, bonds, debentures etc. It, therefore, ensures the free transferability of securities which is the essential basis for the joint stock enterprise system.
• Secondly, the stock exchange provides the linkage between the savings in the household sector and the investment in the corporate economy. It mobilizes savings, channelises them as securities into these enterprises which are favoured by the investors on the basis of such criteria as future growth prospects, good returns and appreciation of capital.
• Thirdly, by providing a market quotation of the prices of shares and bonds- a sort of collective judgment simultaneously reached by many buyers and sellers in the market- the stock exchange serves the role of a barometer, not only of the state of health of individual companies, but also of the nation’s economy as a whole.
National Stock Exchange of India (NSE) was given recognition as a stock exchange in April 1993. NSE was set up with the objectives of (a) establishing a nationwide trading facility for all types of securities, (b) ensuring equal access to all investors all over the country through an appropriate communication network, (c) providing a fair, effi cient and transparent securities market using electronic trading system, (d) enabling shorter settlement cycles and book entry settlements and (e) meeting the international benchmarks and standards. Within a short span of time, above objectives have been realized and the Exchange has played a leading role as a change agent in transforming the Indian Capital Markets to its present form.
NSE has set up infrastructure that serves as a role model for the securities industry in terms of trading systems, clearing and settlement practices and procedures. The standards set by NSE in terms of market practices, products, technology and service standards have become industry benchmarks and are being replicated by other market participants. It provides screen-based automated trading system with a high degree of transparency and equal access to investors irrespective of geographical location. The high level of information dissemination through on-line system has helped in integrating retail investors on a nation-wide basis. The Exchange currently operates four market segments, namely Capital Market Segment, Wholesale Debt Market Segment, Futures an Options segment and the Currency Derivatives Segment.
NSE has been playing the role of a catalytic agent in reforming the market in terms of microstructure and market practices. Right from its inception, the exchange has adopted the purest form of demutualised set up whereby the ownership, management and trading rights are in the hands of three different sets of people. This has completely eliminated any confl ict of interest and helped NSE to aggressively pursue policies and practices within a public interest framework. It has helped in shifting the trading platform from the trading hall in the premises of the exchange to the computer terminals at the premises of the trading members located country-wide and subsequently to the personal computers in the homes of investors. Settlement risks have been eliminated with NSE’s innovative endeavors in the area of clearing and settlement viz., reduction of settlement cycle, professionalisation of the trading members, fi ne-tuned risk management system, dematerialisation and electronic transfer of securities and establishment of clearing corporation. As a consequence, the market today uses the state-of-art information technology to provide an effi cient and transparent trading, clearing and settlement mechanism.
NSE provides a trading platform for of all types of securities-equity and debt, corporate government and derivatives. On its recognition as a stock exchange under the Securities Contracts (Regulation) Act, 1956 in April 1993, it commenced operations in the Wholesale Debt Market (WDM) segment in June 1994, in the Capital Market (CM) segment in November 1994, in Futures & Options (F&O) segment in June 2000 and in Currency Derivative segment (CDS) in August 2008. The Exchange started providing trading in retail debt of Government Securities in January 2003. During

www.nseindia.com
Securities Market in India – An Overview ISMR19
the year 2007-08, it accounted for over 90 % of total trading value (debt, derivatives and equity) in the stock exchanges and 69% in equities and more than 98% in derivatives.
The Wholesale Debt Market segment provides the trading platform for trading of a wide range of debt securities. Its product, which is now disseminated jointly with FIMMDA, the FIMMDA NSE MIBID/MIBOR is used as a benchmark rate for majority of deals struck for Interest Rate Swaps, Forwards Rate Agreements, Floating Rate Debentures and Term Deposits in the country. Its ‘Zero Coupon Yield Curve’ as well as NSE-VaR for Fixed Income Securities have also become very popular for valuation of sovereign securities across all maturities irrespective of its liquidity and facilitated the pricing of corporate papers and GOI Bond Index.
NSEs Capital Market segment offers a fully automated screen based trading system, known as the National Exchange for Automated Trading (NEAT) system, which operates on a strict price/time priority. It enables members from across the country to trade simultaneously with enormous ease and effi ciency.
NSEs Futures & Options segment provides trading of a wide range of derivatives like Index Futures, Index Options, Stock Options and Stock Futures.
NSEs Currency Derivatives segment provides trading on currency futures contracts on the USD-INR which commenced on August 29, 2008.
Market Segments – Selected Indicators
Segment
At the end of March 2008 2007-08No. of Members No. of Securities
AvailableMarket
Capitalisation (Rs. mn.)
Trading Volume (Rs. mn.)
Market Share (%)
CM 1,069 1,236 a 48,581,217 35,510,382 69
WDM 62 3,566 2,123,346 2,823,170 46b
F&O 942 23,466 c -- 130,904,779 d 98
Total 1,075e 28,268 50,704,563 169,238,331 90f
a. Excludes suspended securities.b. Share in SGLc. 3 Nifty index futures, 3 CNX IT futures, 3 Bank Nifty futures, 3 CNX 100 futures, 3 Nifty Junior Index Futures, 3 Nifty Midcap
50 futures, 3 Mini Nifty Futures, 520 Nifty index options, 681 stock futures, 124 CNX IT options, 296 Bank Nifty options, 146 CNX 100 options, 312 Nifty Junior Index options, 112 Nifty Midcap 50 options, 142 Mini Nifty Options, 21,094 stock options and 18 interest rate futures contracts.
d. includes notional turnover [(strike price + premium) × quantity] in index options and stock options.e. Do not add up to total because of multiple membership.f. Share in turnover on all exchanges.
Technology and Application Systems in NSETechnology has been the backbone of the Exchange. Providing the services to the investing community and the market participants using technology at the cheapest possible cost has been its main thrust. NSE chose to harness technology in creating a new market design. It believes that technology provides the necessary impetus for the organisation to retain its competitive edge and ensure timeliness and satisfaction in customer service. In recognition of the fact that technology will continue to redefi ne the shape of the securities industry, NSE stresses on innovation and sustained investment in technology to remain ahead of competition. NSE is the fi rst exchange in the world to use satellite communication technology for trading. It uses satellite communication technology to energize participation from about 2,956 VSATs from nearly 245 cities spread all over the country. The list of towns and cities and the state-wise distribution of VSATs as at end March 2008 is presented in (Table 1-11).
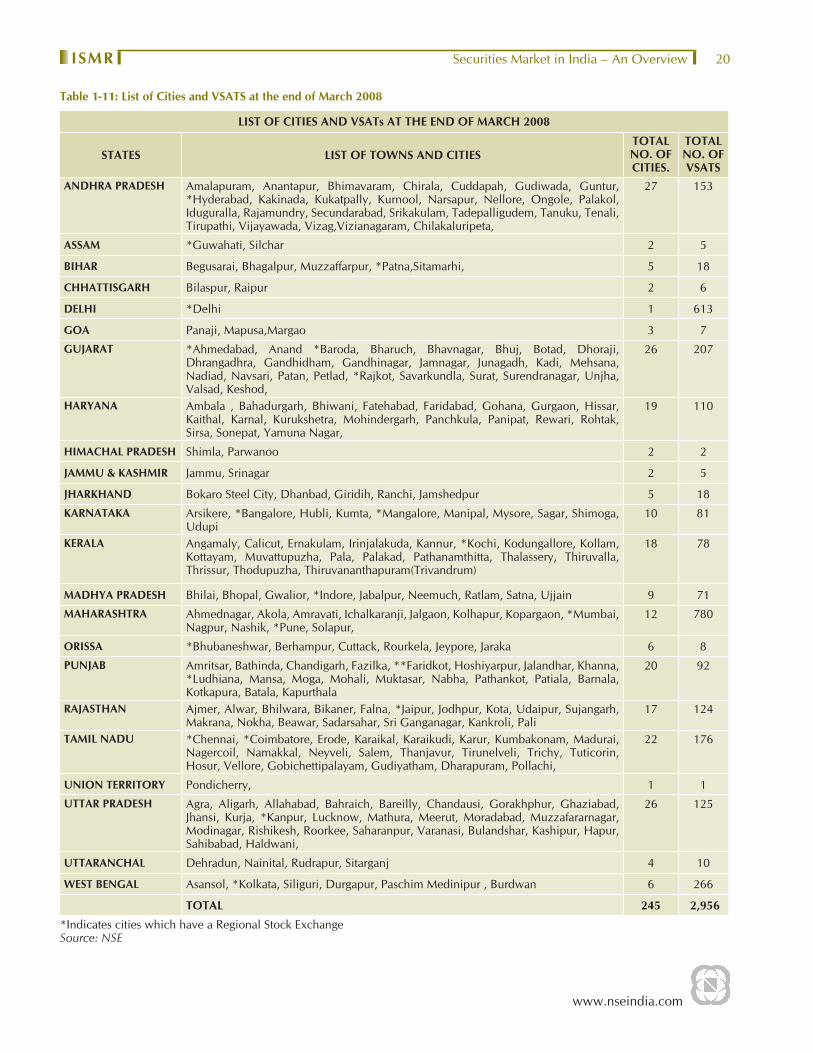
www.nseindia.com
Securities Market in India – An OverviewISMR 20
Table 1-11: List of Cities and VSATS at the end of March 2008
LIST OF CITIES AND VSATs AT THE END OF MARCH 2008
STATES LIST OF TOWNS AND CITIESTOTAL NO. OF CITIES.
TOTAL NO. OF VSATS
ANDHRA PRADESH Amalapuram, Anantapur, Bhimavaram, Chirala, Cuddapah, Gudiwada, Guntur, *Hyderabad, Kakinada, Kukatpally, Kurnool, Narsapur, Nellore, Ongole, Palakol, Iduguralla, Rajamundry, Secundarabad, Srikakulam, Tadepalligudem, Tanuku, Tenali, Tirupathi, Vijayawada, Vizag,Vizianagaram, Chilakaluripeta,
27 153
ASSAM *Guwahati, Silchar 2 5
BIHAR Begusarai, Bhagalpur, Muzzaffarpur, *Patna,Sitamarhi, 5 18
CHHATTISGARH Bilaspur, Raipur 2 6
DELHI *Delhi 1 613
GOA Panaji, Mapusa,Margao 3 7
GUJARAT *Ahmedabad, Anand *Baroda, Bharuch, Bhavnagar, Bhuj, Botad, Dhoraji, Dhrangadhra, Gandhidham, Gandhinagar, Jamnagar, Junagadh, Kadi, Mehsana, Nadiad, Navsari, Patan, Petlad, *Rajkot, Savarkundla, Surat, Surendranagar, Unjha, Valsad, Keshod,
26 207
HARYANA Ambala , Bahadurgarh, Bhiwani, Fatehabad, Faridabad, Gohana, Gurgaon, Hissar, Kaithal, Karnal, Kurukshetra, Mohindergarh, Panchkula, Panipat, Rewari, Rohtak, Sirsa, Sonepat, Yamuna Nagar,
19 110
HIMACHAL PRADESH Shimla, Parwanoo 2 2
JAMMU & KASHMIR Jammu, Srinagar 2 5
JHARKHAND Bokaro Steel City, Dhanbad, Giridih, Ranchi, Jamshedpur 5 18
KARNATAKA Arsikere, *Bangalore, Hubli, Kumta, *Mangalore, Manipal, Mysore, Sagar, Shimoga, Udupi
10 81
KERALA Angamaly, Calicut, Ernakulam, Irinjalakuda, Kannur, *Kochi, Kodungallore, Kollam, Kottayam, Muvattupuzha, Pala, Palakad, Pathanamthitta, Thalassery, Thiruvalla, Thrissur, Thodupuzha, Thiruvananthapuram(Trivandrum)
18 78
MADHYA PRADESH Bhilai, Bhopal, Gwalior, *Indore, Jabalpur, Neemuch, Ratlam, Satna, Ujjain 9 71
MAHARASHTRA Ahmednagar, Akola, Amravati, Ichalkaranji, Jalgaon, Kolhapur, Kopargaon, *Mumbai, Nagpur, Nashik, *Pune, Solapur,
12 780
ORISSA *Bhubaneshwar, Berhampur, Cuttack, Rourkela, Jeypore, Jaraka 6 8
PUNJAB Amritsar, Bathinda, Chandigarh, Fazilka, **Faridkot, Hoshiyarpur, Jalandhar, Khanna, *Ludhiana, Mansa, Moga, Mohali, Muktasar, Nabha, Pathankot, Patiala, Barnala, Kotkapura, Batala, Kapurthala
20 92
RAJASTHAN Ajmer, Alwar, Bhilwara, Bikaner, Falna, *Jaipur, Jodhpur, Kota, Udaipur, Sujangarh, Makrana, Nokha, Beawar, Sadarsahar, Sri Ganganagar, Kankroli, Pali
17 124
TAMIL NADU *Chennai, *Coimbatore, Erode, Karaikal, Karaikudi, Karur, Kumbakonam, Madurai, Nagercoil, Namakkal, Neyveli, Salem, Thanjavur, Tirunelveli, Trichy, Tuticorin, Hosur, Vellore, Gobichettipalayam, Gudiyatham, Dharapuram, Pollachi,
22 176
UNION TERRITORY Pondicherry, 1 1
UTTAR PRADESH Agra, Aligarh, Allahabad, Bahraich, Bareilly, Chandausi, Gorakhphur, Ghaziabad, Jhansi, Kurja, *Kanpur, Lucknow, Mathura, Meerut, Moradabad, Muzzafararnagar, Modinagar, Rishikesh, Roorkee, Saharanpur, Varanasi, Bulandshar, Kashipur, Hapur, Sahibabad, Haldwani,
26 125
UTTARANCHAL Dehradun, Nainital, Rudrapur, Sitarganj 4 10
WEST BENGAL Asansol, *Kolkata, Siliguri, Durgapur, Paschim Medinipur , Burdwan 6 266
TOTAL 245 2,956
*Indicates cities which have a Regional Stock ExchangeSource: NSE

www.nseindia.com
Securities Market in India – An Overview ISMR21
Its trading system, called National Exchange for Automated Trading (NEAT), is a state of-the-art client server based application. At the server end all trading information is stored in an in-memory database to achieve minimum response time and maximum system availability for users. It has uptime record of 99.7%. For all trades entered into NEAT system, there is uniform response time of less than 1.5 seconds. NSE has been continuously undertaking capacity enhancement measures so as to effectively meet the requirements of increased users and associated trading loads. NSE has also put in place NIBIS (NSEs Internet Based Information System) for on-line real-time dissemination of trading information over the Internet.
As part of its business continuity plan, NSE has established a disaster back-up site at Chennai along with its entire infrastructure, including the satellite earth station and the high-speed optical fi bre link with its main site at Mumbai. This site at Chennai is a replica of the production environment at Mumbai. The transaction data is backed up on near real time basis from the main site to the disaster back-up site through the 2 mbps high-speed link to keep both the sites all the time synchronised with each other.
The various application systems that NSE uses for its trading as well clearing and settlement and other operations form the backbone of the Exchange. The application systems used for the day-to-day functioning of the Exchange can be divided into (a) Front end applications and (b) Back offi ce applications.
In the front offi ce, there are 6 applications:
(i) NEAT – CM system takes care of trading of securities in the Capital Market segment that includes equities, debentures/notes as well as retail Gilts. The NEAT – CM application has a split architecture wherein the split is on the securities and users. The application runs on two Stratus systems with Open Strata Link (OSL). The application has been benchmarked to support 15,000 users and handle more than 3 million trades daily. This application also provides data feed for processing to some other systems like Index, OPMS through TCP/IP. This is a direct interface with the trading members of the CM segment of the Exchange for entering the orders into the main system. There is a two way communication between the NSE main system and the front end terminal of the trading member.
(ii) NEAT – WDM system takes care of trading of securities in the Wholesale Debt Market (WDM) segment that includes Gilts, Corporate Bonds, CPs, T-Bills, etc. This is a direct interface with the trading members of the WDM segment of the Exchange for entering the orders/trades into the main system. There is a two way communication between the NSE main system and the front end terminal of the trading member.
(iii) NEAT – F&O system takes care of trading of securities in the Futures and Options (F&O) segment that includes Futures on Index as well as individual stocks and Options on Index as well as individual stocks. This is a direct interface with the trading members of the F&O segment of the Exchange for entering the orders into the main system. There is a two way communication between the NSE main system and the front end terminal of the trading member.
(iv) NEAT – IPO system is an interface to help the initial public offering of companies which are issuing the stocks to raise capital from the market. This is a direct interface with the trading members of the CM segment who are registered for undertaking order entry on behalf of their clients for IPOs. NSE uses the NEAT IPO system that allows bidding in several issues concurrently. There is a two way communication between the NSE main system and the front end terminal of the trading member.
(v) NEAT – MF system is an interface with the trading members of the CM segment for order collection of designated Mutual Funds units
(vi) NEAT – CD system is trading system for currency derivatives. Currently currency futures are trading in the segment.
The exchange also provides a facility to its members to use their own front end software through the CTCL (computer to computer link) facility. The member can either develop his own software or use products developed by CTCL vendors.
www.nseindia.com
Securities Market in India – An OverviewISMR 22
In the back offi ce, the following important application systems are operative:
(i) NCSS (Nationwide Clearing and Settlement System) is the clearing and settlement system of the NSCCL for the trades executed in the CM segment of the Exchange. The system has 3 important interfaces – OLTL (Online Trade loading) that takes each and every trade executed on real time basis and allocates the same to the clearing members, Depository Interface that connects the depositories for settlement of securities and Clearing Bank Interface that connects the 13 clearing banks for settlement of funds. It also interfaces with the clearing members for all required reports. Through collateral management system it keeps an account of all available collaterals on behalf of all trading/clearing members and integrates the same with the position monitoring of the trading/clearing members. The system also generates base capital adequacy reports.
(ii) FOCASS is the clearing and settlement system of the NSCCL for the trades executed in the F&O segment of the Exchange. It interfaces with the clearing members for all required reports. Through collateral management system it keeps an account of all available collaterals on behalf of all trading/clearing members and integrates the same with the position monitoring of the trading/clearing members. The system also generates base capital adequacy reports.
(iii) CDCSS is the clearing and settlement system for trades executed in the currency derivative segment. Through collateral management system it keep an account of all available collateral on behalf of all trading / clearing members and integrates the same with the position monitoring of the trading / cleaning members. The System also generate base capital adequacy report.
(iv) Surveillance system offers the users a facility to comprehensively monitor the trading activity and analyse the trade data online and offl ine.
(v) OPMS – the online position monitoring system that keeps track of all trades executed for a trading member vis-à-vis its capital adequacy.
(vi) PRISM is the parallel risk management system for F&O trades using Standard Portfolio Analysis (SPAN). It is a system for comprehensive monitoring and load balancing of an array of parallel processors that provides complete fault tolerance. It provides real time information on initial margin value, mark to market profi t or loss, collateral amounts, contract-wise latest prices, contract-wise open interest and limits. The system also tracks online real time client level portfolio base upfront margining and monitoring.
(vii) PRISM-CD is the risk management system of the currency derivatives segment. It is similar in features to the PRISM of F&O segment.
(viii) Data warehousing that is the central repository of all data in CM as well as F&O segment of the Exchange.
(ix) Listing system that captures the data from the companies which are listed in the Exchange for corporate governance and integrates the same to the trading system for necessary broadcasts for data dissemination process and
(x) Membership system that keeps track of all required details of the Trading Members of the Exchange.
The exchange operates and manages a nationwide network. This network of over 2000 VSATs and 3000 Leased Lines is being migrated from X.25 to IP from 2008 onwards and is expected to complete by early 2009. In the new IP network, members have an advantage of a more generic and latest IP protocol and an overall better design, in terms of bandwidth and resilience. Currently the network has over 2000 VSATs, 1500 Leased Lines and 9 POPs (Point of Presence) across the country.
NOW
NSE is also offering internet based trading services to NSE members. This facility is branded as NOW 'NEAT on Web'. NOW provides an internet portal for NSE members and their authorized clients to transact orders and trades to the various market of NSE viz. CM, F&O and Currency. The members can also access NOW through their existing VSAT/Leased line, in addition to internet links. The various features provided by NOW are:

www.nseindia.com
Securities Market in India – An Overview ISMR23
(a) Comprehensive Administration features
(b) Flexible Risk Management System
(c) High speed dealer terminals
(d) Online trading facility for investors
Policy debates1
Regulatory Impact Assessment (RIA)
Regulations for the securities markets are made by the Government and regulators to achieve the goal of a well functioning market area, with minimal confl icts of interests and ensuring investor protection. However, regulations may create unintended and unavoidable barriers for market players and may not be without costs of compliance. Also, these are reviewed from time to time based on changing market practices, changing mindset and ideology of the regulators.
However, when a new regulation in put in place or an existing regulation is reviewed, it may perhaps be desirable to assess and understand the alternatives available, the costs of compliance and enforcement, potential impact of new or changed regulation and whether it would achieve the desired objectives. In essence, some relevant questions on these lines need to be posed and answered to make any new regulation or revised regulation a success both with the regulated and the regulators. RIA is a tool that helps do this. RIA facilitates understanding of the impact of regulatory actions and enables integration of multiple policy objectives, improves transparency and consultation, and enhances accountability of governments and regulators. It not only brings the actions of decision-makers under public scrutiny and highlights how their decisions impact society as a whole, but also mandates greater information sharing by them.
RIA is essentially a document created before a new regulation is introduced or a regulation is modifi ed, systematically assessing the positive and negative impacts of the proposed regulation. It serves as a tool for regulatory reform.
International Practice
RIAs are produced in many countries, although their scope, content, role and infl uence on policy making vary. For example, The European Commission introduced an impact assessment system in 2002, integrating and replacing previous single-sector type of assessments. In the European Commission perspective, Impact Assessment (IA) is a process aimed at structuring and supporting the development of policies. It identifi es and assesses the problem at stake and the objectives pursued. It identifi es the main options for achieving the objective and analyses their likely impacts in the economic, environmental and social fi elds. It outlines advantages and disadvantages of each option and examines possible synergies and trade-offs.
In the United Kingdom, RIAs have been a key tool in helping improve the quality of regulation and reduce unnecessary burdens on business. RIAs have been produced by Central Government departments for many years using guidance produced by the Better Regulation Executive (BRE) in the Cabinet Offi ce. In May 2007 a new system of Impact Assessments (IAs) was introduced and made fully operational in November 2007. The aim of IAs is to help improve policy making by placing a greater emphasis on quantifying benefi ts and costs in the IA.
RIA has been adopted in most OECD (Organization for Economic Co-operation and Development) countries. RIA has also been undertaken in middle-income developing countries, especially South Korea and Mexico.
On the other hand, despite considerable interest in measuring the effectiveness of development policy and in the design and implementation of regulatory measures, the potential of RIA has neither been explored nor analysed in the developing countries and in their organizations involved in the design and formulation of development policy.
1 The views and approaches reflected in the policy debates are not necessarily of NSE.
www.nseindia.com
Securities Market in India – An OverviewISMR 24
Indian context
The High Level Expert Committee on Making Mumbai an International Financial Centre (HPEC on MIFC), which submitted its report to the Government in February 2007, has, among other things, recommended that adopting practice that is now normal in almost all OECD countries, the Government of India should conduct-using independent, impartial interlocutors, including regulators from other IFCs- a periodic RIA of the fi nancial regulatory regime. The RIA would aim to evaluate, using enhanced cost-benefi t methodology, how effi cient and cost effective extant regulation is in meeting the main regulatory objectives, and to understand what modifi cations are needed to improve it.
The Government and regulators need to decide on how to go about implementing this recommendation. It may perhaps be better if the impact assessment is integrated into the decision-making process from the stage of formulation of policies, acts and regulations, instead of later in the process simply to comply with externally imposed requirements. Among other things, integration would help the earlier consideration of alternative solutions and help weigh each ones cost and benefi ts.
Comprehensive regulations for intermediaries
Various intermediaries in the securities markets, including depositories, depository participants, custodians of securities, mutual funds, foreign institutional investors, credit rating agencies etc., are regulated under various regulations of SEBI. As each of these regulations was drafted in order to provide a framework which would enable SEBI to better regulate and monitor intermediaries/entities, the broad framework of such regulations is very similar to one another.
It was observed that every regulation seeking to regulate an intermediary incorporates some basic provisions regarding registration, general obligations, inspection and investigation, default etc. In addition to the above, the general requirements of the Code of Conduct provided in almost all the regulations are also similar in nature. Except for the clauses relating to the specifi c requirements of, and particular concerns in, each category, the content of all the regulations is common either in language or in spirit, if not in both.
Given the overlap in content and the fact that many requirements and obligations of most intermediaries are common, SEBI now proposes to consolidate the common requirements under these regulations and put in place a comprehensive regulation which will apply to all intermediaries and prescribe the obligations, procedure, limitations etc in so far as the common requirements are concerned. Some of the highlights of the proposed comprehensive regulations are:
• Registration is proposed to be made permanent for all intermediaries subject to compliance with law, updation of relevant disclosures and payment of annual fees.
• As updation is required either promptly or annually, thus more accurate fi ling of material developments is made available to SEBI and to the public.
• Conducting multiple activities by the same intermediary becomes a simpler process without reducing the regulatory rigours previously imposed.
• Substantial amounts of fi ling details will enter the public domain, thus allowing investors to assess the appropriateness of using the intermediary.
• The number of investor grievances not addressed beyond a particular period will need to be disclosed, thus incentivising early resolution of complaints by the intermediary.
• The code of conduct rules will be found in one place making compliance with the code easier.
• Consistency across regulation of various intermediaries stand improved.
• Fit and Proper person requirements are rationalized and inserted into these draft regulations.
• The intermediary shall prominently display the registration certifi cate and the name and contact details of the compliance offi cer to whom complaint may be made.
• Rationalization of prior approval upon change in status and constitution of the intermediary.
www.nseindia.com
Securities Market in India – An Overview ISMR25
The draft proposal of SEBI on the above lines was put out in public domain in July, 2007, seeking comments and suggestions before the same is fi nalized.
Principle vs Rule based regulation
India’s regulatory framework for securities markets, as for other fi nancial market segments, is rule based, i.e. it consists of a number of subordinate laws codifying detailed rules and regulations for these markets to function in an effi cient and effective manner. This approach to regulation has the following strengths. Firstly, it provides greater legal certainty to market players and secondly, it enables the market regulator to operate in a non-discretionary manner. However, it is contested that overly prescriptive rule-based regulations inhibit innovation, requires compliance offi cers to follow the rule book in letter while ignoring the spirit behind it and induces corrosive political economy where fi rms seek to infl uence the evolution of rules in their own favour.
The High Level Expert Committee on Making Mumbai an International Financial Centre (HPEC on MIFC) as well as Committee on Financial Sector Reforms (CFSR) have suggested a move towards “principle-based regulation” (PBR) in the fi nancial markets. PBR, which was fi rst introduced in the UK in 1997, involved less detailed prescription of what is allowed and what is not in every activity or less codifi cation, less rigidity of rule-book interpretation, and a greater reliance on practice and precedent. Under the PBR, the regulator articulates the broad principles on which markets should function. It fosters innovation, encourages greater competition among fi nancial fi rms and avoids the malpractices which occur when supervisors focus on rule-book compliance.
PBR approach to regulation can be termed as an approach based on getting the regulated to adhere to the spirit of the regulation while a “rules-based” approach is intent on the regulated obeying the letter of the regulation.
The CFSR points to the following benefi ts of PBR:
• A regulatory system with greater emphasis on principles would avoid the centralized micro-management of the day-to-day operations of enterprises, increasing their effi ciency and endowing them with greater nimbleness and agility to deal with a dynamic business landscape.
• It would help promote greater innovation in fi nancial fi rms operating in India, an increasingly necessary feature for survival and success in the new world economy.
• More focus on principles would also make better use of regulatory capacity. By shifting the onus of providing positive outcomes to the regulated, an emphasis on principles can generate a range of best practices from the regulated that would far outweigh the innovative capacity of the regulator. Its greatest benefi ts will come when the regulator learns from the regulated instead of imposing its own, more limited, views.
• Self regulation and confession by the regulated, a natural consequence of the shift in responsibility for regulatory outcomes to the regulated, would reduce the strains on regulatory capacity, and allow regulators to permit far more entry and growth in the system. As the relationship between the regulator and the regulated becomes more cooperative, effi ciency and stability in the system will improve.

www.nseindia.com
Primary MarketISMR 26
Primary Market
Introduction
Primary market provides opportunity to issuers of securities, Government as well as corporates, to raise resources to meet their requirements of investment and/or discharge some obligation. The issuers create and issue fresh securities in exchange of funds through public issues and/or as private placement. When equity shares are exclusively offered to the existing shareholders it is called ‘Rights Issue’ and when it is issued to selected mature and sophisticated institutional investors as opposed to general public it is called ‘Private Placement Issues’. Issuers may issue the securities at face value, or at a discount/premium and these securities may take a variety of forms such as equity, debt or some hybrid instruments. The issuers may issue securities in domestic market and /or international market through ADR/GDR/ECB route.
Trends
The issuers issue fresh securities through public issues as well as private placements. The resources, raised by them from domestic as well as international markets, are presented in (Table 2-1). During 2007-08, a total of Rs. 5,788,150 million (US $ 144,812 million) were mobilized (increase of 46.74% over the previous year) by both the government and corporate sector from the primary market through public issues and private placement. This chapter presents developments in primary market for corporate securities in India, both equity and debt, while the primary market for government securities is discussed separately in Chapter 6.
Table 2-1: Resource Mobilisation by Government and Corporate Sector
Issues(Rs. mn.) (US $ mn.)
2006-07 2007-08 2006-07 2007-08Corporate Securities 1,942,560 3,228,310 44,564 80,768 Domestic Issues 1,772,510 2,962,750 40,663 74,124
Public Issues 313,850 837,070 7,200 20,942
Non-Govt. Public Companies 306,030 636,380 7,021 15,921
PSU Bonds -- -- -- --
Govt. Companies -- 25,160 -- 629
Banks & FIs 7,820 175,530 179 4,392
Private Placement 1,458,660 2,125,680 33,463 53,182
Euro Issues 170,050 265,560 3,901 6,644
Government Securities 2,001,980 2,559,840 45,928 64,044
Central Government 1,793,730 1,882,050 41,150 47,087
State Governments 208,250 677,790 4,777 16,957
Total 3,944,540 5,788,150 90,492 144,812
Source: RBI Annual Report 2007-08-- : Nil/Negligible
www.nseindia.com
Primary Market ISMR27
After a long period of subdued activity, there were signs of revival in the public issues in 2003-04 and this state was maintained till the year 2007-08. The resources raised through public issues from the primary market by the corporate sector increased by 166.71%.
The private placement market accounted for 71.75% of the total resources mobilized domestically, whereas the public issues accounted for 28.25%. The resources raised by Indian corporates from the international capital market through the issuance of FCCBs, GDRs and ADRs have increased signifi cantly (56.17%) during 2007-08 raising Rs. 265,560 million (US $ 6,644 million) as against Rs. 170,050 million.(US $ 3,901 million) in the previous year.
Policy DevelopmentsI. Amendments to Clause 41 of Equity Listing Agreement
SEBI amended Clause 41 of the Equity Listing Agreement in July 2007 with a view to rationalize and modify the process and formats for submission of fi nancial results to the stock exchanges. The revised clause also contains other modifi cations aimed at improving the presentation of the sub-clauses. The highlights of the revised provision are:
(a) listed companies must furnish either unaudited or audited quarterly and year-to-date fi nancial results to the stock exchange within one month from the end of each quarter.
(b) if the un-audited results are furnished, they must be followed with a limited review report of the fi nancial status of the company. This is with a view to enable investors to know the performance of listed companies as early as possible
(c) simplifi cation of the provision for explanations in variation between items of un-audited and audited quarterly/year-to-date/annual results. The explanation for variation must be furnished for Net Profi t or Loss After Tax and for exceptional/extraordinary items. The percentage of variation for the purpose is revised from ‘20% or more’ to ‘10% or Rs.10 Lakhs, whichever is higher’. Through the amendment SEBI aims to rationalize and simplify the process and formats for submission of the fi nancial results to the stock exchanges and additionally, will enable investors to know the performance of listed companies at the earliest.
As regards the publication of fi nancial results, companies having subsidiaries who fi le both stand-alone and consolidated results to the stock exchange will now have an option to publish stand-alone or consolidated results, subject to the condition that a choice once exercised cannot be changed during the year. In case the company changes its option in any subsequent fi nancial year, it would be required to furnish comparative fi gures for the previous fi nancial year in accordance with the option exercised for the current year.
II. Amendment to Clause 49 of the Listing Agreement
In April 2008, SEBI modifi ed the Clause 49 of the Listing Agreement by including Mandatory and non-mandatory provisions.
Mandatory Provisions
1. If the non-executive Chairman is a promoter or is related to promoters or persons occupying management positions at the board level or at one level below the board, at least one-half of the board of the company should consist of independent directors.
2. Disclosures of relationships between directors inter-se shall be made in specifi ed documents/fi lings.
3. The gap between resignation/removal of an independent director and appointment of another independent director in his place shall not exceed 180 days. However, this provision would not apply in case a company fulfi ls the minimum requirement of independent directors in its Board, i.e., one-third or one-half as the case may be, even without fi lling the vacancy created by such resignation/removal.
4. The minimum age for independent directors shall be 21 years.

www.nseindia.com
Primary MarketISMR 28
Non-mandatory provisions:
The company is required to ensure that the person who is being appointed as an independent director has the requisite qualifi cations and experience which would be of use to the company and which, in the opinion of the company, would enable him to contribute effectively to the company in his capacity as an independent director.
III. Introduction of Applications Supported by Blocked Amount (ASBA) Process
To make the existing public issue process more effi cient, SEBI introduced a supplementary process of applying in public issues, viz, the ‘Applications Supported by Blocked Amount (ASBA) in July 2008. The ASBA process is available in all public issues made through the book building route. It would co-exist with the current process, wherein the cheque is used as a mode of payment. The main features of ASBA process are as follows:
Meaning of ASBA: ASBA is an application for subscribing to an issue, containing an authorisation to block the application money in a bank account.
Self Certifi ed Syndicate Bank (SCSB): SCSB is a bank which offers the facility of applying through the ASBA process. A bank desirous of offering ASBA facility is required to submit a certifi cate to SEBI as per the required format .
Eligiblity of Investors: An investor is eligible to apply through ASBA process, if he/she is a ‘Resident Retail Individual Investor’, is bidding at cut off with single option as to the number of shares bid for, is applying through blocking of funds in a bank account with SCSB, has agreed not to revise his/her bid, is not bidding under any of the reserved categories.
ASBA Process: An ASBA investor has to submit an ASBA physically or electronically through the internet banking facility, to the SCSB with whom the bank account to be blocked is maintained. The SCSB would then block the application money in the bank account specifi ed in the ASBA. The application money would remain blocked in the bank account till fi nalization of the basis of allotment in the issue or till withdrawl/failure of the issue or till withdrawal/rejection of the application as the case may be. The application data would thereafter be uploaded by the SCSB in the electronic bidding system through a web enabled interface provided by the Stock Exchange. Once the basis of allotment is fi nalized, the Registrar to the issue sends an appropriate request to the SCSB for unblocking the relevant bank accounts and for transferring the requisite amount to the issuer’s account. In case of withdrawal/failure of the issue, the amount is unblocked by the SCSB on receipt of information from the pre issue merchant bankers.
Obligation of the Issuer: The issuer has to ensure that adequate arrangements are made by the Registrar to the issue to obtain information about all ASBAs and to treat those applications similar to non-ASBA applications while fi nalizing the basis of allotment, as per the procedure specifi ed in the guidelines.
Applicability of ASBA Process: ASBA process is applicable to all book-built public issues which provide for not more than one payment option to the retail individual investors.
In September 2008, the ASBA facility was extended to Rights Issue. The ASBA facility is available to all shareholders of the Issuer Company and will not be available to non-shareholders. The facility will also co-exist with the current process wherein cheque/demand draft is used as a mode of payment. The shareholder of the issuer company should hold the shares in dematerialised (demat) form in order to apply through the ASBA method. This process allows the shareholders of the issuer company to apply through the ASBA process by sending in their applications to the Self Certifi ed Syndicate Bank (SCSB). The SCSB will then block the application amount in the bank account of the shareholder. The application money will remain blocked in the banks till the Registrar instructs the bank to release the funds. The Registrar will confi rm the applications and fi nalise the basis of allotment.
Market DesignThe primary market is governed by the provisions of the Companies Act, 1956, which deals with issues, listing and allotment of securities. Additionally the SEBI (Disclosure and Investor Protection) guidelines issued under the securities law prescribes a series of eligibility and disclosure norms to be complied by the issuer, promoter for accessing the market.

www.nseindia.com
Primary Market ISMR29
However, in this section we only discuss the market design as stipulated in the SEBI (DIP) guidelines. Disclosure and Investor Protection (DIP) Guidelines of SEBI, was issued in June 1992. SEBI has since then been issuing clarifi cations/amendments to these guidelines from time to time, in order to streamline the public issue process. The guidelines apply to all public issues, offer for sale, and rights issues by listed and unlisted companies.
Eligibility Norms
Any company issuing securities has to satisfy the following conditions at the time of fi ling the draft offer document and the fi nal offer document with SEBI and Registrar of Companies (RoCs)/Designated Stock Exchange respectively:
• fi le a draft prospectus with SEBI, through an eligible merchant banker, at least 30 days prior to the fi ling of prospectus with the Registrar Of Companies (RoCs).
• enter into an agreement with the depository for dematerialisation of its securities and should give an option to subscribers/shareholders/investors to receive the security certifi cates either in physical or in dematerialised form.
For a listed company the aggregate of the proposed issue and all previous issues made in the same fi nancial year in terms of issue size should not exceed 5 times its pre-issue net worth. In case of the change in name of the issuer company within the last 1 year, the revenue accounted for by the activity suggested by the new name should not be less than 50% of its total revenue in the preceding one full year period.
An unlisted company can make an IPO of equity shares or any other security, which may be converted into equity shares, only if it has a track record of profi tability and required net worth and net tangible assets. Some of the conditions are specifi ed hereunder:
(i) it has net tangible assets of at least Rs. 3 crore in each of the preceding 3 full years, of which not more than 50% is held in monetary assets; provided that if more than 50% of the net tangible assets are held in monetary assets, the company has made fi rm commitments to deploy such excess monetary assets in its business/project;
(ii) it has a net worth of at least Rs. 1 crore in each of the preceding 3 full years;
(iii) it has a track record of distributable profi ts in terms of section 205 of the Companies Act, 1956, for at least 3 out of the immediately preceding 5 years; Provided further that extraordinary items shall not be considered for calculating distributable profi ts in terms of section 205 of Companies Act, 1956;
(iv) the aggregate of the proposed issue and all previous issues made in the same fi nancial year in terms of size (offer through offer document plus fi rm allotment plus promoters contribution through the offer document) does not exceed fi ve times its pre-issue net worth and
(v) in case the company has changed its name within the last one year, at least 50% of the revenue for the preceding one full year is earned by the company from the activity suggested by the new name.
Even if the above mentioned conditions are not satisfi ed, an unlisted company can still make an IPO on compliance of the guidelines as specifi ed:
(a)(i) issue should be made through the book building process with at least 50% of net offer to public being allotted to the QIBs, if not, then the full subscription monies has to be refunded, OR
(a)(ii) the project should have at least 15% participation by FIs/SCBs of which at least 10% should come from the appraiser. In addition, at least 10% of the issue size should be allotted to QIBs, otherwise, the full subscription monies would be refunded;
AND (b)(i) minimum post-issue face value capital of the company should be Rs. 10 crore, OR (b)(ii) there should be compulsory market making for at least 2 years from the date of listing subject to certain conditions as specifi ed in the guidelines.
Exemption from Eligibility Norms• Banking companies including Private banks set up under clauses ( c ) of section 5 of the Banking Regulation
Act, 1949 and which has received license from the Reserve Bank of India are exempt from the requirement of eligibility norms.

www.nseindia.com
Primary MarketISMR 30
• Infrastructure companies are exempt from the requirement of eligibility norms if their project has been appraised by a public fi nancial institution (PFI) or Infrastructure Development Finance Corporation (IDFC) or Infrastructure Leasing and Financing Services Ltd. (IL&FS) or a bank which was earlier a PFI and not less than 5% of the project cost is fi nanced by any of the institutions referred above, jointly or individually, by way of loan and/or subscription to equity or a combination of both
Credit Rating for Debt Instruments
No public issue or rights issue of debt instruments (whether convertible or not) can be made unless:
(a) A credit rating of not less than investment grade is obtained from at least one credit rating agencies registered with SEBI, all the credit ratings, including the rejected ones, needs to be disclosed.
(b) The company is not in the list of willful defaulters of RBI.
(c) The company has not defaulted on payment of interest or repayment of principal of debentures issued to the public, if any for a period more than 6 months.
In case the credit rating is obtained from more than one credit rating agencies, all the credit rating/s including the unaccepted credit ratings, should be disclosed. All the credit ratings obtained during the three (3) years preceding the public or rights issue of debt instrument (including convertible instruments) for any listed security of the issuer company should be disclosed in the offer document.
IPO Grading
No unlisted company should make an IPO of equity shares or any other security which may be converted into or exchanged with equity shares at a later date, unless the following conditions are satisfi ed as on the date of fi ling of Prospectus (in case of fi xed price issue) or Red Herring Prospectus (in case of book built issue) with ROC.
• The unlisted company has obtained grading for the IPO from atleast one credit rating agency.
• Disclosures of all the grades obtained along with the rationale/description furnished by the credit rating agency(ies) for each of the grades obtained, have been made in the Prospectus (in case of fi xed price issue) or Red Herring Prospectus (in case of book built issue)
• The expenses incurred for grading IPO have been borne by the unlisted company obtaining grading for IPO.
Every unlisted company obtaining grading for IPO should disclose the grades obtained, along with the rationale/description furnished by the credit rating agency(ies) for each of the grades obtained in the prospectus, abridged prospectus, issue advertisements and at all other places where the issuer company is advertising for the IPO.Pricing of Issues
The companies, including the eligible infrastructure companies, have the freedom to price their equity shares or any security convertible into equity in public or rights issues as the case may be. The banks however, can price their shares subject to the approval by the RBI. A company (listed or unlisted) should issue shares to applicants in the fi rm allotment category at a different price from the one at which the net offer to the public is made. That is, at a higher price than at which the securities are offered to the public.
In case of initial public offerings by unlisted company, if the issue price is Rs. 500 or more, the issuer company shall have the discretion to fi x the face value below Rs. 10 per share, subject to the condition that the face value shall in no case be less than Rs. 1 per share. However, in case the issue price is less than Rs. 500 per share, the face value shall be Rs. 10 per share.Price Band• The Issuer company can mention a price band of 20% (cap in the price band should not be more than 20% of the
fl oor price) in the offer documents fi led with the Board and actual price can be determined at a later date before fi lling of the offer document with the ROCs.
• If the Board of Directors has been authorized to determine the offer price within a specifi ed price band such price should be determined by a Resolution to be passed by the Board of Directors.
• In case of a public issue by a listed issuer company, issue price or price band may not be disclosed in the draft prospectus fi led with the Board.
www.nseindia.com
Primary Market ISMR31
• In case of a rights issue, issue price or price band may not be disclosed in the draft letter of offer fi led with the Board. The issue price may be determined any time before fi xation of the record date, in consultation with the Designated Stock Exchange. The fi nal offer document should contain only one price and one set of fi nancial projections, if applicable.
Contribution of Promoters and lock-in
• The promoters’ contribution in case of public issues by unlisted companies should not be less than 20% of the post issue capital.
• In case of public issues by listed companies, promoters should contribute to the extent of 20% of the proposed issue or should ensure post-issue share holding to the extent of 20% of the post-issue capital.
• For a composite issue, the promoters’ contribution should either be 20% of the proposed public issue or 20% of the post-issue capital.
• At least one day prior to the opening of the issue the promoters should bring in the full amount of the promoters contribution including premium which should be kept in an escrow account with a Scheduled Commercial Bank and the said contribution/amount should be released to the company along with the public issue proceed. Except for (i) public issue of securities which have been listed for at least 3 years and has a track record of dividend payment for at least 3 immediate preceding years, (ii) companies wherein no identifi able promoter or promoter group exists, and (iii) rights issues.
• The minimum promoters’ contribution should be locked in for a period of 3 years in case of all types of issues. However, in case of public issue of an unlisted company if the promoters’ contribution exceeds the required minimum, then the excess is locked in for a period of one year.
• The lock-in period starts from the date of allotment in the proposed public issue and the last date of the lock-in is to be reckoned as three years from the date of commencement of commercial production or the date of allotment in the public issue whichever is later.
• In case of pre-issue share capital of unlisted company, the entire pre-issue share capital, other than that locked in as minimum promoter’s contribution, is locked for a period of one year from the date of allotment in the proposed public issue. Securities allotted in fi rm allotment basis are also locked in for a period of one year from the date of commencement of commercial production or the date of allotment in the public issue whichever is later. The locked-in securities held by promoters may be pledged only with banks or FIs as collateral security for loans granted by such banks or FIs.
Pre-Issue Obligations
The lead merchant banker has to exercises due diligence and satisfy himself about all aspects of offering, veracity and adequacy of disclosures in the offer document. The liability of the merchant banker will continue even after the completion of issue process.
The lead merchant banker has to pay the requisite fee in accordance with regulation 24A of the Securities and Exchange Board of India (Merchants bankers) Rules and Regulations, 1992 along with draft offer document fi led with the Board. In case of a fast track issue, the requisite fee shall be paid along with the copy of the red herring prospectus, prospectus or letter of offer, as the case may be.
Each company issuing securities through public or rights issue has to enter into a Memorandum of Understanding with the lead merchant banker, which specifi es their mutual rights, liabilities and obligations.
• The lead merchant banker responsible for drafting of the offer documents has to submit to the Board the copy of the MOU entered into with the issuer company and the draft of the offer document.
• In case a public or rights issue is managed by more than one merchant banker the rights, obligation and responsibilities of each merchant banker should be demarcated as specifi ed in schedule II
• In case of under subscription of an issue, the Lead Merchant Banker responsible for underwriting arrangements should invoke underwriting obligations and ensure that the underwriters pay the amount of development and the same should be incorporated in the inter se allocation of responsibilities (schedule II) accompanying the due
www.nseindia.com
Primary MarketISMR 32
diligence certifi cate submitted by the Lead Merchant Banker to the Board. In case of a fast track issue, inter se allocation of responsibilities (Schedule II) is not to be submitted to the Board.
• The lead Merchant Banker should furnish to the Board a due diligence certifi cate as specifi ed in schedule III A along with the draft offer document.
In case of a fast track issue, the lead merchant banker should furnish a due diligence certifi cate to the Board as per the format specifi ed in Schedule III as specifi ed in Schedule VIA, along with the copy of the red herring prospectus, prospectus or letter of offer, as the case may be.
The Merchant Banker appointed should not lead manage the issue if he is a promoter or a director or associate of the issuer company provided the securities he holds of the issuer company are listed or proposed to be listed on the Over the Counter Exchange of India (OTCEI) and the Market Makers have either been appointed or proposed to be appointed as per the offer document. A merchant banker who is an associate of the issuer company may be appointed as a merchant banker for the issuer, if it is involved only in the marketing of the issue.
The lead merchant bankers should satisfy themselves about the ability of the underwriters to discharge their under writing obligations. In respect of every underwritten issue, the lead merchant banker(s) should undertake a minimum underwriting obligation of 5% to the total underwriting commitment of Rs.25 lakhs whichever is less. The outstanding underwriting commitments of a merchant banker should not exceed 20 times its net worth at any point of time. In respect of an underwritten issue, the lead merchant banker should ensure that the relevant details of underwriters are included in the offer document.
The draft offer documents fi led with the Board should be made public for a period of 15 days from the date of fi ling the offer document with the Board and fi led with the stock exchanges where the securities are proposed to be listed. Further, the draft offer documents should be put on the websites of the lead managers/syndicate members associated with the issue and also ensure that the contents of documents hosted on the websites are the same as that of their printed versions.
Twenty-one days after the draft offer document has been made public, the lead merchant banker should fi le a statement with the Board giving a list of complaints received, a statement as to whether it is proposed to amend the draft offer document or not, and highlighting those amendments.
The lead manager should also ensure that the issuer company has entered into agreements with all the depositories for dematerialization of securities.
An issuer company has to appoint a compliance offi cer who will directly liaise between the Board and the issuer company with regard to compliance of various laws, rules, regulations and other directives issued by the Board.
Post-Issue Obligations
Subsequent to the post issue, the lead merchant banker should ensure that the post-issue monitoring reports are submitted irrespective of the level of subscription. Also, the merchant banker should be associated with allotment, refund and dispatch and also monitor the redressal of investor grievances arising therefrom.
In a public issue, the Executive Director/Managing Director of the Designated Stock Exchange along with the post issue Lead Merchant Banker and the Registrars to the Issue are responsible for the fi nalization of allotment in a fair and proper manner.
Allotment should be on proportionate basis within the specifi ed categories rounded off to the nearest integer subject to the minimum allotment being equal to the minimum application size as fi xed and disclosed by the issuer. The proportionate basis of allotment of securities in an issue that is oversubscribed should be subject to the reservation for retail individual investors i.e a minimum of 50% of the net offer of securities to the public should initially be made available for allotment to retail individual investors as the case may be. The balance net offer of securities to the public should be made available for allotment to individual applicants other than retail individual investors and other investors including corporate bodies/institutions irrespective of the number of shares, debentures, etc. applied for. The unsubscribed portion of the net offer to any one of these categories should be made available for allotment to applicants in the other category if so required.

www.nseindia.com
Primary Market ISMR33
The lead merchant banker should ensure that the dispatch of share certifi cates/refund orders and demat credit is completed and the allotment and listing documents submitted to the stock exchanges within 2 working days of the date of allotment.
Book BuildingBook building is a price discovery mechanism based on the bids received at various prices from the investors, for which demand is assessed and then the price of the securities is discovered.
The issuer proposing to issue capital through book-building has two options, viz., 75% book building route and 100% book building route. In case of issue of securities through the fi rst route, 75% of the net offer to the public is made through book-building process and 25% at the price determined by book-building. In this case not more than 50% should be available for allocation to QIBs and not less than 25% to non-QIBs. In case of under subscription in any category, the unsubscribed portions can be allocated to the bidders in other categories.
Besides, book building also requires that: issuer should provide indicative fl oor price and no ceiling price, bids to remain open for at least 3 working days and not more than 7 working days (which may be extended to a maximum of 10 working days in case the price band is revised). Only electronic bidding is permitted, bids are submitted through syndicate members, investors can bid at any price, retail investors have option to bid at cut off price, bidding demand is displayed at the end of every day, the lead manager analyses the demand generated and determines the issue price in consultation with the issuer, etc. e-IPOsA company proposing to issue capital to public through the on-line system of the stock exchanges has to enter into an agreement with the Stock Exchange(s). SEBI registered brokers should be appointed for the purpose of accepting applications and placing orders with the company. The issuer company should also appoint a Registrar to the Issue having electronic connectivity with the Exchanges. The issuer company can apply for listing of its securities on any Exchange other than the Exchange through which it has offered its securities. The lead manager co-ordinates all the activities amongst various intermediaries connected in the issue/system.
Credit Rating Credit rating agencies (CRA) can be promoted by public fi nancial institutions, scheduled commercial banks, foreign banks operating in India, by any body corporate having continuous minimum net worth of Rs.100 crore for the previous fi ve years. Further, foreign credit rating agencies recognized by or under any law for the time being in force in the country of its incorporation, having at least fi ve years experience in rating securities can also operate in the country. The SEBI (Credit Rating Agencies) Regulations, 1999 cover the rating of the securities listed and not fi xed deposits, foreign exchange, country ratings and real estates. No company can make a public issue or rights issue of debt instruments (whether convertible or not), unless credit rating is obtained from at least one credit rating agency registered with the Board and disclosed in the offer document. Where ratings are obtained from more than one credit rating agencies, all the ratings including the unaccepted ratings should be disclosed in the offer document.
Merchant Banking The merchant banking activity in India is governed by SEBI (Merchant Bankers) Regulations, 1992. Consequently, all the merchant bankers have to be registered with SEBI. The details about them are presented in the table below:
Category of Merchant Banker Permitted ActivityCategory I To carry on activity of the issue management, to act as adviser, consultant,
manager, underwriter, portfolio managerCategory II To act as adviser, consultant, co-manager, underwriter, portfolio managerCategory III To act as underwriter, adviser, consultant to an issueCategory IV To act only as adviser or consultant to an issue
Only a corporate body other than a non-banking fi nancial company having necessary infrastructure, with at least two experienced persons employed can apply for registration as a merchant banker. The capital adequacy requirement should be a net worth of Rupees Fifty million. The regulations cover the code of conduct to be followed by merchant bankers, responsibilities of lead managers, payments of fees and disclosures to SEBI.

www.nseindia.com
Primary MarketISMR 34
Demat issues
SEBI has mandated that all new IPOs compulsorily should be traded in dematerialised form only. Further, the section 68B of the Companies Act, 1956, requires that every listed public company making IPO of any security for Rs. 10 crore or more should issue the same only in dematerialised form. The investors, however, would have the option of either subscribing to securities in physical or dematerialised form. Private Placement
The private placement involves issue of securities, debt or equity, to selected subscribers, such as banks, FIs, MFs and high net worth individuals. It is arranged through a merchant/investment banker, who acts as an agent of the issuer and brings together the issuer and the investor(s). Since these securities are allotted to a few sophisticated and experienced investors, the stringent public disclosure regulations and registration requirements are relaxed. The Companies Act, 1956, states that an offer of securities to more than 50 persons is deemed to be public issue.
Market Outcome
Public Issues
Total resource mobilization from public equity issues increased by 159.73% to Rs.870,290 million (US $ 21,774 million) in 2007-08 from Rs.335,080 million (US $ 7,687 million) in 2006-07.
The public issues of listed companies witnessed a signifi cant increase of 822% in the resources mobilized to Rs. 119,160 million (US $ 2,981 million), from Rs.12,930 million (US $ 297 million) in 2006-07. In case of Rights issues, the resources mobilized increased from Rs. 37,110 million (US $ 851 million) during 2006-07 to Rs. 325,180 million (US $ 8,136 million) in 2007-08 a colossal rise of 776 %. During April-June 2008, there 2 rights issues worth Rs.4,380 (US$ 102 million).(Table 2-2)
Table 2-2: Resource Mobilisation from Public Equity Issues
Issue2006-07 2007-08 (April 08-June 08) 2006-07 2007-08
2008-09 (April
08-June 08)
Number Amount(Rs. mn)
Number Amount(Rs. mn)
Number Amount(Rs. mn)
Amount(US $ mn)
IPOs 77 285,040 85 425,950 13 15,930 6,539 10,657 371
Issues by Listed Companies
47 50,040 39 444,340 2 4,380 1,148 11,117 102
Public Issues 8 12,930 7 119,160 - - 297 2,981 -
Rights Issues 39 37,110 32 325,180 2 4,380 851 8,136 02
Total 124 335,080 124 870,290 15 20,310 7,687 21,774 473Source:SEBI
On the other hand, around 49% of the total resources were raised through the IPO route during the FY2008 as compared with 85% last year. However, the number of issuers of IPO’s increased to 85 as compared to 77 issuers in 2006-07. The total resources mobilized through IPOs increased to Rs.425,950 million (US $ 10,657 million) in 2007-08 as against Rs.285,040 million (US $ 6,539 million) in the preceding year, an increase of 49.44 %. During April – June 2008, there were 13 IPOs mobilising Rs.15,930 million (US $ 371 million). (Table 2-2)
Most of the public equity issues were made by private sector companies. Of the 124 issuers who tapped the market in 2007-08, 120 issues were from the private sector issuers. They mobilized around 77.35% of the total resources raised. The public sector companies came out with 4 issues mobilizing 22.66% to the total resources mobilized. During April-June 2008, the private sector made 15 issues and mobilized Rs.20,310 million (US$ 473 million), there were no issues by the public sector. (Table 2-3)

www.nseindia.com
Primary Market ISMR35
Table 2-3: Sector-wise Distribution of Resources Mobilised by Public Equity Issues
Sector2006-07 2007-08 April 08- June 08 2006-07 2007-08 April 08-
June 08Number Amount
(Rs. mn)Number Amount
(Rs. mn)Number Amount
(Rs. mn)Amount
(US $ mn)
Private 122 317,280 120 673,110 15 20,310 7,279 182 473
Public 2 17,790 4 197,180 -- -- 408 10 --
Total 124 335,070 124 870,290 15 20,310 7,687 192 473
-- NilSource: SEBI
During 2007-08, there were 31 mega issues (Rs.3,000 million and above), the largest issue being the Rights issue (fast track) of State Bank of India Ltd. (Rs.16,7360 million/US$ 4,187.14 million) followed by Reliance Power IPO (Rs. 115,630 million/ US $ 2,892.92 million and FPO of ICICI Bank of Rs.100,630 million.
As per the Prime Annual report, the response to public issues has been good in the year 2007-08. Though 22 % of the public issues failed to elicit response (less than 1.5 times) there were 44% of issues were subscribed over 10 times. The most subscribed issues during 2007-08 were Religare Enterprises Ltd, which was over subscribed 158.63 times followed by, Everonn Systems India Ltd. which was over-subscribed 143.99 times. During April-June 2008, 46% of the issues were subscribed less than 1.5 times, 31% issues were subscribed between 3 to 10 times while there were only 2 issues (i.e 15%) which were subscribed more than 10 times. (Table 2-4)
Table 2-4: Response to Public Issues(% of issues)
Times Subscribed 2006-07 2007-08 April-June 2008
< 1.5 26 22 46
1.5 - 3 16 11 8
3 - 10 25 23 31
> 10 33 44 15
100 100 100
Source: Prime Database
Public issues are moblilised through both debt and equity issues. From 1995-96 onwards, the percentage of resource mobilization through equity issues has been larger as compared to debt issue, the only exception being the year 1999-2000 when 84.66% of the resources were moblised through debt issues. The other two years when debt issue mobilization was more than equity were, 2001-02 and 2002-03 when the share of debt accounted for 83.12% and 82% of the total resource mobilization. Of late, the resource mobilization by debt issues is nearly negligible. In the year 2005-06 and 2006-07, the resource mobilization through equity issue was 100%, which has been the highest ever in the history of the Indian capital market. During 2007-08, the share of equity in resource mobilization through public issues was 98.12% and the share of debt was 1.88%. During the cumulative period April-June 2008 the share of equity in resource moblisation was 100 %.(Table 2-5).

www.nseindia.com
Primary MarketISMR 36
Table 2-5: Resources Mobilised through Debt and Equity (Public Issues)
Year Percentage Share
Equity Debt
1995-96 72.39 27.61
1996-97 55.99 44.01
1997-98 41.17 58.83
1998-99 15.34 84.66
1999-00 58.41 41.59
2000-01 52.79 47.21
2001-02 16.88 83.12
2002-03 18.00 82.00
2003-04 80.47 19.53
2004-05 83.96 16.04
2005-06 100.00 0.00
2006-07 100.00 0.00
2007-08 98.12 1.88
April-June 2008 100.00 0.00Source: Prime Database
During the period 2001-02 to 2005-06, data on resource mobilisation through public equity issues by various industries shows that the Banking and Financial sector had been the most dominant sector in garnering a share of 40% to 60% of the total resources raised. However, this sector accounted a meager share of 6.53 % during 2006-07. This segment again caught momentum in the year 2007-08 wherein it mobilized 35.57% of the total resources. During 2007-08, the cement sector was the second largest sector to mobilise resources through public equity issue and cornered a share of 21.72% while the power sector accounted for a share of 15.75%. Except for the above three cited sectors i.e the Banking/FI, Cement and Power, all other sectors like Entertainment, Finance, IT, Telecom and Textile saw a fall in share in resource mobilization through public equity issue as compared with its share in the corresponding period last year. During April-June 2008, the share of power sector in resource mobilization was the highest at 40.90% while the textile sector’s share was 10.48%. (Table 2-6).
Table 2-6: Industry-wise Resource Mobilisation by Public Equity Issues
IndustryPercentage Share
2006-07 2007-08 April-June 20008Banking/FIs 6.54 35.57 -
Cement & Construction 8.20 21.72 3.05
Chemical 0.44 0.76 -
Entertainment 3.64 0.46 -
Finance 8.25 2.04 -
Information Technology 6.20 0.79 -
Paper & Pulp 0.04 0.04 -
Power 0.09 15.75 40.90
Telecom 8.94 1.15 0.69
Textile 3.18 0.51 10.48
Others 54.48 21.21 44.88
Total 100.00 100.00 100.00Source: SEBI
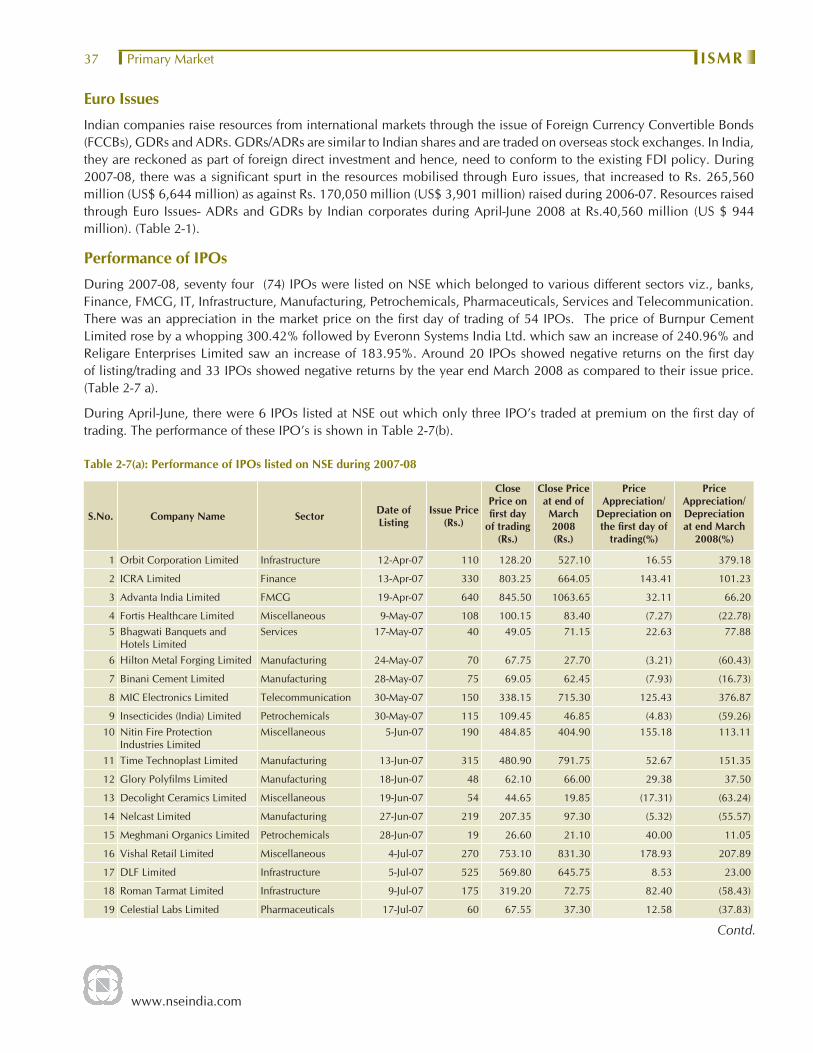
www.nseindia.com
Primary Market ISMR37
Euro Issues
Indian companies raise resources from international markets through the issue of Foreign Currency Convertible Bonds (FCCBs), GDRs and ADRs. GDRs/ADRs are similar to Indian shares and are traded on overseas stock exchanges. In India, they are reckoned as part of foreign direct investment and hence, need to conform to the existing FDI policy. During 2007-08, there was a signifi cant spurt in the resources mobilised through Euro issues, that increased to Rs. 265,560 million (US$ 6,644 million) as against Rs. 170,050 million (US$ 3,901 million) raised during 2006-07. Resources raised through Euro Issues- ADRs and GDRs by Indian corporates during April-June 2008 at Rs.40,560 million (US $ 944 million). (Table 2-1).
Performance of IPOs
During 2007-08, seventy four (74) IPOs were listed on NSE which belonged to various different sectors viz., banks, Finance, FMCG, IT, Infrastructure, Manufacturing, Petrochemicals, Pharmaceuticals, Services and Telecommunication. There was an appreciation in the market price on the fi rst day of trading of 54 IPOs. The price of Burnpur Cement Limited rose by a whopping 300.42% followed by Everonn Systems India Ltd. which saw an increase of 240.96% and Religare Enterprises Limited saw an increase of 183.95%. Around 20 IPOs showed negative returns on the fi rst day of listing/trading and 33 IPOs showed negative returns by the year end March 2008 as compared to their issue price. (Table 2-7 a).
During April-June, there were 6 IPOs listed at NSE out which only three IPO’s traded at premium on the fi rst day of trading. The performance of these IPO’s is shown in Table 2-7(b).
Table 2-7(a): Performance of IPOs listed on NSE during 2007-08
S.No. Company Name Sector Date of Listing
Issue Price(Rs.)
Close Price on fi rst day
of trading(Rs.)
Close Price at end of March 2008(Rs.)
Price Appreciation/
Depreciation on the fi rst day of
trading(%)
Price Appreciation/ Depreciation at end March
2008(%)
1 Orbit Corporation Limited Infrastructure 12-Apr-07 110 128.20 527.10 16.55 379.18
2 ICRA Limited Finance 13-Apr-07 330 803.25 664.05 143.41 101.23
3 Advanta India Limited FMCG 19-Apr-07 640 845.50 1063.65 32.11 66.20
4 Fortis Healthcare Limited Miscellaneous 9-May-07 108 100.15 83.40 (7.27) (22.78)5 Bhagwati Banquets and
Hotels LimitedServices 17-May-07 40 49.05 71.15 22.63 77.88
6 Hilton Metal Forging Limited Manufacturing 24-May-07 70 67.75 27.70 (3.21) (60.43)
7 Binani Cement Limited Manufacturing 28-May-07 75 69.05 62.45 (7.93) (16.73)
8 MIC Electronics Limited Telecommunication 30-May-07 150 338.15 715.30 125.43 376.87
9 Insecticides (India) Limited Petrochemicals 30-May-07 115 109.45 46.85 (4.83) (59.26)10 Nitin Fire Protection
Industries LimitedMiscellaneous 5-Jun-07 190 484.85 404.90 155.18 113.11
11 Time Technoplast Limited Manufacturing 13-Jun-07 315 480.90 791.75 52.67 151.35
12 Glory Polyfi lms Limited Manufacturing 18-Jun-07 48 62.10 66.00 29.38 37.50
13 Decolight Ceramics Limited Miscellaneous 19-Jun-07 54 44.65 19.85 (17.31) (63.24)
14 Nelcast Limited Manufacturing 27-Jun-07 219 207.35 97.30 (5.32) (55.57)
15 Meghmani Organics Limited Petrochemicals 28-Jun-07 19 26.60 21.10 40.00 11.05
16 Vishal Retail Limited Miscellaneous 4-Jul-07 270 753.10 831.30 178.93 207.89
17 DLF Limited Infrastructure 5-Jul-07 525 569.80 645.75 8.53 23.00
18 Roman Tarmat Limited Infrastructure 9-Jul-07 175 319.20 72.75 82.40 (58.43)
19 Celestial Labs Limited Pharmaceuticals 17-Jul-07 60 67.55 37.30 12.58 (37.83)
Contd.
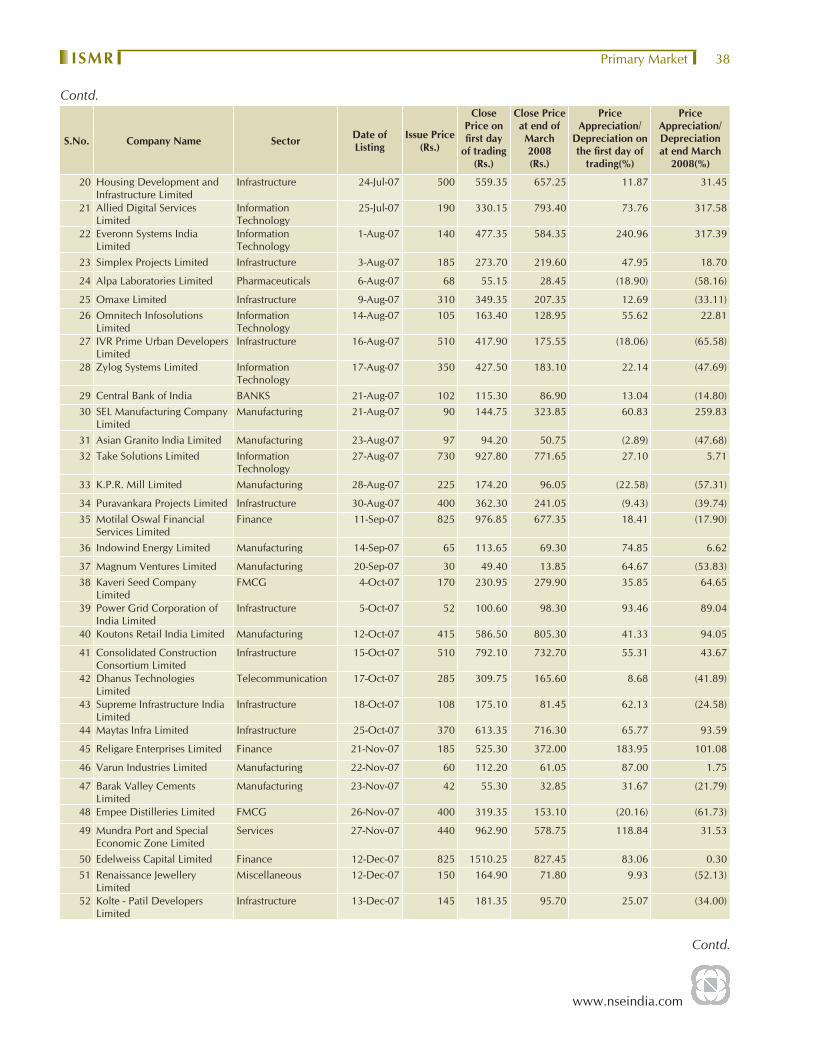
www.nseindia.com
Primary MarketISMR 38
S.No. Company Name Sector Date of Listing
Issue Price(Rs.)
Close Price on fi rst day
of trading(Rs.)
Close Price at end of March 2008(Rs.)
Price Appreciation/
Depreciation on the fi rst day of
trading(%)
Price Appreciation/ Depreciation at end March
2008(%)
20 Housing Development and Infrastructure Limited
Infrastructure 24-Jul-07 500 559.35 657.25 11.87 31.45
21 Allied Digital Services Limited
Information Technology
25-Jul-07 190 330.15 793.40 73.76 317.58
22 Everonn Systems India Limited
Information Technology
1-Aug-07 140 477.35 584.35 240.96 317.39
23 Simplex Projects Limited Infrastructure 3-Aug-07 185 273.70 219.60 47.95 18.70
24 Alpa Laboratories Limited Pharmaceuticals 6-Aug-07 68 55.15 28.45 (18.90) (58.16)
25 Omaxe Limited Infrastructure 9-Aug-07 310 349.35 207.35 12.69 (33.11)26 Omnitech Infosolutions
LimitedInformation Technology
14-Aug-07 105 163.40 128.95 55.62 22.81
27 IVR Prime Urban Developers Limited
Infrastructure 16-Aug-07 510 417.90 175.55 (18.06) (65.58)
28 Zylog Systems Limited Information Technology
17-Aug-07 350 427.50 183.10 22.14 (47.69)
29 Central Bank of India BANKS 21-Aug-07 102 115.30 86.90 13.04 (14.80)30 SEL Manufacturing Company
LimitedManufacturing 21-Aug-07 90 144.75 323.85 60.83 259.83
31 Asian Granito India Limited Manufacturing 23-Aug-07 97 94.20 50.75 (2.89) (47.68)32 Take Solutions Limited Information
Technology27-Aug-07 730 927.80 771.65 27.10 5.71
33 K.P.R. Mill Limited Manufacturing 28-Aug-07 225 174.20 96.05 (22.58) (57.31)
34 Puravankara Projects Limited Infrastructure 30-Aug-07 400 362.30 241.05 (9.43) (39.74)35 Motilal Oswal Financial
Services LimitedFinance 11-Sep-07 825 976.85 677.35 18.41 (17.90)
36 Indowind Energy Limited Manufacturing 14-Sep-07 65 113.65 69.30 74.85 6.62
37 Magnum Ventures Limited Manufacturing 20-Sep-07 30 49.40 13.85 64.67 (53.83)38 Kaveri Seed Company
LimitedFMCG 4-Oct-07 170 230.95 279.90 35.85 64.65
39 Power Grid Corporation of India Limited
Infrastructure 5-Oct-07 52 100.60 98.30 93.46 89.04
40 Koutons Retail India Limited Manufacturing 12-Oct-07 415 586.50 805.30 41.33 94.05
41 Consolidated Construction Consortium Limited
Infrastructure 15-Oct-07 510 792.10 732.70 55.31 43.67
42 Dhanus Technologies Limited
Telecommunication 17-Oct-07 285 309.75 165.60 8.68 (41.89)
43 Supreme Infrastructure India Limited
Infrastructure 18-Oct-07 108 175.10 81.45 62.13 (24.58)
44 Maytas Infra Limited Infrastructure 25-Oct-07 370 613.35 716.30 65.77 93.59
45 Religare Enterprises Limited Finance 21-Nov-07 185 525.30 372.00 183.95 101.08
46 Varun Industries Limited Manufacturing 22-Nov-07 60 112.20 61.05 87.00 1.75
47 Barak Valley Cements Limited
Manufacturing 23-Nov-07 42 55.30 32.85 31.67 (21.79)
48 Empee Distilleries Limited FMCG 26-Nov-07 400 319.35 153.10 (20.16) (61.73)
49 Mundra Port and Special Economic Zone Limited
Services 27-Nov-07 440 962.90 578.75 118.84 31.53
50 Edelweiss Capital Limited Finance 12-Dec-07 825 1510.25 827.45 83.06 0.30 51 Renaissance Jewellery
LimitedMiscellaneous 12-Dec-07 150 164.90 71.80 9.93 (52.13)
52 Kolte - Patil Developers Limited
Infrastructure 13-Dec-07 145 181.35 95.70 25.07 (34.00)
Contd.
Contd.

www.nseindia.com
Primary Market ISMR39
S.No. Company Name Sector Date of Listing
Issue Price(Rs.)
Close Price on fi rst day
of trading(Rs.)
Close Price at end of March 2008(Rs.)
Price Appreciation/
Depreciation on the fi rst day of
trading(%)
Price Appreciation/ Depreciation at end March
2008(%)
53 Kaushalya Infrastructure Development Corporation Limited
Infrastructure 14-Dec-2007
60 82.45 35.25 37.42 (41.25)
54 Jyothy Laboratories Limited Pharmaceuticals 19-Dec-07 690 794.05 785.30 15.08 13.81 55 Transformers And Rectifi ers
(India) LimitedInfrastructure 28-Dec-07 465 729.25 395.35 56.83 (14.98)
56 Brigade Enterprises Limited Infrastructure 31-Dec-07 390 379.90 168.55 (2.59) (56.78)57 eClerx Services Limited Information
Technology31-Dec-07 315 449.65 246.40 42.75 (21.78)
58 BGR Energy Systems Limited Manufacturing 3-Jan-08 480 901.45 341.90 87.80 (28.77)
59 Burnpur Cement Limited Manufacturing 3-Jan-08 12 48.05 21.95 82.92
60 Aries Agro Limited Petrochemicals 11-Jan-08 130 251.40 120.75 93.38 (7.12)61 Precision Pipes And Profi les
Company LimitedManufacturing 11-Jan-08 150 136.10 67.45 (9.27) (55.03)
62 Future Capital Holdings Limited
Finance 1-Feb-08 765 909.80 639.55 18.93 (16.40)
63 Reliance Power Limited Infrastructure 11-Feb-08 450 372.30 318..00 (17.27) (29.33)
64 J.Kumar Infraprojects Limited Infrastructure 12-Feb-08 110 103.35 80.45 (6.05) (26.86)65 Cords Cable Industries
LimitedManufacturing 13-Feb-08 135 139.45 84.65 3.30 (37.30)
66 KNR Constructions Limited Infrastructure 18-Feb-08 170 154.90 84.60 (8.88) (50.24)
67 OnMobile Global Limited Petrochemicals 19-Feb-08 440 518.15 544.10 17.76 23.66
68 Bang Overseas Limited Manufacturing 20-Feb-08 207 174.10 122.60 (15.89) (40.77)
69 Shriram EPC Limited Infrastructure 20-Feb-08 300 286.50 238.00 (4.50) (20.67)70 IRB Infrastructure Developers
LimitedInfrastructure 25-Feb-08 185 189.65 169.35 2.51 (8.46)
71 Tulsi Extrusions Limited Miscellaneous 25-Feb-08 85 140.85 76.45 65.71 (10.06)72 Gss America Infrastructure
Projects LimitedInformation Technology
7-Mar-08 400 500.80 757.10 25.20 89.28
73 Rural Electrifi cation Corporation Limited
Finance 12-Mar-08 105 121.30 106.45 15.52 1.38
74 V-Guard Industries Limited Manufacturing 13-Mar-08 82 75.95 64.60 (7.38) (21.22)
Table 2-7 (b): Performance of IPOs listed on NSE during April-June 2008
S.No. Company Name Sector
Date of Listing Issue Price(Rs.)
Close Price on fi rst day
of trading
(Rs.)
Close Price at end of
June 2008(Rs.)
Price Appreciation/
Depreciation on the fi rst day of
trading(%)
Price Appreciation/
Depreciation at end June 2008
(%)
1 Gammon Infrastructure Projects Limited
Infrastructure 3-Apr-2008 167.00 158.15 120.10 (5.30) (28.08)
2 Sita Shree Food Products Limited
Manufacturing 7-Apr-2008 30.00 43.70 18 45.67 (40.00)
3 Titagarh Wagons Limited Manufacturing 21-Apr-2008 540.00 706.85 545.75 30.90 1.06
4 Kiri Dyes and Chemicals Limited
Manufacturing 22-Apr-2008 150.00 158.95 148.40 5.97 (1.07)
5 Gokul Refoils and Solvent Limited
Manufacturing 4-Jun-2008 195.00 182.05 203.95 (6.64) 4.59
Source:NSE
Contd.

www.nseindia.com
Primary MarketISMR 40
Book Building through On-line IPO System
Book building is basically a process used in IPO for effi cient price discovery, wherein during the period when the offer is open, bids are collected from investors at various prices, which are above or equal to the fl oor price. The offer price is determined after the bid closing date. In its endeavour to continuously improve the Indian securities market, NSE has offered an infrastructure for conducting online IPOs through book building. It helps to discover prices as well as demand for the security to be issued through a process of bidding. The advantages are: (a) the investor parts with money only after the allotment (b) it eliminates refunds except in case of direct applications and (c) it reduces the time taken to process the issue. Till March 2008, 199 issuers have used the NSE online IPO system for making IPO issues.
Debt Issues
Government and corporate sector collectively raised a total of Rs. 3,722,501 million (US $ 93,132 million) from primary market during 2007-08. About 68.77% has been raised by the Government, while the balance by the corporate sector through private placement. During April-June 2008, the government and the corporates raised Rs.2,543,101 crore (US$ 59,211 million) from the debt market. (Table 2-8).
Table 2-8: Resources Raised from Debt Markets
Issuer(Rs. mn.) (US$. mn.)
2006-07 2007-08 April-June 2008
2006-07 2007-08 April-June 2008
Corporate 923,552 1,162,661 194,681 21,187 29,088 4,533
Public Issues - 10,000 - - 250 -
Private Placement* 923,552 1,152,661 194,681 21,187 28,838 4,533
Government 2,001,980 2,559,840 2,348,420 45,928 64,044 54,678
Total 2,925,532 3,722,501 2,543,101 67,115 93,132 59,211
* Only debt placements with a tenor and put / call option of 1 year or more.Source: Prime Database (for corporate debt) & RBI Annual Report 2007-08 (for Government debt).
Private Placement of Debt
According to Prime Database estimates, a total of 104 issuers (institutional and corporates) raised Rs. 1,152,661 million (US $ 28,838 million) through 613 privately placed issues in 2007-08 Response to most of the issues was good. 246 issues out of 613 issues i.e around 40% of the total issues were made by the government sector units, which mobilized 80% of the total. During the period April-June 2008, there were 40 issuers which placed 124 issues amounting to Rs.194,680.70 million.(Table 2-9). The amount raised through the private placement of debt issues have been on an increasing trend over the past few years (Chart 2-1).
Table 2-9: Private Placement - Institutional & Corporate Debt
Year No. of issuers
No. of Privately
Placed issues
Resource Mobilisation through Private
Placement of Debt(Rs. mn)
Resource Mobilisation through Private
Placement of Debt(US $ mn)
1995-96 47 73 100,353 2,921
1996-97 159 204 183,908 5,126
1997-98 151 253 309,833 7,838
1998-99 204 444 386,427 9,107
1999-00 229 711 550,734 12,626
Contd.
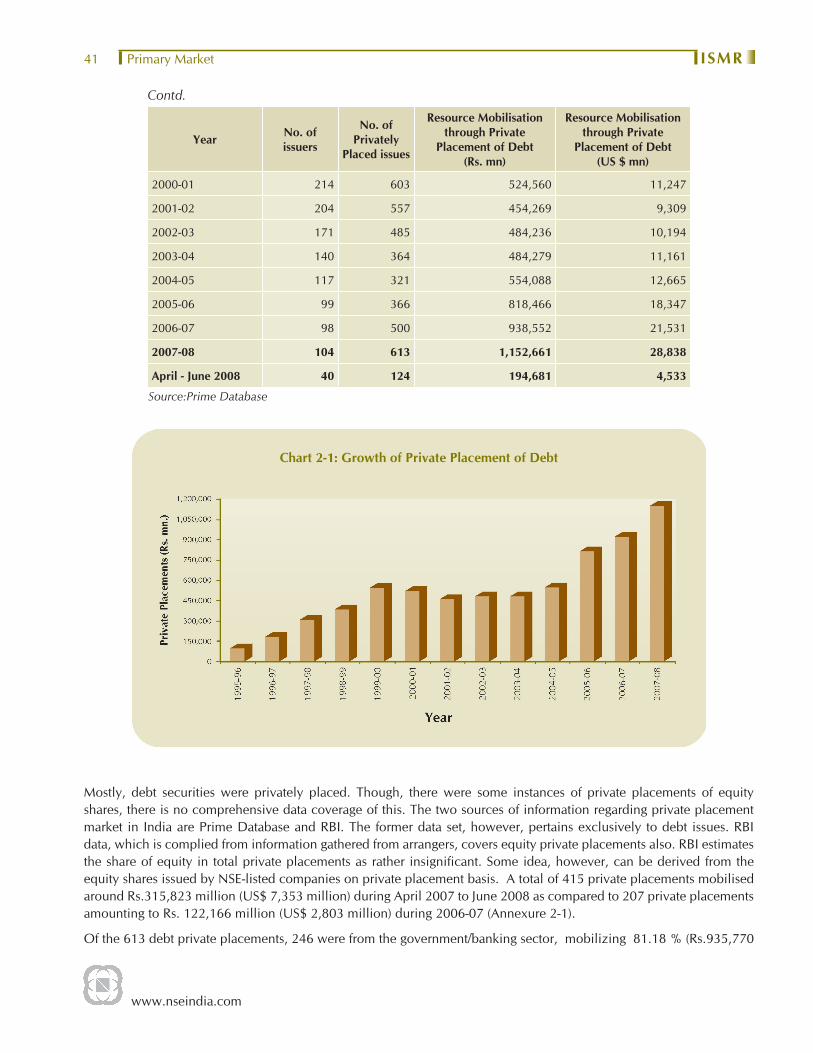
www.nseindia.com
Primary Market ISMR41
Year No. of issuers
No. of Privately
Placed issues
Resource Mobilisation through Private
Placement of Debt(Rs. mn)
Resource Mobilisation through Private
Placement of Debt(US $ mn)
2000-01 214 603 524,560 11,247
2001-02 204 557 454,269 9,309
2002-03 171 485 484,236 10,194
2003-04 140 364 484,279 11,161
2004-05 117 321 554,088 12,665
2005-06 99 366 818,466 18,347
2006-07 98 500 938,552 21,531
2007-08 104 613 1,152,661 28,838
April - June 2008 40 124 194,681 4,533
Source:Prime Database
Chart 2-1: Growth of Private Placement of Debt
Mostly, debt securities were privately placed. Though, there were some instances of private placements of equity shares, there is no comprehensive data coverage of this. The two sources of information regarding private placement market in India are Prime Database and RBI. The former data set, however, pertains exclusively to debt issues. RBI data, which is complied from information gathered from arrangers, covers equity private placements also. RBI estimates the share of equity in total private placements as rather insignifi cant. Some idea, however, can be derived from the equity shares issued by NSE-listed companies on private placement basis. A total of 415 private placements mobilised around Rs.315,823 million (US$ 7,353 million) during April 2007 to June 2008 as compared to 207 private placements amounting to Rs. 122,166 million (US$ 2,803 million) during 2006-07 (Annexure 2-1).
Of the 613 debt private placements, 246 were from the government/banking sector, mobilizing 81.18 % (Rs.935,770
Contd.
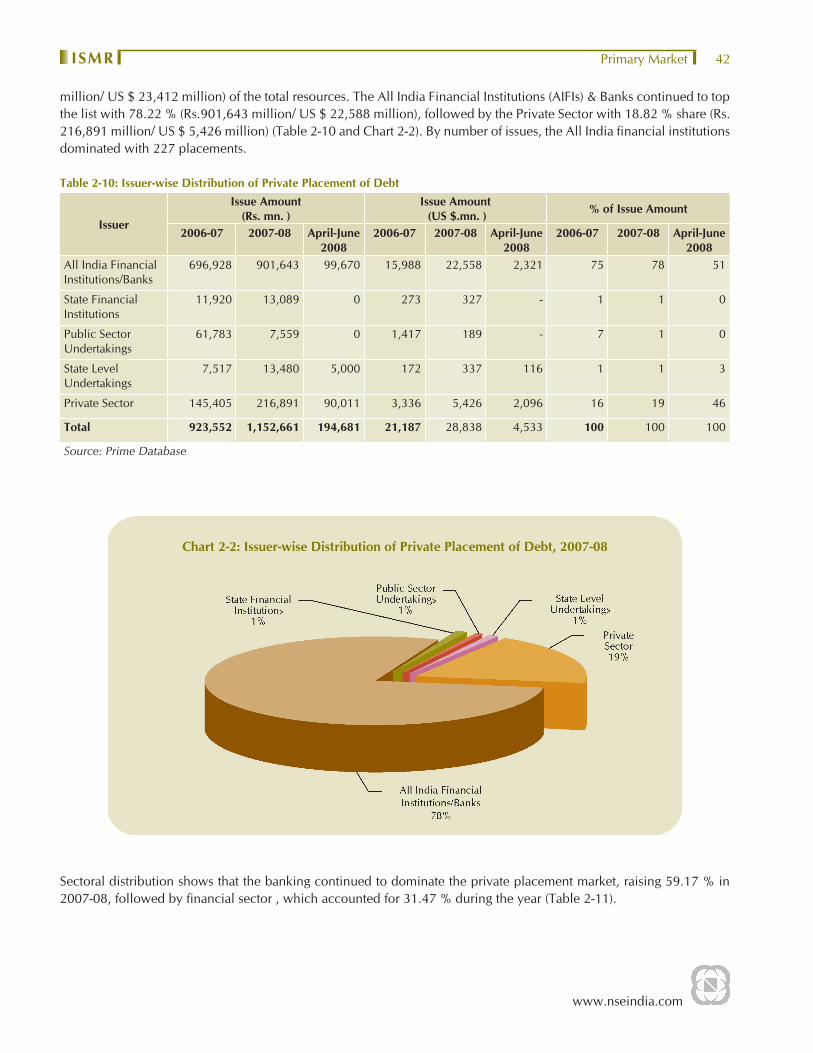
www.nseindia.com
Primary MarketISMR 42
million/ US $ 23,412 million) of the total resources. The All India Financial Institutions (AIFIs) & Banks continued to top the list with 78.22 % (Rs.901,643 million/ US $ 22,588 million), followed by the Private Sector with 18.82 % share (Rs. 216,891 million/ US $ 5,426 million) (Table 2-10 and Chart 2-2). By number of issues, the All India fi nancial institutions dominated with 227 placements.
Table 2-10: Issuer-wise Distribution of Private Placement of Debt
Issuer
Issue Amount (Rs. mn. )
Issue Amount (US $.mn. ) % of Issue Amount
2006-07 2007-08 April-June 2008
2006-07 2007-08 April-June 2008
2006-07 2007-08 April-June 2008
All India Financial Institutions/Banks
696,928 901,643 99,670 15,988 22,558 2,321 75 78 51
State Financial Institutions
11,920 13,089 0 273 327 - 1 1 0
Public Sector Undertakings
61,783 7,559 0 1,417 189 - 7 1 0
State Level Undertakings
7,517 13,480 5,000 172 337 116 1 1 3
Private Sector 145,405 216,891 90,011 3,336 5,426 2,096 16 19 46
Total 923,552 1,152,661 194,681 21,187 28,838 4,533 100 100 100
Source: Prime Database
Chart 2-2: Issuer-wise Distribution of Private Placement of Debt, 2007-08
Sectoral distribution shows that the banking continued to dominate the private placement market, raising 59.17 % in 2007-08, followed by fi nancial sector , which accounted for 31.47 % during the year (Table 2-11).
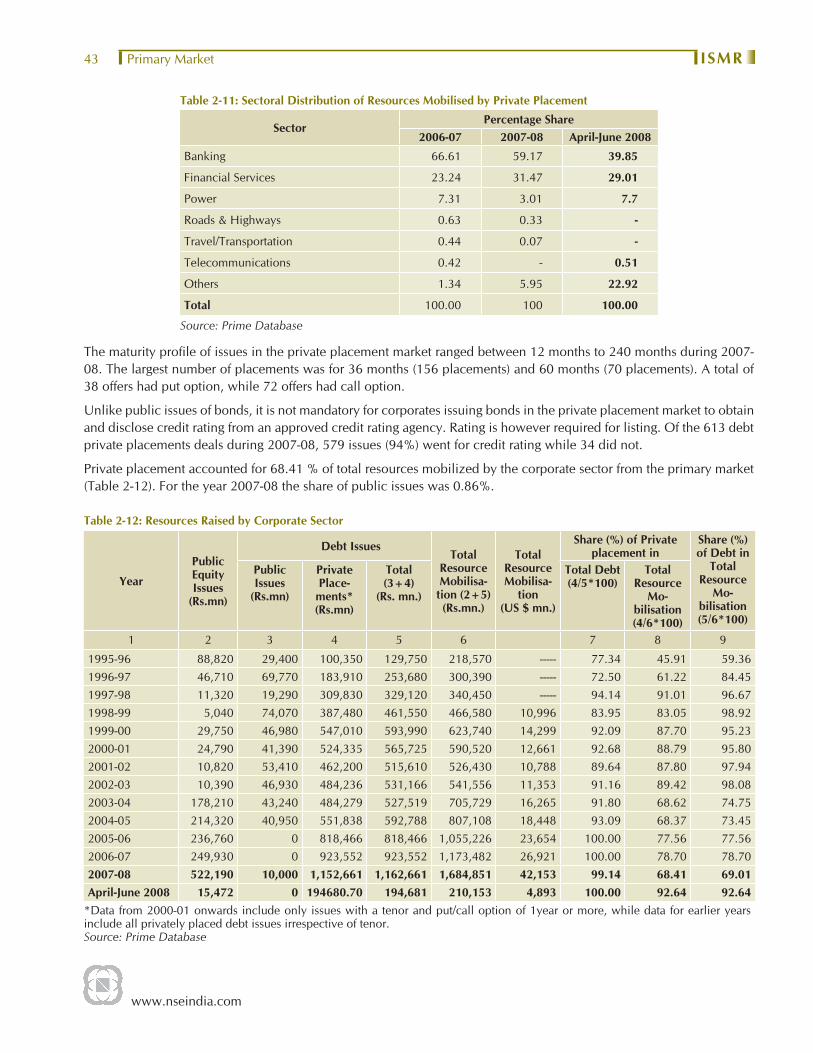
www.nseindia.com
Primary Market ISMR43
Table 2-11: Sectoral Distribution of Resources Mobilised by Private Placement
SectorPercentage Share
2006-07 2007-08 April-June 2008
Banking 66.61 59.17 39.85
Financial Services 23.24 31.47 29.01
Power 7.31 3.01 7.7
Roads & Highways 0.63 0.33 -
Travel/Transportation 0.44 0.07 -
Telecommunications 0.42 - 0.51
Others 1.34 5.95 22.92
Total 100.00 100 100.00
Source: Prime Database
The maturity profi le of issues in the private placement market ranged between 12 months to 240 months during 2007-08. The largest number of placements was for 36 months (156 placements) and 60 months (70 placements). A total of 38 offers had put option, while 72 offers had call option.
Unlike public issues of bonds, it is not mandatory for corporates issuing bonds in the private placement market to obtain and disclose credit rating from an approved credit rating agency. Rating is however required for listing. Of the 613 debt private placements deals during 2007-08, 579 issues (94%) went for credit rating while 34 did not.
Private placement accounted for 68.41 % of total resources mobilized by the corporate sector from the primary market (Table 2-12). For the year 2007-08 the share of public issues was 0.86%.
Table 2-12: Resources Raised by Corporate Sector
Year
Public Equity Issues
(Rs.mn)
Debt IssuesTotal
Resource Mobilisa-
tion (2+5)(Rs.mn.)
Total Resource Mobilisa-
tion (US $ mn.)
Share (%) of Private placement in
Share (%) of Debt in
Total Resource
Mo-bilisation (5/6*100)
Public Issues
(Rs.mn)
Private Place-ments*(Rs.mn)
Total (3+4)
(Rs. mn.)
Total Debt (4/5*100)
Total Resource
Mo-bilisation (4/6*100)
1 2 3 4 5 6 7 8 9
1995-96 88,820 29,400 100,350 129,750 218,570 ----- 77.34 45.91 59.361996-97 46,710 69,770 183,910 253,680 300,390 ----- 72.50 61.22 84.451997-98 11,320 19,290 309,830 329,120 340,450 ----- 94.14 91.01 96.671998-99 5,040 74,070 387,480 461,550 466,580 10,996 83.95 83.05 98.921999-00 29,750 46,980 547,010 593,990 623,740 14,299 92.09 87.70 95.232000-01 24,790 41,390 524,335 565,725 590,520 12,661 92.68 88.79 95.802001-02 10,820 53,410 462,200 515,610 526,430 10,788 89.64 87.80 97.942002-03 10,390 46,930 484,236 531,166 541,556 11,353 91.16 89.42 98.082003-04 178,210 43,240 484,279 527,519 705,729 16,265 91.80 68.62 74.752004-05 214,320 40,950 551,838 592,788 807,108 18,448 93.09 68.37 73.452005-06 236,760 0 818,466 818,466 1,055,226 23,654 100.00 77.56 77.562006-07 249,930 0 923,552 923,552 1,173,482 26,921 100.00 78.70 78.702007-08 522,190 10,000 1,152,661 1,162,661 1,684,851 42,153 99.14 68.41 69.01April-June 2008 15,472 0 194680.70 194,681 210,153 4,893 100.00 92.64 92.64
*Data from 2000-01 onwards include only issues with a tenor and put/call option of 1year or more, while data for earlier years include all privately placed debt issues irrespective of tenor.Source: Prime Database

www.nseindia.com
Primary MarketISMR 44
Corporate Debt
There is a preference for raising resources in the primary market through debt instruments and private placement of debt has emerged as the major route for raising resources.
During 2007-08, total resources raised by the corporate sector increased by 43.58% to Rs.1,684,851 million (US $ 42,153 million) as compared with gross mobilization of Rs.1,173,782 million (US$ 26,921 million). The equity route was used to raise 30.99% of the total resources while the 69.01% of the resources were raised through the debt issues.
Within the debt issue route, Rs.10,000 million (US $ 250.19) were raised through public issues while 99.14% of the resources (Rs.1,152,661 million or US $ 28,838 million) were raised through the private placement route. After a period of two years, the public issues route was tapped for raising resources while the private placement route saw an increase of nearly 40.83% during the same period.(Table 2-12).
Policy Debates1
Rating of IPOs
Since April 2007, SEBI has made it mandatory for all IPOs to be graded by rating agencies. After a company gets the SEBI’s approval it is required to take a rating from atleast one of the SEBI registered credit rating agency. The issuer is required to disclose all the grades obtained by it for its IPO in the prospectus, abridged prospectus, issue advertisements and all other places where the issuer is advertising for the IPO. Expenses incurred for grading of IPO is borne by the issuer.
IPO Grading is designed to provide investors an independent, reliable and consistent assessment of the fundamentals of new Initial Public Offering.
However, there is a debate on whether it is possible to rate an IPO. It may not be possible to do so. Equity, by its very nature, is a risky investment, so a precise rating as in debt instruments is not possible. What the rating agencies have offered is an analysis of the prospectus. So far, companies made detailed disclosures in the prospectus, which an investor was expected to read before deciding whether or not to invest. It is now being argued that with too many IPOs crowding the market, investors need assistance in understanding what is on offer and do not have the time and expertise to go through the entire offer document.
The idea of providing for IPO rating is to provide investors with an independent view on an IPO. However, how independent this is would depend on the working of a particular agency. For instance CRISIL, which is pushing for the IPO rating business, has said that it will not comment on pricing, nor will it do a forensic audit. It has clarifi ed that
“CRISIL IPO (Initial Public Offering) Grading is an opinion on the fundamentals of the graded issue that refl ects CRISIL’s independence and expertise. This opinion is expressed as a relative assessment in relation to other listed equity securities in India. The assessment is based on a grading exercise carried out by industry specialists from CRISIL Research. A CRISIL IPO Grade 5/5 indicates strong fundamentals and a CRISIL IPO Grade 1/5 indicates poor fundamentals. CRISIL IPO Grading refl ects its assessment of the graded company’s equity fundamentals as distinct from an assessment of debt fundamentals. A CRISIL IPO Grade should not be construed to mean a comment on the price of the graded security nor is it a recommendation to invest or not to invest in the graded security.”
The issue according to some experts is that if the rating agency is only doing an analysis of information provided in the prospectus and is refusing to comment on the pricing of shares, is it helping investors take a decision? They opine that pricing is the most critical factor in evaluating IPOs because the shares of most companies are attractive at a price and by not taking pricing into consideration the usefulness of grading is diminished. Also, the agency is not questioning the correctness of information provided by companies. So, what it is offering is only what any knowledgeable investor can himself gather from the offer document.
1 The views and approaches refl ected in the policy debates are not necessarily of the NSE.

www.nseindia.com
Primary Market ISMR45
They further suggest that, even if it is taken that such a rating is helpful for investors who are not too knowledgeable to decipher relevant information from the prospectus, there is the issue of confl icts of interests arising out of the issuer paying for the rating. This concern exists for the entire rating scenario where the rating agency is paid by the rated entity.
All these issues need further debate and may be regulatory intervention to ensure that IPO grading serves the purpose for which it is intended in an effective manner.
Indian Depository Receipts
IDRs were introduced in 2004 based on a concept similar to that of GDRs and ADRs, with the objective of providing a platform to foreign companies to directly raise capital in India rather than take the route of ADRs/GDRs or equity/debt instruments in foreign markets. Initially, the eligibility norms for companies seeking to issue IDRs were quite stringent, viz. the issuer company should have pre-issue paid-up capital and free reserves of at least $100 million, an average turnover of $500 million during the three preceding fi nancial years, profi ts for at least fi ve years preceding the issue, dividends of not less than 10% in each year for the said period and a pre-issue debt-equity ratio of not more than 2:1.
These norms were relaxed in July, 2007, as detailed in the section on IDRs above. However, even after this relaxation, not a single foreign company has come to the Indian market for raising capital since IDRs were introduced in 2004. Some market experts are of the view that even the diluted eligibility criteria for companies to issue IDRs are still very high.
One of the other reasons attributed for the IDR market not picking up is the bar on FII’s and Non-Resident Indians from investing in these securities. The existing SEBI guidelines for IDRs specify that at least 50 per cent of the issue should be subscribed by qualifi ed institutional buyers (QIBs). FIIs are recognised as QIBs.
Another issue as per experts is that the Indian Income Tax Act, 1961, contains no specifi c provision for taxing any gains on sale of IDRs. Thus, the general rules on taxing of capital gains apply making it costly for a foreign company to raise capital from India.
All these issues plaguing this new instrument need to be addressed to have a vibrant market for IDRs.

www.nseindia.com
Primary MarketISMR 46
Annexure 2-1: Details of Private Placements Issues in the equity segment by NSE- listed Companies during the period April 01, 2007 to June 30, 2008
Sr. No. Company Name
Number of Securities
issued
Funds Raised
(Rs. mn.)
Funds Raised (US $ mn.)
Par Value(Rs.)
Par Value(US $.)
Issue Price (Rs.)
Issue Price (US $)
1 Aarvee Denims & Exports Limited 972,400 84 1.95 10.00 0.23 86.00 2.002 Aditya Birla Nuvo Limited 1,700,000 3413 79.46 10.00 0.23 2,007.45 46.743 Agro Dutch Industries Limited 750,000 21 0.48 10.00 0.23 27.50 0.644 Agro Dutch Industries Limited 1,580,000 43 1.01 10.00 0.23 27.50 0.645 Ahmednagar Forgings Ltd 1,700,000 408 9.50 10.00 0.23 240.00 5.596 Allcargo Global Logistics Limited 1,000 1 0.02 10.00 0.23 934.00 21.757 Alok Industries Limited 933,793 95 2.22 10.00 0.23 102.00 2.378 Alok Industries Limited 9,800,000 1000 23.27 10.00 0.23 102.00 2.379 Alps Industries Ltd. 2,000,000 130 3.03 10.00 0.23 65.00 1.51
10 Amtek Auto Ltd 7,000,000 3220 74.97 2.00 0.05 460.00 10.7111 Amtek India Limited 5,500,000 963 22.41 2.00 0.05 175.00 4.0712 Anant Raj Industries Limited 1,500,000 263 6.11 10.00 0.23 175.00 4.0713 Anant Raj Industries Limited 5,560,222 6836 159.17 10.00 0.23 1,229.51 28.6314 Anant Raj Industries Limited 1,504,000 902 21.01 10.00 0.23 600.00 13.9715 ANG Auto Limited 507,500 38 0.89 10.00 0.23 75.00 1.7516 ANG Auto Limited 567,500 43 0.99 10.00 0.23 75.00 1.7517 Ankur Drugs And Pharma Limited 2,043,000 458 10.65 10.00 0.23 224.00 5.2218 Ansal Housing and Construction Limited 500,000 33 0.77 10.00 0.23 66.50 1.5519 Ansal Housing and Construction Limited 780,000 52 1.21 10.00 0.23 66.50 1.5520 Ansal Housing and Construction Limited 330,000 34 0.80 10.00 0.23 104.50 2.4321 Ansal Housing and Construction Limited 670,000 70 1.63 10.00 0.23 104.50 2.4322 Apollo Hospitals Enterprise Ltd 7,047,119 4264 99.28 10.00 0.23 605.07 14.0923 Apollo Tyres Ltd 9,000,000 264 6.14 1.00 0.02 29.30 0.6824 Apollo Tyres Ltd 3,000,000 88 2.05 1.00 0.02 29.30 0.6825 Apollo Tyres Ltd 12,420,000 364 8.47 1.00 0.02 29.30 0.6826 Apollo Tyres Ltd 15,580,000 456 10.63 1.00 0.02 29.30 0.6827 The Andhra Pradesh Paper Mills Limited 1,913,875 200 4.66 10.00 0.23 104.50 2.4328 Aptech Limited 3,600,000 202 4.69 10.00 0.23 56.00 1.3029 Aptech Limited 1,450,000 164 3.81 10.00 0.23 113.00 2.6330 Aptech Limited 600,000 68 1.58 10.00 0.23 113.00 2.6331 Archies Limited 250,000 40 0.93 10.00 0.23 159.50 3.7132 Arihant Foundations & Housing Ltd 150,000 30 0.70 10.00 0.23 201.00 4.6833 Arihant Foundations & Housing Ltd 850,000 171 3.98 10.00 0.23 201.00 4.6834 Asian Electronics Ltd 570,000 137 3.19 10.00 0.23 240.00 5.5935 Assam Company Limited 81,000,000 1883 43.85 1.00 0.02 23.25 0.5436 Aurionpro Solutions Limited 1,030,000 260 6.04 10.00 0.23 252.00 5.8737 Aurionpro Solutions Limited 629,663 159 3.69 10.00 0.23 252.00 5.8738 Aurionpro Solutions Limited 105,337 27 0.62 10.00 0.23 252.00 5.8739 Aurionpro Solutions Limited 225,000 83 1.94 10.00 0.23 370.00 8.6140 Autoline Industries Limited 538,125 215 5.01 10.00 0.23 400.00 9.3141 Autoline Industries Limited 50,000 20 0.47 10.00 0.23 403.50 9.3942 Axis Bank Limited 30,695,129 19031 443.10 10.00 0.23 620.00 14.4443 B.A.G Films and Media Limited 20,250,000 263 6.13 2.00 0.05 13.00 0.3044 B.A.G Films and Media Limited 13,078,000 262 6.09 2.00 0.05 20.00 0.4745 B.A.G Films and Media Limited 9,400,000 565 13.16 2.00 0.05 60.15 1.40
Contd.

www.nseindia.com
Primary Market ISMR47
Sr. No. Company Name
Number of Securities
issued
Funds Raised
(Rs. mn.)
Funds Raised (US $ mn.)
Par Value(Rs.)
Par Value(US $.)
Issue Price (Rs.)
Issue Price (US $)
46 Bajaj Auto Finance Ltd 1,758,600 721 16.79 10.00 0.23 410.00 9.5547 Bajaj Auto Finance Ltd 1,247,940 512 11.91 10.00 0.23 410.00 9.5548 Balrampur Chini Mills Ltd 7,300,000 672 15.64 1.00 0.02 92.00 2.1449 Banco Products (I) Ltd 3,391,040 102 2.37 2.00 0.05 30.00 0.7050 Bartronics India Limited 4,630,000 602 14.01 10.00 0.23 130.00 3.0351 Bhartiya International Limited 500,000 50 1.16 10.00 0.23 100.00 2.3352 Bhartiya International Limited 585,000 59 1.36 10.00 0.23 100.00 2.3353 Bilpower Limited 608,100 59 1.37 10.00 0.23 97.00 2.2654 Bilpower Limited 891,930 87 2.01 10.00 0.23 97.00 2.2655 Bilpower Limited 1,499,970 145 3.39 10.00 0.23 97.00 2.2656 BOC India Limited 36,200,000 5973 139.07 10.00 0.23 165.00 3.8457 Bpl Limited 3,000,000 129 3.00 10.00 0.23 43.02 1.0058 Bpl Limited 820,344 60 1.39 10.00 0.23 72.99 1.7059 Cairn India Limited 113,000,000 25346 590.13 10.00 0.23 224.30 5.2260 California Software Company Limited 555,556 50 1.16 10.00 0.23 90.00 2.1061 California Software Company Limited 125,000 11 0.26 10.00 0.23 90.00 2.1062 California Software Company Limited 2,393,600 239 5.57 10.00 0.23 100.00 2.3363 California Software Company Limited 925,000 83 1.94 10.00 0.23 90.00 2.1064 Cambridge Solutions Limited 6,158,986 1336 31.12 10.00 0.23 217.00 5.0565 CESC Ltd. 2,000,000 433 10.09 10.00 0.23 216.68 5.0466 Classic Diamonds (India) Limited 1,000,000 56 1.30 2.00 0.05 56.00 1.3067 Clutch Auto Limited 1,520,000 179 4.18 10.00 0.23 118.00 2.7568 Clutch Auto Limited 800,000 94 2.20 10.00 0.23 118.00 2.7569 Color Chips Limited 330,000 4 0.09 10.00 0.23 12.22 0.2870 Core Projects and Technologies Limited 1,350,000 38 0.88 2.00 0.05 28.00 0.6571 City Union Bank Ltd. 1,200,000 203 4.72 10.00 0.23 169.00 3.9372 City Union Bank Ltd. 1,800,000 304 7.09 10.00 0.23 169.15 3.9473 City Union Bank Ltd. 5,000,000 950 22.12 10.00 0.23 190.00 4.4274 Cubex Tubings Ltd. 825,000 40 0.92 10.00 0.23 48.00 1.1275 Cubex Tubings Ltd. 1,170,000 56 1.31 10.00 0.23 48.00 1.1276 Cybertech Systems And Software Ltd. 1,750,000 23 0.54 10.00 0.23 13.25 0.3177 Development Credit Bank Limited 26,666,667 2800 65.19 10.00 0.23 105.00 2.4478 Dcw Ltd 23,610,000 283 6.60 2.00 0.05 12.00 0.2879 Dewan Housing Finance Corporation Ltd 4,000,000 400 9.31 10.00 0.23 100.00 2.3380 Dewan Housing Finance Corporation Ltd 4,000,000 400 9.31 10.00 0.23 100.00 2.3381 Dewan Housing Finance Corporation Ltd 7,065,456 530 12.34 10.00 0.23 75.00 1.7582 Dewan Housing Finance Corporation Ltd 3,000,000 300 6.98 10.00 0.23 100.00 2.3383 Dewan Housing Finance Corporation Ltd 3,000,000 300 6.98 10.00 0.23 100.00 2.3384 Dewan Housing Finance Corporation Ltd 4,000,000 400 9.31 10.00 0.23 100.00 2.3385 Dewan Housing Finance Corporation Ltd 4,000,000 400 9.31 10.00 0.23 100.00 2.3386 Dwarikesh Sugar Industries Limited 750,000 75 1.75 10.00 0.23 100.20 2.3387 Everest Kanto Cylinder Limited 3,548,027 887 20.65 2.00 0.05 250.00 5.8288 Electrosteel Castings Ltd 12,550,000 550 12.80 1.00 0.02 43.80 1.0289 Electrosteel Castings Ltd 2,030,000 138 3.21 1.00 0.02 68.00 1.5890 Electrotherm (India) Ltd. 1,366,666 820 19.09 10.00 0.23 600.00 13.9791 Electrotherm (India) Ltd. 475,000 285 6.64 10.00 0.23 600.00 13.9792 Emco Limited 300,000 218 5.06 10.00 0.23 725.00 16.88
Contd.
Contd.

www.nseindia.com
Primary MarketISMR 48
Sr. No. Company Name
Number of Securities
issued
Funds Raised
(Rs. mn.)
Funds Raised (US $ mn.)
Par Value(Rs.)
Par Value(US $.)
Issue Price (Rs.)
Issue Price (US $)
93 Era Infra Engineering Limited 3,765,000 508 11.83 10.00 0.23 135.00 3.1494 Era Infra Engineering Limited 725,000 98 2.28 10.00 0.23 135.00 3.1495 Escorts Ltd 3,611,610 303 7.05 10.00 0.23 83.79 1.9596 Ess Dee Aluminium Limited 1,410,000 811 18.88 10.00 0.23 575.00 13.3997 Four Soft Limited 153,846 10 0.23 5.00 0.12 65.00 1.5198 Four Soft Limited 153,744 10 0.23 5.00 0.12 65.00 1.5199 Four Soft Limited 153,846 10 0.23 5.00 0.12 65.00 1.51
100 Four Soft Limited 158,063 10 0.24 5.00 0.12 65.00 1.51101 Four Soft Limited 153,204 10 0.23 5.00 0.12 65.00 1.51102 Four Soft Limited 85,376 6 0.13 5.00 0.12 65.00 1.51103 Four Soft Limited 1,062,102 80 1.85 5.00 0.12 75.00 1.75104 Four Soft Limited 177,017 13 0.31 5.00 0.12 75.00 1.75105 Four Soft Limited 531,051 40 0.93 5.00 0.12 75.00 1.75106 Four Soft Limited 153,846 10 0.23 5.00 0.12 65.00 1.51107 GANESH HOUSING CORPORATION LTD. 660,000 75 1.74 10.00 0.23 113.00 2.63108 Garware Wall Ropes Ltd. 750,000 50 1.16 10.00 0.23 66.50 1.55109 Garware Wall Ropes Ltd. 998,000 66 1.55 10.00 0.23 66.50 1.55110 Garware Offshore Services Limited 311,100 22 0.52 10.00 0.23 72.00 1.68111 Garware Offshore Services Limited 474,925 34 0.80 10.00 0.23 72.00 1.68112 Garware Offshore Services Limited 463,900 46 1.08 10.00 0.23 100.00 2.33113 Garware Offshore Services Limited 703,500 70 1.64 10.00 0.23 100.00 2.33114 Garware Offshore Services Limited 352,500 35 0.82 10.00 0.23 100.00 2.33115 Garware Offshore Services Limited 2,272,727 250 5.82 10.00 0.23 110.00 2.56116 Garware Offshore Services Limited 280,100 28 0.65 10.00 0.23 100.00 2.33117 GATI LIMITED 985,000 83 1.94 2.00 0.05 84.61 1.97118 GATI LIMITED 3,086,185 261 6.08 2.00 0.05 84.61 1.97119 GATI LIMITED 2,493,000 224 5.22 2.00 0.05 90.00 2.10120 GATI LIMITED 4,135,000 372 8.66 2.00 0.05 90.00 2.10121 Gemini Communication Limited 900,000 155 3.61 5.00 0.12 172.50 4.02122 Genesys International Corporation Limited 575,000 11 0.25 10.00 0.23 19.00 0.44123 Genus Power Infrastructures Limited 900,000 504 11.73 10.00 0.23 560.00 13.04124 Genus Power Infrastructures Limited 600,000 336 7.82 10.00 0.23 560.00 13.04125 Genus Power Infrastructures Limited 300,000 60 1.39 10.00 0.23 199.00 4.63126 Genus Power Infrastructures Limited 700,000 139 3.24 10.00 0.23 199.00 4.63127 Geodesic Limited 1,040,000 168 3.92 2.00 0.05 162.00 3.77128 Geodesic Limited 306,296 81 1.89 2.00 0.05 265.00 6.17129 Geojit Financial Services Limited 56,804,870 1477 34.39 1.00 0.02 26.00 0.61130 GHCL Limited 2,500,000 163 3.79 10.00 0.23 65.10 1.52131 Gitanjali Gems Limited 1,554,050 451 10.49 10.00 0.23 290.00 6.75132 Golden Tobacco Limited 800,000 80 1.86 10.00 0.23 100.00 2.33133 Goldiam International Limited 50,000 8 0.17 10.00 0.23 150.00 3.49134 Goldstone Technologies Ltd. 1,900,000 40 0.93 10.00 0.23 21.00 0.49135 Goldstone Technologies Ltd. 5,400,000 113 2.64 10.00 0.23 21.00 0.49136 Goldstone Technologies Ltd. 35,918 4 0.10 10.00 0.23 122.00 2.84137 Goldstone Technologies Ltd. 344,828 50 1.16 10.00 0.23 145.00 3.38138 Granules India Limited 194,037 20 0.46 10.00 0.23 102.50 2.39139 Granules India Limited 2,180,067 230 5.35 10.00 0.23 105.50 2.46
Contd.
Contd.

www.nseindia.com
Primary Market ISMR49
Sr. No. Company Name
Number of Securities
issued
Funds Raised
(Rs. mn.)
Funds Raised (US $ mn.)
Par Value(Rs.)
Par Value(US $.)
Issue Price (Rs.)
Issue Price (US $)
140 Granules India Limited 2,211,200 233 5.43 10.00 0.23 105.50 2.46141 Granules India Limited 2,057,578 243 5.66 10.00 0.23 118.10 2.75142 Granules India Limited 1,000,180 103 2.39 10.00 0.23 102.50 2.39143 Greenply Industries Ltd 145,000 17 0.38 5.00 0.12 114.00 2.65144 Greenply Industries Ltd 400,000 46 1.06 5.00 0.12 114.00 2.65145 Gujarat State Petronet Limited 18,738,000 1074 24.99 10.00 0.23 57.29 1.33146 GTL Infrastructure Limited 33,741,060 1350 31.42 10.00 0.23 40.00 0.93147 GTL Infrastructure Limited 1,700,000 68 1.58 10.00 0.23 40.00 0.93148 Gujarat NRE Coke Ltd. 14,000,000 525 12.22 10.00 0.23 37.50 0.87149 Gujarat NRE Coke Ltd. 2,500,000 300 6.98 10.00 0.23 120.00 2.79150 Havells India Limited 4,160,000 2600 60.54 5.00 0.12 625.00 14.55151 Housing Development Finance Corporation Ltd. 15,250,000 26383 614.26 10.00 0.23 1,730.00 40.28152 Housing Development Finance Corporation Ltd. 2,750,000 4758 110.77 10.00 0.23 1,730.00 40.28153 Hdfc Bank Ltd 13,582,000 13901 323.66 10.00 0.23 1,023.49 23.83154 Heritage Foods (India) Ltd. 1,000,000 350 8.15 10.00 0.23 350.00 8.15155 Heritage Foods (India) Ltd. 539,500 138 3.22 10.00 0.23 256.00 5.96156 Hexaware Technologies Limited 10,555,700 1500 34.92 2.00 0.05 142.10 3.31157 Himatsingka Seide Ltd 256,000 33 0.77 5.00 0.12 130.00 3.03158 Himatsingka Seide Ltd 256,000 33 0.77 5.00 0.12 130.00 3.03159 Himatsingka Seide Ltd 256,000 33 0.77 5.00 0.12 130.00 3.03160 Himatsingka Seide Ltd 256,000 33 0.77 5.00 0.12 130.00 3.03161 Hindalco Industries Ltd. 67,500,000 11736 273.25 1.00 0.02 173.87 4.05162 Hindustan Dorr-Oliver Ltd 250,000 16 0.37 2.00 0.05 64.00 1.49163 Hindustan Dorr-Oliver Ltd 1,000,000 64 1.49 2.00 0.05 64.00 1.49164 Indiabulls Real Estate Limited 11,500,000 1587 36.95 2.00 0.05 138.00 3.21165 Indiabulls Real Estate Limited 10,000,000 1151 26.81 2.00 0.05 115.13 2.68166 Indo Count Industries Ltd 2,528,625 61 1.41 10.00 0.23 24.00 0.56167 ICSA (India) Limited 220,000 88 2.05 10.00 0.23 400.00 9.31168 ICSA (India) Limited 1,110,000 444 10.34 10.00 0.23 400.00 9.31169 IG Petrochemicals Ltd. 4,500,000 135 3.14 10.00 0.23 30.00 0.70170 Indiabulls Financial Services Limited 11,500,000 1863 43.38 2.00 0.05 162.00 3.77171 Indiabulls Financial Services Limited 5,000,000 674 15.70 2.00 0.05 134.87 3.14172 Indiabulls Financial Services Limited 5,000,000 674 15.70 2.00 0.05 134.87 3.14173 India Infoline Limited 588,235 100 2.33 10.00 0.23 170.00 3.96174 India Infoline Limited 2,600,000 442 10.29 10.00 0.23 170.00 3.96175 India Infoline Limited 3,700,000 5550 129.22 10.00 0.23 1,500.00 34.92176 IMP Powers Ltd 510,000 44 1.01 10.00 0.23 85.34 1.99177 IMP Powers Ltd 279,938 16 0.36 10.00 0.23 55.63 1.30178 IMP Powers Ltd 100,000 16 0.37 10.00 0.23 161.00 3.75179 Ind-Swift Laboratories Ltd. 335,000 23 0.55 10.00 0.23 70.00 1.63180 Ind-Swift Laboratories Ltd. 1,196,000 84 1.95 10.00 0.23 70.00 1.63181 Infotech Enterprises Ltd 5,583,697 2010 46.80 5.00 0.12 360.00 8.38182 ING Vysya Bank Limited 5,080,947 1575 36.67 10.00 0.23 310.00 7.22183 IOL Netcom Limited 800,000 57 1.32 10.00 0.23 71.00 1.65184 IOL Netcom Limited 700,000 67 1.55 10.00 0.23 95.00 2.21185 Jai Corp Limited 5,649,740 5847 136.15 1.00 0.02 1,035.00 24.10186 Jai Corp Limited 260,870 270 6.29 1.00 0.02 1,035.00 24.10
Contd.
Contd.

www.nseindia.com
Primary MarketISMR 50
Sr. No. Company Name
Number of Securities
issued
Funds Raised
(Rs. mn.)
Funds Raised (US $ mn.)
Par Value(Rs.)
Par Value(US $.)
Issue Price (Rs.)
Issue Price (US $)
187 Jayant Agro Organics Ltd. 600,000 39 0.91 5.00 0.12 65.00 1.51188 Jayant Agro Organics Ltd. 600,000 63 1.47 5.00 0.12 105.00 2.44189 Jayant Agro Organics Ltd. 690,000 45 1.04 5.00 0.12 65.00 1.51190 JBF Industries Ltd. 2,500,000 306 7.13 10.00 0.23 122.50 2.85191 JIK Industries Limited 6,042,398 82 1.90 10.00 0.23 13.50 0.31192 JIK Industries Limited 6,042,398 82 1.90 10.00 0.23 13.50 0.31193 JIK Industries Limited 3,950,507 55 1.27 10.00 0.23 13.80 0.32194 JIK Industries Limited 202,000 3 0.06 10.00 0.23 13.80 0.32195 JIK Industries Limited 854,941 20 0.47 10.00 0.23 23.60 0.55196 JIK Industries Limited 132,000 2 0.04 10.00 0.23 13.80 0.32197 Jindal Saw Limited 2,412,542 1165 27.13 10.00 0.23 483.00 11.25198 Jindal Drilling And Industries Limited 1,200,000 1536 35.76 10.00 0.23 1,280.00 29.80199 Jain Irrigation Systems Limited 356,250 55 1.29 10.00 0.23 155.00 3.61200 Jain Irrigation Systems Limited 411,250 64 1.48 10.00 0.23 155.00 3.61201 Jain Irrigation Systems Limited 411,250 64 1.48 10.00 0.23 155.00 3.61202 Jain Irrigation Systems Limited 356,250 55 1.29 10.00 0.23 155.00 3.61203 Jain Irrigation Systems Limited 411,250 64 1.48 10.00 0.23 155.00 3.61204 Jain Irrigation Systems Limited 356,250 55 1.29 10.00 0.23 155.00 3.61205 Jain Irrigation Systems Limited 356,250 55 1.29 10.00 0.23 155.00 3.61206 Jain Irrigation Systems Limited 411,250 64 1.48 10.00 0.23 155.00 3.61207 Jain Irrigation Systems Limited 2,500,000 996 23.20 10.00 0.23 398.50 9.28208 Jain Irrigation Systems Limited 1,102,600 527 12.27 10.00 0.23 478.15 11.13209 JK Lakshmi Cement Limited 4,102,500 400 9.31 10.00 0.23 97.50 2.27210 Jindal Stainless Limited 6,800,000 700 16.31 2.00 0.05 103.00 2.40211 Jindal Stainless Limited 3,177,550 327 7.62 2.00 0.05 103.00 2.40212 Jindal Stainless Limited 3,972,450 409 9.53 2.00 0.05 103.00 2.40213 Jindal Stainless Limited 7,550,000 778 18.11 2.00 0.05 103.00 2.40214 JSW Steel Limited 7,000,000 1,904 44.33 10 0.23 272.00 6.33215 JSW Steel Limited 8,000,000 2,176 50.66 10 0.23 272.00 6.33216 Jyoti Structures Ltd 1,300,000 53 1.23 2 0.05 40.50 0.94217 Kanoria Chemicals & Industries Ltd 2,034,000 203 4.74 10 0.23 100.00 2.33218 Kesar Enterprises Ltd. 451,600 44 1.02 10 0.23 97.00 2.26219 Kingfi sher Airlines Limited 1,963,640 295 6.86 10 0.23 150.00 3.49220 Kingfi sher Airlines Limited 35,222,231 5,459 127.11 10 0.23 155.00 3.61221 Kinetic Motor Company Limited 1,500,000 98 2.27 10 0.23 65.00 1.51222 Kinetic Motor Company Limited 1,000,000 65 1.51 10 0.23 65.00 1.51223 Klg Systel Ltd. 535,000 140 3.25 10 0.23 261.00 6.08224 Karuturi Networks Limited 4,000,000 349 8.12 10 0.23 87.24 2.03225 Karuturi Networks Limited 300,000 50 1.15 10 0.23 165.00 3.84226 Kopran Ltd. 675,550 30 0.71 10 0.23 44.83 1.04227 Kopran Ltd. 1,244,168 40 0.93 10 0.23 32.15 0.75228 KPIT Cummins Infosystems Limited 1,471,498 189 4.40 2 0.05 128.41 2.99229 KPIT Cummins Infosystems Limited 1,510,877 197 4.58 2 0.05 130.09 3.03230 K S Oils Limited 21,570,430 904 21.04 1 0.02 41.90 0.98231 K S Oils Limited 23,000,000 414 9.64 1 0.02 18.00 0.42232 Lakshmi Precision Screws Limited 900,000 91 2.12 10 0.23 101.00 2.35233 Lakshmi Energy and Foods Limited 2,875,000 374 8.70 2 0.05 130.00 3.03
Contd.
Contd.
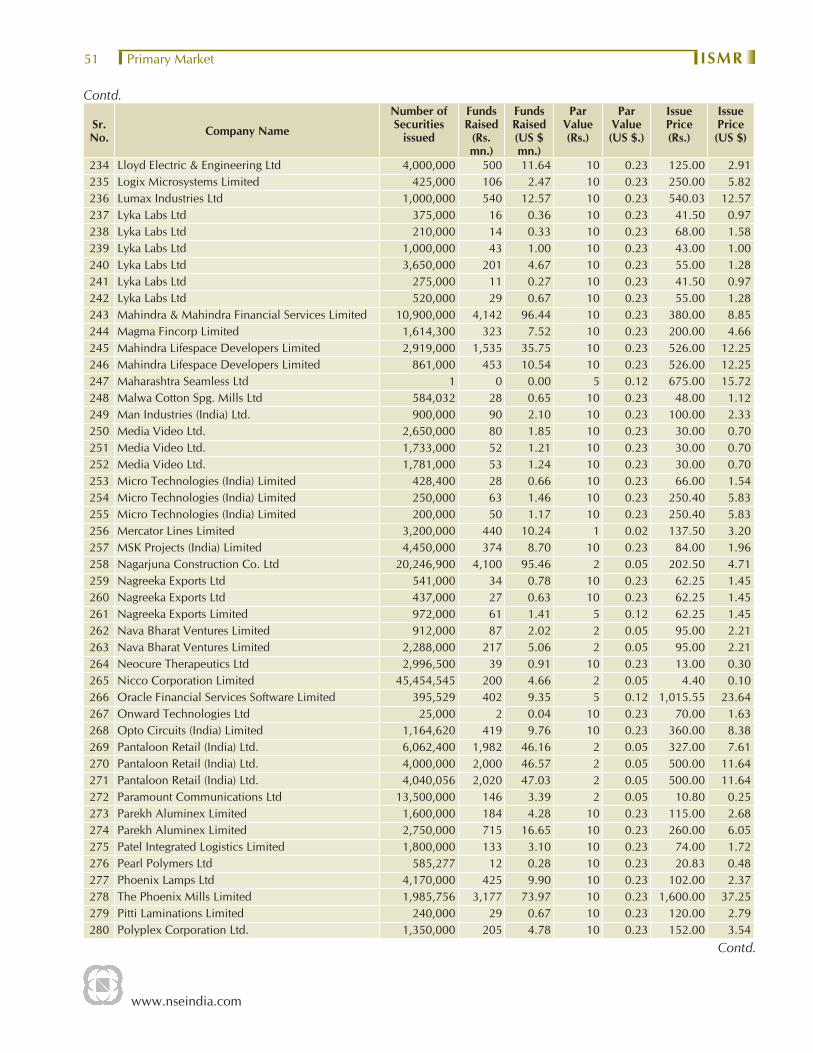
www.nseindia.com
Primary Market ISMR51
Sr. No. Company Name
Number of Securities
issued
Funds Raised
(Rs. mn.)
Funds Raised (US $ mn.)
Par Value(Rs.)
Par Value(US $.)
Issue Price (Rs.)
Issue Price (US $)
234 Lloyd Electric & Engineering Ltd 4,000,000 500 11.64 10 0.23 125.00 2.91235 Logix Microsystems Limited 425,000 106 2.47 10 0.23 250.00 5.82236 Lumax Industries Ltd 1,000,000 540 12.57 10 0.23 540.03 12.57237 Lyka Labs Ltd 375,000 16 0.36 10 0.23 41.50 0.97238 Lyka Labs Ltd 210,000 14 0.33 10 0.23 68.00 1.58239 Lyka Labs Ltd 1,000,000 43 1.00 10 0.23 43.00 1.00240 Lyka Labs Ltd 3,650,000 201 4.67 10 0.23 55.00 1.28241 Lyka Labs Ltd 275,000 11 0.27 10 0.23 41.50 0.97242 Lyka Labs Ltd 520,000 29 0.67 10 0.23 55.00 1.28243 Mahindra & Mahindra Financial Services Limited 10,900,000 4,142 96.44 10 0.23 380.00 8.85244 Magma Fincorp Limited 1,614,300 323 7.52 10 0.23 200.00 4.66245 Mahindra Lifespace Developers Limited 2,919,000 1,535 35.75 10 0.23 526.00 12.25246 Mahindra Lifespace Developers Limited 861,000 453 10.54 10 0.23 526.00 12.25247 Maharashtra Seamless Ltd 1 0 0.00 5 0.12 675.00 15.72248 Malwa Cotton Spg. Mills Ltd 584,032 28 0.65 10 0.23 48.00 1.12249 Man Industries (India) Ltd. 900,000 90 2.10 10 0.23 100.00 2.33250 Media Video Ltd. 2,650,000 80 1.85 10 0.23 30.00 0.70251 Media Video Ltd. 1,733,000 52 1.21 10 0.23 30.00 0.70252 Media Video Ltd. 1,781,000 53 1.24 10 0.23 30.00 0.70253 Micro Technologies (India) Limited 428,400 28 0.66 10 0.23 66.00 1.54254 Micro Technologies (India) Limited 250,000 63 1.46 10 0.23 250.40 5.83255 Micro Technologies (India) Limited 200,000 50 1.17 10 0.23 250.40 5.83256 Mercator Lines Limited 3,200,000 440 10.24 1 0.02 137.50 3.20257 MSK Projects (India) Limited 4,450,000 374 8.70 10 0.23 84.00 1.96258 Nagarjuna Construction Co. Ltd 20,246,900 4,100 95.46 2 0.05 202.50 4.71259 Nagreeka Exports Ltd 541,000 34 0.78 10 0.23 62.25 1.45260 Nagreeka Exports Ltd 437,000 27 0.63 10 0.23 62.25 1.45261 Nagreeka Exports Limited 972,000 61 1.41 5 0.12 62.25 1.45262 Nava Bharat Ventures Limited 912,000 87 2.02 2 0.05 95.00 2.21263 Nava Bharat Ventures Limited 2,288,000 217 5.06 2 0.05 95.00 2.21264 Neocure Therapeutics Ltd 2,996,500 39 0.91 10 0.23 13.00 0.30265 Nicco Corporation Limited 45,454,545 200 4.66 2 0.05 4.40 0.10266 Oracle Financial Services Software Limited 395,529 402 9.35 5 0.12 1,015.55 23.64267 Onward Technologies Ltd 25,000 2 0.04 10 0.23 70.00 1.63268 Opto Circuits (India) Limited 1,164,620 419 9.76 10 0.23 360.00 8.38269 Pantaloon Retail (India) Ltd. 6,062,400 1,982 46.16 2 0.05 327.00 7.61270 Pantaloon Retail (India) Ltd. 4,000,000 2,000 46.57 2 0.05 500.00 11.64271 Pantaloon Retail (India) Ltd. 4,040,056 2,020 47.03 2 0.05 500.00 11.64272 Paramount Communications Ltd 13,500,000 146 3.39 2 0.05 10.80 0.25273 Parekh Aluminex Limited 1,600,000 184 4.28 10 0.23 115.00 2.68274 Parekh Aluminex Limited 2,750,000 715 16.65 10 0.23 260.00 6.05275 Patel Integrated Logistics Limited 1,800,000 133 3.10 10 0.23 74.00 1.72276 Pearl Polymers Ltd 585,277 12 0.28 10 0.23 20.83 0.48277 Phoenix Lamps Ltd 4,170,000 425 9.90 10 0.23 102.00 2.37278 The Phoenix Mills Limited 1,985,756 3,177 73.97 10 0.23 1,600.00 37.25279 Pitti Laminations Limited 240,000 29 0.67 10 0.23 120.00 2.79280 Polyplex Corporation Ltd. 1,350,000 205 4.78 10 0.23 152.00 3.54
Contd.
Contd.

www.nseindia.com
Primary MarketISMR 52
Sr. No. Company Name
Number of Securities
issued
Funds Raised
(Rs. mn.)
Funds Raised (US $ mn.)
Par Value(Rs.)
Par Value(US $.)
Issue Price (Rs.)
Issue Price (US $)
281 Prajay Engineers Syndicate Limited 67,000 12 0.29 10 0.23 183.00 4.26282 Prajay Engineers Syndicate Limited 13,000 2 0.06 10 0.23 183.00 4.26283 Prajay Engineers Syndicate Limited 622,000 39 0.92 10 0.23 63.50 1.48284 Prajay Engineers Syndicate Limited 728,000 46 1.08 10 0.23 63.50 1.48285 Prajay Engineers Syndicate Limited 10,000 2 0.04 10 0.23 183.00 4.26286 Prajay Engineers Syndicate Limited 277,800 51 1.18 10 0.23 183.00 4.26287 Prajay Engineers Syndicate Limited 257,740 47 1.10 10 0.23 183.00 4.26288 Praj Industries Ltd 7,300,125 878 20.44 2 0.05 120.25 2.80289 Prakash Industries Ltd 15,000,000 150 3.49 10 0.23 10.00 0.23290 Prakash Industries Ltd 15,000,000 150 3.49 10 0.23 10.00 0.23291 Prakash Industries Ltd 6,250,000 1,188 27.65 10 0.23 190.00 4.42292 Precision Wires India Ltd 1,100,000 195 4.54 10 0.23 177.15 4.12293 Premier Limited 1,986,674 78 1.82 10 0.23 39.43 0.92294 Prime Securities Limited 1,870,000 514 11.97 5 0.12 275.00 6.40295 Provogue (India) Limited 2,900,000 1,305 30.38 10 0.23 450.00 10.48296 Provogue (India) Limited 900,000 405 9.43 10 0.23 450.00 10.48297 Radico Khaitan Limited 5,768,276 920 21.42 2 0.05 159.50 3.71298 Rana Sugars Ltd 2,200,000 68 1.59 10 0.23 31.00 0.72299 Rane Holdings Limited 1,650,000 297 6.92 10 0.23 180.00 4.19300 Reliance Capital Limited 21,700,000 4,948 115.19 10 0.23 228.00 5.31301 Shree Renuka Sugars Limited 1,000,000 626 14.57 10 0.23 625.71 14.57302 Ramkrishna Forgings Limited 129,310 15 0.35 10 0.23 116.00 2.70303 Radha Madhav Corporation Limited 1,000,000 63 1.47 10 0.23 63.15 1.47304 Radha Madhav Corporation Limited 57,390 3 0.06 10 0.23 45.00 1.05305 Radha Madhav Corporation Limited 450,000 20 0.47 10 0.23 45.00 1.05306 Radha Madhav Corporation Limited 3,150,000 268 6.23 10 0.23 85.00 1.98307 Reliance Natural Resources Limited 130,000,000 3,335 77.64 5 0.12 25.65 0.60308 Reliance Natural Resources Limited 160,000,000 4,104 95.55 5 0.12 25.65 0.60309 Rpg Cables Ltd 1,000,000 46 1.08 10 0.23 46.30 1.08310 Rpg Cables Ltd 764,583 37 0.85 10 0.23 48.00 1.12311 Rpg Cables Ltd 1,275,000 59 1.37 10 0.23 46.30 1.08312 Sabero Organics Gujarat Ltd 1,250,000 33 0.76 10 0.23 26.17 0.61313 Sabero Organics Gujarat Ltd 1,849,685 26 0.61 10 0.23 14.12 0.33314 Sabero Organics Gujarat Ltd 982,423 14 0.32 10 0.23 14.12 0.33315 Sabero Organics Gujarat Ltd 867,577 12 0.29 10 0.23 14.12 0.33316 Sagar Cements Ltd. 550,000 45 1.05 10 0.23 82.00 1.91317 Sagar Cements Ltd. 1,000,000 190 4.42 10 0.23 190.00 4.42318 Sagar Cements Ltd. 367,432 30 0.70 10 0.23 82.00 1.91319 Sagar Cements Ltd. 267,568 22 0.51 10 0.23 82.00 1.91320 Sagar Cements Ltd. 665,000 55 1.27 10 0.23 82.00 1.91321 Saksoft Limited 140,000 33 0.76 10 0.23 233.65 5.44322 Sangam (India) Ltd. 591,160 28 0.64 10 0.23 46.70 1.09323 Sanghi Industries Limited 28,910,000 535 12.45 10 0.23 18.50 0.43324 Sanghi Industries Limited 14,069,000 260 6.06 10 0.23 18.50 0.43325 Sanghi Industries Limited 2,000,000 142 3.31 10 0.23 71.00 1.65326 Sanghvi Movers Ltd. 1,287,000 180 4.20 2 0.05 140.00 3.26327 Sanghvi Movers Ltd. 833,420 117 2.72 2 0.05 140.00 3.26
Contd.
Contd.

www.nseindia.com
Primary Market ISMR53
Sr. No. Company Name
Number of Securities
issued
Funds Raised
(Rs. mn.)
Funds Raised (US $ mn.)
Par Value(Rs.)
Par Value(US $.)
Issue Price (Rs.)
Issue Price (US $)
328 Sanghvi Movers Ltd. 879,580 123 2.87 2 0.05 140.00 3.26329 South Asian Petrochem Limited 42,192,819 718 16.71 10 0.23 17.01 0.40330 Sb&T International Ltd 450,000 36 0.84 10 0.23 80.00 1.86331 Sb&T International Ltd 400,000 32 0.75 10 0.23 80.00 1.86332 Sb&T International Ltd 100,000 10 0.22 10 0.23 95.00 2.21333 Sharyans Resources Ltd. 1,000,000 205 4.77 10 0.23 205.00 4.77334 Sharyans Resources Ltd. 2,340,000 538 12.53 10 0.23 230.00 5.36335 Sharyans Resources Ltd. 1,000,000 205 4.77 10 0.23 205.00 4.77336 Shiv-Vani Oil & Gas Exploration Services Limited 2,733,330 1,025 23.86 10 0.23 375.00 8.73337 Shri Lakshmi Cotsyn Limited 700,000 90 2.10 10 0.23 129.00 3.00338 Shri Lakshmi Cotsyn Limited 400,000 52 1.20 10 0.23 129.00 3.00339 Shreyans Industries Ltd 3,000,000 40 0.93 10 0.23 13.25 0.31340 Shreyans Industries Ltd 2,000,000 20 0.47 10 0.23 10.00 0.23341 Sical Logistics Limited 5,250,000 1,166 27.14 10 0.23 222.00 5.17342 Sical Logistics Limited 4,100,000 1,025 23.86 10 0.23 250.00 5.82343 Simbhaoli Sugars Limited 746,000 32 0.74 10 0.23 42.55 0.99344 Simplex Infrastructures Limited 200,000 80 1.87 2 0.05 401.00 9.34345 Sintex Industries Ltd. 2,688,000 1,222 28.46 2 0.05 454.74 10.59346 Sona Koyo Steering Systems Ltd. 4,616,535 310 7.21 2 0.05 67.10 1.56347 Sona Koyo Steering Systems Ltd. 2,423,681 163 3.79 2 0.05 67.10 1.56348 Spentex Industries Ltd 275,000 10 0.23 10 0.23 36.54 0.85349 SREI Infrastructure Finance Limited 7,200,000 720 16.76 10 0.23 100.00 2.33350 Shriram Transport Finance Co. Ltd. 9,100,000 1,019 23.73 10 0.23 112.00 2.61351 Shriram Transport Finance Co. Ltd. 6,900,000 773 17.99 10 0.23 112.00 2.61352 Shriram Transport Finance Co. Ltd. 12,000,000 3,600 83.82 10 0.23 300.00 6.98353 Steel Strips Wheels Limited 1,255,856 213 4.97 10 0.23 170.00 3.96354 Strides Arcolab Limited 50,000 17 0.40 10 0.23 342.10 7.97355 Strides Arcolab Limited 4,000,000 1,600 37.25 10 0.23 400.00 9.31356 Sti India Ltd 4,000,000 41 0.95 10 0.23 10.20 0.24357 Sterlite Technologies Limited 2,800,000 280 6.52 5 0.12 100.00 2.33358 Sterlite Technologies Limited 2,800,000 280 6.52 5 0.12 100.00 2.33359 Subhash Projects & Marketing Ltd 5,493,876 1,346 31.34 2 0.05 245.00 5.70360 Summit Securities Limited 4,300,000 114 2.65 10 0.23 26.43 0.62361 Summit Securities Limited 6,572,000 174 4.04 10 0.23 26.43 0.62362 Supreme Tex Mart Limited 3,870,000 148 3.45 5 0.12 38.26 0.89363 Su-Raj Diamonds and Jewellery Limited 3,620,000 308 7.16 10 0.23 85.00 1.98364 Surana Industries Limited 1,650,000 248 5.76 10 0.23 150.00 3.49365 Suryajyoti Spinning Mills Limited 600,000 17 0.41 10 0.23 29.00 0.68366 Suryajyoti Spinning Mills Limited 600,000 17 0.41 10 0.23 29.00 0.68367 Surya Pharmaceutical Limited 1,598,750 112 2.61 10 0.23 70.00 1.63368 Surya Pharmaceutical Limited 1,391,250 97 2.27 10 0.23 70.00 1.63369 Tata Power Co. Ltd. 9,894,000 5,809 135.24 10 0.23 587.08 13.67370 Tata Steel Limited 28,500,000 13,802 321.34 10 0.23 484.27 11.28371 Tata Tea Ltd 2,810,000 2,041 47.53 10 0.23 726.45 16.91372 Transport Corporation of India Limited 5,000,000 526 12.25 2 0.05 105.25 2.45373 Techno Electric and Engineering Co Ltd 1,600,000 128 2.98 2 0.05 80.00 1.86374 Tourism Finance Corpn Of India Ltd 13,297,648 638 14.86 10 0.23 48.00 1.12
Contd.
Contd.
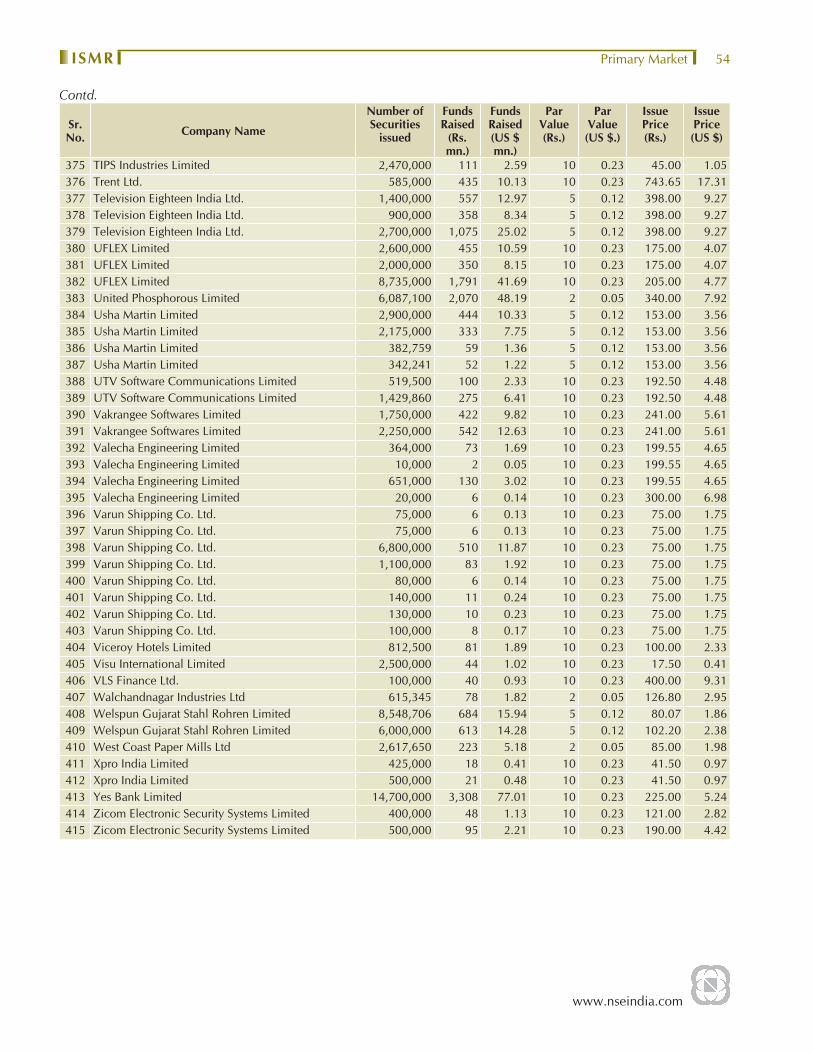
www.nseindia.com
Primary MarketISMR 54
Sr. No. Company Name
Number of Securities
issued
Funds Raised
(Rs. mn.)
Funds Raised (US $ mn.)
Par Value(Rs.)
Par Value(US $.)
Issue Price (Rs.)
Issue Price (US $)
375 TIPS Industries Limited 2,470,000 111 2.59 10 0.23 45.00 1.05376 Trent Ltd. 585,000 435 10.13 10 0.23 743.65 17.31377 Television Eighteen India Ltd. 1,400,000 557 12.97 5 0.12 398.00 9.27378 Television Eighteen India Ltd. 900,000 358 8.34 5 0.12 398.00 9.27379 Television Eighteen India Ltd. 2,700,000 1,075 25.02 5 0.12 398.00 9.27380 UFLEX Limited 2,600,000 455 10.59 10 0.23 175.00 4.07381 UFLEX Limited 2,000,000 350 8.15 10 0.23 175.00 4.07382 UFLEX Limited 8,735,000 1,791 41.69 10 0.23 205.00 4.77383 United Phosphorous Limited 6,087,100 2,070 48.19 2 0.05 340.00 7.92384 Usha Martin Limited 2,900,000 444 10.33 5 0.12 153.00 3.56385 Usha Martin Limited 2,175,000 333 7.75 5 0.12 153.00 3.56386 Usha Martin Limited 382,759 59 1.36 5 0.12 153.00 3.56387 Usha Martin Limited 342,241 52 1.22 5 0.12 153.00 3.56388 UTV Software Communications Limited 519,500 100 2.33 10 0.23 192.50 4.48389 UTV Software Communications Limited 1,429,860 275 6.41 10 0.23 192.50 4.48390 Vakrangee Softwares Limited 1,750,000 422 9.82 10 0.23 241.00 5.61391 Vakrangee Softwares Limited 2,250,000 542 12.63 10 0.23 241.00 5.61392 Valecha Engineering Limited 364,000 73 1.69 10 0.23 199.55 4.65393 Valecha Engineering Limited 10,000 2 0.05 10 0.23 199.55 4.65394 Valecha Engineering Limited 651,000 130 3.02 10 0.23 199.55 4.65395 Valecha Engineering Limited 20,000 6 0.14 10 0.23 300.00 6.98396 Varun Shipping Co. Ltd. 75,000 6 0.13 10 0.23 75.00 1.75397 Varun Shipping Co. Ltd. 75,000 6 0.13 10 0.23 75.00 1.75398 Varun Shipping Co. Ltd. 6,800,000 510 11.87 10 0.23 75.00 1.75399 Varun Shipping Co. Ltd. 1,100,000 83 1.92 10 0.23 75.00 1.75400 Varun Shipping Co. Ltd. 80,000 6 0.14 10 0.23 75.00 1.75401 Varun Shipping Co. Ltd. 140,000 11 0.24 10 0.23 75.00 1.75402 Varun Shipping Co. Ltd. 130,000 10 0.23 10 0.23 75.00 1.75403 Varun Shipping Co. Ltd. 100,000 8 0.17 10 0.23 75.00 1.75404 Viceroy Hotels Limited 812,500 81 1.89 10 0.23 100.00 2.33405 Visu International Limited 2,500,000 44 1.02 10 0.23 17.50 0.41406 VLS Finance Ltd. 100,000 40 0.93 10 0.23 400.00 9.31407 Walchandnagar Industries Ltd 615,345 78 1.82 2 0.05 126.80 2.95408 Welspun Gujarat Stahl Rohren Limited 8,548,706 684 15.94 5 0.12 80.07 1.86409 Welspun Gujarat Stahl Rohren Limited 6,000,000 613 14.28 5 0.12 102.20 2.38410 West Coast Paper Mills Ltd 2,617,650 223 5.18 2 0.05 85.00 1.98411 Xpro India Limited 425,000 18 0.41 10 0.23 41.50 0.97412 Xpro India Limited 500,000 21 0.48 10 0.23 41.50 0.97413 Yes Bank Limited 14,700,000 3,308 77.01 10 0.23 225.00 5.24414 Zicom Electronic Security Systems Limited 400,000 48 1.13 10 0.23 121.00 2.82415 Zicom Electronic Security Systems Limited 500,000 95 2.21 10 0.23 190.00 4.42
Contd.

www.nseindia.com
Collective Investment Vehicles ISMR55
Collective Investment Vehicles
Introduction
A collective investment vehicle is any entity that allows investors to pool their money and invest the pooled funds, rather than buying securities directly as individuals. The most common types of collective investment vehicles are mutual funds, exchange traded funds, collective investment schemes and venture capital funds. The Collective Investment Scheme is well established in many jurisdictions and now serves as an investment vehicle for a wide range of investment opportunities around the world.
The International Organization of Securities Commission (IOSCO) has, in its Report on Investment Management of the Technical Committee, defi ned the Collective Investment Schemes (CIS), as “an open ended collective investment scheme that issues redeemable units and invests primarily in transferable securities or money market instruments”.
In India, there are three distinct categories of collective investment vehicles in operation namely, Mutual Funds (MFs), Collective Investment Schemes. (CIS) and Venture Capital Funds (VCFs) which mobilize resources from the market for investment purposes. The developments in the year 2007-08 with respect to the above three different CIVs are discussed in this chapter.
Mutual FundsA mutual fund is a company that pools money from many investors and invests the money in stocks, bonds, short-term money-market instruments, other securities or assets, or some combination of these investments. Mutual Funds are essentially investment vehicles where people with similar investment objective come together to pool their money and then invest accordingly. SEBI defi nes mutual funds as ‘A fund established in the form of a trust to raise money through the sale of units to the public or a section of the public under one or more schemes for investing in securities, including money market instruments or gold or gold related instruments or real estate assets. A Mutual Fund will have a fund manager who is responsible for investing the pooled money into specifi c securities (usually stocks and bonds). When you invest in a MF, you are buying shares (or portions) of the MF and become a shareholder of the fund. Mutual Funds (MFs) are considered a good route to invest and earn returns with reasonable safety. Some of the other major benefi ts of investing in them are:
• Number of available options: equity funds, debt funds, gilt funds and many others are available that cater to the different needs of an investor.
• Diversifi cation: Mutual funds diversify the risk of the investor by investing in a basket of various stocks.
• Managed by Skilled Professionals: Investors who lacks time, the inclination or the skills to actively mange their investment risk in individual securities can delegate this role to the mutual funds which are managed by a team of professional fund managers who manages them with in-depth research inputs from investment analysts.
• Liquidity: When in need of liquidity, the money can be withdrawn or redeemed at the Net Asset Value related prices anytime, without much reduction in yield (unlike penalty on premature fi xed deposit withdrawal). Some mutual funds however, charge exit loads for withdrawal within a specifi ed period.

www.nseindia.com
Collective Investment VehiclesISMR 56
• Well Regulated: All investments have to be accounted for & decisions judiciously taken. SEBI acts as a true watchdog through regulations, designed to protect the investors’ interests and impose penalties on the AMCs at fault.
• Transparency: Being under a regulatory framework, mutual funds have to disclose their holdings, investment pattern and all the information relating to the investment strategy, outlooks of the market and scheme related details to all investors frequently to ensure that transparency exists in the system.
• Flexible, Affordable and a Low Cost affair: Mutual Funds provide the benefi t of cheap access to expensive stocks.
• Tax benefi ts : Mutual Funds (MFs) are undoubtedly an important product innovation in the fi nancial fi eld, as an instrument of raising capital from the wider public for corporate enterprise growth. Historically MFs originally called unit trusts in the United Kingdom, were invented for the mass of relatively small investors. Investors are issued ‘units’, thus for an investor, investments in MF imply buying shares (or portions) of the MF and becoming the shareholders of the fund.
TrendsIn India, the Unit Trust of India (UTI), created in 1964 was the fi rst MF. It enjoyed complete monopoly of MF business up to 1986. The entry of non- UTI, public sector mutual funds was set up by public sector banks and Life Insurance Corporation of India (LIC) and General Insurance Corporation of India (GIC) in 1987. SBI Mutual Fund was the fi rst non- UTI Mutual Fund established in June 1987. The MF business was progressively opened to competition post 1988. This move gathered momentum after the adoption of economic liberalization in 1991 and the creation of SEBI in 1992. As of end March 2008, 40 MFs are registered with SEBI with an asset base of Rs.5,051,520 million.(US $ Rs.126,383 million).
In recent years, the MF schemes have diversifi ed considerably thus expanding the basket of investment opportunities to suit the different needs of the investors. There are schemes that invest only in equities, in debt instruments or in both, in real estates, gold units etc. The objectives of the MFs have also widened, with the MFs investing in growth stocks, in stocks of a particular sector, the MFs are managed aggressively as well as passively. Thus, investors have a variety of options such as income funds, balanced funds, liquid funds, gilt funds, index funds, exchange traded funds, sectoral funds to deploy their savings.
Policy DevelopmentsThe policy and regulatory initiatives during the period April 2007 to June 2008 are discussed hereunder.
I. Investment by Mutual Funds in Overseas Securities.With a view to providing greater opportunity to invest overseas, the extant ceiling on overseas investments by Mutual Funds, registered with Securities and Exchange Board of India (SEBI), was further enhanced in April 2008.
The aggregate ceiling for overseas investment by Mutual Funds, registered with SEBI, was increased from US $ 2 billion to US $ 3 billion during November 2006 and further increased to USD 4 billion during May 2007. In consultation with the Government of India and RBI, the aggregate ceiling for overseas investment was increased to USD 7 billion.
II. Standard warning in Advertisements by Mutual Funds
Clause 2 of the SEBI circular SEBI/MFD/CIR No.6/ 12357/03 dated June 26, 2003 issued certain guidelines for Advertisements of Mutual Funds through Audio-Visual media. In continuation to this circular SEBI has issued guidelines to all Mutual funds registered with SEBI and Association of Mutual Funds in India (AMFI) regarding Standard warning in Advertisements by Mutual Funds.
The rapid fi re manner in which the standard warning “Mutual Fund investments are subject to market risks, read the offer document carefully before investing” is being recited in the audio visual and audio media renders it unintelligible to the viewer / listener. In order to improve the manner in which the said message is conveyed to the investors it has been decided in consultation with AMFI that with effect from April 1, 2008

www.nseindia.com
Collective Investment Vehicles ISMR57
i. The time for display and voice over of the standard warning would be enhanced to fi ve seconds in audio visual advertisements.
ii. In case of audio advertisements the standard warning should be read in an easily understandable manner over a period of fi ve seconds.
III. Entry Load for Mutual Funds
Irrespective of the mode of entry, investors purchasing mutual funds were required to pay the entry load. Keeping in view the interest of the investors it has been decided that no entry load would be charged for direct applications received by the Asset Management Company (AMC) i.e. applications received through internet, submitted to AMC or collection centre/ Investor Service Centre that are not routed through any distributor/agent/broker.
The revision would be effected from January 4, 2008 for existing schemes and new schemes launched. It would also be applicable to additional purchases done directly by the investor under the same folio and switch-in to a scheme from other schemes if such a transaction is done directly by the investor. Accordingly the AMCs would have to follow the provisions pertaining to informing the unitholders upon a change in load structure as per clause 3(d) of standard observations.
IV. Removal of Initial issue expenses
Under close-ended schemes initial issue expenses were charged to investors, there was no entry load. In order to bring in more transparency and clarity to the investors in terms of the expenses charged to them in closed-end schemes, the SEBI Board had decided that :
• There will not be any provision of charging initial issue expense and amortization of the same. • All mutual fund schemes would have to meet the sales, marketing and other such expenses connected with sales
and distribution of schemes from the entry load.
This revision would be effected to all mutual funds schemes launched after January 31, 2008.
V. Investments in Art Funds, funds/schemes launched by companies or any entity formed for the purpose
To regulate the securities market and protect the interest of investors SEBI had alerted investors regarding investments in Art Funds, funds/schemes launched by companies or any entity formed for this purpose.
From the analysis of the characteristics of ‘art funds’ these are ‘collective investment schemes’ as defi ned under section 11AA (2) of the SEBI Act, 1992. The schemes/funds have been launched / fl oated by these entities without obtaining a certifi cate of registration in accordance with the SEBI (Collective Investment Schemes) Regulations, 1999 (the Regulations).
In terms of section 12 (1B) of the SEBI Act, 1992 no “person” shall sponsor or cause to be sponsored or cause to be carried on a collective investment scheme unless he obtains a certifi cate of registration from the Board in accordance with the regulations. Regulation 3 of the Regulations permits only a ‘Collective Investment Management Company’ having certifi cate of registration from Board to launch collective investment scheme. Thus, only a company which has been granted certifi cate of registration by the Board in accordance with the Regulations can launch or sponsor a collective investment scheme. In other words, for a collective investment scheme to raise money from the public it is prerequisite that the entity must (a) be a company and (b) registered with SEBI as a Collective Investment Management Company.
Therefore, the launching/ fl oating of the ‘art funds’ or schemes without obtaining a certifi cate of registration from the Board in terms of the provisions of the Regulations amounts to violation of the provisions of section 12 read with section 11 and 11AA of the SEBI Act and the Regulations. For such violations, appropriate actions, civil and criminal, under the SEBI Act may be taken by SEBI against such funds/companies.

www.nseindia.com
Collective Investment VehiclesISMR 58
Market Design
The Mutual Fund (MF) industry is governed by SEBI (MF) Regulations, 1996, which lays the norms for the MF and its AMC. All MFs in India are constituted as trusts and are allowed to issue open-ended and close-ended schemes under a common legal structure. This section throws light on the market design of the MFs in India.
STRUCTURE OF MUTUAL FUNDS : A typical MF in India has the following constituents :
Fund Sponsor A ‘sponsor’ is a person who, acting alone or in combination with another corporate body, establishes a MF. The sponsor should have a sound fi nancial track record of over fi ve years, have a positive net worth in all the immediately preceding fi ve years and integrity in all his business transactions.In case of an existing MF, such fund which is in the form of a trust and the trust deed has been approved by the Board; the sponsor should contribute at least 40% of the net worth of the AMC (provided that any person who holds 40 % or more of the net worth of an asset management company should be deemed to be a sponsor and would be required to fulfi ll the eligibility criteria specifi ed in the SEBI regulations).
Trustees The MF can either be managed by the Board of Trustees, which is a body of individuals, or by a Trust Company, which is a corporate body. Most of the funds in India are managed by a Board of Trustees. The trustees are appointed with the approval of SEBI. Two thirds of trustees are independent persons and are not associated with sponsors or be associated with them in any manner whatsoever. The trustees, being the primary guardians of the unit holders’ funds and assets, have to be persons of high repute and integrity. The Trustees, however, do not directly manage the portfolio of MF. It is managed by the AMC as per the defi ned objectives, in accordance with trust deed and SEBI (MF) Regulations.
Asset Management Company
The AMC, appointed by the sponsor or the Trustees and approved by SEBI, acts like the investment manager of the Trust. The AMC should have at least a net worth of Rs. 10 crore. It functions under the supervision of its Board of Directors, Trustees and the SEBI. In the name of the Trust, AMC fl oats and manages different investment ‘schemes’ as per the SEBI Regulations and the Investment Management agreement signed with the Trustees. The regulations require non-interfering relationship between the fund sponsors, trustees, custodians and AMC.
Custodians. A custodian is appointed for safe keeping the securities or gold or gold related instruments or other assets and participating in the clearing system through approved depository. Custodian also records information on stock splits and other corporate actions. No custodian in which the sponsor or its associate holds 50 % or more of the voting rights of the share capital of the custodian or where 50 % or more of the directors of the custodian represent the interest of the sponsor or its associates should act as custodian for a mutual fund constituted by the same sponsor or any of its associate or subsidiary company.
Registrar and Transfer agent
Registrar and transfer agent maintains record of the unitholders account. A fund may choose to hire an independent party registered with SEBI to provide such services or carryout these activities in-house. If the work relating to the transfer of units is processed in-house, the charges at competitive market rates may be debited to the scheme. The registrar and transfer agent forms the most vital interface between the unitholder and mutual fund. Most of the communication between these two parties takes place through registrar and transfer agent.
Distributors/Agents
To send their products across the length and breadth of the country, mutual funds take the services of distributors/agents. Distributors comprise of banks, non-banking fi nancial companies and other distribution companies.

www.nseindia.com
Collective Investment Vehicles ISMR59
TYPES OF MFs/SCHEMES : A wide variety of MFs/Schemes cater to different preferences of the investors based on their fi nancial position, risk tolerance and return expectations.
Funds by Structure/Tenor
Open ended Scheme
Close ended Scheme
Assured return schemes
Interval Fund
An open-ended fund provides the investors with an easy entry and exit option at NAV, which is declared on a daily basis.
In close-ended funds, the investors have to wait till maturity to redeem their units, however, an entry and exit is provided through mandatory listing of units on a stock exchange. The listing is to be done within six months of the close of the subscription.
Assures a specifi c return to the unit holders irrespective of performance of the scheme, which are fully guaranteed either by the sponsor or AMC.
This kind of fund combines the features of open-ended and closed-ended schemes, making the fund open for sale or redemption during pre-determined intervals.
Funds by Investment objective/Asset class
1. Securities
Equity/Growth schemes
Debt or income schemes,
Balanced schemes,
Money market schemes
2. Physical Assets
3. Sector Funds
4. Index Funds and Exchange Traded Funds
5. Funds of Funds
Growth/Equity Oriented Schemes provide capital appreciation over medium to long-term by investing a major part of their corpus in equities.
Income/Debt Oriented Schemes provide regular and steady income to investors by investing in fi xed income securities such as bonds, corporate debentures, government securities and money market instruments. Hence, they are less risky compared to equity schemes.
Balanced Funds provide both growth and regular income as they invest both in equities and fi xed income securities in the specifi ed proportion as indicated in their offer documents.
Money Market or Liquid Funds provide easy liquidity and preserves capital, but generates moderate income. As they invest exclusively in safer short-term instruments such as, treasury bills, certifi cates of deposit, commercial paper, inter-bank call money, and government securities.
Historically, the regulatory framework in India did not permit mutual funds to invest in physical assets. A signifi cant change was made in January 2006, when SEBI permitted Gold exchange Traded Fund schemes (ETFs) that would invest in “gold and gold related instruments”. Mutual Funds have also been permitted to invest in Real Estate since May 2008
Sector funds invest in shares only of a specifi c sector such as Pharmaceuticals, software, energy and Banking etc.
Index Funds replicate the portfolio of any particular index such as the Nifty 50 by investing in the same securities with the same weightage as in the index. The exchange traded index funds, as the name suggests, are traded on the stock exchanges. A single NAV is applicable for the day in the case of open-ended funds. Therefore a single price would be applicable for all investors who buy units of an open ended index fund on any particular day. Similarly, a single price would be received by all investors who exit form an open-end index fund on a particular day.
Exchange Traded Funds are an innovation to traditional mutual funds as ETFs provide investors a fund that closely tracks the performance of an index with the ability to buy/sell on an intra-day basis. The unit price keeps changing during the day.
Funds of Funds is a scheme wherein the assets are invested in the existing schemes of mutual funds, for the earlier years the data was included in the other schemes.

www.nseindia.com
Collective Investment VehiclesISMR 60
Regulation of Funds
The MFs are regulated under the SEBI (MF) Regulations, 1996. All the MFs have to be registered with SEBI. The regulations have laid down a detailed procedure for launching of schemes, disclosures in the offer document, advertisements, listing and repurchase of close-ended schemes, offer period, transfer of units, investments, among others. In addition, RBI also supervises the operations of bank-owned MFs. While SEBI regulates all market related and investor related activities of the bank/FI-owned funds, any issues concerning the ownership of the AMCs by banks falls under the regulatory ambit of the RBI.Further, as the MFs, AMCs and corporate trustees are registered as companies under the Companies Act 1956, they have to comply with the provisions of the Companies Act. Many close-ended schemes of the MFs are listed on one or more stock exchanges. Such schemes are, therefore, subject to the regulations of the concerned stock exchange(s) through the listing agreement between the fund and the stock exchange.MFs, being Public Trusts are governed by the Indian Trust Act, 1882, are accountable to the offi ce of the Public Trustee, which in turn reports to the Charity Commissioner, that enforces provisions of the Indian Trusts Act.
Constitution of a Mutual Fund , Asset Management Company
A mutual fund is constituted in the form of a trust and the instrument of trust should be in the form of a deed, duly registered under the provisions of the Indian Registration Act, 908 (16 of 1908), executed by the sponsor in favour of the trustees named in such an instrument. A trust is appointed with the approval of the Board. The sponsor or, if so authorised by the trust deed, the trustee, would appoint an asset management company, which has been approved by the Board. The trustees and the asset management company should with prior approval SEBI enter into an investment management agreement which should contain clauses necessary for the purpose of making investments. (Clauses are in the forth schedule chapter III SEBI Mutual Fund Regulation 1996).
Code Of Conduct
• Mutual fund schemes should not be organised, operated, managed or the portfolio of securities selected, in the interest of sponsors, directors of asset management companies, members of Board of trustees or directors of trustee company, associated persons as in the interest of special class of unit holders rather than in the interest of all classes of unit holders of the scheme.
• Trustees and asset management companies must ensure the dissemination to all unit holders of adequate, accurate, explicit and timely information fairly presented in a simple language about the investment policies, investment objectives, fi nancial position and general affairs of the scheme.
• Trustees and asset management companies should avoid excessive concentration of business with broking fi rms, affi liates and also excessive holding of units in a scheme among a few investors.
• Trustees and asset management companies must avoid confl icts of interest in managing the affairs of the schemes and keep the interest of all unit holders paramount in all matters.
• Trustees and asset management companies must ensure scheme wise segregation of bank accounts and securities accounts.
• Trustees and asset management companies should carry out the business and invest in accordance with the investment objectives stated in the offer documents and take investment decision solely in the interest of unit holders.
• Trustees and asset management companies must not use any unethical means to sell; market or induce any investor to buy their schemes.
• Trustees and the asset management company should maintain high standards of integrity and fairness in all their dealings and in the conduct of their business.
• Trustees and the asset management company should render at all times high standards of service, exercise due diligence, ensure proper care and exercise independent professional judgment.
• The asset management company should not make any exaggerated statement, whether oral or written, either about their qualifi cations or capability to render investment management services or their achievements.
• The sponsor of the mutual fund, the trustees or the asset management company or any of their employees should not render any, directly or indirectly any investment advice about any security in the publicly accessible media, whether real-time or non-real-time, unless a disclosure of his interest including long or short position in the said security has been made, while rendering such advice.
www.nseindia.com
Collective Investment Vehicles ISMR61
SCHEMES OF MUTUAL FUNDS
All schemes of a Mutual Fund is launched by the AMC once it is approved by the trustees and a copy of the offer document has been fi led with SEBI. The mutual fund should pay the minimum specifi ed fee to the board while fi ling the offer document, the balance should be paid within such time as specifi ed by SEBI. The offer document should contain disclosures which are adequate in order to enable investors to make informed investment decision. Advertisement in respect of every scheme should be in conformity with the Advertisement Code. The offer document and advertisement materials should not be misleading or contain any statement or opinion which are incorrect or false.
Listing of Close ended schemes : Every close ended scheme should be listed on a recognized stock exchange within six months form the closure of the subscription. Listing of close ended schemes is not mandatory if the said scheme provides for periodic repurchase facility to all the unit holders with restriction, if any, on the extent of such repurchase; or if the said scheme provides for monthly income or caters to special classed of persons like senor citizens, women, children, widows or physically handicapped or any special class of persons providing for repurchase of units at regular intervals; or if the details of such repurchase facility are clearly disclosed in the offer document; or if the said scheme opens for repurchase within a period of six months from the closure of subscription or if the said scheme is a capital protection oriented scheme.
Repurchase of Close ended Schemes
The asset management company may at its option repurchase or reissue the repurchased units of a close ended scheme. The units of a close ended scheme may be open for sale or redemption at fi xed predetermined intervals if the maximum and minimum amount of sale or redemption of the units and the periodicity of such sale or redemption have been disclosed in the offer document. The units of close ended scheme can be converted into open-ended scheme if the offer document of such scheme discloses the option and the period of such conversion; or the unitholders are provided with an option to redeem their units in full and the initial issue expenses of the scheme have been amortised fully in accordance with the tenth schedule.
A close ended scheme should be fully redeemed at the end of the maturity period provided that a close-ended scheme may be allowed to be rolled over if the purpose, including the likely composition of assets immediately before the roll over, the net assets and net asset value of the scheme are disclosed to the unitholders and a copy of the same has been fi led with SEBI. Further, such roll over would be permitted only in the case of those unit holders who express their consent in writing and the unit holders who do not opt for the roll over or have not given written consent will be allowed to redeem their holdings in full at net asset value based price.
Registration of Mutual Funds
In order to register with SEBI as a MF, the sponsor has the make and application to SEBI in Form A. The sponsor should fulfi ll the eligibility criteria as mentioned above. The Board may on receipt of all information decide the application and may register the mutual fund and grant a certifi cate in Form B on the applicant paying the registration fee. The registration granted to a mutual fund shall be subject to:
• The trustees, the sponsor, the asset management company and the custodian complying with the provisions of the regulations.
• The mutual fund would forwith inform the Board, if any information or particulars previously submitted to the Board was misleading or false or in any material change previously furnished which has a bearing on the registration granted by it and Payment of fees.
Advertisements Code by MFs
As per the MF regulations, advertisements should be truthful, fair and clear, and not contain any statement/promise/forecast, which is untrue or misleading. The sales literature should also contain information, which is included in the current advertisement. Assuming that the investors are not trained in legal or fi nancial matters, it should be ensured that the advertisement is set forth in a clear, concise and understandable manner. Excessive use of technical/legal jargons or complex language, inclusion or exclusion of excessive details, which is likely to detract the investors, should be avoided. Also, standardized computations such as annual dividend on face value, annual yield on the purchase price and annual compounded rate of return should be used.
www.nseindia.com
Collective Investment VehiclesISMR 62
Investment Borrowing And Restrictions
• A mutual fund scheme should not invest more than 15% of its NAV in debt instruments issued by a single issuer which are rated not below investment grade by a credit rating agency authorised to carry out such activity under the Act. Such investment limit may be extended to 20% of the NAV of the scheme with the prior approval of the Board of Trustees and the Board of asset management company provided that such limit should not be applicable for investments in Government securities and money market instruments. Further, that investment within such limit can be made in mortgaged backed securitised debt which are rated not below investment grade by a credit rating agency registered with SEBI.
• A mutual fund scheme should not invest more than 10% of its NAV in unrated debt instruments issued by a single issuer and the total investment in such instruments should not exceed 25% of the NAV of the scheme. All such investments should be made with the prior approval of the Board of Trustees and the Board of asset management company.
• No mutual fund under all its schemes should own more than ten per cent of any company’s paid up capital carrying voting rights.
• Transfers of investments from one scheme to another scheme in the same mutual fund should be allowed only if,
such transfers are done at the prevailing market price for quoted instruments on spot basis. ‘Spot basis’ has the same meaning as specifi ed by stock exchange for spot transactions.
the securities so transferred should be in conformity with the investment objective of the scheme to which such transfer has been made.
• A scheme may invest in another scheme under the same asset management company or any other mutual fund without charging any fees, provided that aggregate inter scheme investment made by all schemes under the same management or in schemes under the management of any other asset management company should not exceed 5% of the net asset value of the mutual fund. However, this is not applicable to any fund of funds scheme.
• The initial issue expenses in respect of any scheme can not exceed six per cent of the funds raised under that scheme.
• Every mutual fund should buy and sell securities on the basis of deliveries and should in all cases of purchases, take delivery of relative securities and in all cases of sale, deliver the securities. Provided that a mutual fund may engage in short selling of securities in accordance with the framework relating to short selling and securities lending an borrowing specifi ed by the Board. Provided that a mutual fund may enter into derivatives transactions in a recognised stock exchange, subject to the framework specifi ed by the Board. Provided further that sale of government security already contracted for purchase shall be permitted in accordance with the guidelines issued by the Reserve Bank of India in this regard.
• Every mutual fund should get the securities purchased or transferred in the name of the mutual fund on account of the concerned scheme, wherever investments are intended to be of long-term nature.
• Pending deployment of funds of a scheme in securities in terms of investment objectives of the scheme a mutual fund can invest the funds of the scheme in short term deposits of scheduled commercial banks.
• No mutual fund [scheme] should make any investment in- any unlisted security of an associate or group company of the sponsor; or any security issued by way of private placement by an associate or group company of the sponsor; or the listed securities of group companies of the sponsor which is in excess of 25 per cent of the net assets.• No scheme of a mutual fund should make any investment in any fund of funds scheme.• No mutual fund scheme should invest more than 10 per cent of its NAV in the equity shares or equity related
instruments of any company . Provided that, the limit of 10 per cent should not be applicable for investments in case of index fund or sector or industry specifi c scheme.
• A mutual fund scheme should not invest more than 5% of its NAV in the unlisted equity shares or equity related instruments in case of open ended scheme and 10% of its NAV in case of close ended scheme.
• A fund of funds scheme will be subject to the following investment restrictions: A fund of funds scheme should not invest in any other fund of funds scheme; A fund of funds scheme should not invest its assets other than in schemes of mutual funds, except to the extent of
funds required for meeting the liquidity requirements for the purpose of repurchases or redemptions, as disclosed in the offer document of fund of funds scheme.

www.nseindia.com
Collective Investment Vehicles ISMR63
Market Outcome
Resource Mobilisation
The MF vehicle is quite popular with investors who are wary of directly investing in the securities market. The popularity of the MFs as an investment avenue is clearly visible from the data presented in (Table 3-1). The schemes of MFs of the commercial banks and the insurance companies, which entered the market in 1987, were well received. The boom continued into the 90’s with liberalisation evoking positive response from the investors. The resource mobilisations by MFs remained steady during the period 1992-95 with annual gross mobilisation averaging Rs. 110,000 million per annum during the period. The MFs were however, hit severely by the bearish sentiments in the secondary market since October 1994. The years 1995-96 and 1996-97 witnessed net outfl ows of funds from MFs. The MF industry managed to mobilise modest sums during the next two fi nancial years. It was during 1999-2000, that the MF industry witnessed a sharp turnaround with record resource mobilisation amounting to Rs. 199,530 million (US $ 4,574 million). Tax sops announced in the Union Budget 1999-00 and emergence of bullish trends in the secondary market fuelled the recovery. The year 2000-01 witnessed a slowdown once again with net resource mobilisation by all MFs taken together aggregating Rs. 111,350 million (US $ 2,387 million), which could be attributed to a slump in secondary market and increase in tax on income distributed by debt-oriented MFs. In 2002-03, the resource mobilization by all MFs together aggregated to a further low of Rs. 45,830 million (US $ 965 million) with UTI having a net outfl ow of Rs. 94,340 million (US $ 1,986 million).
Table 3-1: Resource Mobilisation by Mutual Funds (Rs. mn.) (US $ mn.)
YearPublic Sector MFs Private Sector
MFs Grand TotalBank sponsored FI sponsored UTI
1990-91 23,520 6,040 45,530 - 75,090 4,186
1991-92 21,400 4,270 86,850 - 112,520 4,598
1992-93 12,040 7,600 110,570 - 130,210 4,496
1993-94 1,480 2,390 92,970 15,600 112,440 3,584
1994-95 7,650 5,760 86,110 13,220 112,740 3,587
1995-96 1,130 2,350 -63,140 1,330 -58,330 -1,698
1996-97 60 1,370 -30,430 8,640 -20,360 -567
1997-98 2,370 2,030 28,750 7,490 40,640 1,028
1998-99 2,310 6,910 1700 25,190 36,110 851
1999-00 1,560 3,570 45,480 148,920 199,530 4,574
2000-01 --------------- 15,200 ----------- 3,220 92,920 111,350 2,387
2001-02 --------------- 14,740 ----------- -72,840 129,470 71,370 1,463
2002-03 --------------- 18,950 ----------- -94,340 121,220 45,830 965
2003-04 * --------------- 37,610 ----------- 10,500* 428,730 476,840 10,990
2004-05 --------------- 16,670 ------------ 25,970 425,450 468,090 10,699
2005-06 ---------------------- 98,020 ----------------------- 429,770 527,790 11,815
2006-07 ---------------------- 149,470 ----------------------- 790,380 939,850 21,561
2007-08P ---------------------- 204,980 ----------------------- 1,333,040 1,538,020 38,479
2008-09 (April 08-June 08)
---------------------- 141,730 ---------------------- 242,640 384,370 8,949
* Data for 2003-04 relate to UTI Mutual Fund for the period February 01, 2003 to March 31, 2004.P: ProvisionalSource: RBI.

www.nseindia.com
Collective Investment VehiclesISMR 64
The fi scal years 2003-04 and 2004-05 witnessed a sharp rise in the net resources mobilized compared to its previous years aggregating Rs. 476,840 million (US $ 10,990 million) and Rs. 468,090 million (US $ 10,699 million) respectively. This trend continued during the next fi scal 2006-07 which witnessed and additional 78 % of resources being mobilized. The fi nancial year 2007-08 too witnessed an additional Rs. 598,170 million (US $ 16,918 million) resources being mobilized an increase of 64 % from the fi scal 2006-07 taking the total resources to Rs.1,538,020 million (US $ 38,479 million). The private sector contributed 87% of the total resources mobilized. Increasing resource mobilization is indicative of the growing confi dence of investors in Mutual Funds as an investment avenue.
The fi scal 2007-08 saw huge investments in MFs. Saving of the house hold sector in MFs was 8.5 % in comparison with 5.20 % in 2006-07. At the end of March 2008 the number registered MFs with the SEBI stood at 40 and at the end of June 2008 the number increased to 41. As against 414 schemes in the year 2006-07, 612 new schemes were launched in 2007-08, of which 142 were open-ended and 470 close-ended schemes. This took the total number of schemes as at end-March 2008 to 956 against 756 as at end March 2007. Aggregate sales of all the 956 schemes amounted to Rs. 44,643,760 million (US $ 1,116,932 million). The redemptions during the year were at Rs. 43,105,750 million (US $ 1,078,453 million)
The bank sponsored MFs made gross mobilization of Rs. 4,895,940 million (US $ 122,490 million) accounting for 10.97 % of the total resource mobilization during 2007-08. In net terms, the bank sponsored MFs witnessed an infl ow of Rs.183,200 million (US $ 4,583 million). The private sector MFs accounted for the bulk of mobilization by raising almost 84.68 % of gross resources mobilized by MF industry during 2007-08. These private sector MFs witnessed a net infl ow of Rs. 1,333,020 million (US $ 33,351 million) in the same period as compared to Rs. 791,340 million ( US $ 18,154 million) in 2006-07. The details of sales and redemptions of the different categories of Mutual funds for the fi scal 2007-08 and the fi rst quarter of the fi scal 2008-09 are presented in (Table 3-2).
During 2007-08 the share of total sales in the open-ended schemes of Mutual funds was 97.15 % as compared with its share of 92.86 % in 2006-07. The close ended schemes in total funds raised , accounted for a share of 2.85 % during the current fi scal. During the fi scals 2005-06 and 2006-07 the close ended schemes have witnessed a growth of 131.77 % and 237.14 % respectively in raising funds. However in 2007-08 the sales in the close ended schemes have come down by 7.95 % as compared to the sales in the previous year. The open ended schemes registered a growth of 140.91% during 2007-08 in raising funds.
The open ended and close ended schemes together registered a net infl ow of Rs.940,800 million (US $ 21,583 million) and Rs.1,538,010 million (US $ 38,479) million in 2006-07 and 2007-08 respectively. The details of the sales and redemptions of the Mutual funds based on the tenor for the last two fi scals and the fi rst quarter of the fi scal 2008-09 are presented in (Table:3-3 A).
With the decline in interest rates during past few years, the liquid/money market schemes have become very popular among investors due to the attractive returns delivered by them. They account for almost three-fourths of the total gross resources mobilized. During the current fi scal the sale as well as repurchase has been the highest in case of these schemes resulting in a net infl ow of Rs149,770 million (US $ 3,747 million). Almost 76.89 % of the funds have been raised through these schemes.
The Income/Debt Oriented Schemes which provide regular and steady income to investors by investing in fi xed income securities such as bonds, corporate debentures, government securities and money market instruments are also popular among investors and account for 19.74 % of the total sales of all the schemes. This scheme has resulted in the highest net infl ow of Rs.884,560 million (US $ 22,131 million) which accounts for 57.51 % of the net resources mobilized. The Growth scheme was the second highest and accounted for 26.52 % of the net resources raised followed by Liquid/Money Market - 9.74 %, ELSS - 4 % and balanced - 3.75 %. The other ETF scheme was the only category which witnessed an outfl ow of Rs.30,440 million (US $ 762 million). The Scheme-wise Resource Mobilisation by Mutual Funds for the last two fi scals and the fi rst quarter of the fi scal 2008-09 are presented in (Table:3-3 B).
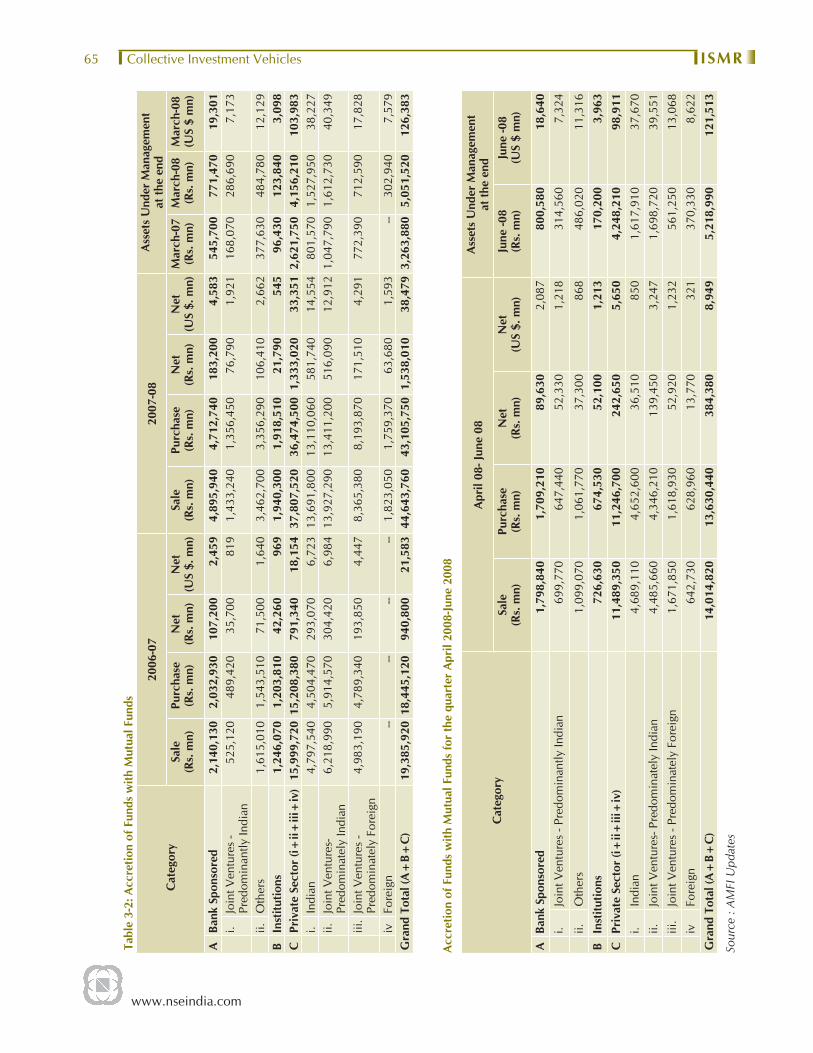
www.nseindia.com
Collective Investment Vehicles ISMR65
Tabl
e 3-
2: A
ccre
tion
of F
unds
with
Mut
ual F
unds
Cat
egor
y20
06-0
720
07-0
8A
sset
s U
nder
Man
agem
ent
at th
e en
dSa
le(R
s. m
n)Pu
rcha
se
(Rs.
mn)
Net
(Rs.
mn)
Net
(US
$. m
n)Sa
le(R
s. m
n)Pu
rcha
se
(Rs.
mn)
Net
(Rs.
mn)
Net
(US
$. m
n)M
arch
-07
(Rs.
mn)
Mar
ch-0
8(R
s. m
n)M
arch
-08
(US
$ m
n)
ABa
nk S
pons
ored
2,1
40,1
30
2,0
32,9
30
107
,200
2
,459
4
,895
,940
4
,712
,740
1
83,2
00
4,5
83
545
,700
7
71,4
70
19,
301
i.Jo
int V
entu
res
- Pr
edom
inan
tly In
dian
525
,120
4
89,4
20
35,
700
819
1
,433
,240
1
,356
,450
7
6,79
0 1
,921
1
68,0
70
286
,690
7
,173
ii.O
ther
s 1
,615
,010
1
,543
,510
7
1,50
0 1
,640
3
,462
,700
3
,356
,290
1
06,4
10
2,6
62
377
,630
4
84,7
80
12,
129
BIn
stitu
tions
1,2
46,0
70
1,2
03,8
10
42,
260
969
1
,940
,300
1
,918
,510
2
1,79
0 5
45
96,
430
123
,840
3
,098
C
Priv
ate
Sect
or (i
+ii+
iii+
iv)
15,9
99,7
20 1
5,20
8,38
0 7
91,3
40
18,
154
37,
807,
520
36,
474,
500
1,33
3,02
0 3
3,35
1 2,
621,
750
4,1
56,2
10
103
,983
i.
Indi
an 4
,797
,540
4
,504
,470
2
93,0
70
6,7
23
13,6
91,8
00
13,
110,
060
581
,740
1
4,55
4 8
01,5
70
1,52
7,95
0 3
8,22
7 ii.
Join
t Ven
ture
s-
Pred
omin
atel
y In
dian
6,2
18,9
90
5,9
14,5
70
304
,420
6
,984
13
,927
,290
1
3,41
1,20
0 5
16,0
90
12,
912
1,04
7,79
0 1
,612
,730
4
0,34
9
iii.
Join
t Ven
ture
s -
Pred
omin
atel
y Fo
reig
n 4
,983
,190
4
,789
,340
1
93,8
50
4,4
47
8,3
65,3
80
8,1
93,8
70
171
,510
4
,291
7
72,3
90
712
,590
1
7,82
8
ivFo
reig
n--
----
-- 1
,823
,050
1
,759
,370
6
3,68
0 1
,593
--
302,
940
7,5
79
Gra
nd T
otal
(A+
B+C
)19
,385
,920
18,4
45,1
2094
0,80
021
,583
44,6
43,7
6043
,105
,750
1,53
8,01
0 3
8,47
9 3,
263,
880
5,05
1,52
0 1
26,3
83
Acc
retio
n of
Fun
ds w
ith M
utua
l Fun
ds fo
r th
e qu
arte
r A
pril
2008
-June
200
8
Cat
egor
yA
pril
08- J
une
08A
sset
s U
nder
Man
agem
ent
at th
e en
dSa
le(R
s. m
n)Pu
rcha
se
(Rs.
mn)
Net
(Rs.
mn)
Net
(US
$. m
n)Ju
ne -0
8(R
s. m
n)Ju
ne -0
8(U
S $
mn)
ABa
nk S
pons
ored
1,7
98,8
40
1,7
09,2
10
89,
630
2,08
7 8
00,5
80
18,6
40i.
Join
t Ven
ture
s - P
redo
min
antly
Indi
an 6
99,7
70
647
,440
5
2,33
0 1,
218
314
,560
7,
324
ii.O
ther
s 1
,099
,070
1
,061
,770
3
7,30
0 86
8 4
86,0
20
11,3
16
BIn
stitu
tions
726
,630
6
74,5
30
52,
100
1,21
3 1
70,2
00
3,96
3C
Priv
ate
Sect
or (i
+ii+
iii+
iv)
11,4
89,3
5011
,246
,700
242
,650
5,
650
4,2
48,2
10
98,9
11i.
Indi
an 4
,689
,110
4
,652
,600
3
6,51
0 85
0 1
,617
,910
37
,670
ii.Jo
int V
entu
res-
Pre
dom
inat
ely
Indi
an 4
,485
,660
4
,346
,210
1
39,4
50
3,24
7 1
,698
,720
39
,551
iii.
Join
t Ven
ture
s - P
redo
min
atel
y Fo
reig
n 1
,671
,850
1
,618
,930
5
2,92
0 1,
232
561
,250
13
,068
ivFo
reig
n64
2,73
0 6
28,9
60
13,
770
321
370
,330
8,
622
Gra
nd T
otal
(A+
B+C
)14
,014
,820
13,6
30,4
40 3
84,3
80
8,94
9 5
,218
,990
12
1,51
3
Sour
ce :
AM
FI U
pdat
es

www.nseindia.com
Collective Investment VehiclesISMR 66Ta
ble
3-3A
: Re
sour
ce M
obili
satio
n by
Mut
ual F
unds
- bas
ed o
n th
e Te
nor
of th
e Sc
hem
e
Sche
me
2006
-07
200
7-08
2
008-
09 (A
pril
08- J
une
08)
Sale
Purc
hase
Sale
Purc
hase
Sale
Purc
hase
Sale
Purc
hase
Sale
Purc
hase
Sale
Purc
hase
(Rs.
mn.
)(U
S $
mn.
)(R
s. m
n.)
(US
$ m
n.)
(Rs.
mn.
)(U
S $
mn.
)O
pen-
ende
d18
,002
,570
17,7
62,6
2041
2,99
840
7,49
343
,370
,420
42,0
35,8
801,
085,
074
1,05
1,68
613
,514
,940
12,9
64,4
6031
4,66
730
1,85
0C
lose
-end
ed1,
383,
350
682,
500
31,7
3515
,657
1,27
3,34
01,
069,
870
31,8
5726
,767
310,
350
512,
220
7,22
611
,926
Ass
ured
Ret
urn
----
----
----
----
----
----
Inte
rval
fund
*--
----
----
----
--
18
9,53
0
15
3,76
0
4,
413
3,5
80
Tota
l19
,385
,920
18,4
45,1
2044
4,73
342
3,15
044
,643
,760
43,1
05,7
501,
116,
932
1,07
8,45
314
,014
,820
13,6
30,4
4032
6,30
531
7,35
6
* Th
is c
ateg
ory
was
intro
duce
d si
nce
Apr
il 20
08, s
ome
of th
e ex
istin
g s
chem
es w
ere
recl
assi
fi ied
Sour
ce :
AM
FI U
pdat
es
Tabl
e 3-
3B: S
chem
e-w
ise
Reso
urce
Mob
ilisa
tion
by M
utua
l Fun
ds
Sche
me
2006
-07
2007
-08
2008
-09
(A
pril
2008
-June
200
8)Sa
lePu
rcha
seN
et
Infl o
w/
(Out
fl ow
)
Net
In
fl ow
/(O
utfl o
w)
Sale
Purc
hase
Net
In
fl ow
/(O
utfl o
w)
Net
In
fl ow
/(O
utfl o
w)
Sale
Purc
hase
Net
In
fl ow
/(O
utfl o
w)
Net
In
fl ow
/(O
utfl o
w)
(Rs.
mn.
)(U
S $
mn.
)(R
s. m
n.)
(US
$ m
n.)
(Rs.
mn.
)(U
S $
mn.
)
Inco
me
2,11
0,26
01,
509,
800
600,
460
13,
775
8,8
13,4
50
7,9
28,8
90
884
,560
2
2,13
1 3
,339
,810
2
,999
,490
3
40,3
20
7,92
4G
row
th89
6,82
065
9,30
023
7,52
0 5
,449
1
,198
,380
7
90,5
60
407
,820
1
0,20
3 1
24,6
30
102
,580
2
2,05
0 51
3Ba
lanc
ed44
,730
27,6
2017
,110
393
1
14,8
80
57,
200
57,
680
1,4
43
11,
380
9,3
20
2,0
60
48Li
quid
/ Mon
ey M
arke
t16
,267
,900
16,2
18,0
5049
,850
1,1
44 3
4,32
7,38
0 34
,177
,610
1
49,7
70
3,7
47 1
0,50
2,81
0 10
,490
,090
1
2,72
0 29
6G
ilt18
,530
28,1
60(9
,630
) (2
21)
31,
800
27,
460
4,3
40
109
3
,320
1
0,27
0 (6
,950
)(1
62)
ELSS
46,6
902,
160
44,5
30 1
,022
6
4,48
0 2
,970
6
1,51
0 1
,539
9
,220
7
40
8,4
80
197
GO
LD E
TFs
990
3096
0 2
2 4
,330
1
,560
2
,770
6
9 1
,050
6
0 9
90
23O
ther
ETF
s *
----
----
89,0
60 1
19,5
00
(30,
440)
(762
) 1
3,91
0 1
6,13
0 (2
,220
)(5
2)Fu
nds
of F
unds
Inve
stin
g O
vers
eas
**--
----
----
----
-- 8
,690
1
,760
6
,930
16
1
Tota
l19
,385
,920
18,4
45,1
2094
0,80
0 2
1,58
3 44
,643
,760
43,1
05,7
501,
538,
010
38,
479
14,0
14,8
20 1
3,63
0,44
0 3
84,3
80
8,94
9*T
his
sche
me
was
ear
lier c
lass
ifi ed
as
Gro
wth
Fun
ds a
nd in
clud
ed in
that
cat
egor
y**
Fun
ds o
f Fun
ds is
a s
chem
e w
here
in th
e as
sets
are
inve
sted
in th
e ex
istin
g sc
hem
es o
f mut
ual f
unds
, for
the
earli
er y
ears
the
data
was
incl
uded
in th
e ot
her s
chem
es.
Sinc
e th
e qu
arte
r dat
a on
Fun
ds o
f Fun
ds in
vest
ing
over
seas
is s
how
n se
para
tely
and
dat
a on
Fun
ds o
f Fun
ds d
omes
tic is
incl
uded
in th
e ot
her s
chem
es.
Sour
ce: A
MFI
Upd
ates

www.nseindia.com
Collective Investment Vehicles ISMR67
Assets under Management
As on March 31, 2008, the MFs have managed assets of Rs. 5,051,520 million (US $ 126,383 million). As shown in Table 3-2, the share of private sector MFs in total assets rose to 82.28 % at end March 2008 from 80.33 % in March 2007. During the year, the assets under management of the private sector MFs increased by Rs. 1,534,460 million (US $ 38,390 million) amounting to an aggregate of Rs. 4,156,210 million (US $ 103,983 million).
The open ended schemes and the close ended schemes as at end-March 2008 accounted for 73.09 % and 26.91 % of total assets under management of MFs, respectively (Table 3-4) and (Chart 3-1)
Chart 3-1: Assets under Management at the end of March 2008
The income schemes accounted for 43.70 % of total assets under management as at end-March 2008, followed by growth schemes with 31.02 %. The liquid/money market schemes accounted for 17.70 %. of assets under management of MFs as at end-March 2008.
As on October 2008 there were 9 Mutual funds listed on NSE. The Total traded value these Mutual funds during the fi scal 2007-08 was Rs. 2,888 million (US $ 72 million). During the fi rst quarter of the fi scal 2008-09 the traded value of the Mutual funds amounted to Rs.624 million (US $ 15 million).
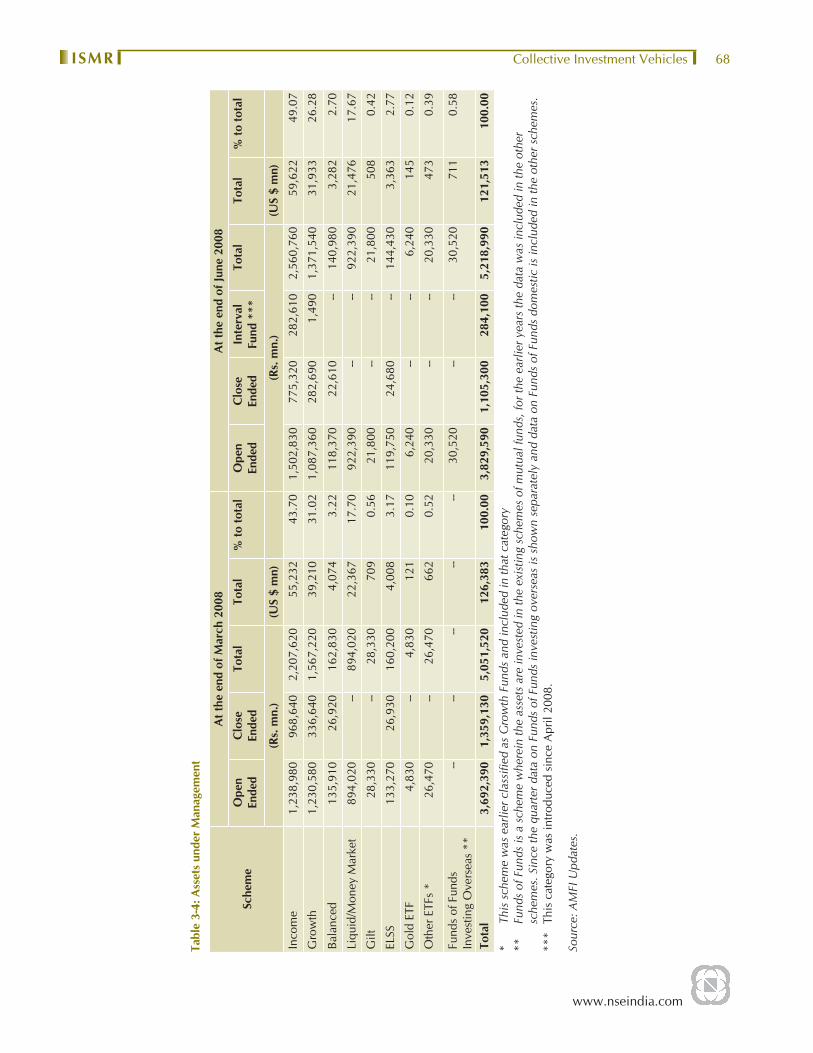
www.nseindia.com
Collective Investment VehiclesISMR 68
Tabl
e 3-
4: A
sset
s un
der
Man
agem
ent
Sche
me
At t
he e
nd o
f Mar
ch 2
008
At t
he e
nd o
f Jun
e 20
08
Ope
n En
ded
Clo
se
Ende
d To
tal
Tota
l%
to to
tal
Ope
n En
ded
Clo
se
Ende
d In
terv
al
Fund
***
Tota
l To
tal
% to
tota
l
(Rs.
mn.
)(U
S $
mn)
(Rs.
mn.
)(U
S $
mn)
Inco
me
1,23
8,98
0 9
68,6
40
2,20
7,62
055
,232
43.7
0 1
,502
,830
7
75,3
20
282
,610
2
,560
,760
5
9,62
2 49
.07
Gro
wth
1,23
0,58
0 3
36,6
40
1,56
7,22
039
,210
31.0
2 1
,087
,360
2
82,6
90
1,4
90
1,3
71,5
40
31,
933
26.2
8
Bala
nced
135,
910
26,
920
162,
830
4,07
43.
22 1
18,3
70
22,
610
--
140
,980
3
,282
2.
70
Liqu
id/M
oney
Mar
ket
894
,020
--
89
4,02
022
,367
17.7
0 9
22,3
90
--
--
922
,390
2
1,47
6 17
.67
Gilt
28,3
30 --
28
,330
709
0.56
21,
800
--
--
21,
800
508
0.
42
ELSS
133
,270
2
6,93
0 16
0,20
04,
008
3.17
119
,750
2
4,68
0 --
1
44,4
30
3,3
63
2.77
Gol
d ET
F 4
,830
--
4,
830
121
0.10
6,2
40
--
--
6,2
40
145
0.
12
Oth
er E
TFs
* 2
6,47
0 --
26
,470
662
0.52
20,
330
--
--
20,
330
473
0.
39
Fund
s of
Fun
dsIn
vest
ing
Ove
rsea
s **
-- --
--
--
--
3
0,52
0 --
--
3
0,52
0 7
11
0.58
Tota
l3,
692,
390
1,35
9,13
05,
051,
520
126,
383
100.
00 3
,829
,590
1
,105
,300
2
84,1
00
5,2
18,9
90
121
,513
10
0.00
* Th
is s
chem
e w
as e
arlie
r cla
ssifi
ed a
s G
row
th F
unds
and
incl
uded
in th
at c
ateg
ory
**
Fund
s of
Fun
ds is
a s
chem
e w
here
in th
e as
sets
are
inve
sted
in th
e ex
istin
g sc
hem
es o
f mut
ual f
unds
, for
the
earli
er y
ears
the
data
was
incl
uded
in th
e ot
her
sche
mes
. Sin
ce th
e qu
arte
r dat
a on
Fun
ds o
f Fun
ds in
vest
ing
over
seas
is s
how
n se
para
tely
and
dat
a on
Fun
ds o
f Fun
ds d
omes
tic is
incl
uded
in th
e ot
her s
chem
es.
***
This
cat
egor
y w
as in
trodu
ced
sinc
e A
pril
2008
.
Sour
ce: A
MFI
Upd
ates
.
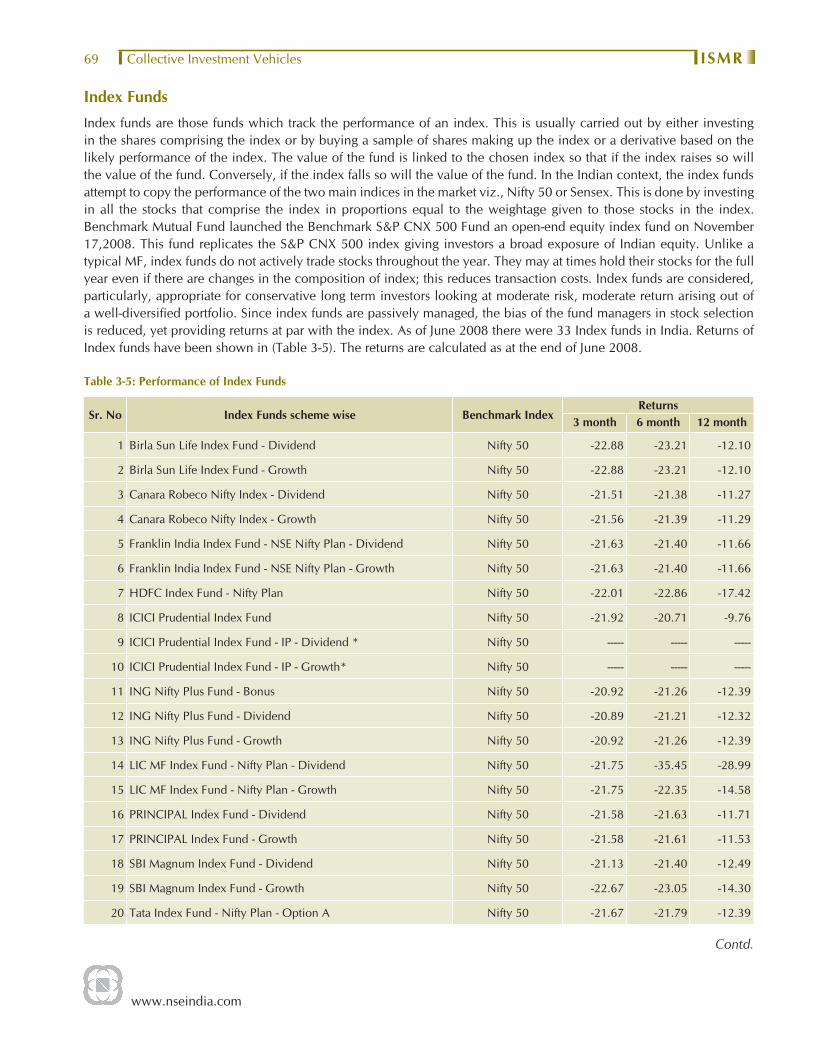
www.nseindia.com
Collective Investment Vehicles ISMR69
Index Funds
Index funds are those funds which track the performance of an index. This is usually carried out by either investing in the shares comprising the index or by buying a sample of shares making up the index or a derivative based on the likely performance of the index. The value of the fund is linked to the chosen index so that if the index raises so will the value of the fund. Conversely, if the index falls so will the value of the fund. In the Indian context, the index funds attempt to copy the performance of the two main indices in the market viz., Nifty 50 or Sensex. This is done by investing in all the stocks that comprise the index in proportions equal to the weightage given to those stocks in the index. Benchmark Mutual Fund launched the Benchmark S&P CNX 500 Fund an open-end equity index fund on November 17,2008. This fund replicates the S&P CNX 500 index giving investors a broad exposure of Indian equity. Unlike a typical MF, index funds do not actively trade stocks throughout the year. They may at times hold their stocks for the full year even if there are changes in the composition of index; this reduces transaction costs. Index funds are considered, particularly, appropriate for conservative long term investors looking at moderate risk, moderate return arising out of a well-diversifi ed portfolio. Since index funds are passively managed, the bias of the fund managers in stock selection is reduced, yet providing returns at par with the index. As of June 2008 there were 33 Index funds in India. Returns of Index funds have been shown in (Table 3-5). The returns are calculated as at the end of June 2008.
Table 3-5: Performance of Index Funds
Sr. No Index Funds scheme wise Benchmark IndexReturns
3 month 6 month 12 month
1 Birla Sun Life Index Fund - Dividend Nifty 50 -22.88 -23.21 -12.10
2 Birla Sun Life Index Fund - Growth Nifty 50 -22.88 -23.21 -12.10
3 Canara Robeco Nifty Index - Dividend Nifty 50 -21.51 -21.38 -11.27
4 Canara Robeco Nifty Index - Growth Nifty 50 -21.56 -21.39 -11.29
5 Franklin India Index Fund - NSE Nifty Plan - Dividend Nifty 50 -21.63 -21.40 -11.66
6 Franklin India Index Fund - NSE Nifty Plan - Growth Nifty 50 -21.63 -21.40 -11.66
7 HDFC Index Fund - Nifty Plan Nifty 50 -22.01 -22.86 -17.42
8 ICICI Prudential Index Fund Nifty 50 -21.92 -20.71 -9.76
9 ICICI Prudential Index Fund - IP - Dividend * Nifty 50 ----- ----- -----
10 ICICI Prudential Index Fund - IP - Growth* Nifty 50 ----- ----- -----
11 ING Nifty Plus Fund - Bonus Nifty 50 -20.92 -21.26 -12.39
12 ING Nifty Plus Fund - Dividend Nifty 50 -20.89 -21.21 -12.32
13 ING Nifty Plus Fund - Growth Nifty 50 -20.92 -21.26 -12.39
14 LIC MF Index Fund - Nifty Plan - Dividend Nifty 50 -21.75 -35.45 -28.99
15 LIC MF Index Fund - Nifty Plan - Growth Nifty 50 -21.75 -22.35 -14.58
16 PRINCIPAL Index Fund - Dividend Nifty 50 -21.58 -21.63 -11.71
17 PRINCIPAL Index Fund - Growth Nifty 50 -21.58 -21.61 -11.53
18 SBI Magnum Index Fund - Dividend Nifty 50 -21.13 -21.40 -12.49
19 SBI Magnum Index Fund - Growth Nifty 50 -22.67 -23.05 -14.30
20 Tata Index Fund - Nifty Plan - Option A Nifty 50 -21.67 -21.79 -12.39
Contd.
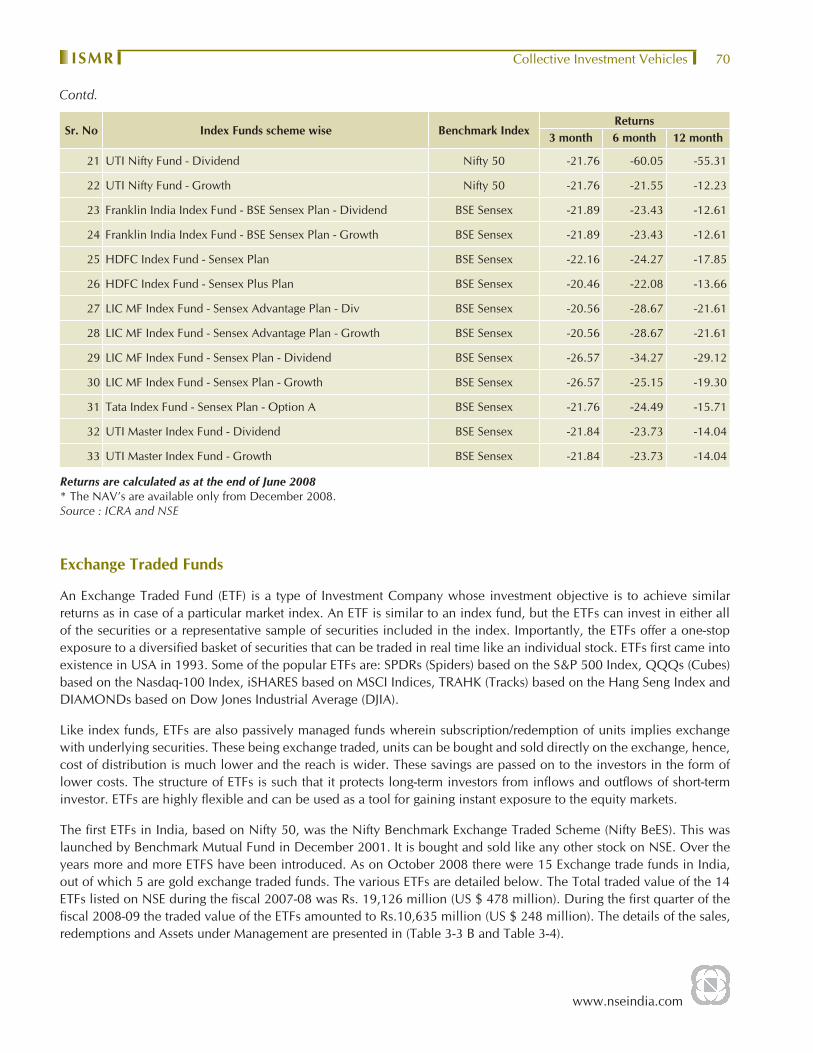
www.nseindia.com
Collective Investment VehiclesISMR 70
Sr. No Index Funds scheme wise Benchmark IndexReturns
3 month 6 month 12 month
21 UTI Nifty Fund - Dividend Nifty 50 -21.76 -60.05 -55.31
22 UTI Nifty Fund - Growth Nifty 50 -21.76 -21.55 -12.23
23 Franklin India Index Fund - BSE Sensex Plan - Dividend BSE Sensex -21.89 -23.43 -12.61
24 Franklin India Index Fund - BSE Sensex Plan - Growth BSE Sensex -21.89 -23.43 -12.61
25 HDFC Index Fund - Sensex Plan BSE Sensex -22.16 -24.27 -17.85
26 HDFC Index Fund - Sensex Plus Plan BSE Sensex -20.46 -22.08 -13.66
27 LIC MF Index Fund - Sensex Advantage Plan - Div BSE Sensex -20.56 -28.67 -21.61
28 LIC MF Index Fund - Sensex Advantage Plan - Growth BSE Sensex -20.56 -28.67 -21.61
29 LIC MF Index Fund - Sensex Plan - Dividend BSE Sensex -26.57 -34.27 -29.12
30 LIC MF Index Fund - Sensex Plan - Growth BSE Sensex -26.57 -25.15 -19.30
31 Tata Index Fund - Sensex Plan - Option A BSE Sensex -21.76 -24.49 -15.71
32 UTI Master Index Fund - Dividend BSE Sensex -21.84 -23.73 -14.04
33 UTI Master Index Fund - Growth BSE Sensex -21.84 -23.73 -14.04
Returns are calculated as at the end of June 2008* The NAV’s are available only from December 2008.Source : ICRA and NSE
Exchange Traded Funds
An Exchange Traded Fund (ETF) is a type of Investment Company whose investment objective is to achieve similar returns as in case of a particular market index. An ETF is similar to an index fund, but the ETFs can invest in either all of the securities or a representative sample of securities included in the index. Importantly, the ETFs offer a one-stop exposure to a diversifi ed basket of securities that can be traded in real time like an individual stock. ETFs fi rst came into existence in USA in 1993. Some of the popular ETFs are: SPDRs (Spiders) based on the S&P 500 Index, QQQs (Cubes) based on the Nasdaq-100 Index, iSHARES based on MSCI Indices, TRAHK (Tracks) based on the Hang Seng Index and DIAMONDs based on Dow Jones Industrial Average (DJIA).
Like index funds, ETFs are also passively managed funds wherein subscription/redemption of units implies exchange with underlying securities. These being exchange traded, units can be bought and sold directly on the exchange, hence, cost of distribution is much lower and the reach is wider. These savings are passed on to the investors in the form of lower costs. The structure of ETFs is such that it protects long-term investors from infl ows and outfl ows of short-term investor. ETFs are highly fl exible and can be used as a tool for gaining instant exposure to the equity markets.
The fi rst ETFs in India, based on Nifty 50, was the Nifty Benchmark Exchange Traded Scheme (Nifty BeES). This was launched by Benchmark Mutual Fund in December 2001. It is bought and sold like any other stock on NSE. Over the years more and more ETFS have been introduced. As on October 2008 there were 15 Exchange trade funds in India, out of which 5 are gold exchange traded funds. The various ETFs are detailed below. The Total traded value of the 14 ETFs listed on NSE during the fi scal 2007-08 was Rs. 19,126 million (US $ 478 million). During the fi rst quarter of the fi scal 2008-09 the traded value of the ETFs amounted to Rs.10,635 million (US $ 248 million). The details of the sales, redemptions and Assets under Management are presented in (Table 3-3 B and Table 3-4).
Contd.

www.nseindia.com
Collective Investment Vehicles ISMR71
List of Exchange traded Funds in India.
Sr. No Name of the ETF Description
1 NiftyBeEs The fi rst ETF in India, based on Nifty 50, was the Nifty Benchmark Exchange Traded Scheme. This was launched by Benchmark Mutual Fund in December 2001
2 Junior Nifty BeES This ETF is based on CNX Nifty Junior, launched on February 21, 2003
3 SUNDER S&P CNX Nifty UTI Depository Receipts Schemes (SUNDER) is based on Nifty 50 ,
4 Bank BeES (Bank Bees) Banking Index Benchmark Exchange Traded Scheme) tracks the CNX Bank Index, launched on May 27, 2004
5 Liquid BeES Liquid BeES (Liquid Benchmark Exchange Traded Scheme) was launched by Benchmark Mutual Fund on May 27,2004 as a money market ETF in India which is incidentally the only money market ETF in the world. It invests in a basket of call money, short-term government securities and money market instruments of short and medium maturities.
6 SPICE ICICI Mutual Fund also launched an ETF based on the BSE Sensex, SPICE (Sensex Prudential ICICI Exchange Traded Fund), trading for which started on January 13, 2003
7 KOTAKPSUBK Kotak Mahindra Mutual Fund ETF is based on the CNX PSU Bank index. It was listed on November 16, 2007 on NSE
8 PSUBNKBEES PSU Bank Benchmark Exchange Traded Scheme was launched by Benchmark Mutual Fund and tracks the CNX PSU Bank index. It was listed on November 01, 2007 on NSE
9 RELBANK Reliance Mutual Fund -Banking Exchange Traded Fund is based on the CNX Bank index. It was listed on June 27, 2008 on NSE
10 QNIFTY Quantum Index Fund -Exchange Traded Fund is an open Ended fund which tracks the movement of Nifty 50 and listed on July 18, 2008 on NSE.
Gold Exchange Traded Fund
A gold exchange traded fund unit is like a mutual fund unit whose underlying asset is Gold and is held in demat form. It is typically an Exchange traded Mutual Fund unit which is listed and traded on a stock exchange. Every gold ETF unit is representative of a defi nite quantum of pure gold and the traded price of the gold unit moves in tandem with the price of the actual gold metal. The GETF aims at providing returns which closely correspond to the returns provided by Gold. In India gold ETFs came about in the year 2007, the fi rst being Gold Bees. This Gold fund was introduced in India by Benchmark Asset Management Company. It offers investors an innovative, cost-effi cient and secure way to access the gold market. The units of Gold Benchmark Exchange Traded Scheme (GOLD Bees) ETF was listed on NSE on March 19, 2007. Thereafter UTI Mutual Fund launched the UTI Gold Exchange Traded Fund from March 1, 2007. UTI GOLD ETF- GOLDSHARE was listed on the NSE on April 17, 2007. Kotak Gold ETF (KOTAKGOLD) which was listed on NSE on August 08, 2007. Reliance Mutual Fund - Gold Exchange Traded Fund (RELGOLD) and Quantum Gold Fund -Exchange Traded Fund (ETF) QGOLDHALF were listed on June 27, 2008 and February 28, 2008 respectively. As on October 2008 there are 5 Gold ETFs in India.
Collective Investment Schemes
A Collective Investment Scheme (CIS) is any scheme or arrangement made or offered by any company, which pools the contributions, or payments made by the investors, and deploys the same. Despite the similarity between the CIS and MF regarding the pooling of savings and issuing of securities, they differ in their investment objective. While MF invests exclusively in securities, CIS confi ne their investment to plantations and real estate. Any entity proposing to operate as a Collective Investment Management Company (CIMC) has to apply for registration with SEBI.
www.nseindia.com
Collective Investment VehiclesISMR 72
Guidelines under CIS Regulations
The SEBI (CIS) Regulations specifi cally state that, without obtaining a certifi cate of registration from SEBI, no entity can carry on or sponsor or launch a CIS. The other regulations are as follows:
i. CIS should be set up and registered as a public company registered under the provisions of the Companies Act, 1956 and the memorandum of association should specify management of CIS as one of its objectives.
ii. The company at the time of registration as CIMC should have a minimum net worth of Rs. 5 crore (provided that at the time of making the application, the applicant should have a minimum net worth of Rs. 3 crore which should be increased to Rs. 5 crore within three years from the date of grant of registration).
iii. The offer document should disclose adequate information to enable investors to take informed decisions. The offer document should also indicate the maximum and minimum amount expected to be raised. No scheme should be kept open for subscription for a period more than 90 days.
iv. Each scheme has to obtain a rating from a recognized credit rating agency and the projects to be undertaken should be appraised by an appraising agency.
v. CIMC should obtain adequate insurance policy for protection of the scheme’s property.
vi. Advertisements for each and every scheme have to conform to the SEBI’s advertisement code.
vii. The CIMC should issue to the applicant whose application has been accepted, unit certifi cates as soon as possible but not later than six weeks from the date of closure of the subscription list.( provided if the units are issued through a depository, a receipt in lieu of unit certifi cate will be issued as per provisions of SEBI (Depositories and Participants) Regulations, 1996 and bye laws of the depository.
viii. The units of every scheme should be listed immediately after the date of allotment of units and not later than six weeks from the date of closure of the scheme on each of the stock exchanges as mentioned in the offer document.
ix. A scheme should be winded up on the expiry of duration specifi ed in the scheme or on the accomplishment of the purpose of the scheme. A scheme may also be wound up on the happening of any such event which in the opinion of the trustee. The scheme can also be winded if unit holders of a scheme holding three-fourth of the nominal value of the unit capital pass a resolution to that effect or if in the opinion of the CIMC, the purpose of the scheme cannot be accomplished then through the approval of least three-fourth of the nominal value of the unit capital of the scheme. However, for winding up the schemes, SEBI approval has to be obtained. Further, if in SEBIs opinion the continuation of the scheme would be prejudical to the interest of unit holders then the scheme can be winded. When a scheme is to be winded up then the trustee should give notice disclosing the circumstances leading to such a decision in a daily newspaper having nationwide circulation and in the newspaper published in the language of the region where the Collective Investment Management Company is registered.
The trustee should dispose of the assets of the scheme concerned in the best interest of the unit holders of that scheme. If the scheme is wound up because of happening of any event which in opinion of the trustee requires the scheme to be wound up then the proceeds realized should be utilized towards the discharge of such liabilities as are due and payable under the scheme and after making appropriate provision for meeting the expenses connected with such winding up, the balance should be paid to the unit holder in proportion to their unit holding.
After completion of winding up, the trustees have to forward to SEBI and the unit holders the report on steps taken for realization of assets of the scheme, expenses for winding up and net assets available for distribution to the unit holders and a certifi cate from the auditors of the scheme certifying that all the assets of the scheme have been realized and the details of the distribution of the proceeds.
The unclaimed money if any at the time of winding up should be kept separately in a bank account by the trustee for a period of three years for the purpose of meeting investors’ claims and thereafter should be transferred to investor protection fund, as may be specifi ed by SEBI.
www.nseindia.com
Collective Investment Vehicles ISMR73
x. The CIMC on behalf of the scheme should before the expiry of one month from the close of each quarter that is 31st March, 30th June, 30th September and 31st December publish its unaudited fi nancial results in one daily newspaper having nation wide circulation and in the regional newspaper of the region where the head offi ce of the CIMC is situated. (provided that the quarterly unaudited report should contain details as specifi ed in the regulations and such other details as are necessary for the purpose of providing a true and fair view of the operations of the scheme.
As on March 31, 2008, there were no CIS entity registered with SEBI.
Venture Capital Funds
Venture Capital Fund (VCF) is a fund established in the form of a trust or a company including a body corporate having a dedicated pool of capital, raised in the specifi ed manner and invested in Venture Capital Undertakings (VCUs). VCU is a domestic company whose shares is not listed on a stock exchange and is engaged in a business for providing services, production, or manufacture of article. A company or body corporate to carry on activities as a VCF has to obtain a certifi cate from SEBI and comply with the regulations prescribed in the SEBI (Venture Capital Regulations) 1996.
Regulations for VCFs
The salient features of the SEBI (Venture Capital Regulations), 1996 are as follows:
i. A venture capital fund may raise money from any investor whether India, Foreign or non-resident Indian by way of issue of units. No venture capital fund set up as a company or any scheme of a venture capital fund Set up as a trust should accept any investment from any investor which is less Rs. 0.5 million (5 lakh). However, this does not apply for investors who are employees or the principal offi cer or directors of the venture capital fund or directors of the trustee company or trustees where the venture capital fund has been established as a trust and the employees of the fund manager or asset management company. Each scheme launched or set up by a venture capital fund should have fi rm commitment from the investors for contribution of an amount of at least Rupees fi fty million or (Rs.5 crore) before the start of the operations by the VCF.
ii. The VCF is eligible to participate in the IPO through book building route as Qualifi ed Institutional Buyer.
iii. Automatic exemption is granted from open offer requirements in case of transfer of shares from VCFs in Foreign Venture Capital Investors (FVCIs) to promoters of a venture capital undertaking.
Investment Condition & Restrictions i. The VCF has to disclose the investment strategy at the time of application for registration and should not have
invested more than 25% corpus of the fund in any one VCU.
ii. Venture Capital Fund may invest in securities of foreign companies subject to such conditions or guidelines that may be stipulated or issued by the Reserve Bank of Indian and SEBI from time to time.
iii. A VCF, also, cannot invest in associated companies.
iv. Venture capital fund should make investment as enumerated below:
i) At least 66.67 % of the investible funds should be invested in unlisted equity shares or equity linked instruments of venture capital undertakings.
ii) Not more than 33.33 % of the investible funds may be invested by way of
• subscription to Initial Public Offer (IPO) of a VCU whose shares are proposed to be listed.
• debt or debt instrument of a VCU in which the VCF has already made an investment by way of equity.
• Preferential allotment of equity shares of a listed company subject to lock-in-period of one year.

www.nseindia.com
Collective Investment VehiclesISMR 74
• The equity shares or equity linked instruments of a fi nancially weak company or a sick industrial company whose shares are listed. For these regulations, a fi nancially weak company or a sick industrial company means a company, which has at the end of the previous fi nancial year accumulated losses, which has resulted in erosion of more than 50% but less than 100 % of its networth as at the beginning of the previous fi nancial year.
• Special Purpose Vehicles (SPVs) which are created by a venture capital fund for the purpose of facilitating or promoting investment in accordance with these Regulations.
The investment conditions and restrictions stipulated above should be achieved by the venture capital fund by the end of its life cycle.
v. The venture capital fund should disclose the duration of life cycle of the fund.
Prohibition on Listing :
No venture capital fund is entitled to get its units listed on any recognized stock exchange till the expiry of three years from the date of the issuance of units by the venture capital fund.
As on March 31, 2008 the total count of VCFs and FVCIs stood at 106 and 97 respectively. Details of the VCFs & FVCIs are in (Table 3-6). All VCFs are now required to provide information pertaining to their venture capital activity for every quarter starting from the quarter ending December 2000.
Table 3-6: Industry wise Cumulative Investment details of SEBI Registered Venture Capital Funds (VCF) and Foreign Venture Capital Investors (FVCI)
Sectors of Economy
31-Mar-08 30-Jun-08
VCF FVCI Total Total VCF FVCI Total Total
(Rs.mn) (US $ mn.) (Rs.mn) (US $ mn.)
Information technology 8,170 14,430 22,600 565 7,760 15,450 23,210 540
Telecommunications 1,880 8,930 10,810 270 1,910 8,660 10,570 246
Pharmaceuticals 8,220 5,980 14,200 355 7,810 6,420 14,230 331
Biotechnology 3,540 310 3,850 96 3,150 310 3,460 81
Media/ Entertainment 4,060 690 4,750 119 5,830 890 6,720 156
Services Sector 13,410 10,900 24,310 608 14,780 12,590 27,370 637
Industrial Products 8,110 7,480 15,590 390 10,200 8,230 18,430 429
Real Estate 50,540 22,310 72,850 1,823 48,620 14,240 62,860 1,464
Others 101,620 96,020 197,640 4,945 101,220 102,470 203,690 4,742
Total 199,550 * 167,050 316,820 7,926 201,280 * 169,260 323,790 7,539
*includes Rs.49,780 million of FVCI investments in VCF
*includes Rs.46,570 million of FVCI investments in VCF
Source : SEBI

www.nseindia.com
Collective Investment Vehicles ISMR75
Policy debates1
Unit holding pattern of mutual funds
According to SEBI published statistics, the details of unitholding pattern of mutual funds as on 31st March 2008, is as below:
CATEGORYNUMBER OF INVESTORS ACCOUNTS
% TO TOTAL INVESTORS ACCOUNTS
NET ASSETS (RS.CRORE)
% TO TOTAL NET ASSETS
Individuals 42,014,713 96.86 187,463.98 36.93
NRIs 857,950 1.98 24,697.49 4.86
FIIs 902 0.00 8,400.51 1.65
Corporates/ Institutions/ Others 501,599 1.16 287,108.01 56.55
TOTAL 43,375,164 100.00 507,669.99 100.00
From the data above it is observed that while individual investors accounted for 97% of the total number of investors, their share in the net assets of the mutual funds was 37%. On the other hand, the corporates and institutions accounted for 57% of the net assets of the MF industry.
This pattern of unit holding raises apprehensions and concern that such a substantial share of institutional money in mutual funds, if pulled out abruptly, can cause instability in the markets and lead to possible lowering of confi dence of retail investors. Further, MFs are typically investment vehicles for retail investors. This skewed pattern of unit holding in MFs in favour of corporates/institutions suggests that there is need for change in focus of MF industry in terms of targeting the untapped retail segment and discouraging institutional investments.
1 The views and approaches refl ected in the policy debates are not necessarily of NSE.

www.nseindia.com
Capital Market ISMR 76
Capital Market
Introduction
After the securities are issued in the primary market, they are traded in the secondary market by the investors. The stock exchanges along with a host of other intermediaries provide the necessary platform for trading in secondary market and also for clearing and settlement. The securities are traded, cleared and settled within the regulatory framework prescribed by the Exchanges and the SEBI. The Exchange has laid down rules and guidelines for various intermediaries with regards to the admission and Fee structure for Trading Members, listing criteria and listing fees for companies.
With the increased application of information technology, the trading platforms of stock exchanges are accessible from anywhere in the country through their trading terminals. The trading platforms are also accessible through internet. In a geographically widespread country like India, this has signifi cantly expanded the reach of the exchanges.
Trading MechanismNSE was the fi rst stock exchange in the country set up as a national exchange having nation-wide access with fully automated screen based trading system. Today, NSE has become the largest exchange in India with approximately 67% of the trading volumes on it. It is one of the very few exchanges in the world to also have adopted anonymous order matching system. The member punches in the NEAT system, the details of his order such as the quantities and prices of securities at which he desires to transact. The transaction is executed as soon as it fi nds a matching sale or buy order from a counter party. All the orders are electronically matched on a price/time priority basis. This has resulted in a considerable reduction in time spent, cost and risk of error, as well as frauds, resulting in improved operational effi ciency. It allows for faster incorporation of price sensitive information into prevailing prices, as the market participants can see the full market on real time basis. This increases informational effi ciency and makes the market more transparent. Further, the system allows a large number of participants, irrespective of their geographical locations, to trade with one another simultaneously, improving the depth and liquidity of the market. A single consolidated order book for each stock displays, on a real time basis, buy and sell orders originating from all over the country. The book stores only limit orders, which are orders to buy or sell shares at a stated quantity and stated price and are executed only if the price quantity conditions match. Thus, the NEAT system provides an Open Electronic Consolidated Limit Order Book (OECLOB), which ensures full anonymity by accepting orders, big or small, from members without revealing their identity. The NEAT System also provides equal access to all the investors. A perfect audit trail, which helps to resolve disputes by logging in the trade execution process in entirety, is also provided. Technology was used to carry the trading platform from the trading hall of stock exchanges to the premises of brokers. NSE carried the trading platform further to the PCs at the residence of investors through the Internet .
TrendsAll the 19 Stock Exchanges in India have been demutualised under the Corporatisation and Demutualisation Scheme of SEBI. More than 99 % of the turnover however is mainly from NSE and BSE. The coherent contribution of the Cash Market segment in the Indian Securities Market continued during the fi scal 2007-08. This segment witnessed a phenomenal growth of 76.80 % in the trading volumes (BSE and NSE) in comparison to the previous fi scal. The Nifty and Sensex posted a year on year returns of 19.68 % and 23.89 % respectively.

www.nseindia.com
Capital Market ISMR77
Policy DevelopmentsOver the past years the Government and the market regulators have taken several policy measures to improve the operations of the stock exchanges and market intermediaries. The measures are aimed at improving the market infrastructure and upgradation of risk containment, so as to protect the interest of the investors. The recent policy developments (April 2008 to August 2008) pertaining to trading of securities are enumerated below.
I Short selling and securities lending and borrowing
Pursuant to the recommendations of the Secondary Market Advisory Committee (SMAC) of SEBI and the decision of the SEBI Board, it was decided to permit all classes of investors to short sell. Accordingly the broad frame work for the same was provided vide SEBI circular SEBI/ MRD/DoP/SE/Dep/Cir- 14 /2007 dated December 20, 2007.
It was also decided in consultation with Government of India and SEBI, to permit Foreign Institutional Investors (FIIs) registered with SEBI and sub-accounts of FIIs to short sell, lend and borrow equity shares of Indian companies. Short selling, lending and borrowing of equity shares of Indian companies would be subject to such conditions as may be prescribed in that behalf by the Reserve Bank and the SEBI / other regulatory agencies from time to time.
The above permission would be subjected to the following conditions:
(i) The FII participation in short selling as well as borrowing / lending of equity shares would be subject to the current FDI policy and short selling of equity shares by FIIs would not be permitted for equity shares which are in the ban list and / or caution list of Reserve Bank.
(ii) Borrowing of equity shares by FIIs would only be for the purpose of delivery into short sale.
(iii) The margin / collateral would be maintained by FIIs only in the form of cash. No interest would be paid to the FII on such margin/collateral.
The designated custodian banks would separately report all transactions pertaining to short selling of equity shares and lending and borrowing of equity shares by FIIs in their daily reporting with a suitable remark (short sold / lent / borrowed equity shares) for the purpose of monitoring by RBI
Thereafter it was decided to operationalise Short selling and securities lending and borrowing from Monday, April 21, 2008.
II. Introduction of Direct Market Access facility
Direct Market Access (DMA) is a facility which allows brokers to offer clients direct access to the exchange trading system through the broker’s infrastructure without manual intervention by the broker. Some of the advantages offered by DMA are direct control of clients over orders, faster execution of client orders, reduced risk of errors associated with manual order entry, greater transparency, increased liquidity, lower impact costs for large orders, better audit trails and better use of hedging and arbitrage opportunities through the use of decision support tools / algorithms for trading. While ensuring conformity with the provisions of the Securities Contract (Regulations) Act, 1956 (42 of 1956), Stock Exchanges are required facilitate Direct Market Access for investors subject to the following conditions:
1. Application for Direct Market Access (DMA) facility
• Brokers interested to offer DMA facility would be required to apply to the respective stock exchanges giving details of the software and systems proposed to be used, which should be duly certifi ed by a Security Auditor as reliable.
• The stock exchange would have to grant approval or reject the application as the case may be, and communicate its decision to the member within 30 calendar days of the date of completed application submitted to the exchange.
www.nseindia.com
Capital Market ISMR 78
• The stock exchange, before giving permission to brokers to offer DMA facility would have to ensure the fulfi llment of the applicable conditions
2. Operational specifi cations
• All DMA orders are required to be routed to the exchange trading system through the broker’s trading system. The broker’s server routing DMA orders to the exchange trading system should be located in India.
• The broker are required to ensure sound audit trail for all DMA orders and trades, and be able to provide identifi cation of actual user-id for all such orders and trades. The audit trail data should available for at least 5 years.
• Exchanges should be able to identify and distinguish DMA orders and trades from other orders and trades. Exchanges should maintain statistical data on DMA trades and provide information on the same to SEBI on a need basis.
• The DMA system should have suffi cient security features including password protection for the user ID, automatic expiry of passwords at the end of a reasonable duration, and reinitialisation of access on entering fresh passwords.
• Brokers would be required to follow the similar logic/priorities used by the Exchange to treat DMA client orders. Brokers would have to maintain all activities/ alerts log with audit trail facility. The DMA Server should have internally generated unique numbering for all such client order/trades.
• A systems audit of the DMA systems and software should be periodically carried out by the broker as may be specifi ed by the exchange and certifi cate in this regard should be submitted to the exchange.
• The exchanges and brokers would have to provide for adequate systems and procedures to handle the DMA trades.
3. Client Authorization and Broker – Client agreement
• Exchanges should specify from time to time the categories of investors to whom the DMA facility can be extended. Initially, the permission is restricted to institutional clients.
• Brokers should specifi cally authorize clients for providing DMA facility after fulfi lling Know Your Client requirements and carrying out due diligence regarding clients’ credit worthiness, risk taking ability, track record of compliance and fi nancial soundness.
• Brokers should ensure that only those clients who are deemed fi t and proper for this facility are allowed access to the DMA facility. Brokers should maintain proper records of such due diligence. Individual users at the client end would also be authorized by the broker based on minimum criteria. The records of user details, user-id and such authorization would be maintained by the broker. Details of all user-ids activated for DMA should be provided by the broker to the exchange.
• The broker should enter into a specifi c agreement with the clients for whom they permit DMA facility. This agreement should include the following safeguards:
a) The client shall use the DMA facility only to execute his own trades and shall not use it for transactions on behalf of any other person / entity.
b) Electronic/Automated Risk management at the broker’s level before release of order to the Exchange system. The client should agree to be bound by the various limits that the broker should impose for usage of the DMA facility.
c) Right to withdraw DMA facility if the limits set up are breached or for any other such concerns
d) Withdrawal of DMA facility on account of any misuse or on instructions from SEBI/Exchange.

www.nseindia.com
Capital Market ISMR79
Exchanges should prepare a model agreement for this purpose. The broker’s agreement with clients should not have any clause that is less stringent/contrary to the conditions stipulated in the model agreement.
4. Risk Management
The broker should ensure that trading limits/ exposure limits/ position limits are set for all DMA clients based on risk assessment, credit quality and available margins of the client. The broker system should have appropriate authority levels to ensure that the limits can be set up only by persons authorized by the risk / compliance manager.
The broker should ensure that all DMA orders are routed through electronic/automated risk management systems of the broker to carry out appropriate validations of all risk parameters including Quantity Limits, Price Range Checks, Order Value, and Credit Checks before the orders are released to the Exchange. All DMA orders should be subjected to the following limits:
a) Order quantity / order value limit in terms of price and quantity specifi ed for the client.
b) All the position limits which are specifi ed in the derivatives segment as applicable.
c) Net position that can be outstanding so as to fully cover the risk emanating from the trades with the available margins of the specifi c client.
d) Appropriate limits for securities which are subject to FII limits as specifi ed by RBI.
The broker may provide for additional risk management parameters as they may consider appropriate.
5. Broker to be liable for DMA trades
The broker should be fully responsible and liable for all orders emanating through their DMA systems. It shall be the responsibility of the broker to ensure that only clients who fulfi ll the eligibility criteria are permitted to use the DMA facility
6. Cross Trades
Brokers using DMA facility for routing client orders should not be allowed to cross trades of their clients with each other. All orders must be offered to the market for matching.
7. Other legal provisions
In addition to the requirements mentioned above, all existing obligations of the broker as per current regulations and circulars should continue without change. Exchanges may also like to specify additional safeguards / conditions as they may deem fi t for allowing DMA facilities to their brokers.
Market Design1€
Stock ExchangesAt the end of March 2008, there were 19 stock exchanges registered with SEBI having a total of 8,517 registered brokers and 43,874 registered sub-brokers trading on them (Annexure 4-1). The stock exchanges need to be recognized under the Securities Contracts (Regulation) Act, 1956. There are 19 stock exchanges in India. The Securities and Exchange Board of India (SEBI), has approved and notifi ed the Corporatisation and Demutualisation Scheme of 19 Stock Exchanges. BSE has successfully completed the process of Demutualisation in terms of The BSE (Corporatisation and Demutualisation) Scheme, 2005 on May 16, 2007. NSE since inception has adopted a demutualised structure and its model of demutualization compares well with the international models of demutualised stock exchanges as seen from (Table 4-1).
1 € While an attempt has been made to present market design for the entire Indian Securities Market, the trading mechanism and such other ex-change – specifi c elements have been explained on the model adopted by NSE. The market developments have been explained, mostly for the two largest stock exchanges, viz NSE and BSE. Wherever data permits, an all-India picture has been presented.

www.nseindia.com
Capital Market ISMR 80
Table 4-1: Comparison of the NSE Model and the International Models of Demutualised Stock Exchanges
Comparators International Model NSE Model
Legal Structure Company CompanyFor Profi t / Not for Profi t
For Profi t Company For Profi t Company
Ownership Structure
Owned by Shareholders which includes brokers Owned by Shareholders which are fi nancial institutions which also have broking fi rms as subsidiaries.
Listing Several stock exchanges are listed on themselves after Initial Public Offer.
Not a listed company. No Initial Public Offer made.
Ceilings on shareholding
Mostly 5% of voting rights for a single shareholder No ceiling
Segregation of ownership, trading rights and management
These are segregated. To become a member of the demutualised stock exchange, it is not necessary to own a share in the company. Thus, members may or may not be shareholders and members who own shares may sell off their trading rights and all shareholders are not necessarily members.
These are segregated. The trading rights and ownership are segregated. The broking fi rms are not shareholders.
Board Structure The Governing Board comprises of directors who are elected by shareholders. Some of the directors are brokers but majority do not have stock broking background.
The Board comprises of representatives of shareholders, academics, chartered accountants, legal experts etc. Of these, 3 directors are nominated by SEBI and 3 directors are public representatives approved by SEBI.
Fiscal benefi ts As mutual entities, stock exchanges enjoyed fi scal benefi ts prior to demutualisation, but when converted into for profi t companies these are taxed.
NSE was set up as a demutualised for profi t company and is taxed. So the question of fi scal benefi t prior to demutualisation does not arise.
Transfer of assets Assets were transferred from the mutual entity to the for-profi t demutualised company and shares were given to the members in lieu of the ownership in the old entity. There was no cash consideration paid. Since an Initial Public Offer (IPO) was also made in many cases, the valuation of the shares were done by the market and no separate valuation exercise was required as for example in the case of LSE where a bonus issue was made.
The question of transfer of assets did not arise because NSE was set up by the institutions as a demutualised company itself.
Enactment of legislation to give effect to demutualisation
In several countries a separate legislation was necessary as in the case of Australia, Hong Kong, Toronto and Singapore. In several others no legislation was necessary as in the case of UK.
Not applicable as NSE was set up as a demutualised company.
Source: Report of the SEBI Group on Corporatisation and Demutualisation of Stock Exchanges.
MembershipThe trading platform of a stock exchange is accessible only to trading members. They play a signifi cant role in the secondary market by bringing together the buyers and the sellers. The brokers give buy/sell orders either on their own account or on behalf of clients. As these buy and sell order matches, the trades are executed. The exchange can admit a broker as its member only on the basis of the terms specifi ed in the Securities Contracts (Regulation) Act, 1956, the SEBI Act 1992, the rules, circulars, notifi cations, guidelines, and the byelaws, rules and regulations of the concerned exchange. No stock broker or sub-broker is allowed to buy, sell or deal in securities, unless he or she holds a certifi cate of registration from the SEBI.
Fees/Eligibility Criteria
The stock exchanges, however are free to stipulate stricter requirements than those stipulated by the SEBI. The minimum standards stipulated by NSE are in excess of those laid down by the SEBI. The admission of trading members is based on various criteria like capital adequacy, track record, education, and experience. With effect from July 1, 2008 a processing fee of Rs.11,236/- and an admission fee of Rs.5,61,800/- is charged for taking up new membership. The detailed eligibility criteria for trading membership in the CM, WDM, F&O and CD segment is presented in Table- 4-2. This refl ects a conscious decision of NSE to ensure quality broking services.

www.nseindia.com
Capital Market ISMR81
Corporatisation No of Brokers and Sub brokers
The authorities have been encouraging corporatisation of the broking industry. As a result, a number of brokers-proprietor fi rms and partnership fi rms have converted themselves into corporates. As of end March 2008, 4,190 brokers, accounting for nearly 44.17 % of total brokers have become corporate entities. Amongst those registered with NSE around 92.03 % of them were corporatised, followed by BSE with 81.08 % corporate brokers.During 2007-08, 218 new brokers were registered with SEBI, whereas 174 were membership cases of reconciliation/cancellation/surrenderAs at end-March 2008, there were 44,074 sub-brokers registered with SEBI, as compared with 27,540 sub-brokers as at end of previous year. NSE and BSE together constituted 97.02% of the total sub-brokers.
Listing of Securities : Listing means formal admission of a security to the trading platform of a stock exchange. Listing of securities on the domestic stock exchanges is governed by the provisions in the
• Companies Act, 1956, • Securities Contracts (Regulation) Act, 1956 (SC(R)A), • Securities Contracts (Regulation) Rules (SC(R)R), 1957, • Circulars/guidelines issued by Central Government and SEBI. • Rules, bye-laws and regulations of the concerned stock exchange and by the listing agreement entered into by
the issuer and the stock exchange. A number of requirements, under the SC(R)R, the byelaws, the listing agreement have to be continuously complied with by the issuers to ensure continuous listing of its securities. The listing agreement also stipulates the disclosures that have to be made by the companies. In addition, the corporate governance practices enumerated in the agreement have to be followed. The Exchange is required to monitor the compliance with requirements. In case a company fails to comply with the requirements, then trading of its security would be suspended for a specifi ed period, or withdrawal/delisting, in addition to penalty as prescribed in the SC(R)A
Key provisions of Various Acts governing the listing of securities
• The Companies Act, 1956 requires a company intending to issue securities to the public to seek permission from one or more recognised stock exchanges for its listing. If the permission is not granted by all the stock exchanges before the expiry of 10 weeks from the closure of the issue, then the allotment of securities would be void. Also, a company may prefer to appeal against refusal of a stock exchange to list its securities to the Securities Appellate Tribunal (SAT). The prospectus should state the names of the stock exchanges, where the securities are proposed to be listed.
• The byelaws of the exchanges stipulates norms for the listing of securities. All listed companies are under obligation to comply with the conditions of listing agreement with the stock exchange where their securities are listed.
• According to the Securities Contract Regulation Act 1956, for any security to be listed on any recognized stock exchange, it has to fulfi ll the eligibility criteria and comply with the regulations made by SEBI.
• The Securities Contract (Regulation) Act, 1956 prescribe requirements with respect to the listing of securities on a recognised stock exchange and empowers SEBI to waive or relax the strict enforcement of any or all of requirements with respect to listing prescribed by these rules.
• The listing agreement states that the issuer should agree to adhere to the agreement of listing, except for a written permission from SEBI. As a precondition for the security to remain listed, an issuer should comply with the conditions as may be prescribed by the Exchange. Further, the securities are listed on the Exchange at its discretion, as the Exchange has the right to suspend or remove from the list the said securities at any time and for any reason, which it considers appropriate.
www.nseindia.com
Capital Market ISMR 82
• As per SEBI provision, the basic norms of listing on the stock exchanges should be uniform across the exchanges. However, the stock exchanges can prescribe additional norms over and above the minimum, which should be part of their byelaws. SEBI has been issuing guidelines/circulars prescribing certain norms to be included in the listing agreement and to be complied by the companies. The listing requirements for companies in the CM segment of NSE are presented in ( Table 4-3).
• The stock exchanges levy listing fees on the companies, whose securities are listed with them. The listing fee has two components-initial fee and annual fee. While, initial fee is a fi xed amount, the annual fee varies depending upon the size of the company. as per the below table. For Companies who have a paid up share, bond and/ or debenture and/or debt capital, etc. of more than Rs.500 crores would have to pay minimum fees of Rs.3,75,000 and an additional listing fees of Rs.2,500 for every increase of Rs.5 crores or part thereof in the paid up share, bond and/ or debenture and/or debt capital, etc. For Companies who have a paid up share, bond and/ or debenture and/or debt capital, etc. of more than Rs.1,000 crores would have to pay minimum fees of Rs.6,30,000 and an additional listing fees of Rs.2,750 for every increase of Rs.5 crores or part thereof in the paid up share, bond and/ or debenture and/or debt capital, etc.
Listing Fees in the CM Segment
Sr. No. Listing Fees Amount
(Rs.)1 Initial Listing Fees 25,000
2 Annual Listing Fees (based on paid up share, bond and/ or debenture and/or debt capital, etc.)
a Upto Rs. 1 Crore 10,000b Above Rs. 1 Crore and upto Rs.5 Crores 15,000c Above Rs. 5 Crore and upto Rs.10 Crores 25,000d Above Rs. 10 Crore and upto Rs.20 Crores 45,000e Above Rs. 20 Crore and upto Rs.30 Crores 70,000f Above Rs. 30 Crore and upto Rs.40 Crores 75,000g Above Rs. 40 Crore and upto Rs.50 Crores 80,000h Above Rs. 50 Crores and upto Rs.100 Crores 1,30,000i Above Rs. 100 Crore and upto Rs.150 Crores 1,50,000j Above Rs. 150 Crore and upto Rs.200 Crores 1,80,000k Above Rs. 200 Crore and upto Rs.250 Crores 2,05,000l Above Rs. 250 Crore and upto Rs.300 Crores 2,30,000
m Above Rs. 300 Crore and upto Rs.350 Crores 2,55,000n Above Rs. 350 Crore and upto Rs.400 Crores 2,80,000o Above Rs. 400 Crore and upto Rs.450 Crores 3,25,000p Above Rs. 450 Crore and upto Rs.500 Crores 3,75,000
Internet trading SEBI has allowed the use of internet as an order routing system for communicating investors’ orders to the exchanges through the registered brokers. These brokers should obtain the permission from their respective stock exchanges. In February 2000, NSE became the fi rst exchange in the country to provide web-based access to investors to trade directly on the Exchange followed by BSE in March 2001. The orders originating from the PCs of investors are routed through the internet to the trading terminals of the designated brokers with whom they have relations and further to the exchange. After these orders are matched, the transaction is executed and the investors get the confi rmation directly on their PCs.

www.nseindia.com
Capital Market ISMR83
Trading Regulations
Insider Trading
Insider Trading is considered as an offence and is hence prohibited as per the SEBI (Prohibition of Insider Trading) Regulations, 1992. The same was amended in the year 2003. The act prohibits an insider from dealing (on his behalf or on behalf of any other person) in securities of a company listed on any stock exchange, when in possession of any unpublished price sensitive information. Further, it has also prohibited any insider from communicating, counseling or procuring directly or indirectly any unpublished price sensitive information to any person who while in possession of such unpublished price sensitive information should not deal in securities. Price sensitive information means any information which is related directly or indirectly to a company and which if published is likely to materially affect the price of securities of a company. It includes information like periodical fi nancial results of the company, intended declaration of dividends (both interim and fi nal), issue of securities or buy-back of securities, any major expansion plans or execution of new projects, amalgamation, merger or takeovers, disposal of the whole or substantial part of the undertaking and signifi cant changes in policies, plans or operations of the company. SEBI is empowered to investigate on the basis of any complaint received from the investors, intermediaries or any other person on any matter having a bearing on the allegations of insider trading. SEBI can also investigate suo motu upon its own knowledge or information in its
Unfair Trade Practices
The SEBI (Prohibition of Fraudulent and Unfair Trade Practices relating to the Securities Market) Regulations 2003 enable SEBI to investigate into cases of market manipulation and fraudulent and unfair trade practices. The regulations specifi cally prohibit fraudulent dealings, market manipulations, misleading statements to induce sale or purchase of securities, unfair trade practices relating to securities. When SEBI has reasonable ground to believe that the transaction in securities are being dealt within a manner detrimental to the investor or the securities market in violation of these regulations and when any intermediary has violated the rules and regulations under the act then it can order to investigate the affairs of such intermediary or persons associated with the securities market. Based on the report of the investigating offi cer, SEBI can initiate action for suspension or cancellation of registration of an intermediary.
TakeoversThe restructuring of companies through takeover is governed by SEBI (Substantial Acquisition of shares and Takeover) Regulations, 1997. These regulations were formulated so that the process of acquisition and takeovers is carried out in a well-defi ned and orderly manner following the fairness and transparency.
The SEBI (Substantial Acquisition of shares and Takeover) Regulations, 1997
Chapter II ‘Disclosures of shareholding and control in a listed company’ of the SEBI (Substantial Acquisition of Shares and Takeovers) Regulations, 1997
In context of this regulation ‘acquirer’ is defi ned as a person who directly or indirectly acquires or agrees to acquire shares or voting rights in the target company or acquires or agrees to acquires ‘control’ over the target company, either by himself or with any person acting in concert with the acquirer. The term ‘control’ includes right to appoint majority of the directors or to control the management or policy decisions exercisable by any person or persons acting individually or in concert, directly or indirectly, including by virtue of their shareholding or management rights or shareholders agreements or voting agreements or in any other manner. This implies that where there are two or more persons in control over the target company, the cesser of any one of such persons from such control should not be deemed to be in control of management. Certain categories of persons are required to disclose their shareholding and/or control in a listed company to that company. Such companies, in turn, are required to disclose such details to the stock exchanges where shares of the company are listed. In case of acquisition of 5 percent and more share or voting rights of a company, an acquirer would have to disclose at every stage the aggregate of his shareholding or voting rights in that company to the company and to the stock exchange where shares of the target company are listed. No acquirer either by himself or through/with persons acting in concert with him should acquire, additional shares or voting rights unless such acquirer makes a public announcement to acquire shares in accordance with the regulations. As per the regulations, the mandatory public offer is triggered on:
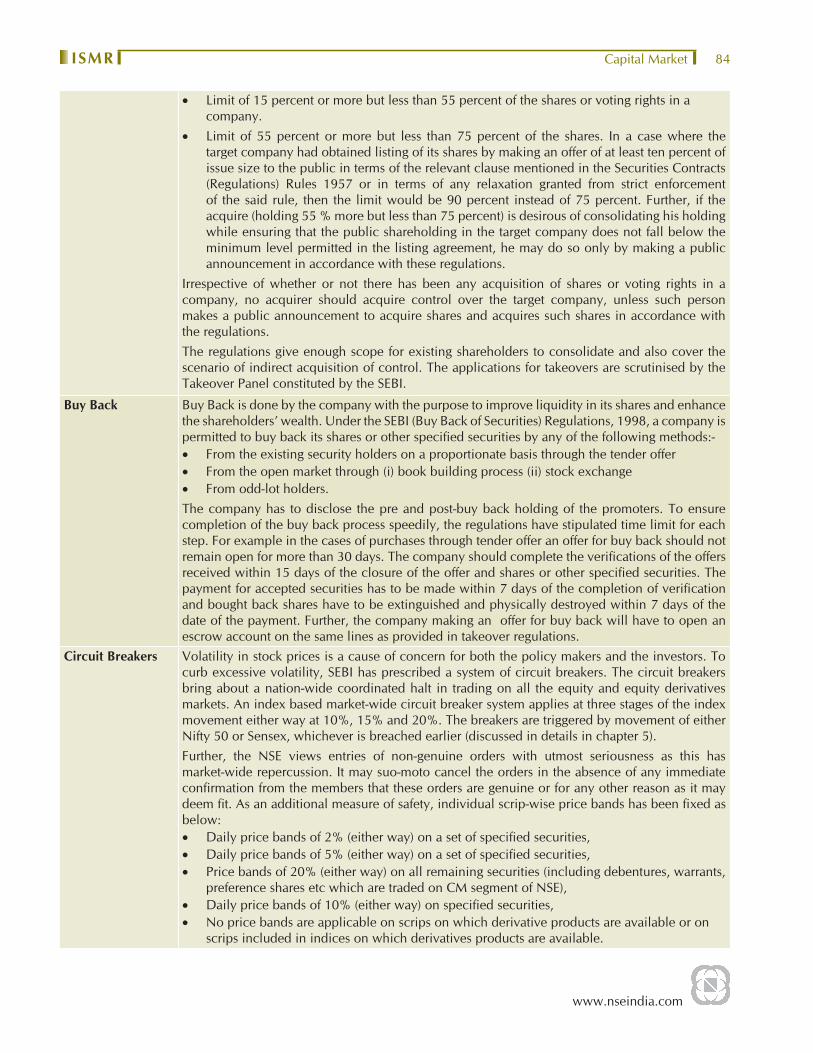
www.nseindia.com
Capital Market ISMR 84
• Limit of 15 percent or more but less than 55 percent of the shares or voting rights in a company.
• Limit of 55 percent or more but less than 75 percent of the shares. In a case where the target company had obtained listing of its shares by making an offer of at least ten percent of issue size to the public in terms of the relevant clause mentioned in the Securities Contracts (Regulations) Rules 1957 or in terms of any relaxation granted from strict enforcement of the said rule, then the limit would be 90 percent instead of 75 percent. Further, if the acquire (holding 55 % more but less than 75 percent) is desirous of consolidating his holding while ensuring that the public shareholding in the target company does not fall below the minimum level permitted in the listing agreement, he may do so only by making a public announcement in accordance with these regulations.
Irrespective of whether or not there has been any acquisition of shares or voting rights in a company, no acquirer should acquire control over the target company, unless such person makes a public announcement to acquire shares and acquires such shares in accordance with the regulations.The regulations give enough scope for existing shareholders to consolidate and also cover the scenario of indirect acquisition of control. The applications for takeovers are scrutinised by the Takeover Panel constituted by the SEBI.
Buy Back Buy Back is done by the company with the purpose to improve liquidity in its shares and enhance the shareholders’ wealth. Under the SEBI (Buy Back of Securities) Regulations, 1998, a company is permitted to buy back its shares or other specifi ed securities by any of the following methods:-• From the existing security holders on a proportionate basis through the tender offer• From the open market through (i) book building process (ii) stock exchange• From odd-lot holders.The company has to disclose the pre and post-buy back holding of the promoters. To ensure completion of the buy back process speedily, the regulations have stipulated time limit for each step. For example in the cases of purchases through tender offer an offer for buy back should not remain open for more than 30 days. The company should complete the verifi cations of the offers received within 15 days of the closure of the offer and shares or other specifi ed securities. The payment for accepted securities has to be made within 7 days of the completion of verifi cation and bought back shares have to be extinguished and physically destroyed within 7 days of the date of the payment. Further, the company making an offer for buy back will have to open an escrow account on the same lines as provided in takeover regulations.
Circuit Breakers Volatility in stock prices is a cause of concern for both the policy makers and the investors. To curb excessive volatility, SEBI has prescribed a system of circuit breakers. The circuit breakers bring about a nation-wide coordinated halt in trading on all the equity and equity derivatives markets. An index based market-wide circuit breaker system applies at three stages of the index movement either way at 10%, 15% and 20%. The breakers are triggered by movement of either Nifty 50 or Sensex, whichever is breached earlier (discussed in details in chapter 5). Further, the NSE views entries of non-genuine orders with utmost seriousness as this has market-wide repercussion. It may suo-moto cancel the orders in the absence of any immediate confi rmation from the members that these orders are genuine or for any other reason as it may deem fi t. As an additional measure of safety, individual scrip-wise price bands has been fi xed as below:• Daily price bands of 2% (either way) on a set of specifi ed securities, • Daily price bands of 5% (either way) on a set of specifi ed securities, • Price bands of 20% (either way) on all remaining securities (including debentures, warrants,
preference shares etc which are traded on CM segment of NSE), • Daily price bands of 10% (either way) on specifi ed securities,• No price bands are applicable on scrips on which derivative products are available or on
scrips included in indices on which derivatives products are available.
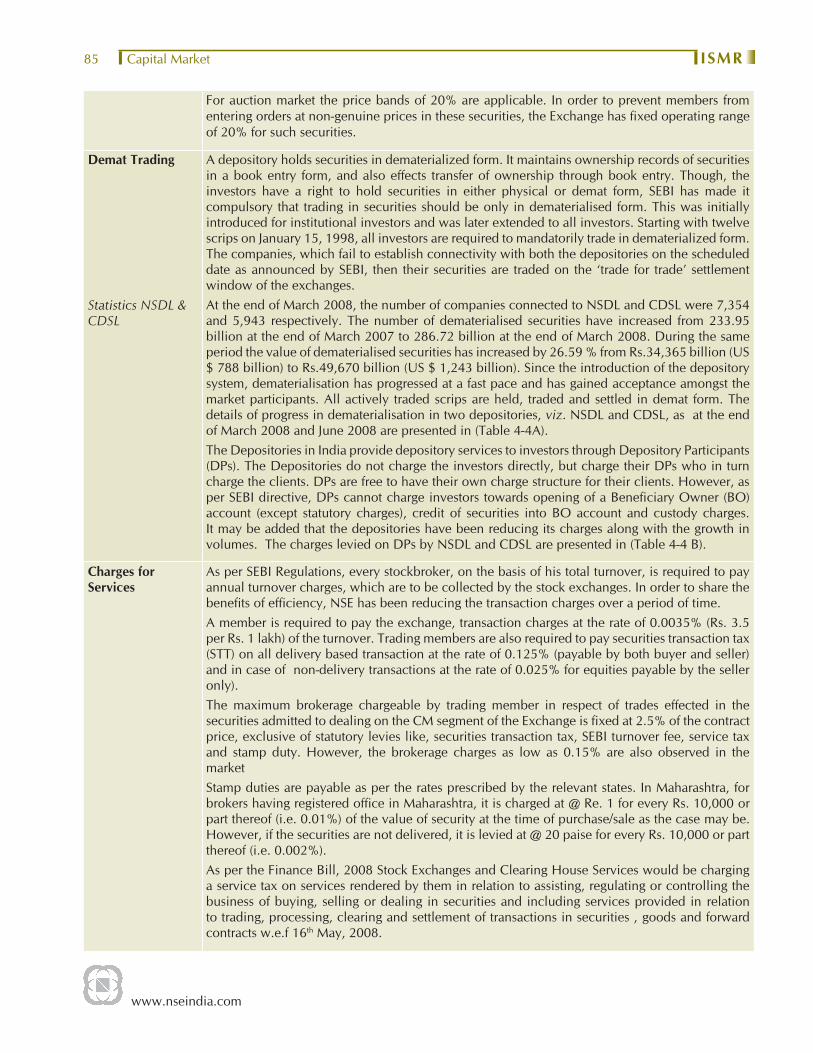
www.nseindia.com
Capital Market ISMR85
For auction market the price bands of 20% are applicable. In order to prevent members from entering orders at non-genuine prices in these securities, the Exchange has fi xed operating range of 20% for such securities.
Demat Trading
Statistics NSDL & CDSL
A depository holds securities in dematerialized form. It maintains ownership records of securities in a book entry form, and also effects transfer of ownership through book entry. Though, the investors have a right to hold securities in either physical or demat form, SEBI has made it compulsory that trading in securities should be only in dematerialised form. This was initially introduced for institutional investors and was later extended to all investors. Starting with twelve scrips on January 15, 1998, all investors are required to mandatorily trade in dematerialized form. The companies, which fail to establish connectivity with both the depositories on the scheduled date as announced by SEBI, then their securities are traded on the ‘trade for trade’ settlement window of the exchanges. At the end of March 2008, the number of companies connected to NSDL and CDSL were 7,354 and 5,943 respectively. The number of dematerialised securities have increased from 233.95 billion at the end of March 2007 to 286.72 billion at the end of March 2008. During the same period the value of dematerialised securities has increased by 26.59 % from Rs.34,365 billion (US $ 788 billion) to Rs.49,670 billion (US $ 1,243 billion). Since the introduction of the depository system, dematerialisation has progressed at a fast pace and has gained acceptance amongst the market participants. All actively traded scrips are held, traded and settled in demat form. The details of progress in dematerialisation in two depositories, viz. NSDL and CDSL, as at the end of March 2008 and June 2008 are presented in (Table 4-4A). The Depositories in India provide depository services to investors through Depository Participants (DPs). The Depositories do not charge the investors directly, but charge their DPs who in turn charge the clients. DPs are free to have their own charge structure for their clients. However, as per SEBI directive, DPs cannot charge investors towards opening of a Benefi ciary Owner (BO) account (except statutory charges), credit of securities into BO account and custody charges. It may be added that the depositories have been reducing its charges along with the growth in volumes. The charges levied on DPs by NSDL and CDSL are presented in (Table 4-4 B).
Charges for Services
As per SEBI Regulations, every stockbroker, on the basis of his total turnover, is required to pay annual turnover charges, which are to be collected by the stock exchanges. In order to share the benefi ts of effi ciency, NSE has been reducing the transaction charges over a period of time. A member is required to pay the exchange, transaction charges at the rate of 0.0035% (Rs. 3.5 per Rs. 1 lakh) of the turnover. Trading members are also required to pay securities transaction tax (STT) on all delivery based transaction at the rate of 0.125% (payable by both buyer and seller) and in case of non-delivery transactions at the rate of 0.025% for equities payable by the seller only). The maximum brokerage chargeable by trading member in respect of trades effected in the securities admitted to dealing on the CM segment of the Exchange is fi xed at 2.5% of the contract price, exclusive of statutory levies like, securities transaction tax, SEBI turnover fee, service tax and stamp duty. However, the brokerage charges as low as 0.15% are also observed in the marketStamp duties are payable as per the rates prescribed by the relevant states. In Maharashtra, for brokers having registered offi ce in Maharashtra, it is charged at @ Re. 1 for every Rs. 10,000 or part thereof (i.e. 0.01%) of the value of security at the time of purchase/sale as the case may be. However, if the securities are not delivered, it is levied at @ 20 paise for every Rs. 10,000 or part thereof (i.e. 0.002%).As per the Finance Bill, 2008 Stock Exchanges and Clearing House Services would be charging a service tax on services rendered by them in relation to assisting, regulating or controlling the business of buying, selling or dealing in securities and including services provided in relation to trading, processing, clearing and settlement of transactions in securities , goods and forward contracts w.e.f 16th May, 2008.

www.nseindia.com
Capital Market ISMR 86
Institutional Trades
Trades by Mutual Funds and Foreign Institutional Investors are termed as Institutional trades. Transactions by MFs in the secondary market are governed by SEBI (Mutual Funds) Regulations, 1996. A MF under all its schemes is not allowed to own more than 10% of any company’s paid-up capital. They are allowed to do only ‘delivery-based’ transactions. With effect from 21st April, 2008 a MF may engage in short selling of securities in accordance with the framework relating to short selling and securities lending and borrowing specifi ed by SEBI. A MF cannot invest more than 10% of the NAV of a particular scheme in the equity shares or equity related instruments of a single company. The investment by FIIs are governed by the rules and regulations of the RBI and the SEBI. As per the RBI guidelines, total holding of each FII/sub-accounts should not exceed 10 % of the total paid up capital or paid up value of each series of convertible debentures. Further total holding of all the FIIs/sub-accounts put together should not exceed 24 % of the paid up capital or paid up value of each series of convertible debentures. This limit of 24 % can be increased to the sectoral cap / statutory limit as applicable to the Indian Company concerned, by passing a resolution of its Board of Directors followed by a special resolution to that effect by its General Body.
Index Services : A stock index consists of a set of stocks that are representative of either the whole market, or a specifi ed sector. It helps to measure the change in overall behaviour of the markets or sector over a period of time. NSE and CRISIL, have jointly promoted the India Index Services & Products Limited (IISL). The IISL provides stock index services by developing and maintaining an array of indices for stock prices. IISL maintains a number of equity indices comprising broad-based benchmark indices, sectoral indices and customised indices.
The are maintained professionally to ensure that it continues to be a consistent benchmark of the equity markets, which involves inclusion and exclusion of stocks in the index, day-to-day tracking and giving effect to corporate actions on individual stocks.
NSE Indices
Indices Particulars Base date of the IndexS&P CNX NIFTY (NIFTY 50)
• Blue chip index of NSE • Most popular and widely used stock market indicator in the
country.• diversifi ed 50 stocks index accounting for 22 sectors of the
economy• top 50 liquid stocks in India• accounts for 58.64 % of total market capitalisation of CM
segment of NSE as at end-March 2008. • Accounts for 51.39 % of the traded value of all the stocks on
the NSE as as at end – March 2008• Used as a benchmarking fund portfolios, index based
derivatives and index funds.• For refl ecting the stock market behavior accurately and
also for modern applications such as index funds and index derivatives.
• base capital of Rs.2.06 trillion.
November 3, 1995
CNX Nifty Junior • The next rung of liquid securities after Nifty 50• The maintenance of the Nifty 50 and the CNX Nifty Junior are
synchronised so that the two indices will always be disjoint sets
• Accounts for 9.60 % of the market capitalization of CM segment of NSE as at end March 2008.
• Introduced on January 1, 1997, with a base capital of Rs.0.43 trillion.
November 3, 1996
Contd.

www.nseindia.com
Capital Market ISMR87
Indices Particulars Base date of the IndexCNX 100 • A diversifi ed 100 stock index accounting for 35 sector of the
economy• A combination of the Nifty 50 and CNX Nifty Junior
January 1, 2003
S&P CNX 500 • India’s fi rst broad-based benchmark of the Indian capital market for comparing portfolio returns vis-a-vis market returns.
• Represents about 84.24 % of total market capitalization and about 78.00% of the total turnover on the NSE as on March 30, 2008.
• The S&P CNX 500 companies are disaggregated into 72 industry indices viz. S&P CNX Industry Indices
• Industry weightages in the index refl ect the industry weightages in the market. For e.g. if the banking sector has a 5% weightage in the universe of stocks traded on NSE, banking stocks in the index would also have an approximate representation of 5% in the index.
1994
Nifty Midcap 50
and
CNX Midcap
• The primary objective of the Nifty Midcap 50 Index and CNX Midcap is to capture the movement of the midcap segment of the market segment which is being increasingly perceived as an attractive investment segment with high growth potential
January 1, 2004
January 1, 2003
S&P CNX Defty • Used as an instrument for measuring returns by institutional investor and off-shore fund enterprise with an equity exposure in India
• S&P CNX Defty is Nifty 50, measured in dollars• Acts as a Performance indicator to foreign institutional investors,
off shore funds, • Provides an effective tool for hedging Indian equity exposure • Provides fund managers an instrument for measuring returns
on their equity investment in dollar terms. Calculation of S&P CNX DeftyComputations are done using the Nifty 50 index calculated on the NEAT trading system of NSE and USD Rupee exchange rate that is based on the real time polled data feed which is as follows: (Nifty 50 at time t * Exchange rate as on base date/Exchange rate at time t)Specifi cations of S&P CNX Defty:Base date: 03 November 1995Base S&P CNX Defty Index Value: 1000 Nifty 50 Value as on Base date: 1000 Exchange rate as on base date: 34.65 Adjustment factor as on Base date:1.00
November 3, 1995
Shariah indices for the Indian equities market
S&P CNX 500 Shariah S&P CNX Nifty Shariah.
S&P Shariah Indices undergo sector and accounting-based screens that exclude businesses that offer products and services which are considered unacceptable or non-compliant according to Shariah-law, such as advertising and media (newspapers are allowed, sub-industries are analyzed individually), alcohol, fi nancials, gambling, pork, pornography, tobacco, and the trading of gold and silver as cash on a deferred basis. All S&P Shariah Index constituents are monitored on a daily basis to ensure that the indices maintain strict Shariah compliance.• launched on February 19, 2008• derived from the S&P CNX 500 and S&P CNX Nifty indices,
which are the leading gauges of the Indian equity market
December 29,2006
Contd.
Contd.

www.nseindia.com
Capital Market ISMR 88
Indices Particulars Base date of the Index• covers over 68% of the market capitalization for S&P CNX 500
and 80% for S&P CNX Nifty,(though this can vary depending on the number of companies found to be compliant. Historical performance analysis, however, indicates that there is a high level of correlation between the underlying indices and their new Shariah compliant versions.)
• S&P CNX 500 Shariah comprises 247 companies with a market capitalization of In Rs 28,889 billion
• S&P CNX Nifty Shariah comprises 38 companies with a market capitalization of In Rs 22,323 billion.
S&P ESG India. • launched on January 29,2008 • represents the fi rst of its kind to measure environment, social
and corporate governing (ESG) practices based on quantitative as opposed to subjective factors.
• employs a unique and innovative methodology that quantifi es a company’s ESG practices and translates them into a scoring system which is then used to rank each company against their peers in the Indian market.
• provides investors with exposure to a liquid and tradable index of 50 of the best performing stocks in the Indian market as measured by the ESG parameters.
January 03, 2005
BSE Indices
Indices Particulars Base date of the Index
SENSEX • Blue chip index index of the Bombay Stock Exchange (BSE). • fi rst compiled in 1986 and was calculated on a “Market Capitalization-Weighted”
methodology of 30 component stocks representing a sample of large, well-established and fi nancially sound companies. Consist of
• A basket of 30 constituent stocks representing a sample of large, liquid and representative companies
• It is scientifi cally designed and also based on globally accepted construction and review methodology.
• From September 2003, the SENSEX is calculated on a free-fl oat market capitalization methodology. The “free-fl oat Market Capitalization-Weighted” methodology is a widely followed index construction methodology on which majority of global equity benchmarks are based.
• Base index value is 100.
1978-79
BSE-100 INDEX • National Index was launched on January 3, 1989. • Comprises of 100 stocks listed at fi ve major stock exchanges in India at Mumbai,
Calcutta , Delhi, Ahmedabad and Madras. • Criteria for selection had been market activity, due representation to various
industry groups and representation of trading activity on major stock exchanges.
• The BSE National Index was renamed as BSE-100 Index from October 14, 1996 and since then it is calculated taking into consideration only the prices of stocks listed at BSE.
• BSE also calculates a dollar-linked version of BSE-100 Index.• Base index value is 100.
1983-84
Contd.
Contd.

www.nseindia.com
Capital Market ISMR89
Indices Particulars Base date of the Index
BSE-200 INDEX • Constructed and launched on 27th May 1994. • Equity shares of 200 selected companies from the specifi ed and non-specifi ed
lists of BSE have been considered for inclusion in the sample for `BSE-200’. • Selection of companies has primarily been done on the basis of current market
capitalisation of the listed scrips on the exchange. • Besides market capitalisation, the market activity of the companies as refl ected
by the volumes of turnover and certain fundamental factors were considered for the fi nal selection of the 200 companies.
• A dollar-linked version of BSE-200 Index is also calculated • Base index value is 100.
1989-90
BSE-500 INDEX • Consists of 500 scrips in its basket• Launched on August 9, 1999. • The changing pattern of the economy and that of the market have been kept in
mind while constructing this index. BSE-500 index • It represents nearly 93% of the total market capitalisation on Bombay Stock
Exchange Limited. means BSE-500 index ideally represents total market. • Represents all 20 major industries of the economy. • Base index value is 1000.
February 1, 1999
BSE Mid-Cap and BSE Small-Cap Index
• Tracks the performance of the companies with relatively small market capitalization and exclusively represent the mid and small cap companies listed on the Bombay Stock Exchange.
• constructed to capture the trend in the specifi c class of companies (with lower market capitalisation).
• Scrips that are classifi ed as Z group, scrips traded under the permitted category and scrips with the trading frequency of less than 60 % days in preceding three months are not considered for inclusion in these indices.
• Tracks the performance of scrips between 80 and 95 % scrips (95-100%). • Number of companies in each of these indices is • Base index value is 1000.
2002-03
BSE PSU Index • Launched on Monday, 4th June 2001 with the index calculation as Full Market capitalisation
• The index consists of major Public Sector Undertakings listed on the Exchange. • The BSE - Public Sector Undertaking (PSU) Index is a stock index that tracks the
performance of the listed PSU stocks on the Exchange. • For consideration scrips for inclusion in BSE PSU index, Public Sector Undertaking
refers to any undertaking wherein the holding of Central or State Government is equal to or more than 51%.
• BSE PSU index is a sub-set of BSE-500 index.. • Base value is 1000.
February 1, 1999
Dollex Series of BSE Indices
• Serves a yardstick by which the growth values of BSE indices are measured in dollar terms.
• Refl ects, in one value, the changes in both the stock prices and the foreign exchange variation.
• Formula for calculation of index is suitably modifi ed to express the current and base market values in dollar terms.
• The scope for dollar-linked index emerged from the background of Indian equity markets increasingly getting integrated with global capital markets and the need to assess the market movements in terms of international benchmarks. This
Contd.
Contd.
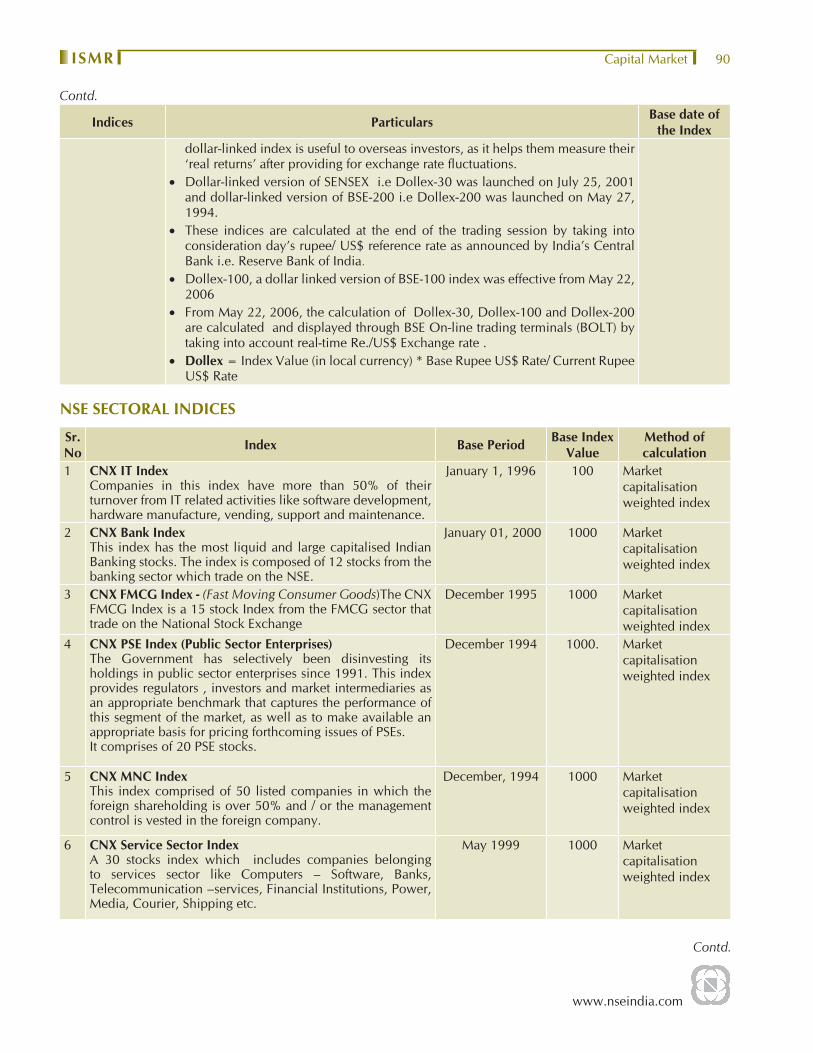
www.nseindia.com
Capital Market ISMR 90
Indices Particulars Base date of the Index
dollar-linked index is useful to overseas investors, as it helps them measure their ‘real returns’ after providing for exchange rate fl uctuations.
• Dollar-linked version of SENSEX i.e Dollex-30 was launched on July 25, 2001 and dollar-linked version of BSE-200 i.e Dollex-200 was launched on May 27, 1994.
• These indices are calculated at the end of the trading session by taking into consideration day’s rupee/ US$ reference rate as announced by India’s Central Bank i.e. Reserve Bank of India.
• Dollex-100, a dollar linked version of BSE-100 index was effective from May 22, 2006
• From May 22, 2006, the calculation of Dollex-30, Dollex-100 and Dollex-200 are calculated and displayed through BSE On-line trading terminals (BOLT) by taking into account real-time Re./US$ Exchange rate .
• Dollex = Index Value (in local currency) * Base Rupee US$ Rate/ Current Rupee US$ Rate
NSE SECTORAL INDICES
Sr. No Index Base Period Base Index
ValueMethod of calculation
1 CNX IT IndexCompanies in this index have more than 50% of their turnover from IT related activities like software development, hardware manufacture, vending, support and maintenance.
January 1, 1996 100 Market capitalisation weighted index
2 CNX Bank IndexThis index has the most liquid and large capitalised Indian Banking stocks. The index is composed of 12 stocks from the banking sector which trade on the NSE.
January 01, 2000 1000 Market capitalisation weighted index
3 CNX FMCG Index - (Fast Moving Consumer Goods)The CNX FMCG Index is a 15 stock Index from the FMCG sector that trade on the National Stock Exchange
December 1995 1000 Market capitalisation weighted index
4 CNX PSE Index (Public Sector Enterprises)The Government has selectively been disinvesting its holdings in public sector enterprises since 1991. This index provides regulators , investors and market intermediaries as an appropriate benchmark that captures the performance of this segment of the market, as well as to make available an appropriate basis for pricing forthcoming issues of PSEs.It comprises of 20 PSE stocks.
December 1994 1000. Market capitalisation weighted index
5 CNX MNC IndexThis index comprised of 50 listed companies in which the foreign shareholding is over 50% and / or the management control is vested in the foreign company.
December, 1994 1000 Market capitalisation weighted index
6 CNX Service Sector IndexA 30 stocks index which includes companies belonging to services sector like Computers – Software, Banks, Telecommunication –services, Financial Institutions, Power, Media, Courier, Shipping etc.
May 1999 1000 Market capitalisation weighted index
Contd.
Contd.

www.nseindia.com
Capital Market ISMR91
Sr. No Index Base Period Base Index
ValueMethod of calculation
7 S&P CNX Industry IndicesS&P CNX 500 Equity Index is desegregated into 72 Industry sectors which are separately maintained by IISL. The industry indices are derived out of the S&P CNX 500 and care is taken to see that the industry representation in the entire universe of securities is refl ected in the S&P CNX 500. e.g., if in the entire universe of securities, Banking sector has a 5% weightage, then the Banking sector (as determined by the Banking stocks in S&P CNX 500) would have a 5% weightage in the S&P CNX 500. The Banking sector index would be derived out of the Banking stocks in the S&P CNX 500. The changes to the weightage of various sectors in the S&P CNX 500 would dynamically refl ect the changes in the entire universe of securities
8 CNX Energy IndexThis index captures the performance of the companies in Energy sector. Energy sector Index will include companies belonging to Petroleum, Gas and Power sub sectors.
January 1, 2001 1000 Market capitalisation weighted index
9 CNX Pharma This index capture the performance of the companies in the Pharma Sector Index
January 1, 2001 1000 Market capitalisation weighted index
10 CNX Infrastructure IndexThis Index captures the performance of 25 stocks belonging to the Infrastructure sector like Telecom, Power, Port, Air, Roads, Railways, shipping and other Utility Services providers.
January 1, 2004 1000 Market capitalisation weighted index
11 CNX PSU BANK IndexThis index captures the performance of the Public Sector Undertaking banks. One of the eligibility criteria is that the constituents should be available for trading in the derivatives segment (Stock Futures & Options market) on NSE.
January 1, 2004 1000 Free Float methodology based weighted index
12 CNX Realty Index Further necessitated by the thrust of redevelopment of old buildings, building townships and redeveloping mill lands, one can witness plenty of opportunities in real estate sector backed by favourable tax regime. IISL has developed the CNX Realty Index to synergize these emerging opportunities in real estate sector along with their Index expertise creating new investment avenues for investors.
December 29, 2006
1000 Free Float methodology based weighted index
BSE Sectoral Indices Sr. No Index Base Period Base Index
Value Method of calculation
1 BSE Auto 01-Feb-1999 1000 Free-fl oat market capitalisation
2 BSE BANKEX 01-Jan-2002 1000 Free-fl oat market capitalisation
3 BSE Capital Goods 01-Feb-1999 1000 Launched on full market capitalisation method and effective August 23, 2004, calculation method shifted to free-fl oat market capitalisation
Contd.
Contd.

www.nseindia.com
Capital Market ISMR 92
Sr. No Index Base Period Base Index
Value Method of calculation
4 BSE Consumer Durables
01-Feb-1999 1000 Launched on full market capitalisation method and effective August 23, 2004, calculation method shifted to free-fl oat market capitalisation
5 BSE FMCG 01-Feb-1999 1000 Launched on full market capitalisation method and effective August 23, 2004, calculation method shifted to free-fl oat market capitalisation
6 BSE Healthcare 01-Feb-1999 1000 Launched on full market capitalisation method and effective August 23, 2004, calculation method shifted to free-fl oat market capitalisation
7 BSE IT 01-Feb-1999 1000 Launched on full market capitalisation method and effective August 23, 2004, calculation method shifted to free-fl oat market capitalisation
8 BSE Metal 01-Feb-1999 1000 Free-fl oat market capitalisation
9 BSE Oil & Gas 01-Feb-1999 1000 Free-fl oat market capitalisation
10 BSE Power 03-Jan-2005 1000 Free-fl oat market capitalisation
11 BSE Realty 2005 1000 Free-fl oat market capitalisation
12 BSE TECk Index 02-April-01 1000 Free-fl oat market capitalization
Table 4-2: Eligibility Criteria for Trading Membership
CORPORATES(Amount in Rs. lakh)
Particulars/ Segments CM CM and F&O WDM CM and WDM CM,WDM and F&O
Minimum Paid-up capital
30 30 30 30 30
Net Worth 100 100 (Membership in CM segment and Trading/Trading and self clearing membership in F&O segment)
300 (Membership in CM segment and Trading and Clearing membership in F&O segment)
200 200 200(Membership in WDM segment, CM segment and Trading/Trading and Self Clearing membership in F&O segment)
300(Membership in WDM segment, CM segment andTrading and Clearing membership in F&O segment)
Interest Free Security Deposit (IFSD) with NSEIL
85 110 150 235 260
Interest Free Security Deposit (IFSD) with NSCCL
15 15 * NIL 15 15 *
Collateral Security Deposit (CSD) with NSCCL
25 25** NIL 25 25**
Annual Subscription 1 1 1 2 2
Advance Minimum Transaction Chareges for Futures Segment
NIL 1 NIL NIL 1
Contd.
Contd.
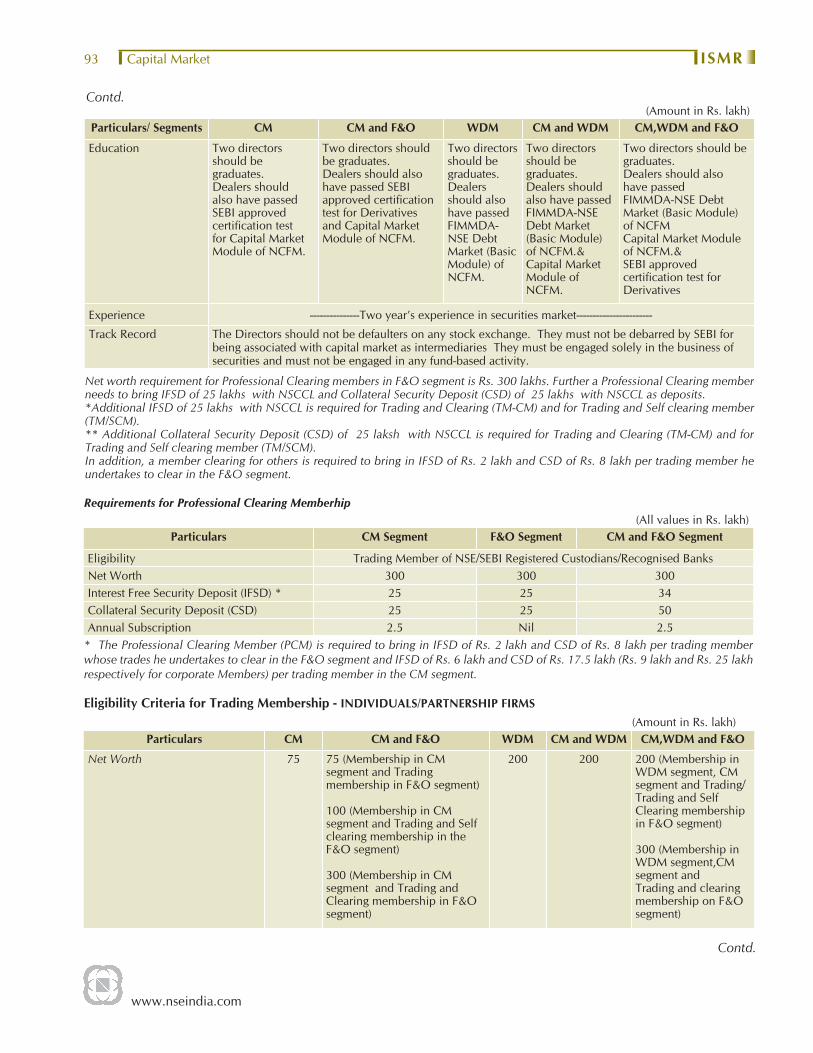
www.nseindia.com
Capital Market ISMR93
(Amount in Rs. lakh)Particulars/ Segments CM CM and F&O WDM CM and WDM CM,WDM and F&O
Education Two directors should be graduates. Dealers should also have passed SEBI approved certifi cation test for Capital Market Module of NCFM.
Two directors should be graduates. Dealers should also have passed SEBI approved certifi cation test for Derivatives and Capital Market Module of NCFM.
Two directors should be graduates. Dealers should also have passed FIMMDA-NSE Debt Market (Basic Module) of NCFM.
Two directors should be graduates. Dealers should also have passed FIMMDA-NSE Debt Market (Basic Module) of NCFM.&Capital Market Module of NCFM.
Two directors should be graduates. Dealers should also have passed FIMMDA-NSE Debt Market (Basic Module) of NCFMCapital Market Module of NCFM.&SEBI approved certifi cation test for Derivatives
Experience ---------------Two year’s experience in securities market-----------------------
Track Record The Directors should not be defaulters on any stock exchange. They must not be debarred by SEBI for being associated with capital market as intermediaries They must be engaged solely in the business of securities and must not be engaged in any fund-based activity.
Net worth requirement for Professional Clearing members in F&O segment is Rs. 300 lakhs. Further a Professional Clearing member needs to bring IFSD of 25 lakhs with NSCCL and Collateral Security Deposit (CSD) of 25 lakhs with NSCCL as deposits.*Additional IFSD of 25 lakhs with NSCCL is required for Trading and Clearing (TM-CM) and for Trading and Self clearing member (TM/SCM).** Additional Collateral Security Deposit (CSD) of 25 laksh with NSCCL is required for Trading and Clearing (TM-CM) and for Trading and Self clearing member (TM/SCM).In addition, a member clearing for others is required to bring in IFSD of Rs. 2 lakh and CSD of Rs. 8 lakh per trading member he undertakes to clear in the F&O segment.
Requirements for Professional Clearing Memberhip(All values in Rs. lakh)
Particulars CM Segment F&O Segment CM and F&O Segment
Eligibility Trading Member of NSE/SEBI Registered Custodians/Recognised BanksNet Worth 300 300 300Interest Free Security Deposit (IFSD) * 25 25 34Collateral Security Deposit (CSD) 25 25 50Annual Subscription 2.5 Nil 2.5
* The Professional Clearing Member (PCM) is required to bring in IFSD of Rs. 2 lakh and CSD of Rs. 8 lakh per trading member whose trades he undertakes to clear in the F&O segment and IFSD of Rs. 6 lakh and CSD of Rs. 17.5 lakh (Rs. 9 lakh and Rs. 25 lakh respectively for corporate Members) per trading member in the CM segment.
Eligibility Criteria for Trading Membership - INDIVIDUALS/PARTNERSHIP FIRMS(Amount in Rs. lakh)
Particulars CM CM and F&O WDM CM and WDM CM,WDM and F&O
Net Worth 75 75 (Membership in CM segment and Trading membership in F&O segment)
100 (Membership in CM segment and Trading and Self clearing membership in the F&O segment)
300 (Membership in CM segment and Trading and Clearing membership in F&O segment)
200 200 200 (Membership in WDM segment, CM segment and Trading/Trading and Self Clearing membership in F&O segment)
300 (Membership in WDM segment,CM segment and Trading and clearing membership on F&O segment)
Contd.
Contd.

www.nseindia.com
Capital Market ISMR 94
(Amount in Rs. lakh)Particulars CM CM and F&O WDM CM and WDM CM,WDM and F&O
Interest Free Security Deposit (IFSD) with NSEIL
26.5 51.5 150 176.5 201.5
Interest Free Security Deposit (IFSD) with NSCCL
6 6 * NIL 6 6*
Collateral Security Deposit (CSD) with NSCCL
17.5 17.5 ** NIL 17.5 17.5 **
Annual Subscription 0.5 0.5 1 1.5 1.5
Advance Minimum Transaction Chareges for Futures Segment
NIL 1 NIL NIL 1
*Additional IFSD of 25 lakhs with NSCCL is required for Trading and Clearing (TM-CM) and for Trading and Self clearing member (TM/SCM).** Additional Collateral Security Deposit (CSD) of 25 lakh with NSCCL is required for Trading and Clearing (TM-CM) and for Trading and Self clearing member (TM/SCM).
CURRENCY DERIVATIVES- Corporates, Individuals and Firms(Amount in Rs. lakh)
Particulars NSE Members NCDEX Members New ApplicantsTrading
MembershipTrading cum
Clearing Membership
Trading Membership
Trading cum Clearing
Membership
Trading Membership
Trading cum Clearing
Membership
Professional Clearing
MembershipNetworth 100 1000 100 1000 100 1000 1000
Cash to NSEIL 10 10 12.5 15 15 20 -
Cash to NSCCL - 25 - 25 - 25 25
Non cash to NSCCL - 25 - 25 - 25 25
Clearing member pays Rs. 10 lakhs for clearing every trading member’s trades in cash & non-cash form.Incase the member is opting for membership of any other segment(s) in combination with the membership of Currency Derivatives segment, the applicable net worth will be the minimum net worth required for the other segment(s) or the minimum net worth required for Currency Derivatives Segment, whichever is higher.
Table 4-3: Listing Criteria for Companies on the CM Segment of NSE
Criteria Initial Public Offerings (IPOs) Companies listed on other exchangesPaid-up Equity Capital (PUEC)/Market Capitalisation (MC) /Net Worth
PUEC ≥ Rs. 10 cr. and MC ≥ Rs. 25 cr.
PUEC ≥ Rs. 10 cr. and MC ≥ Rs. 25 cr. OR PUEC ≥ Rs. 25 cr. ORMC ≥ Rs. 50 cr. OR The company shall have a net worth of not less than Rs.50 crores in each of the preceding fi nancial years.
Company/Promoter’s Track Record Atleast 3 years track record of eithera) the applicant seeking listing OR b) the promoters/promoting company
incorporated in or outside India OR c) Partnership fi rm and subsequently
converted into Company not in existence as a Company for three years) and approaches the Exchange for listing. The Company subsequently formed would be considered for listing only on fulfi llment of conditions stipulated by SEBI in this regard.
Atleast three years track record of eithera) the applicant seeking listing; ORb) the promoters/promoting company,
incorporated in or outside India.
Contd.
Contd.

www.nseindia.com
Capital Market ISMR95
Criteria Initial Public Offerings (IPOs) Companies listed on other exchangesDividend Record / Net worth / Distributable Profi ts
-- Dividend paid in at least 2 out of the last 3 fi nancial years immediately preceding the year in which the application has been made OR The networth of the applicants atleast Rs.50 crores OR The applicant has distributable profi ts in at least two out of the last three fi nancial years.
Listing Listed on any other stock exchange for at least last three years OR listed on the exchange having nationwide trading terminals for at least one year.
Other Requirements (a) No disciplinary action by other stock exchanges/regulatory authority in past 3 yrs.
(b) Satisfactory redressal mechanism for investor grievances,
(c) distribution of shareholding and (d) details of llitigation record of the
promoting company, if any.(e) Track record of Directors of the
Company
(a) No disciplinary action by other stock exchanges/regulatory authority in past 3 yrs.
(b) Satisfactory redressal mechanism for investor grievances,
(c) distribution of shareholding and (d) details of llitigation record of the
promoting company, if any.(e) Track record of Directors of the
Company(f) Change in control of a Company/
Utilisation of funds raised from publicNote: 1. (a) In case of IPOs, Paid up Equity Capital means post issue paid up equity capital.
(b) In case of Existing companies listed on other exchanges, the existing paid up equity capital as well as the paid up equity capital after the proposed issue for which listing is sought shall be taken into account.
2. (a) In case of IPOs, market capitalisation is the product of the issue price and the post-issue number of equity shares.
(b) In case of case of Existing companies listed on other stock exchanges the market capitalisation shall be calculated by using a 12 month moving average of the market capitalisation over a period of six months immediately preceding the date of application. For the purpose of calculating the market capitalisation over a 12 month period, the average of the weekly high and low of the closing prices of the shares as quoted on the National Stock Exchange during the last twelve months and if the shares are not traded on the National Stock Exchange such average price on any of the recognised Stock Exchanges where those shares are frequently traded shall be taken into account while determining market capitalisation after making necessary adjustments for Corporate Action such as Rights / Bonus Issue/Split.
3. In case of Existing companies listed on other stock exchanges, the requirement of Rs.25 crores market capital shall not be applicable to listing of securities issued by Government Companies, Public Sector Undertakings, Financial Institutions, Nationalised Banks, Statutory Corporations and Banking Companies who are otherwise bound to adhere to all the relevant statutes, guidelines, circulars, clarifi cations etc. that may be issued by various regulatory authorities from time to time
4. Net worth means paid-up equity capital + reserves excluding revaluation reserve - miscellaneous expenses not written off - negative balance in profi t and loss account to the extent not set off.
5. Promoters mean one or more persons with minimum 3 years of experience of each of them in the same line of business and shall be holding at least 20 % of the post issue equity share capital individually or severally.
6. In case a company approaches the Exchange for listing within six months of an IPO, the securities may be considered as eligible for listing if they were otherwise eligible for listing at the time of the IPO. If the company approaches the Exchange for listing after six months of an IPO, the norms for existing listed companies may be applied and market capitalisation be computed based on the period from the IPO to the time of listing.
Contd.
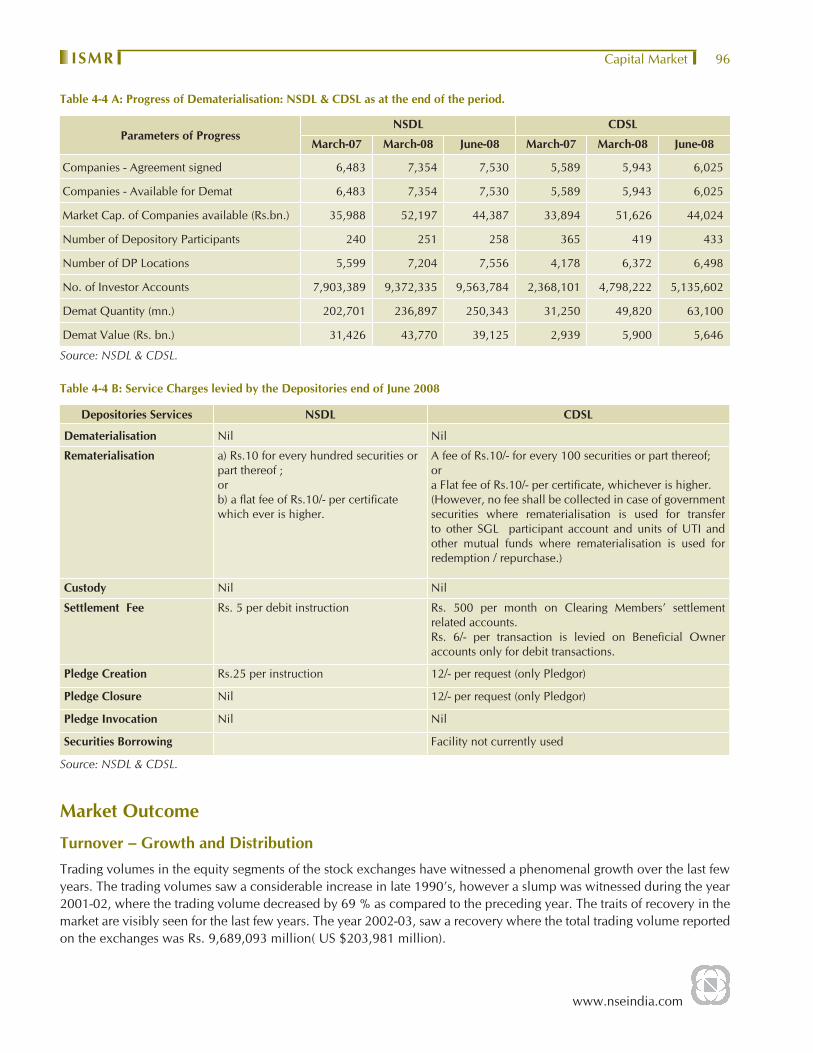
www.nseindia.com
Capital Market ISMR 96
Table 4-4 A: Progress of Dematerialisation: NSDL & CDSL as at the end of the period.
Parameters of ProgressNSDL CDSL
March-07 March-08 June-08 March-07 March-08 June-08
Companies - Agreement signed 6,483 7,354 7,530 5,589 5,943 6,025
Companies - Available for Demat 6,483 7,354 7,530 5,589 5,943 6,025
Market Cap. of Companies available (Rs.bn.) 35,988 52,197 44,387 33,894 51,626 44,024
Number of Depository Participants 240 251 258 365 419 433
Number of DP Locations 5,599 7,204 7,556 4,178 6,372 6,498
No. of Investor Accounts 7,903,389 9,372,335 9,563,784 2,368,101 4,798,222 5,135,602
Demat Quantity (mn.) 202,701 236,897 250,343 31,250 49,820 63,100
Demat Value (Rs. bn.) 31,426 43,770 39,125 2,939 5,900 5,646
Source: NSDL & CDSL.
Table 4-4 B: Service Charges levied by the Depositories end of June 2008
Depositories Services NSDL CDSL
Dematerialisation Nil Nil
Rematerialisation a) Rs.10 for every hundred securities or part thereof ;orb) a fl at fee of Rs.10/- per certifi cate which ever is higher.
A fee of Rs.10/- for every 100 securities or part thereof; ora Flat fee of Rs.10/- per certifi cate, whichever is higher. (However, no fee shall be collected in case of government securities where rematerialisation is used for transfer to other SGL participant account and units of UTI and other mutual funds where rematerialisation is used for redemption / repurchase.)
Custody Nil Nil
Settlement Fee Rs. 5 per debit instruction Rs. 500 per month on Clearing Members’ settlement related accounts.Rs. 6/- per transaction is levied on Benefi cial Owner accounts only for debit transactions.
Pledge Creation Rs.25 per instruction 12/- per request (only Pledgor)
Pledge Closure Nil 12/- per request (only Pledgor)
Pledge Invocation Nil Nil
Securities Borrowing Facility not currently used
Source: NSDL & CDSL.
Market Outcome
Turnover – Growth and Distribution
Trading volumes in the equity segments of the stock exchanges have witnessed a phenomenal growth over the last few years. The trading volumes saw a considerable increase in late 1990’s, however a slump was witnessed during the year 2001-02, where the trading volume decreased by 69 % as compared to the preceding year. The traits of recovery in the market are visibly seen for the last few years. The year 2002-03, saw a recovery where the total trading volume reported on the exchanges was Rs. 9,689,093 million( US $203,981 million).

www.nseindia.com
Capital Market ISMR97
During 2003-04, the trading volumes registered an year-on-year increase of 67 % to Rs.16,204,974 million (US $ 373, 473 million). The volumes further increased from Rs.16,668,963 million (US $ 381,005 million) in 2004-05 to Rs.23,901,030 million (US $ 535,777 million) in 2005-06. The fi scal 2006-07, also witnessed an increase in the trading volumes which amounted to Rs. 29,330,590 million (US$ 672,874 million). In percentage terms there has been a growth of 22.46 % in 2006-07 over the previous year’s volume.
The trading value of the CM segment on NSE showed year-on-year increase of 82.55 % from Rs. 19,452,865 million (US $ 446,269 million) in 2006-07 to Rs.35,510,382 million (US $ 888,426 million) during 2007-08. The volumes soared mainly during the months of October 2007 to January 2008. (Table 4-5 & Table 4-6). The daily turnover on NSE averaged around Rs.141,476 million (US$ 3,540 million) in 2007-08 and continued at the same level of Rs. 133,373 million (US $ 3,105 million) during the fi rst quarter of the fi scal 2008-09).
Table 4-5: Capital Market Market Turnover on Stock Exchanges in India
Stock Exchanges Capital Market Turnover
Share in Turnover (%)2006-07 2007-08
(Rs. mn.) (US $ million) (Rs. mn.) (US $ million) 2006-07 2007-081 NSE 19,452,865 446,269 35,510,380 888,426 67.01 69.22
2 BSE 9,561,850 219,359 15,788,570 395,011 32.94 30.77
3 Calcutta 6,940 159 0 0 0.02 0.00
4 Uttar Pradesh 7,990 183 4,750 119 0.03 0.01
5 Ahmedabad 0 0 0 0 0 0.00
6 Delhi 0 0 0 0 0 0.00
7 Pune 0 0 0 0 0 0.00
8 Ludhiana 0 0 0 0 0 0.00
9 Bangalore 0 0 0 0 0 0.00
10 ICSE 0 0 0 0 0 0.00
11 Madras 12 0.28 0 0 0.00004 0.00
12 Madhya Pradesh 0 0 0 0 0 0.00
13 Vadodara 0 0 0 0 0 0.00
14 OTCEI 0 0 0 0 0 0.00
15 Gauhati 0 0 0 0 0 0.00
16 Cochin 0 0 0 0 0 0.00
17 Bhubaneshwar 0 0 0 0 0 0.00
18 Coimbatore 0 0 0 0 0 0.00
19 Jaipur 0 0 0 0 0 0.00
Total 29,030,577 665,992 51,303,700 1,283,555 100.00 100.00
NSE and BSE, were the only two stock exchange which reported signifi cant trading volumes. With the exception of Uttar Pradesh Stock Exchange, all other stock exchanges did not report any trading volumes during 2007-08. NSE consolidated its position as the market leader by contributing about 69.22% of the total turnover in India. Since its inception in 1994, NSE has emerged as the favoured exchange among trading members. The consistent increase in popularity of NSE is clearly evident from (Annexure 4-2), which presents the business growth of CM segment of NSE. Not only in the national arena, but also in the international markets, NSE has been successful in creating a niche for
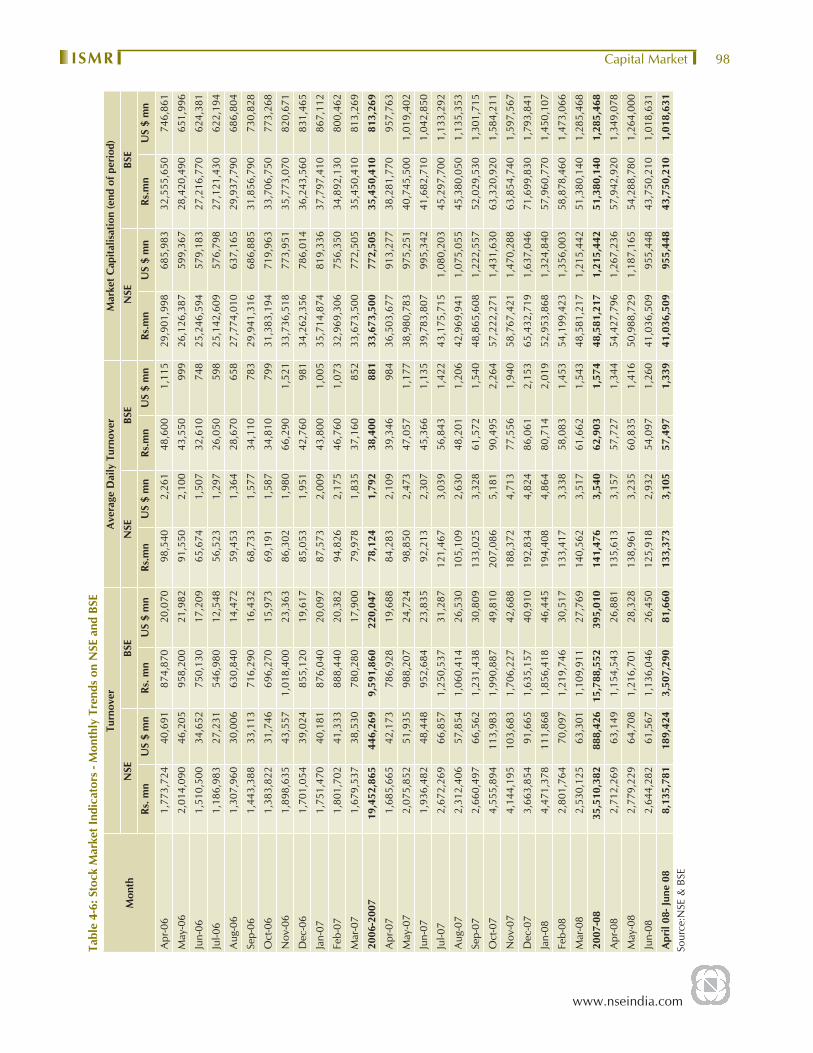
www.nseindia.com
Capital Market ISMR 98
Tabl
e 4-
6: S
tock
Mar
ket I
ndic
ator
s - M
onth
ly T
rend
s on
NSE
and
BSE
Mon
th
Turn
over
Ave
rage
Dai
ly T
urno
ver
Mar
ket C
apita
lisat
ion
(end
of p
erio
d)
NSE
BSE
NSE
BSE
NSE
BSE
Rs. m
nU
S $
mn
Rs. m
nU
S $
mn
Rs.m
nU
S $
mn
Rs.m
nU
S $
mn
Rs.m
nU
S $
mn
Rs.m
nU
S $
mn
Apr
-06
1,77
3,72
4 4
0,69
1 8
74,8
70
20,
070
98,5
40 2
,261
4
8,60
0 1
,115
2
9,90
1,99
8 6
85,9
83
32,
555,
650
746
,861
May
-06
2,01
4,09
0 4
6,20
5 9
58,2
00
21,
982
91,5
50 2
,100
4
3,55
0 9
99
26,
126,
387
599
,367
2
8,42
0,49
0 6
51,9
96
Jun-
061,
510,
500
34,
652
750
,130
1
7,20
9 65
,674
1,5
07
32,
610
748
2
5,24
6,59
4 5
79,1
83
27,
216,
770
624
,381
Jul-0
61,
186,
983
27,
231
546
,980
1
2,54
8 56
,523
1,2
97
26,
050
598
2
5,14
2,60
9 5
76,7
98
27,
121,
430
622
,194
Aug
-06
1,30
7,96
0 3
0,00
6 6
30,8
40
14,
472
59,4
53 1
,364
2
8,67
0 6
58
27,
774,
010
637
,165
2
9,93
7,79
0 6
86,8
04
Sep-
061,
443,
388
33,
113
716
,290
1
6,43
2 68
,733
1,5
77
34,
110
783
2
9,94
1,31
6 6
86,8
85
31,
856,
790
730
,828
Oct
-06
1,38
3,82
2 3
1,74
6 6
96,2
70
15,
973
69,1
91 1
,587
3
4,81
0 7
99
31,
383,
194
719
,963
3
3,70
6,75
0 7
73,2
68
Nov
-06
1,89
8,63
5 4
3,55
7 1
,018
,400
2
3,36
3 86
,302
1,9
80
66,
290
1,5
21
33,
736,
518
773
,951
3
5,77
3,07
0 8
20,6
71
Dec
-06
1,70
1,05
4 3
9,02
4 8
55,1
20
19,
617
85,0
53 1
,951
4
2,76
0 9
81
34,
262,
356
786
,014
3
6,24
3,56
0 8
31,4
65
Jan-
071,
751,
470
40,
181
876
,040
2
0,09
7 87
,573
2,0
09
43,
800
1,0
05
35,
714,
874
819
,336
3
7,79
7,41
0 8
67,1
12
Feb-
071,
801,
702
41,
333
888
,440
2
0,38
2 94
,826
2,1
75
46,
760
1,0
73
32,
969,
306
756
,350
3
4,89
2,13
0 8
00,4
62
Mar
-07
1,67
9,53
7 3
8,53
0 7
80,2
80
17,
900
79,9
78 1
,835
3
7,16
0 8
52
33,
673,
500
772
,505
3
5,45
0,41
0 8
13,2
69
2006
-200
719
,452
,865
446
,269
9
,591
,860
2
20,0
47
78,1
24 1
,792
3
8,40
0 8
81
33,
673,
500
772
,505
3
5,45
0,41
0 8
13,2
69
Apr
-07
1,6
85,6
65
42,1
7378
6,92
8 1
9,68
8 84
,283
2,1
09
39,
346
984
3
6,50
3,67
7 9
13,2
77
38,
281,
770
957
,763
May
-07
2,0
75,8
52
51,9
35 9
88,2
07
24,
724
98,8
50 2
,473
4
7,05
7 1
,177
3
8,98
0,78
3 9
75,2
51
40,
745,
500
1,0
19,4
02
Jun-
07 1
,936
,482
48
,448
952
,684
2
3,83
5 92
,213
2,3
07
45,
366
1,1
35
39,
783,
807
995
,342
4
1,68
2,71
0 1
,042
,850
Jul-0
7 2
,672
,269
66
,857
1,2
50,5
37
31,
287
121,
467
3,0
39
56,
843
1,4
22
43,
175,
715
1,0
80,2
03
45,
297,
700
1,1
33,2
92
Aug
-07
2,3
12,4
06
57,8
54 1
,060
,414
2
6,53
0 10
5,10
9 2
,630
4
8,20
1 1
,206
4
2,96
9,94
1 1
,075
,055
4
5,38
0,05
0 1
,135
,353
Sep-
07 2
,660
,497
66
,562
1,2
31,4
38
30,
809
133,
025
3,3
28
61,
572
1,5
40
48,
865,
608
1,2
22,5
57
52,
029,
530
1,3
01,7
15
Oct
-07
4,5
55,8
94
113,
983
1,9
90,8
87
49,
810
207,
086
5,1
81
90,
495
2,2
64
57,
222,
271
1,4
31,6
30
63,
320,
920
1,5
84,2
11
Nov
-07
4,1
44,1
95
103,
683
1,7
06,2
27
42,
688
188,
372
4,7
13
77,
556
1,9
40
58,
767,
421
1,4
70,2
88
63,
854,
740
1,5
97,5
67
Dec
-07
3,6
63,8
54
91,6
65 1
,635
,157
4
0,91
0 19
2,83
4 4
,824
8
6,06
1 2
,153
6
5,43
2,71
9 1
,637
,046
7
1,69
9,83
0 1
,793
,841
Jan-
08 4
,471
,378
11
1,86
8 1
,856
,418
4
6,44
5 19
4,40
8 4
,864
8
0,71
4 2
,019
5
2,95
3,86
8 1
,324
,840
5
7,96
0,77
0 1
,450
,107
Feb-
08 2
,801
,764
70
,097
1,2
19,7
46
30,
517
133,
417
3,3
38
58,
083
1,4
53
54,
199,
423
1,3
56,0
03
58,
878,
460
1,4
73,0
66
Mar
-08
2,5
30,1
25
63,3
01 1
,109
,911
2
7,76
9 14
0,56
2 3
,517
6
1,66
2 1
,543
4
8,58
1,21
7 1
,215
,442
5
1,38
0,14
0 1
,285
,468
2007
-08
35,5
10,3
8288
8,42
615
,788
,552
395,
010
141,
476
3,5
40
62,
903
1,5
74
48,
581,
217
1,2
15,4
42
51,
380,
140
1,2
85,4
68
Apr
-08
2,7
12,2
69
63,1
49 1
,154
,543
2
6,88
1 1
35,6
13
3,1
57
57,
727
1,3
44
54,
427,
796
1,2
67,2
36
57,
942,
920
1,3
49,0
78
May
-08
2,7
79,2
29
64,7
08 1
,216
,701
2
8,32
8 1
38,9
61
3,2
35
60,
835
1,4
16
50,
988,
729
1,1
87,1
65
54,
288,
780
1,2
64,0
00
Jun-
08 2
,644
,282
61
,567
1,1
36,0
46
26,
450
125
,918
2
,932
5
4,09
7 1
,260
4
1,03
6,50
9 9
55,4
48
43,
750,
210
1,0
18,6
31
Apr
il 08
- Jun
e 08
8,1
35,7
81
189,
424
3,50
7,29
081
,660
133
,373
3
,105
5
7,49
7 1
,339
4
1,03
6,50
9 9
55,4
48
43,
750,
210
1,0
18,6
31
Sour
ce:N
SE &
BSE
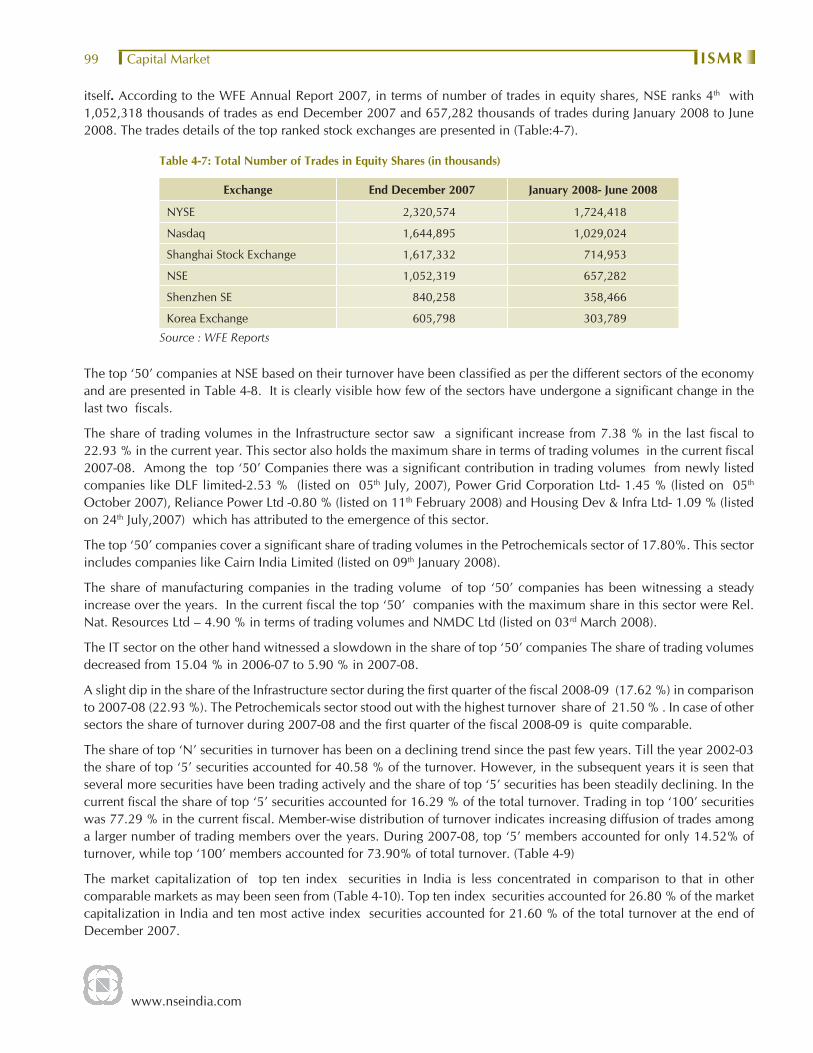
www.nseindia.com
Capital Market ISMR99
itself. According to the WFE Annual Report 2007, in terms of number of trades in equity shares, NSE ranks 4th with 1,052,318 thousands of trades as end December 2007 and 657,282 thousands of trades during January 2008 to June 2008. The trades details of the top ranked stock exchanges are presented in (Table:4-7).
Table 4-7: Total Number of Trades in Equity Shares (in thousands)
Exchange End December 2007 January 2008- June 2008
NYSE 2,320,574 1,724,418
Nasdaq 1,644,895 1,029,024
Shanghai Stock Exchange 1,617,332 714,953
NSE 1,052,319 657,282
Shenzhen SE 840,258 358,466
Korea Exchange 605,798 303,789
Source : WFE Reports
The top ‘50’ companies at NSE based on their turnover have been classifi ed as per the different sectors of the economy and are presented in Table 4-8. It is clearly visible how few of the sectors have undergone a signifi cant change in the last two fi scals.
The share of trading volumes in the Infrastructure sector saw a signifi cant increase from 7.38 % in the last fi scal to 22.93 % in the current year. This sector also holds the maximum share in terms of trading volumes in the current fi scal 2007-08. Among the top ‘50’ Companies there was a signifi cant contribution in trading volumes from newly listed companies like DLF limited-2.53 % (listed on 05th July, 2007), Power Grid Corporation Ltd- 1.45 % (listed on 05th October 2007), Reliance Power Ltd -0.80 % (listed on 11th February 2008) and Housing Dev & Infra Ltd- 1.09 % (listed on 24th July,2007) which has attributed to the emergence of this sector.
The top ‘50’ companies cover a signifi cant share of trading volumes in the Petrochemicals sector of 17.80%. This sector includes companies like Cairn India Limited (listed on 09th January 2008).
The share of manufacturing companies in the trading volume of top ‘50’ companies has been witnessing a steady increase over the years. In the current fi scal the top ‘50’ companies with the maximum share in this sector were Rel. Nat. Resources Ltd – 4.90 % in terms of trading volumes and NMDC Ltd (listed on 03rd March 2008).
The IT sector on the other hand witnessed a slowdown in the share of top ‘50’ companies The share of trading volumes decreased from 15.04 % in 2006-07 to 5.90 % in 2007-08.
A slight dip in the share of the Infrastructure sector during the fi rst quarter of the fi scal 2008-09 (17.62 %) in comparison to 2007-08 (22.93 %). The Petrochemicals sector stood out with the highest turnover share of 21.50 % . In case of other sectors the share of turnover during 2007-08 and the fi rst quarter of the fi scal 2008-09 is quite comparable.
The share of top ‘N’ securities in turnover has been on a declining trend since the past few years. Till the year 2002-03 the share of top ‘5’ securities accounted for 40.58 % of the turnover. However, in the subsequent years it is seen that several more securities have been trading actively and the share of top ‘5’ securities has been steadily declining. In the current fi scal the share of top ‘5’ securities accounted for 16.29 % of the total turnover. Trading in top ‘100’ securities was 77.29 % in the current fi scal. Member-wise distribution of turnover indicates increasing diffusion of trades among a larger number of trading members over the years. During 2007-08, top ‘5’ members accounted for only 14.52% of turnover, while top ‘100’ members accounted for 73.90% of total turnover. (Table 4-9)
The market capitalization of top ten index securities in India is less concentrated in comparison to that in other comparable markets as may been seen from (Table 4-10). Top ten index securities accounted for 26.80 % of the market capitalization in India and ten most active index securities accounted for 21.60 % of the total turnover at the end of December 2007.

www.nseindia.com
Capital Market ISMR 100
Tabl
e 4-
8: In
dust
ry W
ise
Dis
trib
utio
n of
Tur
nove
r an
d M
arke
t Cap
italis
atio
n of
Top
‘50’
Com
pani
es li
sted
at N
SE
Sect
or
Trad
ing
Val
ue (A
mou
nt)
Trad
ing
Val
ue
(% to
Tot
al ‘T
op 5
0 C
o’s)
Mar
ket C
apita
lisat
ion
(Am
ount
)M
arke
t Cap
italis
atio
n(%
to T
otal
‘Top
50
Co’
s)
200
6-07
2007
-08
Apr
il- 0
8- Ju
ne 0
820
06-0
720
07-0
8Ap
ril- 0
8-Ju
ne 0
820
06-0
720
07-0
8A
pril-
08-
June
08
2006
-07
2007
-08
Apr
il-08
- Ju
ne
08(R
s.m
n.)
(US
$ m
n.)
(Rs.
mn.
)(U
S $
mn.
)(R
s.m
n.)
(US
$ m
n.)
(Rs.
mn.
)(U
S $
mn.
)(R
s.m
n.)
(US
$ m
n.)
(Rs.
mn.
)(U
S $
mn.
)
Bank
s 7
24,3
31
16,
617
2,0
41,8
20
51,
084
494
,161
1
1,50
6 6.
019.
358.
59 2
,032
,839
4
6,63
5 2
,835
,871
7
0,95
0 1
,981
,052
4
6,12
5 9.
238.
967.
46
Fina
ncia
l Se
rvic
es 8
63,1
58
19,
802
2,5
45,2
35
63,
679
622
,179
1
4,48
6 7.
1611
.66
10.8
2 5
31,2
02
12,
186
977
,431
2
4,45
4 7
80,2
00
18,
165
2.41
3.09
2.94
Engi
neer
ing
259
,087
5
,944
6
68,1
20
16,
716
199
,883
4
,654
2.
153.
063.
48 4
54,7
10
10,
432
887
,017
2
2,19
2 6
38,8
19
14,
874
2.07
2.80
2.40
FMC
G(F
ast M
ovin
g C
onsu
mer
G
oods
)
450
,126
1
0,32
6 2
66,9
98
6,6
80
62,
655
1,4
59
3.74
1.22
1.09
1,0
21,5
02
23,
434
1,2
75,3
24
31,
907
1,1
58,9
75
26,
984
4.64
4.03
4.36
Infra
stru
ctur
e 8
89,4
92
20,
406
5,0
04,5
77
125
,208
1
,012
,840
2
3,58
2 7.
3822
.93
17.6
2 1
,553
,369
3
5,63
6 5
,392
,609
1
34,9
16
3,6
29,0
58
84,
495
7.06
17.0
513
.66
Info
rmat
ion
Tech
nolo
gy 1
,812
,571
4
1,58
2 1
,287
,940
3
2,22
3 4
18,5
04
9,7
44
15.0
45.
907.
28 3
,992
,494
9
1,59
2 2
,513
,882
6
2,89
4 2
,938
,573
6
8,41
8 18
.14
7.95
11.0
6
Man
ufac
turin
g 4
,071
,678
9
3,40
9 4
,304
,842
1
07,7
02
1,0
36,9
79
24,
144
33.7
919
.72
18.0
3 4
,536
,595
10
4,07
4 7
,119
,800
1
78,1
29
5,5
47,4
35
129,
160
20.6
122
.51
20.8
8
Petro
chem
ical
s 1
,643
,242
3
7,69
8 3
,886
,460
9
7,23
4 1
,235
,963
2
8,77
7 13
.64
17.8
021
.50
4,8
17,2
30
110,
512
7,2
56,6
91
181
,553
6
,680
,052
15
5,53
1 21
.88
22.9
425
.14
Phar
mac
eutic
als
237
,173
5
,441
-
- 2
15,1
68
5,0
10
1.97
---
3.74
518
,650
1
1,89
8 2
54,6
19
6,3
70
485
,382
1
1,30
1 2.
360.
801.
83
Serv
ices
- -
- -
- -
- -
- -
- 2
31,8
93
5,8
02
197
,995
4
,610
-
0.73
0.75
Tele
com
mun
i-ca
tions
923
,796
2
1,19
3 1
,821
,924
4
5,58
2 4
01,0
58
9,3
38
7.67
8.35
6.98
2,5
54,1
17
58,
594
2,8
90,8
03
72,
324
2,5
29,0
41
58,
883
11.6
09.
149.
52
Med
ia &
En
terta
inm
ent
175
,352
4
,023
-
- 5
0,45
8 1
,175
1.
460.
000.
88 -
- -
- -
- -
- -
Tota
l12
,050
,008
2
76,4
40
21,8
27,9
16
546
,107
5,
749,
848
133
,873
1
00.0
0 10
0.00
10
0.00
22,
012,
708
504
,994
31,
635,
939
791
,492
26
,566
,582
61
8,54
7 10
0.00
100.
0010
0.00
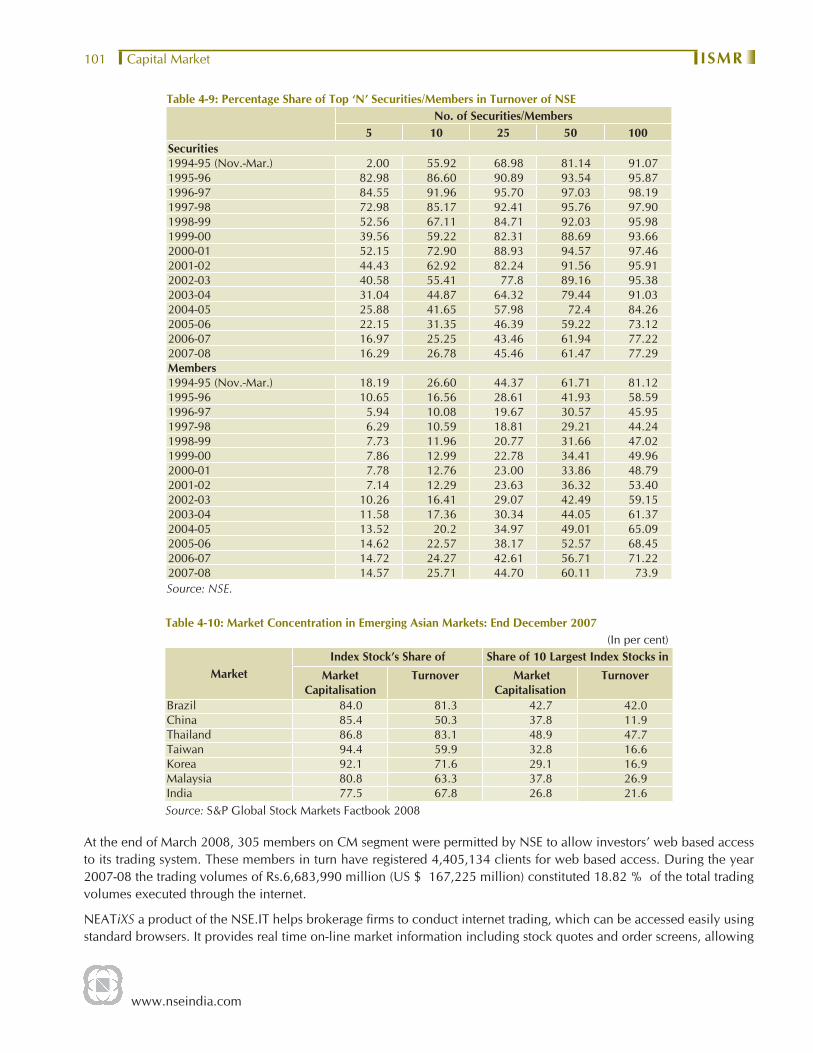
www.nseindia.com
Capital Market ISMR101
Table 4-9: Percentage Share of Top ‘N’ Securities/Members in Turnover of NSENo. of Securities/Members
5 10 25 50 100Securities1994-95 (Nov.-Mar.) 2.00 55.92 68.98 81.14 91.071995-96 82.98 86.60 90.89 93.54 95.871996-97 84.55 91.96 95.70 97.03 98.191997-98 72.98 85.17 92.41 95.76 97.901998-99 52.56 67.11 84.71 92.03 95.981999-00 39.56 59.22 82.31 88.69 93.662000-01 52.15 72.90 88.93 94.57 97.462001-02 44.43 62.92 82.24 91.56 95.912002-03 40.58 55.41 77.8 89.16 95.382003-04 31.04 44.87 64.32 79.44 91.032004-05 25.88 41.65 57.98 72.4 84.262005-06 22.15 31.35 46.39 59.22 73.122006-07 16.97 25.25 43.46 61.94 77.222007-08 16.29 26.78 45.46 61.47 77.29Members1994-95 (Nov.-Mar.) 18.19 26.60 44.37 61.71 81.121995-96 10.65 16.56 28.61 41.93 58.591996-97 5.94 10.08 19.67 30.57 45.951997-98 6.29 10.59 18.81 29.21 44.241998-99 7.73 11.96 20.77 31.66 47.021999-00 7.86 12.99 22.78 34.41 49.962000-01 7.78 12.76 23.00 33.86 48.792001-02 7.14 12.29 23.63 36.32 53.402002-03 10.26 16.41 29.07 42.49 59.152003-04 11.58 17.36 30.34 44.05 61.372004-05 13.52 20.2 34.97 49.01 65.092005-06 14.62 22.57 38.17 52.57 68.452006-07 14.72 24.27 42.61 56.71 71.222007-08 14.57 25.71 44.70 60.11 73.9Source: NSE.
Table 4-10: Market Concentration in Emerging Asian Markets: End December 2007(In per cent)
MarketIndex Stock’s Share of Share of 10 Largest Index Stocks in
Market Capitalisation
Turnover Market Capitalisation
Turnover
Brazil 84.0 81.3 42.7 42.0China 85.4 50.3 37.8 11.9Thailand 86.8 83.1 48.9 47.7Taiwan 94.4 59.9 32.8 16.6Korea 92.1 71.6 29.1 16.9Malaysia 80.8 63.3 37.8 26.9India 77.5 67.8 26.8 21.6Source: S&P Global Stock Markets Factbook 2008
At the end of March 2008, 305 members on CM segment were permitted by NSE to allow investors’ web based access to its trading system. These members in turn have registered 4,405,134 clients for web based access. During the year 2007-08 the trading volumes of Rs.6,683,990 million (US $ 167,225 million) constituted 18.82 % of the total trading volumes executed through the internet.
NEATiXS a product of the NSE.IT helps brokerage fi rms to conduct internet trading, which can be accessed easily using standard browsers. It provides real time on-line market information including stock quotes and order screens, allowing

www.nseindia.com
Capital Market ISMR 102
investors to place orders from their personal computers. The success of internet trading in India, however, will depend on expansion of internet bandwidth, which is necessary for faster execution of trades.
World Traded Value
In 2007, United States ranked fi rst with the total traded value of US $ 42,613,206 million. United Kingdom ranked second with the traded value of US $ 10,324,477 million followed by China belonging to the emerging markets at US $ 7,791,702 million of traded value. Among the fi rst 40 countries ranked according to total traded value, 22 countries belonged to the developed markets while 18 belonged to the emerging markets. India ranked 15th with a trading volume of US $ 1,107,550 million (Table 4-11).
Table 4-11: Top 40 countries World Value Traded, 2007
Rank CountryTotal Value Traded
(US $ millions)1 United States 42,613,206 2 United Kingdom 10,324,477 3 China 7,791,702 4 Japan 6,497,193 5 France 3,418,890 6 Germany 3,363,093 7 Spain 2,962,122 8 Italy 2,313,483 9 Korea 1,974,015
10 Netherlands 1,803,445 11 Switzerland 1,777,801 12 Canada 1,645,469 13 Australia 1,322,822 14 Taiwan 1,272,432 15 India 1,107,550 16 Sweden 968,832 17 Hongkong 916,884 18 Russia 754,537 19 Saudi Arabia 679,837 20 Brazil 584,951 21 Finland 543,344 22 Norway 471,885 23 South Africa 425,747 24 Singapore 384,227 25 Turkey 302,402 26 Belgium 255,694 27 Denmark 242,170 28 Greece 151,534 29 United Arab Emirates 150,339 30 Malaysia 150,002 31 Portugal 144,480 32 Ireland 136,618 33 Austria 121,422 34 Kuwait 120,704 36 Mexico 115,617 35 Israel 113,459 37 Indonesia 112,851 38 Thailand 108,210 39 Pakistan 100,452 40 Poland 84,568
Source:S&P Global Stock Markets Factbook 2008Emerging marketsDeveloped markets

www.nseindia.com
Capital Market ISMR103
The BRIC (Brazil, Russia, India, China) economies posted a signigicant year-on-year increase of 236.53 % in the trading value from US $ 3,042,480 million in 2006 to US $ 10,238,740 million in 2007 (Table:4-12). China witnessed a phenomenal growth of 376.52 % in total BRIC turnover followed by Brazil - 129.83 % during 2007. The share of BRIC Economies in total traded value of emerging economies witnessed a huge increase from 36.98 % in 2006 to 62.58 % in 2007. The contribution of BRIC Economies in total world market turnover as well increased to 10.36% in 2007 from 4.51% in 2006.
Table 4-12: Turnover of BRIC Economies
CountryTraded Value (in US $ millions) YoY Percentage
Change December-06 December-07
Brazil 254,513 584,951 129.83
Russia 514,362 754,537 46.69
India 638,484 1,107,550 73.47
China 1,635,121 7,791,702 376.52
BRIC Economies 3,042,480 10,238,740 236.53
Emerging Market Economies 8,226,944 16,361,131 98.87
World Total 67,485,359 98,816,305 46.43
Percentage share of BRIC Economies to
1) Total turnover of Emerging Economies 36.98 62.58
2) Total turnover of World 4.51 10.36
Source:S&P Global Stock Markets Factbook 2008
Market Capitalisation - Growth and Distribution
The market capitalisation for securities available for trading on the equity segment of NSE and BSE witnessed enormous growth over the previous years (Table 4-6). The market capitalisation of NSE and BSE as at end March 2008 amounted to Rs. 48,581,217 million (US $ 1,215,442 million) and Rs. 51,380,140 million (US $ 1,285,468 million) respectively.
The sectoral distribution of top ‘50’ companies based on their market capitalization and trading volumes on NSE is presented in (Table 4-8). A similar trend is noticed in few of the sectors classifi ed on basis of market capitalization when compared to the trading volumes. For eg. The Infrastructure sector saw a high growth where the share of market capitalization increased from 7.06 % in 2006-07 to 17.05 % in 2007-08 while the IT sector witnessed a fall in the market capitalization form 18.14 % in 2006-07 to 7.95 % in the current year.
During the year 2007-08. The petrochemicals sector was the most dominant sector in terms of market capitalization and reported a signifi cant share of 22.94 % followed by the manufacturing sector with its share of 22.51 %. During the fi rst quarter of the fi scal 2008-09 the petrochemicals sector sustained it dominance with the highest share of 25.14 %. Once again followed by the manufacturing sector – 20.88%. On the other hand the Infrastructure sector saw a slight decrease, its share dropped to 13.66 %. The share of the IT Sector rose to 11.06 % .
World Market Capitalisation
In 2007, United States reported the highest market capitalisation of US $ 19,947,284 million followed by China at US$ 6,226,305 million and Japan at US $4,453,475 million. Among the top 20 countries by Market Capitalisation, 22 were from the developed markets while the other 18 were from the emerging market economies. India ranked 8th in the world with the market capitalization of US $ 1,819,101 million. (Table 4-13).

www.nseindia.com
Capital Market ISMR 104
Table 4-13: Market Capitalisation of top 40 countries
Rank Country End December 2007Market capitalisation (US$ million)
1 United States 19,947,284 2 China 6,226,305 3 Japan 4,453,475 4 United Kingdom 3,851,706 5 France 2,771,217 6 Canada 2,186,550 7 Germany 2,105,506 8 India 1,819,101 9 Spain 1,800,097
10 Russia 1,503,011 11 Brazil 1,370,377 12 Australia 1,298,429 13 Swizerland 1,274,516 14 Hong Kong 1,162,566 15 Korea 1,123,633 16 Italy 1,072,692 17 Netherlands 956,469 18 South Africa 833,548 19 Taiwan 723,687 20 Sweden 612,497 21 Saudi Arabia 515,111 22 Mexico 397,725 23 Belgium 386,362 24 Finland 369,168 25 Norway 357,420 26 Singapore 353,489 27 Malaysia 325,663 28 Turkey 286,572 29 Denmark 277,746 30 Greece 264,942 31 Israel 236,361 32 Austria 228,707 33 United Arab Emirates 224,675 34 Chile 212,910 35 Indonesia 211,693 36 Poland 207,322 37 Thailand 196,046 38 Kuwait 188,046 39 Luxembourg 166,102 40 Ireland 144,026
Source:S&P Fact Book 2008Emerging marketsDeveloped markets
Among the BRIC Economies, the highest market capitalisation at the end of 2007 was recorded by China at US$ 6,226,305 million, followed by India at US$ 1,819,101 million. China recorded the highest year-on-year increase of 156.61 % in its market capitalization. (Table 4-14). The BRIC Economies contributed a share of 59.79 % of the market capitalization of the emerging economies during 2007. The contribution of BRIC Economies in total world market capitalisation too augmented from 9.39 % in 2006 to 16.91 % in 2007.

www.nseindia.com
Capital Market ISMR105
Table 4-14: Market capitalisation of BRIC Economies
CountryMarket Capilisation (in US $ Millions) YoY Percentage
Change December-06 December-07
China 2,426,326 6,226,305 156.61 India 818,879 1,819,101 122.15 Russia 1,057,189 1,503,011 42.17 Brazil 711,100 1,370,377 92.71 BRIC Economies 5,013,494 10,918,794 117.79 Emerging Market Economies 10,458,582 18,262,550 74.62 World Total 53,375,287 64,563,414 20.96 Percentage share of BRIC Economies to1) Total Market capitalisationof Emerging Economies 47.94 59.792) Total Market Capitalisation of World 9.39 16.91
Source:S&P Global Stock Markets Factbook 2008
Market Movements
The movement of few of the selected indices placed in table 4-15 clearly brings about the trends witnessed in the Indian and foreign markets. A global comparison of these selected indices during the year 2007-08 with the last fi scal 2006-07 shows a varied kind of performance. The American and Europe markets witnessed a drop in their index levels. The point to point return of NASDAQ was -5.89 %. Similarly, the returns on Dow Jones, FTSE 100 and CAC indices dropped down to -0.74 %, -9.61 % and -16.45 % respectively. On the other hand during the same period index levels of Nifty 50, Sensex, Hang Seng and TAI posted positive point to point returns. Nifty 50 saw the highest point to point return of 23.89%. However the market in Japan - Nikkei index posted a negative return of -27-55 %.
Table 4-15: Movement of Select Indices on Indian & Foreign Markets
Region Index - Country 31.03.2006 30.03.2007 31.03.2008 30.06.2008
Change during
2006-07 (%)
Change during
2007-08 (%)
Change during
March 08-June 08
(%)
Am
eric
as Dow Jones 11109.32 12354.35 12262.89 11350.01 11.21 -0.74 -7.44
Nasdaq 2339.79 2421.64 2279.10 2292.98 3.50 -5.89 0.61
Euro
pe FTSE 100- UK 5964.60 6308.00 5702.10 5625.90 5.76 -9.61 -1.34
CAC- France 5220.85 5634.16 4707.07 4434.85 7.92 -16.45 -5.78
Asi
a Pa
cifi c
Nifty 50 (S&P CNX Nifty)- India
3402.55 3821.55 4734.50 4040.55 12.31 23.89 -14.66
BSE Sensex- India 11280.00 13072.10 15644.44 13461.60 15.89 19.68 -13.95
Hang Seng- Hong Kong (China)
15805.04 19800.93 22849.20 22102.01 25.28 15.39 -3.27
Nikkei- Japan 17059.66 17287.65 12525.54 13481.38 1.34 -27.55 7.63
TAI- Taiwan 6613.97 7884.41 8572.59 7523.54 19.21 8.73 -12.24
Source: NSE, BSE & Bloomberg.
The fi rst quarter of the fi scal 2008-09, shows a downbeat in the index levels of most of the indices. The Nikkei and the NASDAQ were the two indices which stirred up and yielded a point to point return of 7.63 % and 0.61 % respectively.

www.nseindia.com
Capital Market ISMR 106
Chart 4-1: Movement of Nifty, Sensex and NASDAQ, 2007-08
Chart 4-2: Stock Market Returns
Volatility
The volatility of S&P CNX Nifty (Nifty 50) and Sensex since April 2007 is presented in (Table 4-16). The stock markets witnessed maximum volatility during the period January 2008 to March 2008, where the volatility of S&P CNX Nifty (Nifty 50) was 3.29% in January 2008 and the volatility of Sensex 3.21 % in March 2008. The volatility was the lowest at the start of the fi nancial 2007-08. The volatility for S&P CNX Nifty and Sensex was 0.85 % and 0.80 % respectively in May 2008. Volatility of S&P CNX Nifty (Nifty 50), Sensex and NASDAQ is also plotted in (Chart 4-3). It can be observed that the S&P CNX Nifty and (Nifty 50) and Sensex indices were extremely volatile in comparison to the NASDAQ Composite for most of the months.
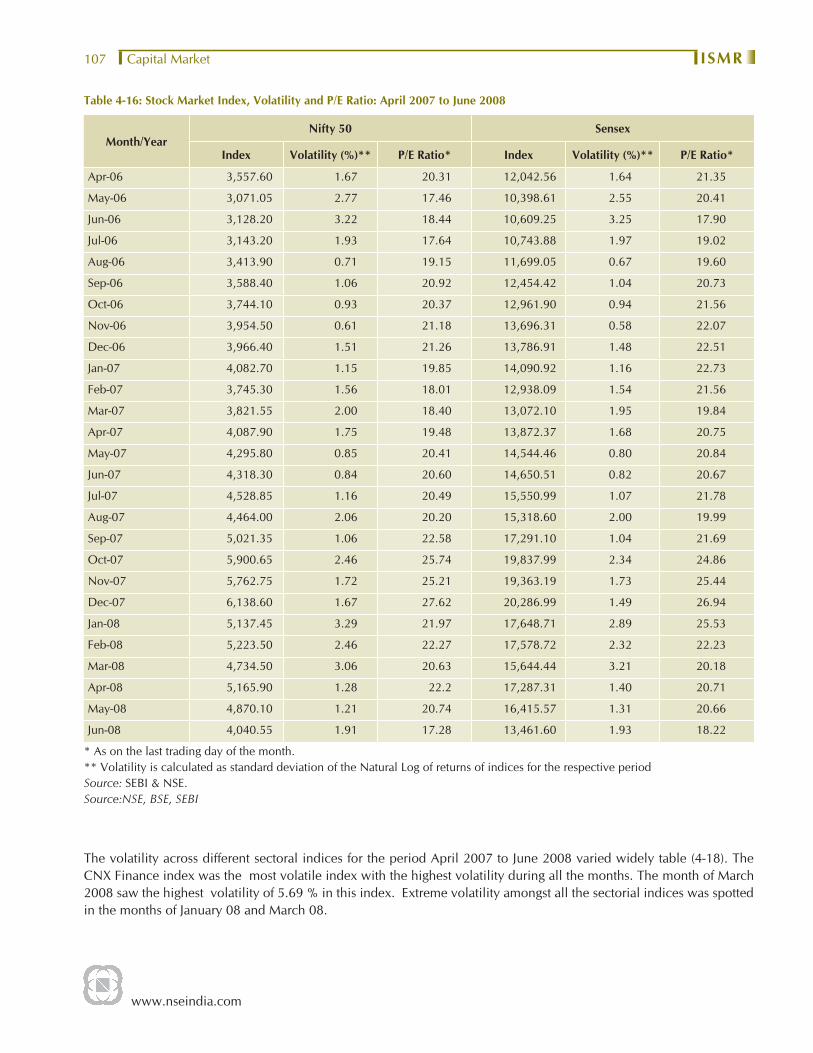
www.nseindia.com
Capital Market ISMR107
Table 4-16: Stock Market Index, Volatility and P/E Ratio: April 2007 to June 2008
Month/YearNifty 50 Sensex
Index Volatility (%)** P/E Ratio* Index Volatility (%)** P/E Ratio*
Apr-06 3,557.60 1.67 20.31 12,042.56 1.64 21.35
May-06 3,071.05 2.77 17.46 10,398.61 2.55 20.41
Jun-06 3,128.20 3.22 18.44 10,609.25 3.25 17.90
Jul-06 3,143.20 1.93 17.64 10,743.88 1.97 19.02
Aug-06 3,413.90 0.71 19.15 11,699.05 0.67 19.60
Sep-06 3,588.40 1.06 20.92 12,454.42 1.04 20.73
Oct-06 3,744.10 0.93 20.37 12,961.90 0.94 21.56
Nov-06 3,954.50 0.61 21.18 13,696.31 0.58 22.07
Dec-06 3,966.40 1.51 21.26 13,786.91 1.48 22.51
Jan-07 4,082.70 1.15 19.85 14,090.92 1.16 22.73
Feb-07 3,745.30 1.56 18.01 12,938.09 1.54 21.56
Mar-07 3,821.55 2.00 18.40 13,072.10 1.95 19.84
Apr-07 4,087.90 1.75 19.48 13,872.37 1.68 20.75
May-07 4,295.80 0.85 20.41 14,544.46 0.80 20.84
Jun-07 4,318.30 0.84 20.60 14,650.51 0.82 20.67
Jul-07 4,528.85 1.16 20.49 15,550.99 1.07 21.78
Aug-07 4,464.00 2.06 20.20 15,318.60 2.00 19.99
Sep-07 5,021.35 1.06 22.58 17,291.10 1.04 21.69
Oct-07 5,900.65 2.46 25.74 19,837.99 2.34 24.86
Nov-07 5,762.75 1.72 25.21 19,363.19 1.73 25.44
Dec-07 6,138.60 1.67 27.62 20,286.99 1.49 26.94
Jan-08 5,137.45 3.29 21.97 17,648.71 2.89 25.53
Feb-08 5,223.50 2.46 22.27 17,578.72 2.32 22.23
Mar-08 4,734.50 3.06 20.63 15,644.44 3.21 20.18
Apr-08 5,165.90 1.28 22.2 17,287.31 1.40 20.71
May-08 4,870.10 1.21 20.74 16,415.57 1.31 20.66
Jun-08 4,040.55 1.91 17.28 13,461.60 1.93 18.22
* As on the last trading day of the month.** Volatility is calculated as standard deviation of the Natural Log of returns of indices for the respective periodSource: SEBI & NSE.Source:NSE, BSE, SEBI
The volatility across different sectoral indices for the period April 2007 to June 2008 varied widely table (4-18). The CNX Finance index was the most volatile index with the highest volatility during all the months. The month of March 2008 saw the highest volatility of 5.69 % in this index. Extreme volatility amongst all the sectorial indices was spotted in the months of January 08 and March 08.

www.nseindia.com
Capital Market ISMR 108
Chart 4-3: Stock Market Volatility, April 2007- June 2008
Returns in Indian Market
The performance of Nifty 50 and various other indices as at the end of March 2008 and June 2008 of the last one month to 12 months is presented in (Table 4-17). It reveals that almost all the indices have underperformed with varying degrees over varying periods. As at the end of March 2008 all the indices gave negative returns for the shorter periods of 1 month, 3 months and longer periods of 6 months. For the 1 year period all the indices gave encouraging returns with the exception of CNX IT Index.
Table 4-17: Performance of Select Indices - NSE
As at end March 2008- In per cent
1 month 3 month 6 month 1 year
S&P CNX Nifty -9.36 -22.87 -5.71 23.89
S&P CNX 500 -12.27 -28.55 -8.66 21.64
S&P CNX Defty -9.33 -23.96 -6.25 35.01
CNX Nifty junior -17.23 -36.13 -18.79 15.96
CNX Midcap -13.87 -32.17 -9.12 28.67
CNX IT Index -7.02 -23.02 -22.88 -28.49
S&P CNX Banks -22.98 -32.32 -17.45 25.96
As at end June 2008- In per cent
1 month 3 month 6 month 1 year
S&P CNX Nifty -17.03 -14.66 -34.18 -6.43
S&P CNX 500 -19.1 -16.27 -40.18 -11.65
S&P CNX Defty -17.93 -20.64 -39.66 -11.27
CNX Nifty junior -24.18 -21.85 -50.09 -28.35
CNX Midcap -20.17 -16.05 -43.06 -12.35
CNX IT Index -14.69 7.95 -16.9 -22.97
S&P CNX Banks -23.85 -24.63 -48.99 -25.05

www.nseindia.com
Capital Market ISMR109
On the other hand the performance of all the indices of the last 1 month to 12 month as at the end of June 2008 was remarkably poor. The CNX IT Index was only index which gave a positive return of 7.95 % for the 3 month period. All the rest of the indices underperformed with negative returns.
The comparative performance of fi ve major sectoral indices, viz. S&P CNX Petrochemicals Index, S&P CNX Finance Index, CNX FMCG Index, S&P CNX Pharma Index, and CNX IT Index, with that of Nifty 50 Index for the period April 2007-June 2008 is presented in (Chart 4-4). During the fi nancial 2007-08 the CNX Finance Index was the best performer and scored above all the indices through out the period succeeded by the Petrochemicals Index. However a revisal of positions took place in the fi rst quarter of the fi scal 2008-09. The Petrochemicals index scaled above the Finance index and stood at the fi rst position. seconded by the Finance index.
Chart 4-4: Movement of Nifty 50 and Sectoral Indices, April 2007-June 2008
The other three indices - CNX IT, CNX FMCG and Pharmaceuticals scored below the Nifty-50 almost throughout the fi scal 2007-08. During the fi rst quarter of the fi scal 2008-09 the Pharmaceuticlas showed some momentum however could not sustain itself for a longer time and ended below the Nifty. The FMCG index emerged out in the last month of the quarter and scored above the Nifty. The CNX IT was worst performing index . The monthly closing prices of these sectoral indices are presented in (Table 4-18).
Table 4-18: Performance of Sectoral Indices
Month/ Year
Monthly Closing Prices Average Daily Volatility (%)S&P CNX Nifty (Nif-
ty 50)
S&P CNX FMCG
S&P CNX IT
Finance S&P CNX Petro-
chemicals
S&P CNX Pharma-ceuticals
S&P CNX Nifty
(Nifty 50)
S&P CNX
FMCG
S&P CNX IT
Finance S&P CNX
Petro-chemi-
cals
S&P CNX Phar-
maceu-ticals
Apr-07 4087.90 4825.77 5418.40 3177.92 3635.68 4504.06 1.75 1.53 1.9 2.12 1.49 1.24
May-07 4295.80 5135.35 5218.35 3859.85 3993.94 4722.32 0.85 0.96 0.96 1.80 1.11 0.73
Jun-07 4318.30 4960.32 5192.30 4285.56 3940.59 4720.28 0.84 0.74 0.82 1.35 1.00 0.69
Jul-07 4528.85 5337.74 5086.70 4548.29 4209.92 4544.89 1.16 1.24 1.36 1.94 1.42 0.85
Contd.

www.nseindia.com
Capital Market ISMR 110
Month/ Year
Monthly Closing Prices Average Daily Volatility (%)S&P CNX Nifty (Nif-
ty 50)
S&P CNX FMCG
S&P CNX IT
Finance S&P CNX Petro-
chemicals
S&P CNX Pharma-ceuticals
S&P CNX Nifty
(Nifty 50)
S&P CNX
FMCG
S&P CNX IT
Finance S&P CNX
Petro-chemi-
cals
S&P CNX Phar-
maceu-ticals
Aug-07 4464.00 5291.81 4813.20 4402.57 4310.15 4355.23 2.06 1.64 1.88 3.24 2.08 1.37
Sep-07 5021.35 5756.72 4804.20 5406.37 5088.99 4570.70 1.06 0.89 1.49 1.86 1.26 0.79
Oct-07 5900.65 5636.75 4793.65 6634.62 5542.01 4756.21 2.46 1.70 1.69 4.41 2.62 1.30
Nov-07 5762.75 5830.23 4431.15 7492.02 6048.49 4585.66 1.72 1.89 1.82 2.77 2.12 1.06
Dec-07 6138.60 6329.60 4812.60 8907.97 7526.89 5244.88 1.67 1.11 1.91 2.32 2.14 1.37
Jan-08 5137.45 5674.00 3838.15 6965.67 5999.40 4295.48 3.29 3.41 2.77 5.10 4.86 2.92
Feb-08 5223.50 5881.53 3984.50 6579.58 5414.53 4670.76 2.46 2.20 2.71 3.34 2.64 1.52
Mar-08 4734.50 5817.72 3704.95 4715.80 4664.27 4549.10 3.06 1.82 3.46 5.69 3.70 1.96
Apr-08 5165.90 6228.03 4357.65 5500.64 6333.56 5113.00 1.28 1.34 2.50 1.73 2.90 -0.95
May-08 4870.10 6091.79 4688.35 4653.99 5778.76 5213.16 1.21 1.42 1.66 2.00 2.37 0.93
Jun-08 4040.55 5202.74 3999.40 3643.40 4163.30 4957.40 1.91 1.48 2.24 2.76 3.35 1.36
* * Volatility is calculated as standard deviation of the Natural Log of returns of indices for the respective periodSource: IISL.
Exchange Traded Funds
The fi rst ETF in India, the “Nifty BeEs (Nifty Benchmark Exchange Traded Scheme) based on Nifty 50 was launched in December 2001 by Benchmark Mutual Fund. It is bought and sold like any other stock on NSE and has all characteristics of an index fund. As of June end 2008, there were 13 ETFs listed on NSE. The ETF based on Sensex is SPICE (Sensex Prudential ICICI Exchange Traded Fund) which was launched by -Prudential ICICI. During the period April 2007 to June 2008 the total trading volume of the 13 ETFs listed on NSE was Rs. 29,761 million. (US $ 726.12 million). Details about ETFs are available in Chapter 3.
Liquidity
Many listed securities on stock exchanges are not traded actively. The percentage of companies traded on BSE is was quite low in comparison to that on NSE. In June 2008 only 34.93% of companies traded on BSE while 99.52 % of companies traded on NSE. (Table 4-19).
Table 4-19: Trading Frequency on NSE & BSE
Month/Year
NSE BSECompanies
Available for Trading*
Companies Traded
% of Traded to Available for
Trading
Listed Securities *
Traded Securities
% of Traded to Listed Securities
Apr-06 944 935 99.05 7,336 2,425 33.06
May-06 952 943 99.05 7,408 2,460 33.21
Jun-06 962 950 98.75 7490 2459 32.83
Jul-06 956 950 99.37 7,466 2,500 33.49
Aug-06 958 949 99.06 7,407 2,590 34.97
Sep-06 969 968 99.90 7,505 2,567 34.20
Oct-06 981 973 99.18 7,484 2,575 34.41
Nov-06 991 982 99.09 7,412 2,620 35.35
Contd.
Contd.
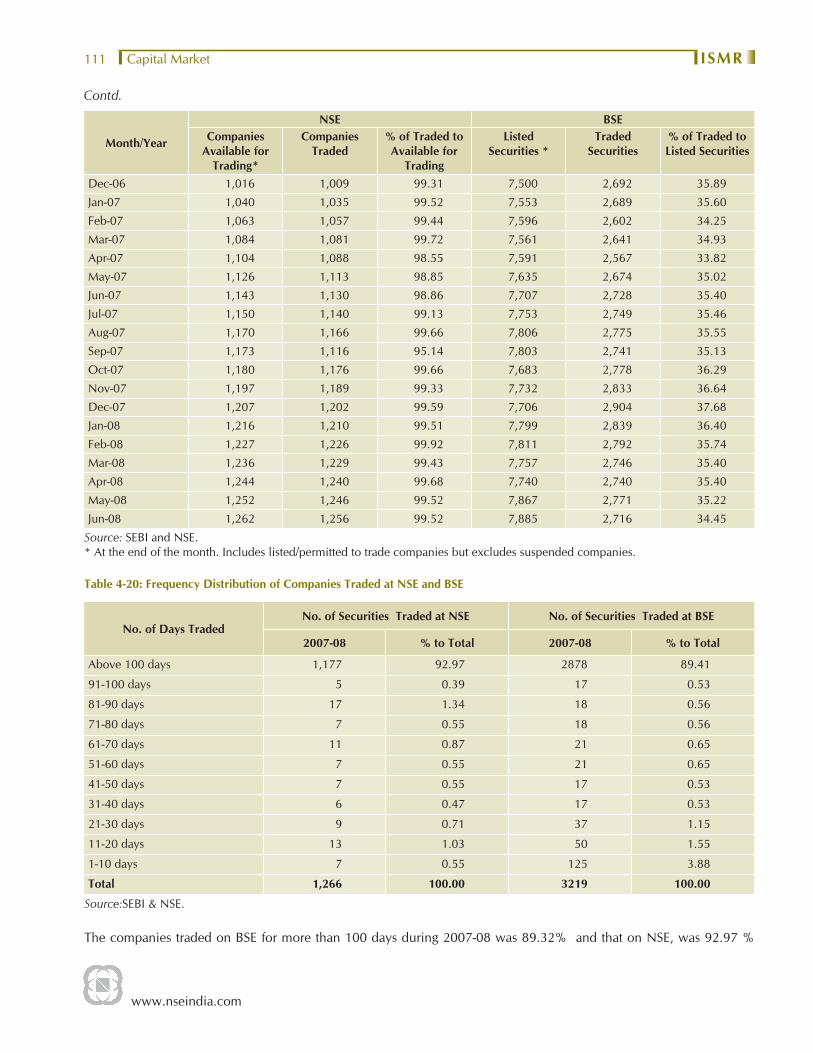
www.nseindia.com
Capital Market ISMR111
Month/Year
NSE BSECompanies
Available for Trading*
Companies Traded
% of Traded to Available for
Trading
Listed Securities *
Traded Securities
% of Traded to Listed Securities
Dec-06 1,016 1,009 99.31 7,500 2,692 35.89
Jan-07 1,040 1,035 99.52 7,553 2,689 35.60
Feb-07 1,063 1,057 99.44 7,596 2,602 34.25
Mar-07 1,084 1,081 99.72 7,561 2,641 34.93
Apr-07 1,104 1,088 98.55 7,591 2,567 33.82
May-07 1,126 1,113 98.85 7,635 2,674 35.02
Jun-07 1,143 1,130 98.86 7,707 2,728 35.40
Jul-07 1,150 1,140 99.13 7,753 2,749 35.46
Aug-07 1,170 1,166 99.66 7,806 2,775 35.55
Sep-07 1,173 1,116 95.14 7,803 2,741 35.13
Oct-07 1,180 1,176 99.66 7,683 2,778 36.29
Nov-07 1,197 1,189 99.33 7,732 2,833 36.64
Dec-07 1,207 1,202 99.59 7,706 2,904 37.68
Jan-08 1,216 1,210 99.51 7,799 2,839 36.40
Feb-08 1,227 1,226 99.92 7,811 2,792 35.74
Mar-08 1,236 1,229 99.43 7,757 2,746 35.40
Apr-08 1,244 1,240 99.68 7,740 2,740 35.40
May-08 1,252 1,246 99.52 7,867 2,771 35.22
Jun-08 1,262 1,256 99.52 7,885 2,716 34.45
Source: SEBI and NSE.* At the end of the month. Includes listed/permitted to trade companies but excludes suspended companies.
Table 4-20: Frequency Distribution of Companies Traded at NSE and BSE
No. of Days TradedNo. of Securities Traded at NSE No. of Securities Traded at BSE
2007-08 % to Total 2007-08 % to Total
Above 100 days 1,177 92.97 2878 89.41
91-100 days 5 0.39 17 0.53
81-90 days 17 1.34 18 0.56
71-80 days 7 0.55 18 0.56
61-70 days 11 0.87 21 0.65
51-60 days 7 0.55 21 0.65
41-50 days 7 0.55 17 0.53
31-40 days 6 0.47 17 0.53
21-30 days 9 0.71 37 1.15
11-20 days 13 1.03 50 1.55
1-10 days 7 0.55 125 3.88
Total 1,266 100.00 3219 100.00
Source:SEBI & NSE.
The companies traded on BSE for more than 100 days during 2007-08 was 89.32% and that on NSE, was 92.97 %
Contd.

www.nseindia.com
Capital Market ISMR 112
(Table 4-20). Trading took place for less than 100 days in case of 10.68 % of companies traded at BSE and 7.03 % for companies traded on NSE during the year.
Takeovers
In 2007-08, there were 114 takeovers under open category involving Rs. 287,070 million (US $ 7,182 million) as against 87 takeovers involving Rs. 113,520 million (US $ 2,604 million) during the preceding year (Table 4-21). Under the exempted category there were 232 takeovers involving Rs 64,580 million (US $ 1,616 million) as against 223 takeovers involving Rs. 186,080 million (US $ 4,269 million) in the previous year.
Table 4-21: Substantial Acquisition of Shares and Takeovers
Year
Open Offers Automatic ExemptionObjectives
Total
Number
Value of Shares AcquiredChange in Control
of ManagementConsolidation of
HoldingsSubstantial Acquisition
Number Value(Rs.mn)
Number Value(Rs.mn)
Number Value(Rs. mn)
Number Value(Rs.mn)
Value(US $ mn)
(Rs. mn) (US $ mn)
1994-95 0 0 1 1,140 1 42 2 1,182 -- -- -- --
1995-96 4 301 4 255 0 0 8 556 -- -- -- --
1996-97 11 118 7 783 1 23 19 924 -- -- -- --
1997-98 18 1,429 10 3,398 13 956 41 5,784 -- 93 35,022 --
1998-99 29 997 24 4,163 12 3,271 65 8,430 199 201 18,881 445
1999-00 42 2,588 9 711 23 1,300 74 4,599 105 252 46,774 1,072
2000-01 70 11,404 5 1,890 2 425 77 13,719 294 248 48,732 1,045
2001-02 54 17,562 26 18,152 1 390 81 36,104 740 276 25,390 520
2002-03 46 38,144 40 25,733 2 14 88 63,891 1,345 238 24,284 511
2003-04 38 3,952 16 1,966 11 10,030 65 15,948 368 171 14,357 331
2004-05 35 35,030 12 1,650 14 9,640 61 46,320 1,059 212 69,580 1,590
2005-06 78 32,520 9 1,190 15 7,090 102 40,800 915 245 171,320 3,840
2006-07 66 67,710 15 44,980 6 830 87 113,520 2,604 223 186,080 4,269
2007-08 78 116,570 28 132,540 8 37,960 114 287,070 7,182 232 64,580 1,616
April 2008- June 2008
27 6,510 6 3,410 1 960 34 10,880 253 83 41,860 975
Total 596 334,836 212 241,961 110 72,931 918 649,728 15,064 2,474 746,860 16,215
Source: SEBI.

www.nseindia.com
Capital Market ISMR113
Annexure 4-1: Exchange -wise Brokers and Sub-brokers in India
Exchanges
Participants at the end March
Registered Brokers Registered Sub-Brokers2005 2006 2007 2008 2005 2006 2007 2008
1 Ahmedabad 317 317 317 321 119 119 97 97
2 Bangalore 250 256 256 256 156 156 156 156
3 BSE 726 840 901 946 6,917 10,691 13,482 20,616
4 Bhubaneshwar 221 219 216 214 17 17 17 17
5 Calcutta 962 962 960 957 88 88 87 87
6 Cochin 446 434 432 435 42 42 42 42
7 Coimbatore 135 135 135 135 22 22 21 21
8 Delhi 376 375 374 374 343 343 292 277
9 Gauhati 119 110 104 103 4 4 4 4
10 ICSEIL 654 788 925 935 3 3 3 3
11 Jaipur 522 507 492 488 34 34 33 33
12 Ludhiana 293 293 293 297 38 38 37 37
13 Madhya Pradesh 174 174 174 174 5 5 5 5
14 Madras 178 182 181 181 115 115 112 112
15 NSEIL 976 1,014 1,077 1,129 5,338 11,359 12,724 22,144
16 OTCEI 801 769 752 719 19 19 19 19
17 Pune 186 192 188 188 161 161 158 158
18 Uttar Pradesh 504 463 384 354 19 19 14 8
19 Vadodara 311 311 311 311 41 41 38 38
Total * 9,128 9,335 9,443 9,487 13,684 23,479 27,540 44,074
* Also includes the Brokers and Sub-Brokers from the derecognised Stock ExchangesSource: SEBI

www.nseindia.com
Capital Market ISMR 114
Annexure 4-2: Business Growth of CM Segment of NSE
Month/Year
No. of Trad-ing
Days
No. of Com-panies Traded
No. of Trades (mn.)
Traded Quanti-ty (mn.)
Turnover (Rs. mn.)
Average Daily Turn-over
(Rs. mn.)
Turn-over Ratio (%)
Demat Securi-
ties Traded (mn.)
Demat Turnover (Rs. mn.)
Demat Turnover as a % of
Total Turnover
Market Capitalisa-tion (Rs. mn.) *
Nov 94-Mar 95 102 -- 0.3 139 18,050 177 0.50 -- -- 0 3,633,500
1995-96 246 -- 7 3,991 672,870 2,735 16.76 -- -- 0 4,014,5901996-97 250 -- 26 13,556 2,954,030 11,816 70.44 -- -- 0 4,193,6701997-98 244 -- 38 13,569 3,701,930 15,172 76.88 -- -- 0 4,815,0301998-1999 251 -- 55 16,533 4,144,740 16,513 84.38 854 238,180 5.75 4,911,7511999-2000 254 -- 98 24,270 8,390,515 33,034 82.23 15,377 7,117,057 84.82 10,204,2572000-01 251 1201 168 32,954 13,395,102 53,367 203.62 30,722 12,643,372 94.39 6,578,4702001-02 247 1,019 175 27,841 5,131,674 20,776 80.58 27,772 5,128,661 99.94 6,368,6102002-03 251 899 240 36,407 6,179,886 24,621 115.05 36,405 6,179,845 100.00 5,371,3322003-04 254 804 379 71,330 10,995,339 43,289 98.09 71,330 10,995,339 100.00 11,209,7602004-05 253 856 451 79,769 11,400,720 45,062 71.90 79,769 11,400,720 100.00 15,855,8532005-06 251 928 609 84,449 15,695,579 62,532 55.79 84,449 15,695,579 100.00 28,132,007Apr-06 18 935 57 7,289 1,773,724 98,540 --- 7,289 1,773,724 100.00 29,901,998May-06 22 943 69 9,537 2,014,090 91,550 --- 9,537 2,014,090 100.00 26,126,387Jun-06 23 950 67 6,675 1,510,500 65,674 --- 6,675 1,510,500 100.00 25,246,594Jul-06 21 950 54 4,615 1,186,983 56,523 --- 4,615 1,186,983 100.00 25,142,609Aug-06 22 949 63 5,644 1,307,960 59,453 --- 5,644 1,307,960 100.00 27,774,010Sep-06 21 968 65 6,439 1,443,388 68,733 --- 6,439 1,443,388 100.00 29,941,316Oct-06 20 973 58 6,082 1,383,822 69,191 --- 6,082 1,383,822 100.00 31,383,194Nov-06 22 982 75 7,307 1,898,635 86,302 --- 7,307 1,898,635 100.00 33,736,518Dec-06 20 1,009 67 5,858 1,701,054 85,053 --- 5,858 1,701,054 100.00 34,262,356Jan-07 20 1,035 70 8,835 1,751,470 87,573 --- 8,835 1,751,470 100.00 35,714,874Feb-07 19 1,057 70 8,981 1,801,702 94,826 --- 8,981 1,801,702 100.00 32,969,306Mar-07 21 1,081 71 8,284 1,679,537 79,978 --- 8,284 1,679,537 100.00 33,673,500 2006-07 249 1,114 785 85,546 19,452,865 78,124 57.77 85,546 19,452,865 100.00 33,673,500Apr-2007 20 1,088 68 7,708 1,685,665 84,283 --- 7,708 1,685,665 100.00 36,503,677May-2007 21 1,113 80 9,791 2,075,852 98,850 --- 9,791 2,075,852 100.00 38,980,783Jun-2007 21 1,130 75 7,964 1,936,482 92,213 --- 7,964 1,936,482 100.00 39,783,807Jul-2007 22 1,140 90 10,532 2,672,269 121,467 --- 10,532 2,672,269 100.00 43,175,715Aug-2007 22 1,166 87 10,622 2,312,406 105,109 --- 10,622 2,312,406 100.00 42,969,941Sep-2007 20 1,116 92 14,380 2,660,497 133,025 --- 14,380 2,660,497 100.00 48,865,608Oct-2007 22 1,176 123 17,095 4,555,894 207,086 --- 17,095 4,555,894 100.00 57,222,271Nov-2007 22 1,189 118 17,059 4,144,195 188,372 --- 17,059 4,144,195 100.00 58,767,421Dec-2007 19 1,202 109 16,397 3,663,854 192,834 --- 16,397 3,663,854 100.00 65,432,719Jan-2008 23 1,210 125 16,682 4,471,378 194,408 --- 16,682 4,471,378 100.00 52,953,868Feb-2008 21 1,226 107 11,359 2,801,764 133,417 --- 11,359 2,801,764 100.00 54,199,423Mar-2008 18 1,229 99 10,260 2,530,125 140,562 --- 10,260 2,530,125 100.00 48,581,2172007-08 251 1,244 1,173 149,847 35,510,382 141,476 73.09 149,847 35,510,382 100.00 48,581,217Apr-08 20 1,240 108 11,428 2,712,269 135,613 --- 11,428 2,712,269 100.00 54,427,796May-08 20 1,246 107 11,501 2,779,229 138,961 --- 11,501 2,779,229 100.00 50,988,729Jun-08 21 1,256 111 10,855 2,644,282 125,918 --- 10,855 2,644,282 100.00 41,036,509April- June 08 61 1,236 326 33,784 8,135,781 133,373 19.83 33,784 8,135,781 100.00 41,036,509
* At the end of the period.Source: NSE

www.nseindia.com
Capital Market ISMR115
Annexure 4-3: S&P CNX Nifty Index (Nifty 50)
SL No. Security Industry
Market Capitalisa-
tion(Rs.million)
Weight-age(%)
Beta R2 Volatil-ity
Mon-thly
Return
Avg. Impact
Cost Mar 08
1 Hindalco India Limited Aluminium 202,608 0.71 1.19 0.50 5.29 -18.51 0.11
2 National Aluminium Company Limited
Aluminium 291,099 1.02 0.76 0.18 3.72 -2.66 0.15
3 Mahindra & Mahindra Ltd. Automobile - 4 wheelers
171,294 0.60 0.76 0.40 1.83 0.77 0.11
4 Maruti Udyog Limited Automobile - 4 wheelers
238,929 0.84 0.68 0.34 2.33 -4.75 0.08
5 Tata Motors Limited Automobile - 4 wheelers
240,053 0.84 0.77 0.46 2.80 -11.09 0.09
6 Hero Honda Motors Ltd. Automohiles - 2 and 3 wheelers
138,693 0.49 0.45 0.18 2.33 -8.81 0.12
7 HDFC Bank Ltd Banks 471,839 1.66 0.93 0.50 3.74 -8.62 0.09
8 ICICI Bank Ltd Banks 855,118 3.00 1.10 0.55 5.35 -29.32 0.09
9 Punjab National Bank Banks 160,883 0.56 1.03 0.49 3.72 -15.43 0.09
10 State Bank of India Banks 1,010,652 3.55 0.99 0.52 3.65 -24.22 0.08
11 ACC Limited Cement & Cement Products
155,015 0.54 0.79 0.34 2.92 3.79 0.07
12 Ambuja Cement Limited Cement & Cement Products
184,284 0.65 0.37 0.18 1.79 0.08 0.12
13 Grasim Industries Ltd. Cement & Cement Products
236,089 0.83 0.80 0.53 2.86 -10.62 0.10
14 ITC Ltd. Cigarettes 777,001 2.73 0.67 0.32 2.79 1.73 0.08
15 HCL Technologies Ltd Computers - Software 168,448 0.59 0.87 0.37 4.62 -8.79 0.13
16 Infosys Technologies Ltd. Computers - Software 823,617 2.89 0.62 0.30 4.01 -7.00 0.08
17 Satyam Computer Services Ltd Computers - Software 265,708 0.93 0.64 0.24 3.93 -9.28 0.08
18 Tata Consultancy Services Limited
Computers - Software 793,115 2.78 0.68 0.40 3.30 -7.63 0.10
19 Wipro Ltd Computers - Software 631,443 2.22 0.69 0.35 4.39 -1.13 0.13
20 DLF Limited Construction 1,100,896 3.86 1.29 0.55 7.16 -17.24 0.09
21 Unitech Ltd Construction 448,376 1.57 1.55 0.49 5.79 -23.26 0.11
22 Hindustan Uniliver Limited Diversifi ed 498,323 1.75 0.58 0.25 2.85 0.57 0.09
23 ABB Limited Electrical Equipment 250,041 0.88 0.83 0.48 3.41 2.13 0.11
24 Bharat Heavy Electricals Ltd Electrical Equipment 1,009,072 3.54 1.10 0.58 4.11 -9.86 0.09
25 Siemens Ltd Electrical Equipment 207,826 0.73 0.87 0.38 4.13 -24.56 0.11
26 Suzlon Energy Limited Electrical Equipment 394,891 1.39 1.09 0.34 5.80 -6.25 0.11
27 Larsen & Toubro Limited Engineering 887,017 3.11 1.04 0.52 4.75 -13.78 0.08
28 Housing Development Finance Corporation Ltd.
Finance - Housing 675,598 2.37 0.90 0.40 5.31 -14.90 0.08
29 GAIL (India) Limited Gas 359,782 1.26 0.94 0.38 3.13 0.48 0.09
30 Zee Entertainment Enterprises Ltd
Media & Entertainment 106,679 0.37 0.78 0.30 3.06 1.61 0.12
31 Sterlite Industries ( India ) Limited
Metals 506,213 1.78 1.28 0.55 4.23 -14.45 0.12
32 Cairn India Limited Oil Exploration 398,717 1.40 0.95 0.41 5.58 -1.97 0.11Contd.

www.nseindia.com
Capital Market ISMR 116
SL No. Security Industry
Market Capitalisa-
tion(Rs.million)
Weight-age(%)
Beta R2 Volatil-ity
Mon-thly
Return
Avg. Impact
Cost Mar 08
33 Oil & Natural Gas Corpn Ltd Oil Exploration 2,097,271 7.36 1.10 0.64 3.27 -3.60 0.10
34 Cipla Ltd. Pharmaceuticals 171,004 0.60 0.53 0.21 2.63 6.23 0.09
35 Dr. Reddy’s Laboratories Ltd. Pharmaceuticals 99,432 0.35 0.44 0.23 2.25 1.29 0.11
36 Ranbaxy Laboratories Ltd Pharmaceuticals 163,609 0.57 0.60 0.31 2.45 -1.64 0.08
37 Sun Pharmaceuticals Industries Ltd
Pharmaceuticals 254,619 0.89 0.38 0.11 2.87 0.19 0.12
38 NTPC Limited Power 1,621,058 5.69 1.17 0.58 3.40 -2.67 0.09
39 Powergrid Corporation of India Limited
Power 413,729 1.45 1.19 0.52 4.83 -10.56 0.09
40 Reliance Energy Limited Power 295,864 1.04 1.67 0.55 6.41 -20.30 0.09
41 Tata Power Co. Ltd. Power 257,775 0.90 1.20 0.38 4.21 -16.32 0.12
42 Bharat Petroleum Corpn. Ltd Refi neries 147,708 0.52 0.71 0.20 3.85 -12.10 0.11
43 Reliance Industries Ltd Refi neries 3,293,677 11.56 1.12 0.77 3.50 -8.02 0.08
44 Reliance Petroleum Limited Refi neries 702,900 2.47 1.32 0.48 4.28 -11.15 0.08
45 Steel Authority of India Ltd. Steel & Steel Products 765,363 2.69 1.47 0.66 4.90 -27.18 0.10
46 Tata Steel Limited Steel & Steel Products 507,408 1.78 1.15 0.52 5.27 -13.40 0.08
47 Bharti Airtel Limited Telecommunication - Services
1,568,146 5.50 0.78 0.37 3.31 0.00 0.09
48 Idea Cellular Limited Telecommunication - Services
270,520 0.95 0.80 0.34 3.41 -6.64 0.14
49 Reliance Communications Limited
Telecommunication - Services
1,052,138 3.69 1.18 0.66 4.05 -11.30 0.08
50 Tata Communications Limited Telecommunication - Services
146,191 0.51 0.98 0.34 4.26 0.16 0.12
28,487,729 100.00 1.00 3.04 -9.36 0.09
* Beta & R2 are calculated for the period 01-Apr-2007 to 31-Mar-2008* Beta measures the degree to which any portfolio of stocks is affected as compared to the effect on the market as a whole.* The coeffi cient of determination (R2) measures the strength of relationship between two variables the return on a security versus
that of the market.* Volatility is the Std. deviation of the daily returns for the period 01-Mar-2008 to 31-Mar-2008* Last day of trading was 31-Mar-2008* Impact Cost for S&P CNX Nifty is for a portfolio of Rs. 0.5 Crores * Impact Cost for S&P CNX Nifty is the weightage average impact cost
Contd.

www.nseindia.com
Capital Market - Clearing and Settlement ISMR117
Capital Market - Clearing and Settlement
Introduction
The transactions in secondary market pass through three distinct phases, viz., trading, clearing and settlement. While the stock exchanges provide the platform for trading, the clearing corporation determines the funds and securities obligations of the trading members and ensures that the trade is settled through exchange of obligations. The clearing banks and the depositories provide the necessary interface between the custodians/clearing members for settlement of funds and securities obligations of trading members.
Several entities, like the clearing corporation, clearing members, custodians, clearing banks, depositories are involved in the process of clearing. The role of each of these entities is explained below:
• Clearing Corporation: The clearing corporation is responsible for post-trade activities such as the risk management and the clearing and settlement of trades executed on a stock exchange.
• Clearing Members: Clearing Members are responsible for settling their obligations as determined by the NSCCL. They do so by making available funds and/or securities in the designated accounts with clearing bank/depositories on the date of settlement.
• Custodians: Custodians are clearing members but not trading members. They settle trades on behalf of trading members, when a particular trade is assigned to them for settlement. The custodian is required to confi rm whether he is going to settle that trade or not. If he confi rms to settle that trade, then clearing corporation assigns that particular obligation to him. As on date, there are 11 custodians empanelled with NSCCL. They are Citibank N.A., Deutsche Bank A.G., HDFC Bank Limited, HSBC Limited, ICICI Limited, IL&FS Limited, Standard Chartered Bank, State Bank of India, SHCIL, Kotak Mahendra Bank Ltd., DBS Bank Ltd and Axis Bank.
• Clearing Banks: Clearing banks are a key link between the clearing members and Clearing Corporation to effect settlement of funds. Every clearing member is required to open a dedicated clearing account with one of the designated clearing banks. Based on the clearing member’s obligation as determined through clearing, the clearing member makes funds available in the clearing account for the pay-in and receives funds in case of a pay-out. There are 13 clearing banks of NSE, viz., Axis Bank Ltd., Bank of India Ltd., Canara Bank Ltd., Citibank N.A, HSBC Ltd., HDFC Bank Ltd., ICICI Bank Ltd., IDBI Bank Ltd., Indusind Bank Ltd., Kotak Mahindra Bank, Standard Chartered Bank, State Bank of India and Union Bank of India
• Depositories: Depository holds securities in dematerialized form for the investors in their benefi ciary accounts. Each clearing member is required to maintain a clearing pool account with the depositories. He is required to make available the required securities in the designated account on settlement day. The depository runs an electronic fi le to transfer the securities from accounts of the custodians/clearing member to that of NSCCL and visa-versa as per the schedule of allocation of securities.
• Professional Clearing Member: NSCCL admits special category of members known as professional clearing members (PCMs). PCMs may clear and settle trades executed for their clients (individuals, institutions etc.). In such cases, the functions and responsibilities of the PCM are similar to that of the custodians. PCMs also undertake clearing and

www.nseindia.com
Capital Market - Clearing and SettlementISMR 118
settlement responsibilities of the trading members. The PCM in this case has no trading rights, but has clearing rights i.e. he clears the trades of his associate trading members and institutional clients.
Clearing & Settlement ProcessThe clearing process involves determination of what counter-parties owe, and which counter-parties are due to receive on the settlement date, thereafter the obligations are discharged by settlement. The clearing and settlement process comprises of three main activities- Clearing, Settlement and Risk Management.
The clearing and settlement process for transaction in securities on NSE is presented in (Chart 5-1).
Chart 5-1: Clearing and Settlement Process at NSE
1. Trade details from Exchange to NSCCL (real-time and end of day trade fi le).2. NSCCL notifi es the consummated trade details to clearing members/custodians who affi rm back. Based on the
affi rmation, NSCCL applies multilateral netting and determines obligations.3. Download of obligation and pay-in advice of funds/securities.4. Instructions to clearing banks to make funds available by pay-in time.5. Instructions to depositories to make securities available by pay-in-time.6. Pay-in of securities (NSCCL advises depository to debit pool account of custodians/CMs and credit its account and
depository does it)7. Pay-in of funds(NSCCL advises Clearing Banks to debit account of custodians/CMs and credit its account and clearing bank does it)8. Pay-out of securities (NSCCL advises depository to credit pool account of custodians/CMs and debit its account
and depository does it)9. Pay-out of funds (NSCCL advises Clearing Banks to credit account of custodians/CMs and debit its account and
clearing bank does it)10. Depository informs custodians/CMs through DPs.11. Clearing Banks inform custodians/CMs.
www.nseindia.com
Capital Market - Clearing and Settlement ISMR119
The core processes involved in clearing and settlement include:
(a) Trade Recording: The key details about the trades are recorded to provide basis for settlement. These details are automatically recorded in the electronic trading system of the exchanges.
(b) Trade Confi rmation: The parties to a trade agree upon the terms of trade like security, quantity, price, and settlement date, but not the counterparty which is the NSCCL. The electronic system automatically generates confi rmation by direct participants.
(c) Determination of Obligation: The next step is determination of what counter-parties owe, and what counter-parties are due to receive on the settlement date. The NSCCL interposes itself as a central counterparty between the counterparties to trades and nets the positions so that a member has security wise net obligation to receive or deliver a security and has to either pay or receive funds.
The settlement process begins as soon as members’ obligations are determined through the clearing process. The settlement process is carried out by the Clearing Corporation with the help of clearing banks and depositories. The Clearing Corporation provides a major link between the clearing banks and the depositories. This link ensures actual movement of funds as well as securities on the prescribed pay-in and pay-out day.
(d) Pay-in of Funds and Securities: This requires members to bring in their funds/securities to the clearing corporation. The CMs make the securities available in designated accounts with the two depositories (CM pool account in the case of NSDL and designated settlement accounts in the case of CDSL). The depositories move the securities available in the pool accounts to the pool account of the clearing corporation. Likewise CMs with funds obligations make funds available in the designated accounts with clearing banks. The clearing corporation sends electronic instructions to the clearing banks to debit designated CMs’ accounts to the extent of payment obligations. The banks process these instructions, debit accounts of CMs and credit accounts of the clearing corporation. This constitutes pay-in of funds and of securities.
(e) Pay-out of Funds and Securities: After processing for shortages of funds/securities and arranging for movement of funds from surplus banks to defi cit banks through RBI clearing, the clearing corporation sends electronic instructions to the depositories/clearing banks to release pay-out of securities/funds. The depositories and clearing banks debit accounts of the Clearing Corporation and credit accounts of CMs. This constitutes pay-out of funds and securities.
Settlement is deemed to be complete upon declaration and release of pay-out of funds and securities.
Settlement Cycle
NSCCL clears and settles trades as per the well-defi ned settlement cycles (Table 5-1). All the securities are being traded and settled under T+2 rolling settlement. The NSCCL notifi es the relevant trade details to clearing members/custodians on the trade day (T), which are affi rmed on T+1 to NSCCL. Based on it, NSCCL nets the positions of counterparties to determine their obligations. A clearing member has to pay-in/pay-out funds and/or securities. The obligations are netted for a member across all securities to determine his fund obligations and he has to either pay or receive funds. Members’ pay-in/pay-out obligations are determined latest by T+1 and are forwarded to them on the same day, so that they can settle their obligations on T+2. The securities/funds are paid-in/paid-out on T+2 day to the members’ clients’ and the settlement is complete in 2 days from the end of the trading day. The settlement cycle for the CM segment are presented in Table 5-1.

www.nseindia.com
Capital Market - Clearing and SettlementISMR 120
Table 5-1: Settlement Cycle in CM Segment
ActivityT+2 Rolling Settlement
(From April 1, 2003)
Trading T
Custodial Confi rmation T+1
Delivery generation T+1
Securities/Funds Pay-in T+2
Securities/Funds Pay-out T+2
Valuation Debit T+2
Auction T+3
Bad Delivery Reporting T+4
Auction Pay-in/Pay-out T+5
Close Out T+5
Rectifi ed Bad Delivery Pay-in/Pay-out T+6
Re-bad Delivery Reporting T+8
Close Out of Re-bad Delivery T+9
T+1 means one working day after the trade day. Other T+ terms have similar meanings.Source:NSE
Dematerialised Settlement
NSE along with leading fi nancial institutions established the National Securities Depository Ltd. (NSDL), the fi rst depository in the country, with the objective to reduce the menace of fake/forged and stolen securities and thereby enhance the effi ciency of the settlement systems. This has ushered in an era of dematerialized trading and settlement. SEBI, too, has been progressively promoting dematerialisation by mandating settlement only through dematerialized form for more and more securities. The share of demats delivery in total delivery at NSE touched 100% in terms of value during 2007-08.
Settlement Statistics
The details of settlement of trades on CM segment of NSE are provided in Annexure 5.1. There has been a substantial reduction in short and bad deliveries. Short deliveries averaged around 0.27% of total delivery in 2007-08. The ratio of bad deliveries to net deliveries progressively declined to almost negligible in 2007-08.
During 2007-08, taking all stock exchanges together, 29.54% of securities accounting for 28.21% turnover were settled by delivery and the balance were squared up/netted out (Table 5-2). In the preceding year, 33.17% of shares accounting for 28.98% of turnover was settled by delivery. This indicates preference for non-delivery-based trades.
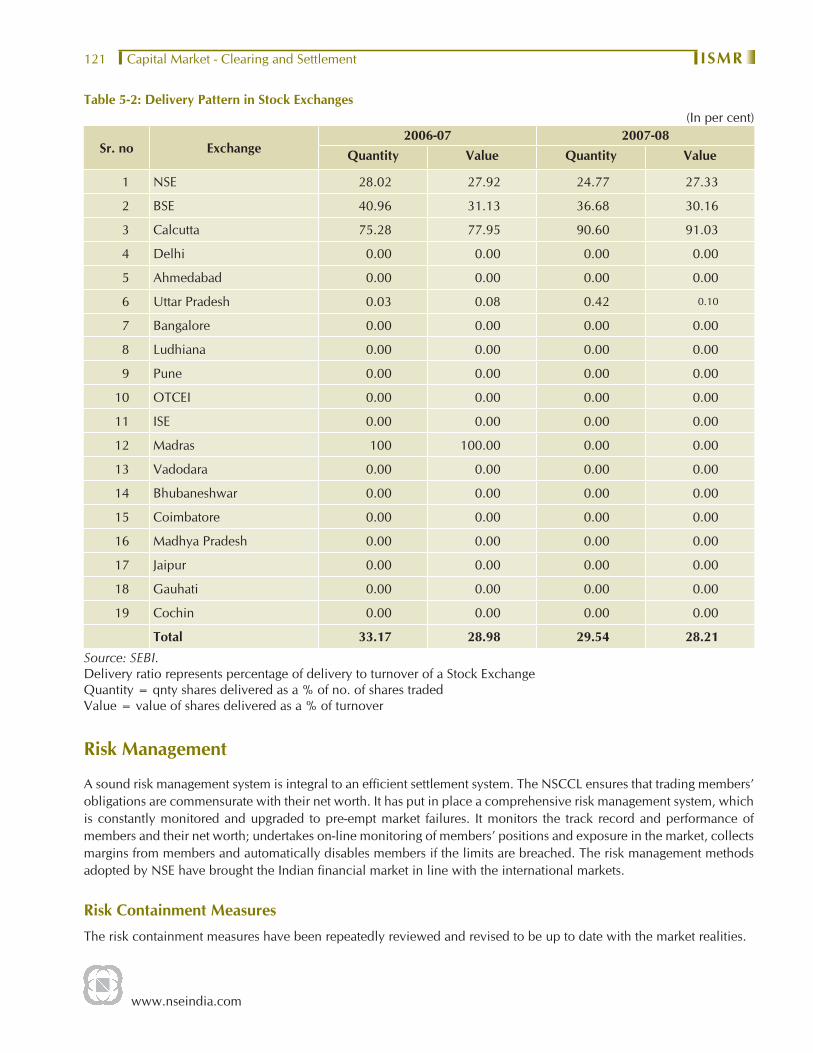
www.nseindia.com
Capital Market - Clearing and Settlement ISMR121
Table 5-2: Delivery Pattern in Stock Exchanges(In per cent)
Sr. no Exchange2006-07 2007-08
Quantity Value Quantity Value
1 NSE 28.02 27.92 24.77 27.33
2 BSE 40.96 31.13 36.68 30.16
3 Calcutta 75.28 77.95 90.60 91.03
4 Delhi 0.00 0.00 0.00 0.00
5 Ahmedabad 0.00 0.00 0.00 0.00
6 Uttar Pradesh 0.03 0.08 0.42 0.10
7 Bangalore 0.00 0.00 0.00 0.00
8 Ludhiana 0.00 0.00 0.00 0.00
9 Pune 0.00 0.00 0.00 0.00
10 OTCEI 0.00 0.00 0.00 0.00
11 ISE 0.00 0.00 0.00 0.00
12 Madras 100 100.00 0.00 0.00
13 Vadodara 0.00 0.00 0.00 0.00
14 Bhubaneshwar 0.00 0.00 0.00 0.00
15 Coimbatore 0.00 0.00 0.00 0.00
16 Madhya Pradesh 0.00 0.00 0.00 0.00
17 Jaipur 0.00 0.00 0.00 0.00
18 Gauhati 0.00 0.00 0.00 0.00
19 Cochin 0.00 0.00 0.00 0.00
Total 33.17 28.98 29.54 28.21Source: SEBI.Delivery ratio represents percentage of delivery to turnover of a Stock ExchangeQuantity = qnty shares delivered as a % of no. of shares tradedValue = value of shares delivered as a % of turnover
Risk Management
A sound risk management system is integral to an effi cient settlement system. The NSCCL ensures that trading members’ obligations are commensurate with their net worth. It has put in place a comprehensive risk management system, which is constantly monitored and upgraded to pre-empt market failures. It monitors the track record and performance of members and their net worth; undertakes on-line monitoring of members’ positions and exposure in the market, collects margins from members and automatically disables members if the limits are breached. The risk management methods adopted by NSE have brought the Indian fi nancial market in line with the international markets.
Risk Containment Measures
The risk containment measures have been repeatedly reviewed and revised to be up to date with the market realities.

www.nseindia.com
Capital Market - Clearing and SettlementISMR 122
Capital Adequacy
The capital adequacy requirements stipulated by the NSE are substantially in excess of the minimum statutory requirements as also in comparison to those stipulated by other stock exchanges. Corporates seeking membership in the CM and F&O segment are required to have a net worth of Rs. 100 lakh, and keep an interest free security deposit of Rs. 125 lakh and collateral security deposit of Rs. 25 lakh with the Exchange/NSCCL. The deposits kept with the Exchange as part of the membership requirement may be used towards the margin requirement of the member. Additional capital may be provided by the member for taking additional exposure. The capital adequacy norms for Corporates, Individuals/partnership fi rms are presented in details in Chapter 4 ‘Table 4-2 Eligibility Criteria for Trading Membership’.
On-Line Monitoring
NSCCL has put in place an on-line monitoring and surveillance system, whereby exposure of the members is monitored on a real time basis. A system of alerts has been built in so that both the member and the NSCCL are alerted as per pre-set levels (reaching 70%, 85%, 90%, 95% and 100%) as and when the members approach these limits. The system enables NSSCL to further check the micro-details of members’ positions, if required and take pro-active action.
The on-line surveillance mechanism also generates alerts/reports on any price/volume movement of securities not in line with past trends/patterns. Open positions of securities are also analyzed. For this purpose the exchange maintains various databases to generate alerts. These alerts are scrutinized and if necessary taken up for follow up action. Besides this, rumors in the print media are tracked and where they are found to be price sensitive, companies are approached to verify the same. This is then informed to the members and the public.
Inspection and Investigation
There is a regulatory requirement that a minimum of 20% of the active trading members in the capital market segment and 50 % of active trading members in the derivatives segment should be inspected every year to verify their level of compliance with various rules, byelaws and regulations of the Exchange. Usually, inspection of more members than the regulatory requirement is undertaken every year. The inspection randomly verifi es if the investor interests are being compromised in the conduct of business by the members. On the basis of various alerts further analysis is carried out. If it suggests any possible irregularity such as deviations from the past trends/patterns, concentration of trading at NSE at the member level, then a more detailed investigation is undertaken. If the detailed investigation establishes any irregular activity, then a disciplinary action is initiated against the member. If the investigation suggests suspicions of possible irregular activity across the stock exchanges and/or possible involvement of clients, the same is informed to SEBI.
Margin Requirements
NSCCL imposes stringent margin requirements as a part of its risk containment measures. The categorization of stocks for imposition of margins has the structure as given below;
• The Stocks which have traded atleast 80% of the days for the previous six months constitute the Group I and Group II.
• Out of the scrips identifi ed for Group I & II category, the scrips having mean impact cost of less than or equal to 1% are categorized under Group I and the scrips where the impact cost is more than 1, are categorized under Group II.
• The remaining stocks are classifi ed into Group III.
• The impact cost is calculated on the 15th of each month on a rolling basis considering the order book snapshots of the previous six months. On the basis of the impact cost so calculated, the scrips move from one group to another group from the 1st of the next month.
• For securities that have been listed for less than six months, the trading frequency and the impact cost is computed using the entire trading history of the security

www.nseindia.com
Capital Market - Clearing and Settlement ISMR123
Categorisation of newly listed securities
For the fi rst month and till the time of monthly review a newly listed security is categorised in that Group where the market capitalization of the newly listed security exceeds or equals the market capitalization of 80% of the securities in that particular group. Subsequently, after one month, whenever the next monthly review is carried out, the actual trading frequency and impact cost of the security is computed, to determine the liquidity categorization of the security.
In case any corporate action results in a change in ISIN, then the securities bearing the new ISIN shall be treated as newly listed security for group categorization.
Daily margin, comprises of VaR margin, Extreme Loss margin and Mark to Market margin.
1) Value at Risk Margin :
All securities are classifi ed into three groups for the purpose of VaR margin
For the securities listed in Group I, scrip wise daily volatility calculated using the exponentially weighted moving average methodology is applied to daily returns in the same manner as in the derivatives market. The scrip wise daily VaR would be 3.5 times the volatility so calculated subject to a minimum of 7.5%.
For the securities listed in Group II, the VaR margin is higher of scrip VaR (3.5 sigma) or three times the index VaR, and it is scaled up by root 3.
For the securities listed in Group III, the VaR margin is equal to fi ve times the index VaR and scaled up by root 3.
The index VaR, for the purpose, would be the higher of the daily Index VaR based on NSE Nifty 50 or BSE Sensex. The index VaR would be subject to a minimum of 5%.
Security specifi c Margin: NSCCL may stipulate security specifi c margins for the securities from time to time.
The VaR margin rate computed as mentioned above will be charged on the net outstanding position (buy value-sell value) of the respective clients on the respective securities across all open settlements. There would be no netting off of positions across different settlements. The VaR margin shall be collected on an upfront basis by adjusting against the total liquid assets of the member at the time of trade. The VaR margin so collected shall be released on completion of pay-in of the settlement
The VaR numbers are recomputed six times during the day taking into account price and volatilities at various time intervals and are provided on the website of the Exchange.
2) Extreme Loss Margin
The Extreme Loss Margin for any security is be higher of 5%, or 1.5 times the standard deviation of daily logarithmic returns of the security price in the last six months. The Extreme Loss Margin is be collected/ adjusted against the total liquid assets of the member on a real time basis
3) Mark to Market Margin
Mark to market loss is calculated by marking each transaction in security to the closing price of the security at the end of trading. In case the security has not been traded on a particular day, the latest available closing price at the NSE is considered as the closing price. In case the net outstanding position in any security is nil, the difference between the buy and sell values is considered as notional loss for the purpose of calculating the mark to market margin payable.
The mark to market margin (MTM) is collected from the member before the start of the trading of the next day. The MTM margin is also collected/adjusted from/against the cash/cash equivalent component of the liquid net worth deposited with the Exchange.
The MTM margin so collected is be released on completion of pay-in of the settlement.

www.nseindia.com
Capital Market - Clearing and SettlementISMR 124
Close Out Facility
An online facility to close–out open positions of members in the capital market segment whose trading facility is withdrawn for any reason, has been provided with effect from June 13, 2007,
On disablement, the trading members will be allowed to place close-out orders through this facility. Only orders which result in reduction of existing open positions at the client level would be accepted through the close-out facility in the normal market. Members would not be allowed to create any fresh position when in the close-out mode, to place close out orders with custodial participant code and to close out open positions of securities in trade for trade segment.
Index-based Market-wide Circuit Breakers
An index based market-wide circuit breaker system applies at three stages of the index movement either way at 10%, 15% and 20%. These circuit breakers bring about a coordinated trading halt in trading on all equity and equity derivatives markets across the country. The breakers are triggered by movements in either Nifty 50 or Sensex, whichever is breached earlier.
• In case of a 10% movement in either of these indices, there would be a one-hour market halt if the movement takes place before 1:00 p.m. In case the movement takes place at or after 1:00 p.m. but before 2:30 p.m. there would be trading halt for ½ hour. In case movement takes place at or after 2:30 p.m. there will be no trading halt at the 10% level and market would continue trading.
• In case of a 15% movement of either index, there should be a two-hour halt if the movement takes place before 1 p.m. If the 15% trigger is reached on or after 1:00 p.m. but before 2:00 p.m., there should be a one-hour halt. If the 15% trigger is reached on or after 2:00 p.m. the trading should halt for remainder of the day.
• In case of a 20% movement of the index, trading should be halted for the remainder of the day.
NSE may suo moto cancel the orders in the absence of any immediate confi rmation from the members that these orders are genuine or for any other reason as it may deem fi t. The Exchange views entries of non-genuine orders with utmost seriousness as this has market –wide repercussion. As an additional measure of safety, individual scrip-wise price bands have been fi xed as below:
Daily price bands of 2% (either way) on a set of specifi ed securities
Daily price bands of 5% (either way) on a set of specifi ed securities
Daily price bands of 10% (either way) on a set of specifi ed securities
Price bands of 20% (either way) on all the remaining securities (including debentures, warrants, preference shares etc. which are traded on CM segment of NSE),
No price bands are applicable on scrip on which derivative products are available or scrips included in indices on which derivative products are available. However in order to prevent members from entering orders at non-genuine prices in such securities, the Exchange has fi xed operating range of 20% for such securities.
The price bands for the securities in the Limited Physical Market are the same as those applicable for the securities in the Normal Market. For Auction market the price bands of 20% are applicable.
Settlement Guarantee Fund
The Settlement Guarantee Fund provides a cushion for any residual risk and operates like a self-insurance mechanism wherein members themselves contribute to the fund. In the event of a trading member failing to meet his settlement obligation, then the fund is utilized to the extent required for successful completion of the settlement. This has eliminated counter-party risk of trading on the Exchange. The market has full confi dence that settlement shall take place in time and shall be completed irrespective of default by isolated trading members.
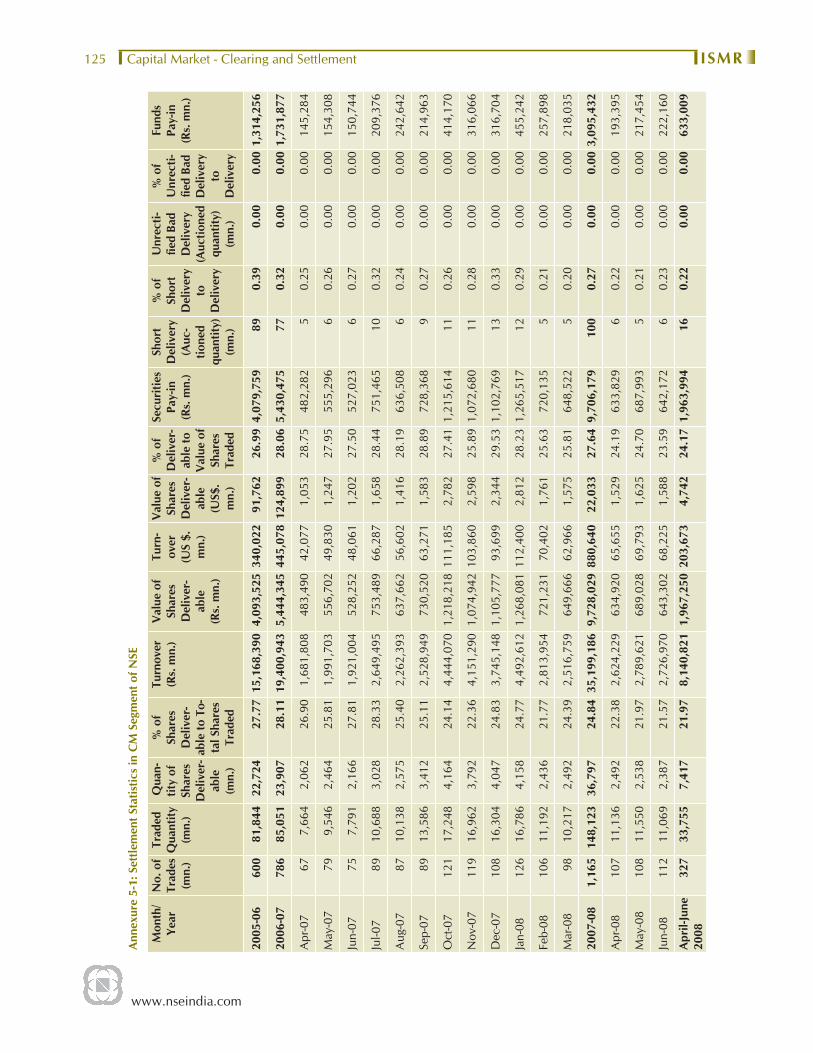
www.nseindia.com
Capital Market - Clearing and Settlement ISMR125
Ann
exur
e 5-
1: S
ettle
men
t Sta
tistic
s in
CM
Seg
men
t of N
SE
Mon
th/
Year
No.
of
Trad
es
(mn.
)
Trad
ed
Qua
ntity
(m
n.)
Qua
n-tit
y of
Sh
ares
D
eliv
er-
able
(m
n.)
% o
f Sh
ares
D
eliv
er-
able
to T
o-ta
l Sha
res
Trad
ed
Turn
over
(R
s. m
n.)
Val
ue o
f Sh
ares
D
eliv
er-
able
(R
s. m
n.)
Turn
-ov
er
(US
$.
mn.
)
Val
ue o
f Sh
ares
D
eliv
er-
able
(U
S$.
mn.
)
% o
f D
eliv
er-
able
to
Val
ue o
f Sh
ares
Tr
aded
Secu
ritie
s Pa
y-in
(R
s. m
n.)
Shor
t D
eliv
ery
(Auc
-tio
ned
quan
tity)
(m
n.)
% o
f Sh
ort
Del
iver
y to
D
eliv
ery
Unr
ecti-
fi ed
Bad
Del
iver
y (A
uctio
ned
quan
tity)
(m
n.)
% o
f U
nrec
ti-fi e
d Ba
d D
eliv
ery
to
Del
iver
y
Fund
s Pa
y-in
(R
s. m
n.)
2005
-06
600
81,8
4422
,724
27.7
715
,168
,390
4,09
3,52
534
0,02
291
,762
26.9
94,
079,
759
890.
390.
000.
001,
314,
256
2006
-07
786
85,0
5123
,907
28.1
119
,400
,943
5,44
4,34
544
5,07
812
4,89
928
.06
5,43
0,47
577
0.3
2 0.
000.
001,
731,
877
Apr
-07
67
7,6
64
2,0
62
26.
90
1,6
81,8
08
483
,490
42
,077
1,05
3 2
8.75
4
82,2
82
5
0.2
5 0.
000.
00 1
45,2
84
May
-07
79
9,5
46
2,4
64
25.
81
1,9
91,7
03
556
,702
49
,830
1,24
7 2
7.95
5
55,2
96
6
0.2
6 0.
000.
00 1
54,3
08
Jun-
07 7
5 7
,791
2
,166
2
7.81
1
,921
,004
5
28,2
52
48,0
611,
202
27.
50
527
,023
6
0
.27
0.00
0.00
150
,744
Jul-0
7 8
9 1
0,68
8 3
,028
2
8.33
2
,649
,495
7
53,4
89
66,2
871,
658
28.
44
751
,465
1
0 0
.32
0.00
0.00
209
,376
Aug
-07
87
10,
138
2,5
75
25.
40
2,2
62,3
93
637
,662
56
,602
1,41
6 2
8.19
6
36,5
08
6
0.2
4 0.
000.
00 2
42,6
42
Sep-
07 8
9 1
3,58
6 3
,412
2
5.11
2
,528
,949
7
30,5
20
63,2
711,
583
28.
89
728
,368
9
0
.27
0.00
0.00
214
,963
Oct
-07
121
1
7,24
8 4
,164
2
4.14
4
,444
,070
1,2
18,2
18 1
11,1
852,
782
27.
41 1
,215
,614
1
1 0
.26
0.00
0.00
414
,170
Nov
-07
119
1
6,96
2 3
,792
2
2.36
4
,151
,290
1,0
74,9
42 1
03,8
602,
598
25.
89 1
,072
,680
1
1 0
.28
0.00
0.00
316
,066
Dec
-07
108
1
6,30
4 4
,047
2
4.83
3
,745
,148
1,1
05,7
77
93,6
992,
344
29.
53 1
,102
,769
1
3 0
.33
0.00
0.00
316
,704
Jan-
08 1
26
16,
786
4,1
58
24.
77
4,4
92,6
12 1
,268
,081
112
,400
2,81
2 2
8.23
1,2
65,5
17
12
0.2
9 0.
000.
00 4
55,2
42
Feb-
08 1
06
11,
192
2,4
36
21.
77
2,8
13,9
54
721
,231
70
,402
1,76
1 2
5.63
7
20,1
35
5
0.2
1 0.
000.
00 2
57,8
98
Mar
-08
98
10,
217
2,4
92
24.
39
2,5
16,7
59
649
,666
62
,966
1,57
5 2
5.81
6
48,5
22
5
0.2
0 0.
000.
00 2
18,0
35
2007
-08
1,16
5 1
48,1
23
36,7
97
24.
84 3
5,19
9,18
6 9,
728,
029
880,
640
22,0
33 2
7.64
9,7
06,1
79
100
0
.27
0.00
0.00
3,09
5,43
2
Apr
-08
107
1
1,13
6 2
,492
2
2.38
2
,624
,229
6
34,9
20
65,6
551,
529
24.
19
633
,829
6
0
.22
0.00
0.00
193
,395
May
-08
108
1
1,55
0 2
,538
2
1.97
2
,789
,621
6
89,0
28
69,7
931,
625
24.
70
687
,993
5
0
.21
0.00
0.00
217
,454
Jun-
08 1
12
11,
069
2,3
87
21.
57
2,7
26,9
70
643
,302
68
,225
1,58
8 2
3.59
6
42,1
72
6
0.2
3 0.
000.
00 2
22,1
60
Apr
il-Ju
ne
2008
327
3
3,75
5 7
,417
2
1.97
8
,140
,821
1,9
67,2
50 2
03,6
734,
742
24.
17 1
,963
,994
1
6 0
.22
0.00
0.00
633
,009
www.nseindia.com
Debt MarketISMR 126
Debt Market 1
Introduction
The debt market in India comprises mainly of two segments viz., the Government securities market consisting of Central and State Governments securities, Zero Coupon Bonds (ZCBs), Floating Rate Bonds (FRBs), T-Bills and the Corporate securities market consisting of FI bonds, PSU bonds, and Debentures/Corporate bonds. Government securities form the major part of the market in terms of outstanding issues, market capitalization and trading value. It sets a benchmark for the rest of the market. The market for debt derivatives have not yet developed appreciably though a market for OTC derivatives in interest rate products exists.
Trends
During 2007-08, the government and corporate sector collectively mobilized Rs. 3,722,501 million (US $ 93,132 million) from primary debt market, a rise of 27.24% as compared to the preceding year (Table 6-1). About 68.77% of the resources were raised by the government (Central and State Governments), while the balance amount was mobilized by the corporate sector through public and private placement issues. The turnover in secondary debt market during 2007-08 aggregated Rs. 56,495,743 million (US $ 1,413,454 million), 57.04% higher than that in the previous year. The share of NSE in total turnover in debt securities witnessed a decline and stood at 5.71% during 2006-07.
Table 6-1: Debt Market: Selected Indicators
Issuer / Securities
Amount raised form Primary Market
Turnover in SecondaryMarket
Amount raised form Primary Market
Turnover in Secondary Market
2006-07(Rs. mn.)
2007-08(Rs. mn.)
2006-07(Rs. mn.)
2007-08(Rs. mn.)
2006-07(US $ mn.)
2007-08(US $ mn.)
2006-07(US $ mn.)
2007-08(US $ mn.)
Government 2,001,980 2,559,840 35,833,370* 56,273,470* 45,928 64,044 822,055 1,407,893
Corporate/Non Government
923,552 1,162,661 140,938 222,273 21,187 29,088 3,233 5,561
Total 2,925,532 3,722,501 35,974,308 56,495,743 67,115 93,132 825,288 1,413,454
* includes NDS-OM turnoverSource : Primedatabase, RBI and NSE.
1 This chapter discusses the market design and outcome in the government securities market, both primary and secondary segment. Data avail-ability for secondary market for corporate debt securities is limited. Wherever possible, the developments in the secondary market for corpo-rate debt are also covered in this chapter. The developments in primary corporate debt market are presented in Chapter 2 of this publication.

www.nseindia.com
Debt Market ISMR127
Market Segments
The various segments in debt market in India are discussed below:
• Government securities form the oldest and most dominant part of the debt market in India. The market for government securities comprises the securities issued by the central government, state governments and state-sponsored entities. In the recent past, local bodies such as municipal corporations have also begun to tap the debt market for funds. The Central Government mobilises funds mainly through issue of dated securities and T-bills, while State Governments rely solely on State Development Loans. The major investors in sovereign papers are banks, insurance companies and fi nancial institutions, which generally do so to meet statutory requirements.
• Bonds issued by government-sponsored institutions like DFIs, infrastructure-related institutions and the PSUs, also constitute a major part of the debt market. The gradual withdrawal of budgetary support to PSUs by the government since 1991 has increased their reliance on the bond market for mobilising resources. The preferred mode of raising capital by these institutions has been private placement, barring an occasional public issue. Banks, fi nancial institutions and other corporates have been the major subscribers to these issues.
• The Indian corporate sector relies, to a great extent, on raising capital through debt issues, which comprise of bonds and CPs. Of late, most of the bond issues are being placed through the private placement route. These bonds are structured to suit the requirements of investors and the issuers, and include a variety of tailor-made features with respect to interest payments and redemption. Corporate bond market has seen a lot of innovations, including securitised products, corporate bond strips, and a variety of fl oating rate instruments with fl oors and caps. In the recent years, there has been an increase in issuance of corporate bonds with embedded put and call options. While some of these securities are traded on the stock exchanges, the secondary market for corporate debt securities is yet to fully develop.
• In addition to above, there is another segment, which comprises of short-term paper issued by banks, mostly in the form of certifi cates of deposit (CDs). This segment is, however, comparatively less dominant.
• The Indian debt market also has a large non-securitised, transactions-based segment, where players are able to lend and borrow amongst themselves. This segment comprises of call and notice money markets, inter-bank market for term money, market for inter-corporate loans, and market for ready forward deals (repos). Typically, short-term instruments are traded in this segment.
• The market for interest rate derivatives like FRAs, IRSs is emerging to enable banks, PDs and FIs to hedge interest rate risks.
Policy Developments
I. Union Budget 2008-09Finance Minister in his Budget speech of 2008-09 proposed some measures to expand the market for corporate bonds such as:
• Take measures to develop the bond, currency and derivatives markets that will include launching exchange-traded currency and interest rate futures and developing a transparent credit derivatives market with appropriate safeguards;
• Enhance the tradability of domestic convertible bonds by putting in place a mechanism that will enable investors to separate the embedded equity option from the convertible bond and trade it separately; and
The Finance Minister also announced that supplementing the measures announced in respect of the corporate debt market, it was proposed to exempt from TDS, corporate debt instruments issued in demat form and listed on recognized stock exchanges.
Various developments in the bond market can be read in “Corporate Bond Market” segment later in this chapter. As regards developments in derivative market, details are given in chapter 7. The announcement regarding enhancing the tradeability of domestic convertible bonds is yet to be implemented.

www.nseindia.com
Debt MarketISMR 128
II. DIP Guidelines
In order to facilitate development of a vibrant primary market for corporate bonds in India, SEBI amended certain provisions of the SEBI (Disclosure and Investor Protection) Guidelines, 2000 in December, 2007, which provided the following:
• For public/ rights issues of debt instruments, issuers need to obtain rating from only one credit rating agency instead of from two. This would reduce the cost of issuances.
• In order to facilitate issuance of below investment grade bonds to suit the risk/ return appetite of investors, the stipulation that debt instruments issued through public/ rights issues shall be of at least investment grade has been removed.
• Further, in order to afford issuers with desired fl exibility in structuring of debt instruments, structural restrictions such as those on maturity, put/call option, on conversion, etc have been done away with.
III. Amendments to Securities Contracts (Regulation) Act, 1956 (SCRA) to provide legal framework for trading of securitized debt
Securitisation is a form of fi nancing involving pooling of fi nancial assets and the issuance of securities that are repaid from the cash fl ows generated by the assets. It is a fi nancing tool involving creating, combining and recombining categories of assets and securities into new forms. Assets, loans, receivables, etc. from multiple originators and often from more than one seller, are pooled and repackaged, underwritten and sold in the form of asset-backed or other securities.
Securitisation allows banks and fi nancial institutions to keep these loans off their balance sheets, thus reducing the need for additional capital; provides them with alternative forms of funding risk transfer and a new investor base. Further, it facilitates better matching of assets and liabilities and the development of the long-term debt market. Funding costs are lowered as a result of movement of investments from less effi cient debt markets to more effi cient capital markets through the process of securitisation.
There is considerable potential in the securities market for the certifi cates or instruments under securitisation transactions. The development of the securitised debt market is critical for meeting the humungous requirements of the infrastructure sector, particularly housing sector, in the country.
In India, the market for securitised debt remains underdeveloped. Despite two major initiatives, namely, the amendment of the National Housing Bank Act, 1987 (NHB Act) in 2000; and enactment of the Securitisation and Reconstruction of Financial Assets and Enforcement of Security Interest Act, 2002 (SARFAESI Act), the market has not picked up mainly because of lack of facility of trading on stock exchanges. This is because securitisation transactions under the NHB Act are not covered under the defi nition of “securities” in the SCR Act. As a result, buyers of securitised fi nancial instruments have few exit options.
Accordingly, after extensive consultations with major institutional participants and market experts, the Budget 2005-06 proposed to “amend the defi nition of ‘securities’ under the SCRA so as to provide a legal framework for trading of securitized debt including mortgage backed debt”. In pursuant to this, the Securities Contracts (Regulation) Amendment Bill, 2005 was introduced in the Lok Sabha in December, 2005 and referred to the Standing Committee on Finance. The Committee submitted its report in May, 2006. Based on recommendations of the Committee, a revised Bill was introduced and passed by the Parliament in May 2007. The Securities Contracts Regulation Amendment Act, 2007, providing for legal framework for trading of securitized debt, was enacted on 28th May, 2007.
The amendment, inter alia, provided for:
• including securitization certifi cates or instruments under the defi nition of “securities” in clause (h) of section 2 of the SCRA;
• a disclosure based regulation for issue of securitized certifi cates or instruments and the procedure therefore.
www.nseindia.com
Debt Market ISMR129
The objective of the amendment was to provide a trading platform for securitized instruments under the regulatory purview of SEBI. Now that the securitized debt are “securities” under the SCRA, the entire institutional, supervisory and regulatory architecture of securities law is applicable to these instruments also.
IV. Simplifi ed regulatory framework for issuance and listing of debt securities
In order to facilitate development of a vibrant primary market for corporate bonds in India, SEBI notifi ed Regulations for Issue and Listing of Debt Securities, on June 6, 2008, to provide for simplifi ed regulatory framework for issuance and listing of non-convertible debt securities (excluding bonds issued by Governments) issued by any company, public sector undertaking or statutory corporations. The Regulations do not apply to issue and listing of, securitized debt instruments and security receipts for which separate regulatory regime is in place.
The Regulations provide for rationalized disclosure requirements for public issues and fl exibility to issuers to structure their instruments and decide on the mode of offering, without diluting the areas of regulatory concern. In case of public issues, while the disclosures specifi ed under Schedule II of the Companies Act, 1956 shall be made, the Regulations require additional disclosures about the issuer and the instrument such as nature of instruments, rating rationale, face value, issue size, etc.
While the requirement of fi ling of draft offer documents with SEBI for observations has been done away with, emphasis has been placed on due diligence, adequate disclosures, and credit rating as the cornerstones of transparency. Regulations prescribe certifi cations to be fi led by merchant bankers in this regard. The Regulations emphasize on the role and obligations of the debenture trustees, execution of trust deed, creation of security and creation of debenture redemption reserve in terms of the Companies Act.
The Regulations enable electronic disclosures. The draft offer document needs to be fi led with the designated stock exchange through a SEBI registered merchant banker who shall be responsible for due diligence exercise in the issue process and the draft offer document shall be placed on the websites of the stock exchanges for a period of seven working days inviting comments. The requirements for advertisements have also been simplifi ed.
While listing of securities issued to the public is mandatory, the issuers may also list their debt securities issued on private placement basis subject to compliance of simplifi ed regulatory requirements as provided in the Regulations. The Regulations provide an enabling framework for listing of debt securities issued on a private placement basis, even in cases where the equity of the issuer is not listed. NBFCs and Public Finance Instruments (PFIs) are exempted from mandatory listing. However, they may list their privately placed debt securities subject to compliance with the simplifi ed requirements and Listing Agreement.
V. SEBI notifi es SEBI (Public Offer and Listing of Securitised Debt Instruments) Regulations, 2008
The amendment to Securities Contracts (Regulation) Act, 1956 (SCRA) ( as detailed in III above) enabled SEBI to provide for disclosure based regulation for public issue of or listing of securitized debt instruments on the recognized stock exchanges with a view to develop market for securitized debt instruments. Accordingly, SEBI notifi ed SEBI (Public Offer and Listing of Securitised Debt Instruments) Regulations, 2008 on May 26, 2008 taking into account the market needs, cost of the transactions, competition policy, the professional expertise of credit rating agencies, disclosures and obligations of the parties involved in the transaction and the interest of investors in such instruments. Salient features of the regulations are as follows: -
(a) The special purpose distinct entity i.e. issuer shall be in the form of a trust, the trustees thereof will require registration from SEBI. The registration granted to a trustee shall be permanent subject to compliance with the provisions with the SCRR and the regulations and payment of appropriate fees.
(b) If a debenture trustee registered with SEBI or a securitization company or a asset reconstruction company registered with Reserve Bank of India or National Housing Bank or the NABARD is the trustee of the issuer no registration from SEBI to act as such shall be required.
www.nseindia.com
Debt MarketISMR 130
(c) The securitized debt instruments issued to public or listed on recognized stock exchange shall acknowledge the benefi cial interest of the investors in underlying debt or receivables assigned to the issuer. The regulations provide fl exibility in terms of pay through / pass through structures and do not restrict any particular mode.
(d) The assignment of assets to the issuer shall be a true sale. The debt or receivables assigned to the issuer should be expected to generate identifi able cash fl ows for the purpose of servicing the instrument and the originator should have valid enforceable interests in the assets and in cash fl ow of assets prior to securitization.
(e) The issuer shall be a bankruptcy remote from the originator. Originator shall be an independent entity from the issuer and its trustees and the originator and its associates shall not exercise any control over the issuer. However, the originator may be appointed as a servicer. The issuer may appoint any other person as servicer in respect of any its schemes to co-ordinate with the obligors, manage the said pool and collection therefrom, administer the cash fl ows of asset pool, distribution to investors and reinvestments. The issuer shall not acquire any debt or receivables from any originator who is part of the same group or which is under the same management as the trustee. Regulations require strict segregation of assets of each scheme.
(f) The issuer may offer securitised debt instruments to public for subscription through an offer document containing disclosures of all relevant material facts including fi nancials of the issuer, originator, quality of the asset pool, disclosure of various kinds of risks, credit ratings including unaccepted ratings, arrangements made for credit enhancement, liquidity facilities availed, underwriting of the issue etc. apart from the routine disclosures relating to issue, offer period, application, etc.
(g) Rating from atleast two credit rating agencies is mandatory and all ratings including unaccepted ratings shall be disclosed in the offer documents. The rating rationale should include reference to the quality of the said pool and strengthen of cash fl ows, originator profi le, payment structure, risks and concerns for investors, etc.
(h) The instrument shall be in dematerialized form.
(i) The draft offer document shall be fi led with SEBI atleast 15 days before opening of the issue.
(j) In case of public issuances listing will be mandatory. The instruments issued on private placement basis may also be listed subject to the compliance of simplifi ed provisions of the regulations. The securitised debt instruments issued to the public or listed on a recognized stock exchange in accordance with these regulations shall be freely transferable.
(k) It has been proposed to introduce simplifi ed and relaxed listing agreement. Listing of private placement is also permitted subject to the compliance of simplifi ed provisions of the listing agreement and the regulations. The simplifi ed listing agreement is under preparation.
Market Design
Government Securities Market
Market Participants
Regulators
Given the large size of the trades, the debt market has remained predominantly a wholesale market. The matrix of issuers, investors, instruments in the debt market and their maturities are presented in (Table 6-2).RBIThe RBI operates both as the monetary authority and the debt manager to the government. The RBI participates in the market through:• Open-market operations (OMO)• Liquidity Adjustment facility (LAF) • Bank rate • Repo rate.
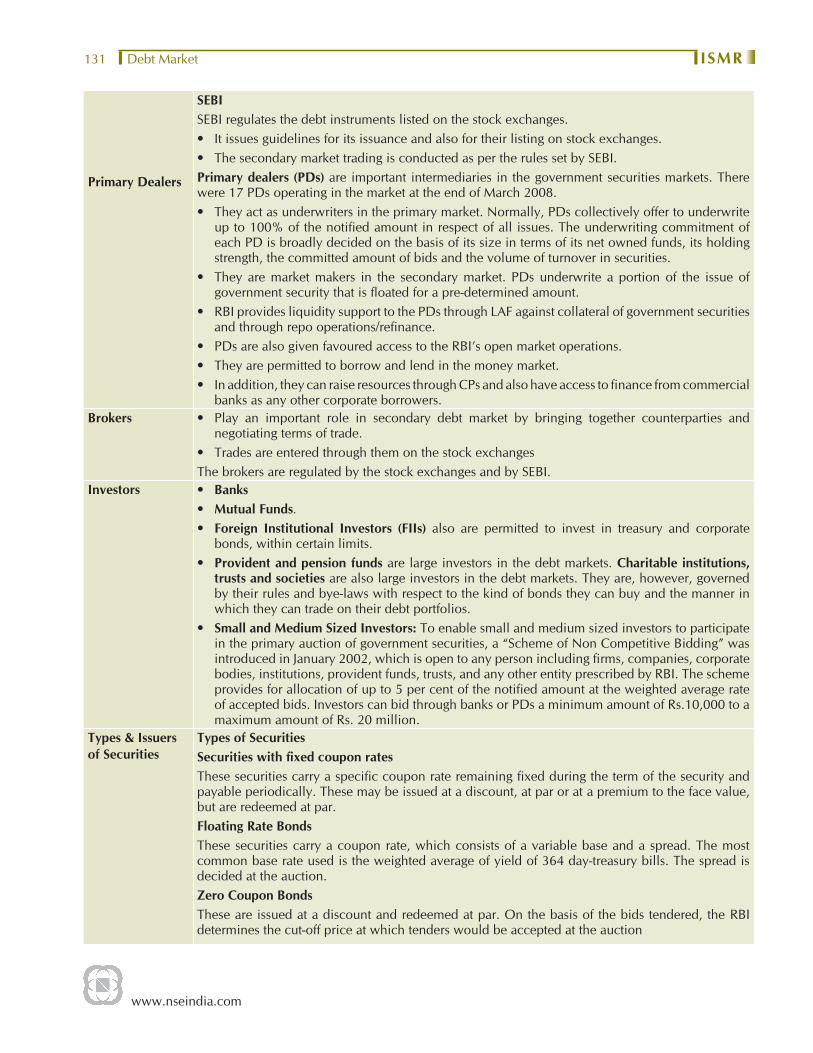
www.nseindia.com
Debt Market ISMR131
Primary Dealers
SEBISEBI regulates the debt instruments listed on the stock exchanges.• It issues guidelines for its issuance and also for their listing on stock exchanges.• The secondary market trading is conducted as per the rules set by SEBI.Primary dealers (PDs) are important intermediaries in the government securities markets. There were 17 PDs operating in the market at the end of March 2008. • They act as underwriters in the primary market. Normally, PDs collectively offer to underwrite
up to 100% of the notifi ed amount in respect of all issues. The underwriting commitment of each PD is broadly decided on the basis of its size in terms of its net owned funds, its holding strength, the committed amount of bids and the volume of turnover in securities.
• They are market makers in the secondary market. PDs underwrite a portion of the issue of government security that is fl oated for a pre-determined amount.
• RBI provides liquidity support to the PDs through LAF against collateral of government securities and through repo operations/refi nance.
• PDs are also given favoured access to the RBI’s open market operations. • They are permitted to borrow and lend in the money market.• In addition, they can raise resources through CPs and also have access to fi nance from commercial
banks as any other corporate borrowers.Brokers • Play an important role in secondary debt market by bringing together counterparties and
negotiating terms of trade.• Trades are entered through them on the stock exchangesThe brokers are regulated by the stock exchanges and by SEBI.
Investors • Banks • Mutual Funds. • Foreign Institutional Investors (FIIs) also are permitted to invest in treasury and corporate
bonds, within certain limits. • Provident and pension funds are large investors in the debt markets. Charitable institutions,
trusts and societies are also large investors in the debt markets. They are, however, governed by their rules and bye-laws with respect to the kind of bonds they can buy and the manner in which they can trade on their debt portfolios.
• Small and Medium Sized Investors: To enable small and medium sized investors to participate in the primary auction of government securities, a “Scheme of Non Competitive Bidding” was introduced in January 2002, which is open to any person including fi rms, companies, corporate bodies, institutions, provident funds, trusts, and any other entity prescribed by RBI. The scheme provides for allocation of up to 5 per cent of the notifi ed amount at the weighted average rate of accepted bids. Investors can bid through banks or PDs a minimum amount of Rs.10,000 to a maximum amount of Rs. 20 million.
Types & Issuers of Securities
Types of SecuritiesSecurities with fi xed coupon ratesThese securities carry a specifi c coupon rate remaining fi xed during the term of the security and payable periodically. These may be issued at a discount, at par or at a premium to the face value, but are redeemed at par.Floating Rate BondsThese securities carry a coupon rate, which consists of a variable base and a spread. The most common base rate used is the weighted average of yield of 364 day-treasury bills. The spread is decided at the auction. Zero Coupon BondsThese are issued at a discount and redeemed at par. On the basis of the bids tendered, the RBI determines the cut-off price at which tenders would be accepted at the auction

www.nseindia.com
Debt MarketISMR 132
Treasury BillsTreasury bills (T-bills) are short-term debt instruments issued by the Central government. They have either 91-days, 182-days or 364-days maturity. T-bills are sold through an auction process announced by the RBI at a discount to its face value. RBI issues an indicative calendar of T-bill auctions. Government Securities issued by Central and State Government and Local bodies. In the recent past, local bodies such as municipalities have also tapped the market. The Central Government mobilises funds mainly through issue of dated securities and T-bills, while State Governments rely solely on state development loans.
Table 6-2: Participants and Products in Debt Market
Issuer Instruments Maturity Investors
Central Government Dated Securities 2 - 30 years RBI, Banks, Insurance Companies, Provident Funds, Mutual Funds, PDs
Central Government T-Bills 91/182/364 days RBI, Banks, Insurance companies, Provident Funds, Mutual Funds, Individuals, PDs
State Government Dated Securities 5-13 years RBI, Banks, Insurance Companies, Provident Funds, Mutual Funds, Individuals and PD’s.
PSUs Bonds, Structured Obligations
5-10 years Banks, Insurance Companies, Provident Funds, Mutual Funds, Individuals, Corporates
Corporates Debentures 1 - 12 years Banks, Mutual Funds, Corporates, Individuals
Corporates, PDs Commercial Papers 7 days to 1 year Banks, Mutual Funds, Financial Institutions, Corporates, Individuals, FIIs
Scheduled Commercial Banks, Select Financial Institutions (under umbrella limit fi xed by RBI)
Certifi cates of Deposits
7 days to 1 year, whereas for FIs it is 1 year to 3 years
Banks, Companies, Individuals, FIIs, Corporations, Trusts, Funds, Associations, FIs, NRIs
Scheduled Commercial Banks Bank Bonds 1-10 years Corporations, Individuals, Companies, Trusts, Funds, Associations, FIs, Non-Resident Indians
Municipal Corporation Municipal Bonds 0-7 years Banks, Corporations, Individuals, Companies, Trusts, Funds, Associations, FIs, Non-Resident Indians
Primary Issuance Process of Government SecuritiesGovernment issues securities through the auction, tap sale, pre-announced coupon rate etc. A brief about them are as given below:
Issue of securities through auction
The securities are issued through auction either on price basis or yield basis. • If the issue is on price basis, the coupon is pre-determined, then the bidders should quote
price per Rs.100 of the face value of the security. • If the issue is on yield basis, then the coupon of the security is decided in an auction and
the security carries the same coupon till maturity. On the basis of the bids received, RBI determines the maximum rate of yield or the minimum offer price as the case may be at which offers for purchase of securities would be accepted.
The auctions for issue of securities (on either yield basis or price basis) are held either on ‘Uniform Price’ method or ‘Multiple Price Method’.
Issue of securities with pre-announced coupon rates
The coupon on securities is announced before the date of fl oatation and the securities are issued at par. In case the total subscription exceeds the aggregate amount offered for sale, RBI may make partial allotment to all the applicants.
Issue of securities through tap sale
No aggregate amount is indicated in the notifi cation in respect of the securities sold on tap. Sale of such securities may be extended to more than one day and the sale may be closed at any time on any day.

www.nseindia.com
Debt Market ISMR133
Issue of securities in conversion of maturing treasury bills/dated securities
The holders of treasury bills of certain specifi ed maturities and holders of specifi ed dated securities are provided an option to convert their holding at specifi ed prices into new securities offered for sale. The new securities could be issued on an auction/pre-announced coupon basis.
Securities with Embedded Options
These securities, where a ‘call option’/ ‘put option’ is specifi ed, are repaid at the option before the specifi ed redemption date.
Issuance Process of Treasury Bills
Treasury bills (T-bills) are short-term debt instruments issued by the Central government. They have 91-days, 182-days or 364-days maturity. T-Bills are available for a minimum amount of Rs.25,000 and in multiples of Rs.25,000. Banks and PDs areT-bills are sold through an auction process announced by the RBI at a discount to its face value. T-Bills are sold through an auction process announced by the RBI at a discount to its face value. RBI issues a calendar of T-bill auctions.
State Government Securities
The States raise resources through Auctions and Tap routes. The State Government raised a gross amount of Rs. 677,790 million in 2007-08 as compared with Rs. 208,250 million in the previous year. The entire gross amount was raised throught the auction route.
Purchasers of G-Secs
• Any person including fi rm, company, corporate body, institution, state government, provident fund, trust, NRI, OCB predominantly owned by NRIs and FII registered with SEBI and approved by RBI can submit offers, including in electronic form for purchase of government securities. The payments can be done through a variety of means such as cash or cheque drawn on RBI or Banker’s pay order or by authority to debit their current account with RBI or by Electronic Fund Transfer. Government securities are issued for a minimum amount of Rs. 10,000 (face value) and in multiples of Rs. 10,000 thereafter. These are issued to the investors by credit to their SGL Account or to a Constituent SGL Account of the institution as maintained with RBI or by credit to their Bond Ledger or in the form of physical certifi cate. These are repaid at Public Debt Offi ces of RBI or any other institution at which they are registered at the time of repayment.
• Retail investors can participate in the auctions on ‘non-competitive’ basis. Allocation of the securities to the non-competitive bidders are made at the discretion of the RBI and at a price higher than the weighted average price arrived at on the basis of the competitive bids accepted at the auction. The nominal amount of securities that would be allocated to retail investors on non-competitive basis is restricted to a maximum of 5 percentage of the aggregate nominal amount of the issue, within or outside of the nominal amount which is issued at the weighted average price of the issue at the auction.
Secondary Market Participants
• Banks• Financial Institutions• Primary Dealers• Mutual Funds
Most of the secondary market trades in government securities are negotiated between participants (Banks, FIs, PDs, MFs) having SGL accounts with RBI. These may be negotiated directly between counter parties or negotiated through brokers.
Listing of Government Securities
All government securities are ‘deemed’ listed as and when they are issued. All eligible securities, whether publicly issued or privately placed, can be made available for trading in the WDM segment. Amongst other requirements, privately placed debt paper of banks, institutions and corporates requires an investment grade credit rating to be eligible for listing. The listing requirements for securities on the WDM segment are presented in (Table 6-3).
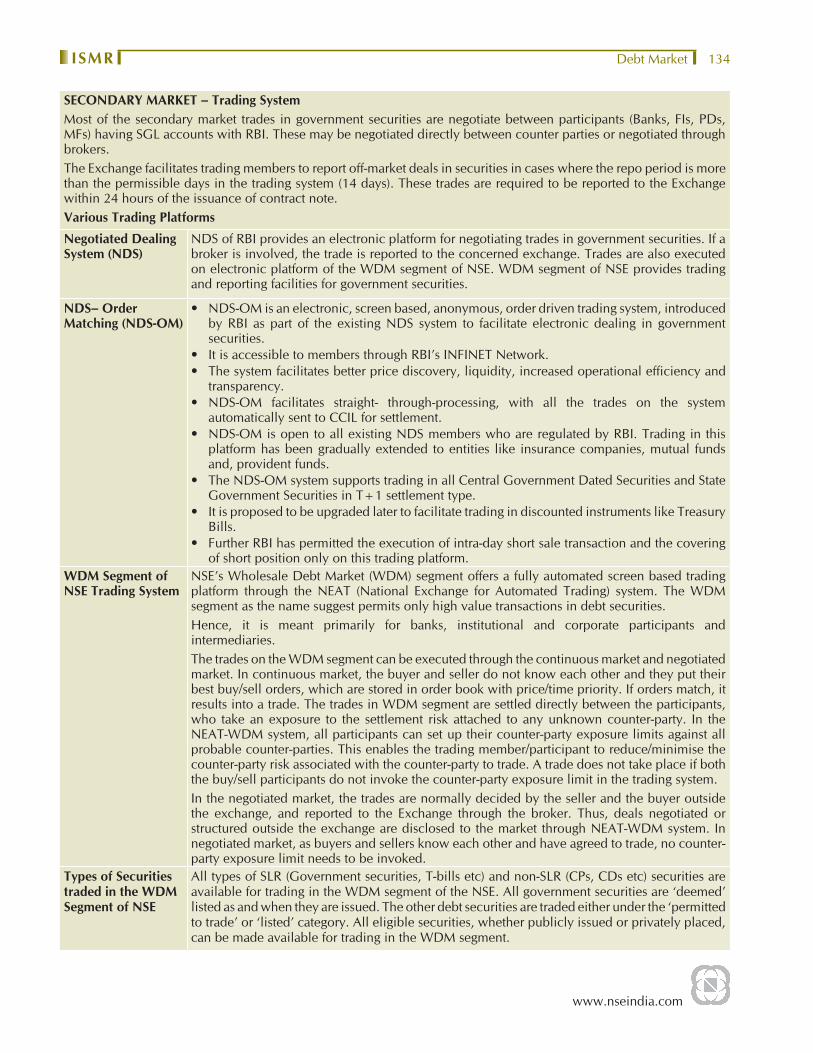
www.nseindia.com
Debt MarketISMR 134
SECONDARY MARKET – Trading SystemMost of the secondary market trades in government securities are negotiate between participants (Banks, FIs, PDs, MFs) having SGL accounts with RBI. These may be negotiated directly between counter parties or negotiated through brokers. The Exchange facilitates trading members to report off-market deals in securities in cases where the repo period is more than the permissible days in the trading system (14 days). These trades are required to be reported to the Exchange within 24 hours of the issuance of contract note.Various Trading Platforms
Negotiated Dealing System (NDS)
NDS of RBI provides an electronic platform for negotiating trades in government securities. If a broker is involved, the trade is reported to the concerned exchange. Trades are also executed on electronic platform of the WDM segment of NSE. WDM segment of NSE provides trading and reporting facilities for government securities.
NDS– Order Matching (NDS-OM)
• NDS-OM is an electronic, screen based, anonymous, order driven trading system, introduced by RBI as part of the existing NDS system to facilitate electronic dealing in government securities.
• It is accessible to members through RBI’s INFINET Network. • The system facilitates better price discovery, liquidity, increased operational effi ciency and
transparency. • NDS-OM facilitates straight- through-processing, with all the trades on the system
automatically sent to CCIL for settlement. • NDS-OM is open to all existing NDS members who are regulated by RBI. Trading in this
platform has been gradually extended to entities like insurance companies, mutual funds and, provident funds.
• The NDS-OM system supports trading in all Central Government Dated Securities and State Government Securities in T+1 settlement type.
• It is proposed to be upgraded later to facilitate trading in discounted instruments like Treasury Bills.
• Further RBI has permitted the execution of intra-day short sale transaction and the covering of short position only on this trading platform.
WDM Segment of NSE Trading System
NSE’s Wholesale Debt Market (WDM) segment offers a fully automated screen based trading platform through the NEAT (National Exchange for Automated Trading) system. The WDM segment as the name suggest permits only high value transactions in debt securities.Hence, it is meant primarily for banks, institutional and corporate participants and intermediaries.The trades on the WDM segment can be executed through the continuous market and negotiated market. In continuous market, the buyer and seller do not know each other and they put their best buy/sell orders, which are stored in order book with price/time priority. If orders match, it results into a trade. The trades in WDM segment are settled directly between the participants, who take an exposure to the settlement risk attached to any unknown counter-party. In the NEAT-WDM system, all participants can set up their counter-party exposure limits against all probable counter-parties. This enables the trading member/participant to reduce/minimise the counter-party risk associated with the counter-party to trade. A trade does not take place if both the buy/sell participants do not invoke the counter-party exposure limit in the trading system. In the negotiated market, the trades are normally decided by the seller and the buyer outside the exchange, and reported to the Exchange through the broker. Thus, deals negotiated or structured outside the exchange are disclosed to the market through NEAT-WDM system. In negotiated market, as buyers and sellers know each other and have agreed to trade, no counter-party exposure limit needs to be invoked.
Types of Securities traded in the WDM Segment of NSE
All types of SLR (Government securities, T-bills etc) and non-SLR (CPs, CDs etc) securities are available for trading in the WDM segment of the NSE. All government securities are ‘deemed’ listed as and when they are issued. The other debt securities are traded either under the ‘permitted to trade’ or ‘listed’ category. All eligible securities, whether publicly issued or privately placed, can be made available for trading in the WDM segment.

www.nseindia.com
Debt Market ISMR135
Charges The NSE has waived the transaction charges for the WDM segment of the Exchange for the period April 1, 2008 to March 31, 2009.
Clearing and Settlement
NSE currently allows settlement periods ranging from same day (T+0) settlement to a maximum of (T+2) for non-government securities while settlement of all outright secondary market transactions in government securities was standardized to T+1. In case of repo transactions in government securities, fi rst leg can be settled either on T+0 basis or T+1 basis.In case of government securities, the actual settlement of funds and securities are effected directly between participants or through Reserve Bank of India (RBI). Trades in government securities are reported to RBI-SGL through the Negotiated Dealing System (NDS) of RBI, and Clearing Corporation of India Limited (CCIL) provides settlement guarantee for transactions in government securities including repos. The trades are settled on a net basis through the DvP-III system. In the DvP-III, the settlement of Securities and Funds are carried out on a net basis.For securities other than government securities and T-bills, trades are settled on a gross basis directly between participants on delivery versus payment basis. On the scheduled settlement date, the Exchange provides data/information to the respective member/participant regarding trades to be settled on that day with details like security, counter party and consideration.The settlement details for non-government securities, i.e. certifi cate no., Cheque no., constituent etc. are reported by the member/participant to the Exchange.The Exchange closely monitors the settlement of transactions through the reporting of settlement details by members and participants. In case of deferment of settlement or cancellation of trade, participants are required to seek prior approval from the Exchange. For any dispute arising in respect of the trades or settlement, the exchange has established arbitration mechanism for resolving the same.
Table 6-3: Eligibility Criteria for Securities on WDM Segment
IssuerEligibility Criteria for listing
Public Issue /Private PlacementCorporates (Public limited companies and Private limited companies)
• Paid-up capital of Rs.10 crores; or• Market capitalisation of Rs.25 crores(In case of unlisted companies Networth more than Rs.25 crores)• Credit rating
Public Sector Undertaking, Statutory Corporation established/ constituted under Special Act of Parliament /State Legislature, Local bodies/authorities,
• Credit rating
Mutual Funds:Units of any SEBI registered Mutual Fund/scheme :• Investment objective to invest predominantly
in debt or• Scheme is traded in secondary market as debt
instrument
• Qualifi es for listing under SEBI’s Regulations
Infrastructure companies• Tax exemption and recognition as infrastructure
company under related statutes/regulations
• Qualifi es for listing under the respective Acts, Rules or Regulations under which the securities are issued.
• Credit rating
Financial Institutions u/s. 4A of Companies Act, 1956 including Industrial Development Corporations
Public Issue Private PlacementQualifi es for listing under the respective Acts, Rules or Regulations under which the securities are issued.
Credit rating
Banks • Scheduled banks • Networth of Rs.50 crores or above• Qualifi es for listing under the
respective Acts, Rules or Regulations under which the securities are issued.
• Scheduled Banks• Networth of Rs.50 crores or
above• Credit rating
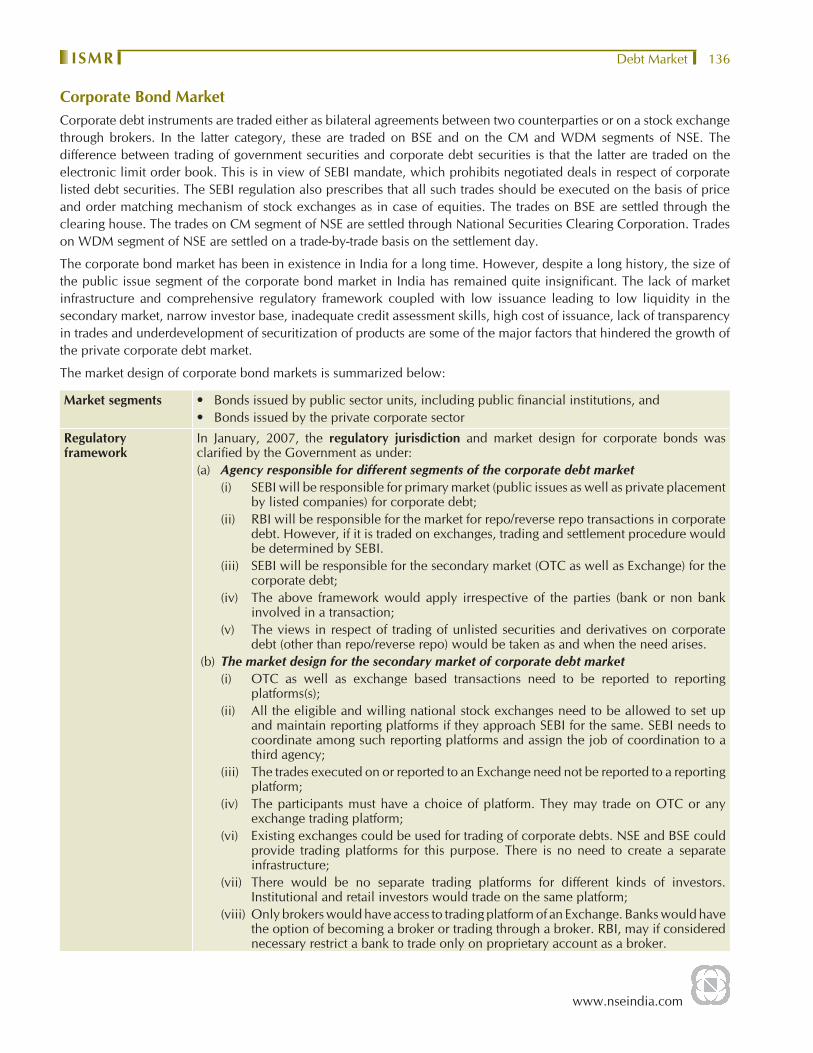
www.nseindia.com
Debt MarketISMR 136
Corporate Bond MarketCorporate debt instruments are traded either as bilateral agreements between two counterparties or on a stock exchange through brokers. In the latter category, these are traded on BSE and on the CM and WDM segments of NSE. The difference between trading of government securities and corporate debt securities is that the latter are traded on the electronic limit order book. This is in view of SEBI mandate, which prohibits negotiated deals in respect of corporate listed debt securities. The SEBI regulation also prescribes that all such trades should be executed on the basis of price and order matching mechanism of stock exchanges as in case of equities. The trades on BSE are settled through the clearing house. The trades on CM segment of NSE are settled through National Securities Clearing Corporation. Trades on WDM segment of NSE are settled on a trade-by-trade basis on the settlement day.
The corporate bond market has been in existence in India for a long time. However, despite a long history, the size of the public issue segment of the corporate bond market in India has remained quite insignifi cant. The lack of market infrastructure and comprehensive regulatory framework coupled with low issuance leading to low liquidity in the secondary market, narrow investor base, inadequate credit assessment skills, high cost of issuance, lack of transparency in trades and underdevelopment of securitization of products are some of the major factors that hindered the growth of the private corporate debt market.
The market design of corporate bond markets is summarized below:
Market segments • Bonds issued by public sector units, including public fi nancial institutions, and• Bonds issued by the private corporate sector
Regulatory framework
In January, 2007, the regulatory jurisdiction and market design for corporate bonds was clarifi ed by the Government as under:(a) Agency responsible for different segments of the corporate debt market (i) SEBI will be responsible for primary market (public issues as well as private placement
by listed companies) for corporate debt; (ii) RBI will be responsible for the market for repo/reverse repo transactions in corporate
debt. However, if it is traded on exchanges, trading and settlement procedure would be determined by SEBI.
(iii) SEBI will be responsible for the secondary market (OTC as well as Exchange) for the corporate debt;
(iv) The above framework would apply irrespective of the parties (bank or non bank involved in a transaction;
(v) The views in respect of trading of unlisted securities and derivatives on corporate debt (other than repo/reverse repo) would be taken as and when the need arises.
(b) The market design for the secondary market of corporate debt market (i) OTC as well as exchange based transactions need to be reported to reporting
platforms(s); (ii) All the eligible and willing national stock exchanges need to be allowed to set up
and maintain reporting platforms if they approach SEBI for the same. SEBI needs to coordinate among such reporting platforms and assign the job of coordination to a third agency;
(iii) The trades executed on or reported to an Exchange need not be reported to a reporting platform;
(iv) The participants must have a choice of platform. They may trade on OTC or any exchange trading platform;
(vi) Existing exchanges could be used for trading of corporate debts. NSE and BSE could provide trading platforms for this purpose. There is no need to create a separate infrastructure;
(vii) There would be no separate trading platforms for different kinds of investors. Institutional and retail investors would trade on the same platform;
(viii) Only brokers would have access to trading platform of an Exchange. Banks would have the option of becoming a broker or trading through a broker. RBI, may if considered necessary restrict a bank to trade only on proprietary account as a broker.

www.nseindia.com
Debt Market ISMR137
Trade reporting platforms
BSE operationalised its reporting platform to capture information related to trading in corporate bond market in January 2007. NSE set up its reporting platform in March, 2007.Further, Fixed Income Money Market and Derivatives Association of India (FIMMDA) proposed to set up a reporting platform for corporate bonds and also provide value added dissemination of information on corporate bonds as in the case of government securities. SEBI granted permission to FIMMDA and thus, its reporting platform was operationalised in September, 2007.Accordingly, for reporting of OTC trades the concerned parties could opt to report their trades on any one of the three reporting platforms.
Trading platforms In April, 2007 SEBI permitted both BSE and NSE to have in place corporate bond trading platforms and advised both the exchanges advises them that the stock exchanges may provide their services for clearing and settlement of corporate bonds traded or the entities trading in listed corporate debt securities may settle their trades bilaterally.BSE and NSE trading platforms became operational in July 2007. Initially, trade matching platforms at BSE and NSE are order driven with the essential features of OTC market.
Market Outcome
Primary Market
Resource Mobilization
During 2007-08, the central government and state governments borrowed Rs.1,882,050 million (US $ 47,087 million) and Rs.677,790 million (US $ 16,957 million) respectively. The gross borrowings of the central and state governments taken together increased by 27.87 % from Rs. 2,001,980 million (US $ 45,928 million) during 2006-07 to Rs. 2,559,840 million (US $ 64,044 million) during 2007-08 (Table 6-4). Their net borrowings also increased by 8.30 % from Rs. 1,255,440 million (US $ 28,801 million) in the previous year to Rs. 1,151,264 million (US $ 28,803 million) during 2007-08. The gross and net market borrowings of central government are budgeted to increase further to Rs. 1,757,800 million while those of the state governments are budgeted to increased to Rs. 590,620 million and Rs. 447,370 million in the same period.
The Central Government mobilised Rs. 1,560,000 million (US $ 39,029 million) through issue of dated securities and Rs. 322,050 million (US $ 8,057 million) through issue of T-bills. After meeting repayment liabilities of Rs.453,290 million US $ 11,341 million) for dated securities, and redemption of T-bills of Rs. 322,050 million (US $ 8,057 million), net market borrowing of Central Government amounted to Rs. 1,095,040 million (US $ 27,397 million) for the year 2007-08. The state governments collectively raised Rs. 677,790 million (US $ 16,957 million) during 2007-08 as against Rs. 208,250 million (US $ 4,777 million) in the preceding year. The net borrowings of State Governments in 2007-08 amounted to Rs. 562,240 million (US $ 14,067 million). (Table 6-4)
Yields
The year 2007-08 witnessed a rise in interest rates on market borrowings across maturities. This was largely due to comfortable liquidity position during the fi scal year 2007-08, however there were some pressures during the fi rst quarter of the year and in July 2007. The yields on primary issues of dated government securities hardened during the year with the cut-off yield varying between 7.55% and 8.64% during 2007-08 as against the range of 7.06% to 8.75% during the preceding year. Barring the sharp dip in yields on July 18, 2007 and easing of yields in February and March 2008, refl ecting easy liquidity conditions and very low short term interest rates, the yields during 2007-08 were higher than their respective levels a year ago. The fi rming up of yields refl ected higher money market interest rates, removal of the ceiling on absorption through reverse repo and hikes in the cash reserve ratio. International developments particulary the cut in the Fed Funds target rate led to softening of rates in October 2007 and January 2008. A notable feature during
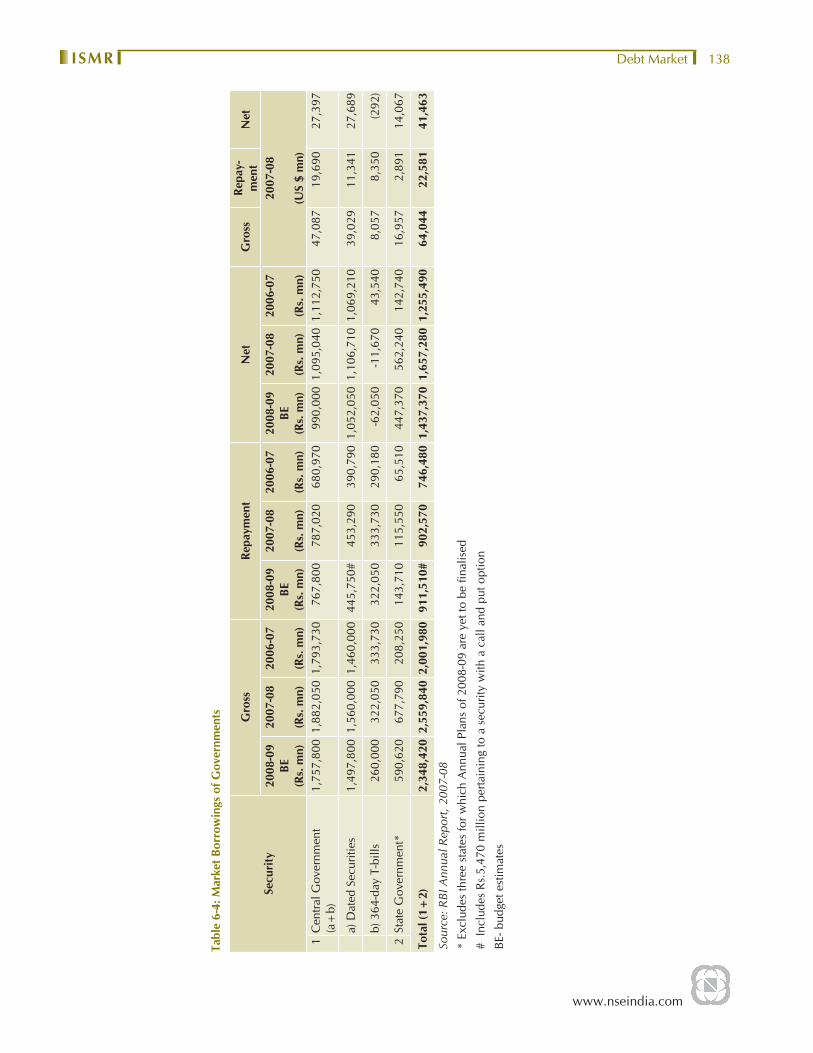
www.nseindia.com
Debt MarketISMR 138
Tabl
e 6-
4: M
arke
t Bor
row
ings
of G
over
nmen
ts
Secu
rity
Gro
ssRe
paym
ent
Net
Gro
ssRe
pay-
men
tN
et
2008
-09
BE(R
s. m
n)
2007
-08
(Rs.
mn)
2006
-07
(Rs.
mn)
2008
-09
BE(R
s. m
n)
2007
-08
(Rs.
mn)
2006
-07
(Rs.
mn)
2008
-09
BE(R
s. m
n)
2007
-08
(Rs.
mn)
2006
-07
(Rs.
mn)
2007
-08
(US
$ m
n)1
Cen
tral G
over
nmen
t (a
+b)
1,75
7,80
0 1,
882,
050
1,79
3,73
076
7,80
078
7,02
068
0,97
099
0,00
01,
095,
040
1,11
2,75
047
,087
19,
690
27,3
97
a) D
ated
Sec
uriti
es1,
497,
800
1,56
0,00
0 1,
460,
000
445,
750#
453,
290
390,
790
1,05
2,05
01,
106,
710
1,06
9,21
039
,029
11,
341
27,6
89
b) 3
64-d
ay T
-bill
s 2
60,0
00
322
,050
33
3,73
032
2,05
033
3,73
029
0,18
0-6
2,05
0-1
1,67
043
,540
8,05
7 8
,350
(2
92)
2St
ate
Gov
ernm
ent*
590
,620
6
77,7
90
208,
250
143,
710
115,
550
65,5
1044
7,37
056
2,24
014
2,74
016
,957
2,8
91
14,0
67
Tota
l (1+
2)2,
348,
420
2,55
9,84
0 2,
001,
980
911,
510#
902,
570
746,
480
1,43
7,37
01,
657,
280
1,25
5,49
064
,044
22,
581
41,4
63
Sour
ce: R
BI A
nnua
l Rep
ort,
2007
-08
* Ex
clud
es th
ree
stat
es fo
r whi
ch A
nnua
l Pla
ns o
f 200
8-09
are
yet
to b
e fi n
alis
ed
# In
clud
es R
s.5,
470
mill
ion
perta
inin
g to
a s
ecur
ity w
ith a
cal
l and
put
opt
ion
BE- b
udge
t est
imat
es

www.nseindia.com
Debt Market ISMR139
2007-08 was a better management of the usually tight year-end liquidity conditions during 2006-07. The weighted average yield on government dated securities increased to 8.12% in 2007-08 from 7.89% in 2006-07 (Table 6-5).
Table 6-5: Profi le of Central Government Dated Securities(Amount in Rs. mn.) (Amount in US $ mn.)
Items 2006-07 2007-08 2006-07 2007-08
1 Gross Borrowing 1,460,000 1,560,000 33,494 39,029
2 Repayments 390,840 453,290 8,966 11,341
3 Net Borrowings 1,069,160 1,106,710 24,528 27,689
4 Weighted Average Maturity (In years) 14.75 14.90 N.A N.A
5 Weighted Average Yield (Per cent) 7.89 8.12 N.A N.A
6 (A) Maturity Distribution (Amount)
a Upto 5 years 100,000 - 2,294 -
b Above 5 and upto 10 years 690,000 890,000 15,829 22,267
c Above 10 years 670,000 670,000 15,370 16,763
Total 1,460,000 1,560,000 33,494 39,029
(B) Maturity Distribution (Per cent)
a Upto 5 years 7 0 N.A N.A
b Above 5 and upto 10 years 47 57 N.A N.A
c Above 10 years 46 43 N.A N.A
Total 100 100 N.A N.A
7 Price based Auctions Amount 1,320,000 1,500,000 30,282 37,528
8 Yield - (Per cent)
Minimum 7.06(6 years, 1 month)
7.55(9 years, 6 months)
N.A N.A
Maximum 8.75(28 years, 1 month)
8.64(29 years, 7 months)
N.A N.A
9 Yield - Maturity Distribution-wise
(A) Less than 10 years
Minimum 7.06(6 years, 1 month)
7.55(9 years, 6 months)
N.A N.A
Maximum 8.29(9 years, 9 months)
8.44(9 years, 10 months)
N.A N.A
(B) 10 years
Minimum 7.59 7.99 N.A N.A
Maximum 7.59 7.99 N.A N.A
(C) Above 10 years
Minimum 7.43(10 years 1 month)
7.62(14 years)
N.A N.A
Maximum 8.75(28 years, 1 month)
8.64(29 years)
N.A N.A
Note: Figures in brackets indicate residual maturity in years.N.A Not applicableSource: RBI Annual Report 2007-08
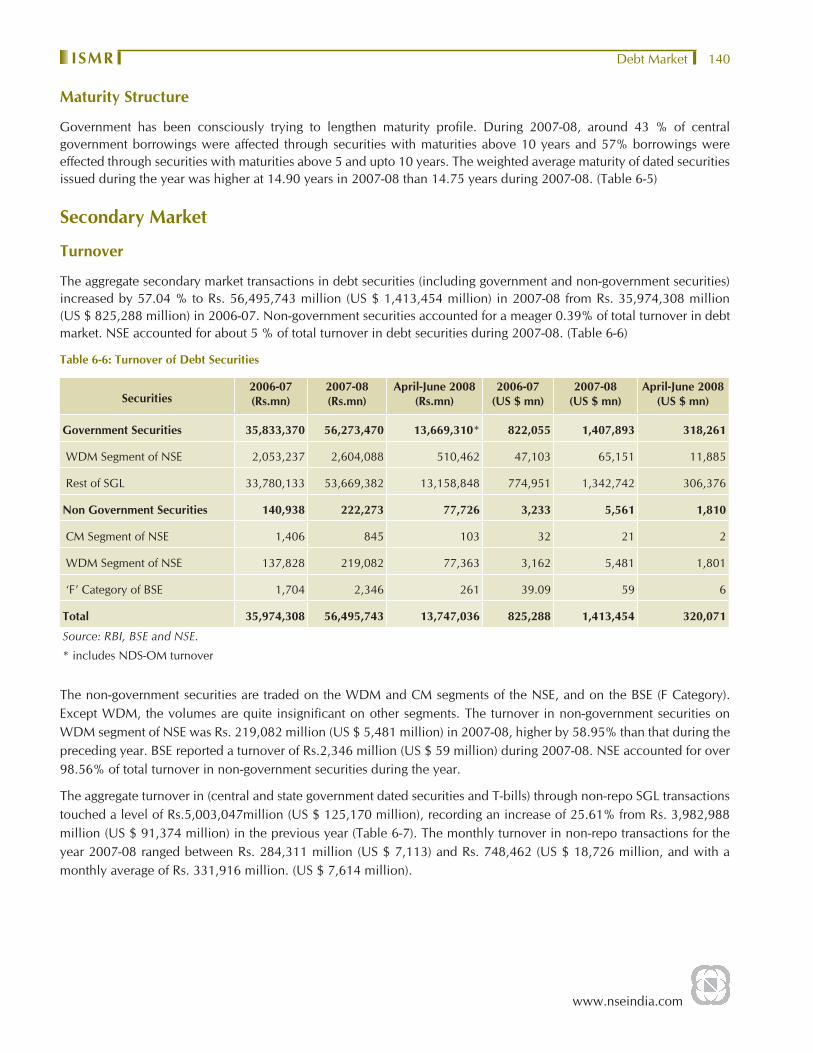
www.nseindia.com
Debt MarketISMR 140
Maturity Structure
Government has been consciously trying to lengthen maturity profi le. During 2007-08, around 43 % of central government borrowings were affected through securities with maturities above 10 years and 57% borrowings were effected through securities with maturities above 5 and upto 10 years. The weighted average maturity of dated securities issued during the year was higher at 14.90 years in 2007-08 than 14.75 years during 2007-08. (Table 6-5)
Secondary Market
Turnover
The aggregate secondary market transactions in debt securities (including government and non-government securities) increased by 57.04 % to Rs. 56,495,743 million (US $ 1,413,454 million) in 2007-08 from Rs. 35,974,308 million (US $ 825,288 million) in 2006-07. Non-government securities accounted for a meager 0.39% of total turnover in debt market. NSE accounted for about 5 % of total turnover in debt securities during 2007-08. (Table 6-6)
Table 6-6: Turnover of Debt Securities
Securities2006-07(Rs.mn)
2007-08(Rs.mn)
April-June 2008(Rs.mn)
2006-07(US $ mn)
2007-08(US $ mn)
April-June 2008(US $ mn)
Government Securities 35,833,370 56,273,470 13,669,310* 822,055 1,407,893 318,261
WDM Segment of NSE 2,053,237 2,604,088 510,462 47,103 65,151 11,885
Rest of SGL 33,780,133 53,669,382 13,158,848 774,951 1,342,742 306,376
Non Government Securities 140,938 222,273 77,726 3,233 5,561 1,810
CM Segment of NSE 1,406 845 103 32 21 2
WDM Segment of NSE 137,828 219,082 77,363 3,162 5,481 1,801
‘F’ Category of BSE 1,704 2,346 261 39.09 59 6
Total 35,974,308 56,495,743 13,747,036 825,288 1,413,454 320,071
Source: RBI, BSE and NSE.
* includes NDS-OM turnover
The non-government securities are traded on the WDM and CM segments of the NSE, and on the BSE (F Category). Except WDM, the volumes are quite insignifi cant on other segments. The turnover in non-government securities on WDM segment of NSE was Rs. 219,082 million (US $ 5,481 million) in 2007-08, higher by 58.95% than that during the preceding year. BSE reported a turnover of Rs.2,346 million (US $ 59 million) during 2007-08. NSE accounted for over 98.56% of total turnover in non-government securities during the year.
The aggregate turnover in (central and state government dated securities and T-bills) through non-repo SGL transactions touched a level of Rs.5,003,047million (US $ 125,170 million), recording an increase of 25.61% from Rs. 3,982,988 million (US $ 91,374 million) in the previous year (Table 6-7). The monthly turnover in non-repo transactions for the year 2007-08 ranged between Rs. 284,311 million (US $ 7,113) and Rs. 748,462 (US $ 18,726 million, and with a monthly average of Rs. 331,916 million. (US $ 7,614 million).

www.nseindia.com
Debt Market ISMR141
Table 6-7: Secondary Market Transactions in Government Securities
Month/ Year
SGL Non-Repo Transactions* Share in Non-Repo Turnover (%)
GOI Securities(Rs mn)
Treasury Bills(Rs mn)
Total (1+2)(Rs mn)
Total (1+2)(US $ mn)
GOI Securities T-Bills
1 2 3 4 5 61994-95 115,860 97,210 213,070 6,779 54.38 45.62
1995-96 180,170 115,130 295,300 8,597 61.01 38.99
1996-97 604,990 334,220 939,210 26,176 64.41 35.59
1997-98 1,198,890 412,010 1,610,900 40,751 74.42 25.58
1998-99 1,446,410 428,900 1,875,310 44,197 77.13 22.87
1999-00 4,089,160 475,750 4,564,910 104,651 89.58 10.42
2000-01 5,120,836 600,620 5,721,456 122,673 89.50 10.50
2001-02 11,446,342 673,316 12,119,658 248,354 94.44 5.56
2002-03 13,155,989 767,845 13,923,834 293,133 94.49 5.51
2003-04 15,813,076 1,200,556 17,013,632 392,110 92.94 7.06
2004-05 9,897,351 2,711,314 12,608,665 288,198 78.50 21.50
2005-06 4,986,040 2,094,107 12,066,187 270,482 41.32 17.36
2006-07 2,747,384 1,235,603 3,982,988 91,374 68.98 31.02
Apr-07 223,875 91,824 315,699 7,898 70.91 29.09
May-07 182,332 101,980 284,311 7,113 64.13 35.87
Jun-07 183,785 131,614 315,398 7,891 58.27 41.73
Jul-07 373,586 162,526 536,112 13,413 69.68 30.32
Aug-07 262,052 122,512 384,564 9,621 68.14 31.86
Sep-07 205,883 87,602 293,485 7,343 70.15 29.85
Oct-07 294,170 265,846 560,016 14,011 52.53 47.47
Nov-07 202,519 108,227 310,746 7,774 65.17 34.83
Dec-07 394,422 102,127 496,549 12,423 79.43 20.57
Jan-08 603,446 145,016 748,462 18,726 80.62 19.38
Feb-08 372,314 73,835 446,149 11,162 83.45 16.55
Mar-08 243,376 68,178 311,554 7,795 78.12 21.88
2007-08 3,541,760 1,461,287 5,003,047 125,170 70.79 29.21
Apr-08 329,338 81,756 411,094 9,571 80.11 19.89
May-08 301,869 66,964 368,833 8,587 81.84 18.16
Jun-08 519,832 65,194 585,027 13,621 88.86 11.14
April-June 2008 1,151,039 213,915 1,364,953 31,780 84.33 15.67Source : NSE*excludes NDS-OM turnover
The share of WDM segment of NSE in the total turnover of Non-repo SGL transaction witnessed a marginal increase from 51.55% in 2006-07 to 52.05% in 2007-08 (Table 6-8). The share of WDM in turnover of non-repo dated securities (central and state government securities) also witnessed a decrease from 55.82% in 2006-07 to 54.89% in 2007-08 (Chart 6-1). In the year 2007-08, the share of WDM in turnover of non-repo T-bills has rose to 45.16 % as compared to 42.05 % in the previous year.
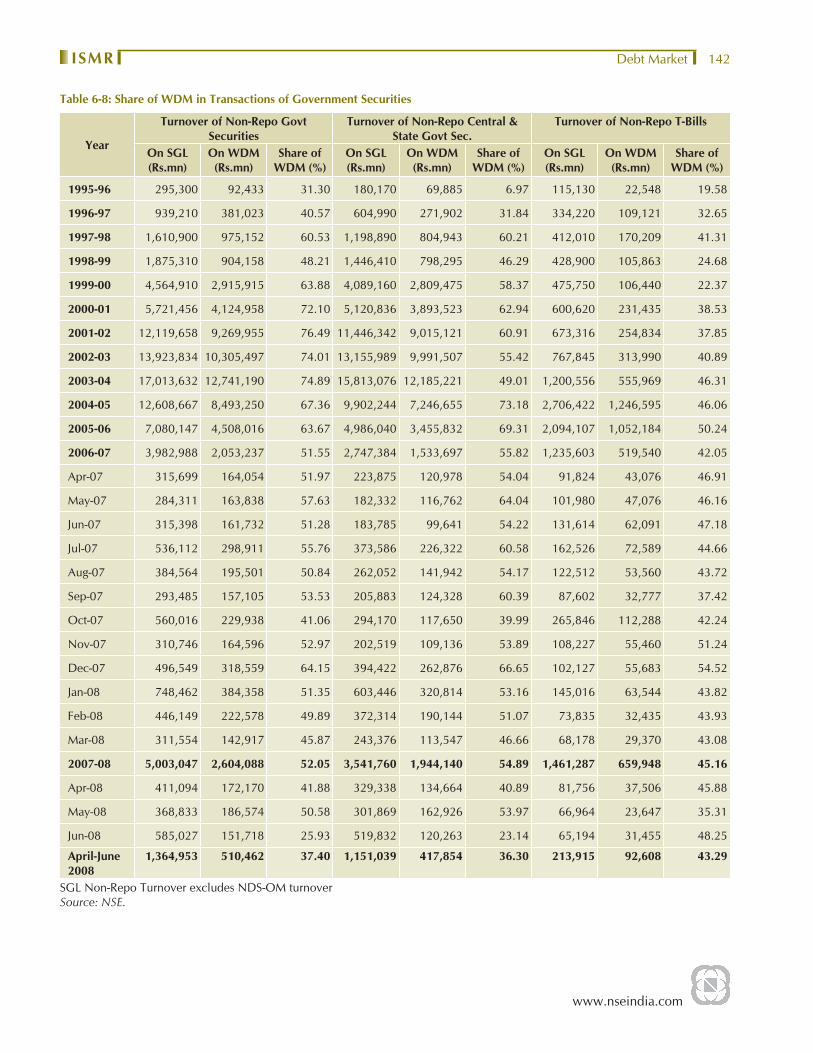
www.nseindia.com
Debt MarketISMR 142
Table 6-8: Share of WDM in Transactions of Government Securities
Year
Turnover of Non-Repo Govt Securities
Turnover of Non-Repo Central & State Govt Sec.
Turnover of Non-Repo T-Bills
On SGL (Rs.mn)
On WDM(Rs.mn)
Share of WDM (%)
On SGL (Rs.mn)
On WDM(Rs.mn)
Share of WDM (%)
On SGL (Rs.mn)
On WDM(Rs.mn)
Share of WDM (%)
1995-96 295,300 92,433 31.30 180,170 69,885 6.97 115,130 22,548 19.58
1996-97 939,210 381,023 40.57 604,990 271,902 31.84 334,220 109,121 32.65
1997-98 1,610,900 975,152 60.53 1,198,890 804,943 60.21 412,010 170,209 41.31
1998-99 1,875,310 904,158 48.21 1,446,410 798,295 46.29 428,900 105,863 24.68
1999-00 4,564,910 2,915,915 63.88 4,089,160 2,809,475 58.37 475,750 106,440 22.37
2000-01 5,721,456 4,124,958 72.10 5,120,836 3,893,523 62.94 600,620 231,435 38.53
2001-02 12,119,658 9,269,955 76.49 11,446,342 9,015,121 60.91 673,316 254,834 37.85
2002-03 13,923,834 10,305,497 74.01 13,155,989 9,991,507 55.42 767,845 313,990 40.89
2003-04 17,013,632 12,741,190 74.89 15,813,076 12,185,221 49.01 1,200,556 555,969 46.31
2004-05 12,608,667 8,493,250 67.36 9,902,244 7,246,655 73.18 2,706,422 1,246,595 46.06
2005-06 7,080,147 4,508,016 63.67 4,986,040 3,455,832 69.31 2,094,107 1,052,184 50.24
2006-07 3,982,988 2,053,237 51.55 2,747,384 1,533,697 55.82 1,235,603 519,540 42.05
Apr-07 315,699 164,054 51.97 223,875 120,978 54.04 91,824 43,076 46.91
May-07 284,311 163,838 57.63 182,332 116,762 64.04 101,980 47,076 46.16
Jun-07 315,398 161,732 51.28 183,785 99,641 54.22 131,614 62,091 47.18
Jul-07 536,112 298,911 55.76 373,586 226,322 60.58 162,526 72,589 44.66
Aug-07 384,564 195,501 50.84 262,052 141,942 54.17 122,512 53,560 43.72
Sep-07 293,485 157,105 53.53 205,883 124,328 60.39 87,602 32,777 37.42
Oct-07 560,016 229,938 41.06 294,170 117,650 39.99 265,846 112,288 42.24
Nov-07 310,746 164,596 52.97 202,519 109,136 53.89 108,227 55,460 51.24
Dec-07 496,549 318,559 64.15 394,422 262,876 66.65 102,127 55,683 54.52
Jan-08 748,462 384,358 51.35 603,446 320,814 53.16 145,016 63,544 43.82
Feb-08 446,149 222,578 49.89 372,314 190,144 51.07 73,835 32,435 43.93
Mar-08 311,554 142,917 45.87 243,376 113,547 46.66 68,178 29,370 43.08
2007-08 5,003,047 2,604,088 52.05 3,541,760 1,944,140 54.89 1,461,287 659,948 45.16
Apr-08 411,094 172,170 41.88 329,338 134,664 40.89 81,756 37,506 45.88
May-08 368,833 186,574 50.58 301,869 162,926 53.97 66,964 23,647 35.31
Jun-08 585,027 151,718 25.93 519,832 120,263 23.14 65,194 31,455 48.25
April-June 2008
1,364,953 510,462 37.40 1,151,039 417,854 36.30 213,915 92,608 43.29
SGL Non-Repo Turnover excludes NDS-OM turnoverSource: NSE.

www.nseindia.com
Debt Market ISMR143
Chart 6-1: Share of WDM in Non-Repo Government Transaction
Settlement of Trades in Government Securities
During 2007-08, 215,455 trades in government securities amounting to Rs.56,026,020 million were settled by CCIL . Out of the total trades, 88% of the trades were outright transactions and the rest were Repo.(Table 6-9).
Table 6-9: Settlement of Trades in Government Securities
Month
Outright Transactions Repo Transactions Total
No. of Trades Amount (Face Value in
Rs.mn)
No. of Trades Amount (Face Value in
Rs.mn)
No. of Trades Amount (Face Value in
Rs.mn)
Amount (Face Value in US $ mn)
2001-02 7,131 389,190 524 159,300 7,655 548,480 11,239
2002-03 191,843 10,761,470 11,672 4,682,290 203,515 15,443,760 325,131
2003-04 243,585 15,751,330 20,972 9,431,890 264,512 25,183,220 580,392
2004-05 160,682 11,342,221 24,364 15,579,066 185,046 26,921,287 615,344
2005-06 125,509 8,647,514 25,673 16,945,087 151,182 25,592,601 573,696
2006-07 137,100 10,215,357 29,008 25,565,014 166,108 35,780,371 802,071
2007-08 188,843 16,538,512 26,612 39,487,508 215,455 56,026,020 1,401,702
April-June 2008 39,161 3,612,876 5,648 9,940,022 44,809 13,552,898 315,551
Source:CCIL Fact Book
Developments in WDM Segment of NSE
A total of 858 securities with a total outstanding debt of Rs. 5,225,106 million (US $ 130,726 million) were made available for trading in 2007-08. As at end March 2008, 3,566 securities were available for trading on the WDM Segment. Of which 601 securities were active during 2007-08 as compared to 762 in the previous year.
During 2007-08, the turnover in the WDM segment of NSE registered an increase of 28.84% to Rs.2,823,170 million (US$ 70,632 million) from Rs. 2,191,065 million (US $ 50,265 million) in 2006-07. The average daily turnover also increased from Rs. 8,980 million (US $ 206.01 million) to Rs.11,380 million (US$ 284.71 million) during the same period.

www.nseindia.com
Debt MarketISMR 144
However, the average trade size increased from Rs.111.90 million (US $ 2.57 million) to Rs.174.50 (US$ 4.37 million) in 2007-08.The summary statement of business growth of WDM segment is presented in Table 6-10, Annexure 6-1 and Chart 6-2.
Table 6-10: Business Growth of WDM Segment of NSE
Parameter 2006-07 2007-08 April-June 2008
No. of Active Securities 762 601 449
No. of Trades 19,575 16,179 3172
No. of Retail Trades 399 211 115
Turnover (Rs. mn.) 2,191,065 2,823,170 587,825
Turnover (Rs.US $ mn) 50,265 70,632 13,686
Average Daily Turnover (Rs. mn.) 8,980 11,380 475
Average Daily Turnover (US $ mn) 206.01 284.71 11.05
Retail Turnover (Rs. mn.) 1,015 490 228
Retail Turnover (US $ mn) 23.29 12.26 5.31
Share of Retail Trades (%) 0.05 0.02 0.04
Average Trade Size (Rs. mn.) 111.9 174.50 185.32
Average Trade Size (US $ mn) 2.57 4.37 4.31
Average Size of Retail Trade (Rs. Mn.) 2.54 2.32 1.98
Average Size of Retail Trade (US $ mn) 0.06 0.06 0.05
Source: NSE.
Chart 6-2: Business Growth of WDM Segment
The highest turnover of Rs. 427,242 million (US $ 10,689 million) was witnessed in January 2008. The average daily turnover ranged between Rs.8,255 million (US $ 207million) and Rs. 18,576 million (US $ 465 million).

www.nseindia.com
Debt Market ISMR145
Securities Profi le
Long-term securities dominated the market during 2007-08 revealing the interest of investors to hold on to long term of assets. The turnover in Government securities increased by 26.72% in 2007-08 as compared to the previous year, and accounted for a turnover of Rs.1,943,442 million (US $ 48,623 million). Its share in total turnover was 68.84% in the 2007-08. (Table 6-11). The share of T-Bills in WDM turnover accounted for a share of 23.40% during 2007-08. The PSU bonds witnessed a signifi cant growth of 109% in turnover and amounted to Rs. 61,501 million (US $ 1,539 million) in 2007-08 as against Rs.23,038 million (US $ 529 million) in 2006-07. (Chart 6-3).
Table 6-11: Security-wise Distribution of WDM Turnover
Month/Year
Turnover (Rs. mn) Turnover (percent)Government
SecuritiesT-Bills PSU/ Inst.
BondsOthers Total
WDM Turnover
Government Securities
T-Bills PSU/ Inst. Bonds
Others
1994-95 (June-March) 30,264 26,337 8,239 2,970 67,812 44.63 38.84 12.15 4.38
1995-96 77,294 22,596 11,495 7,292 118,677 65.13 19.04 9.69 6.14
1996-97 273,522 109,570 27,692 11,992 422,776 64.70 25.92 6.55 2.84
1997-98 847,159 188,703 40,500 36,272 1,112,633 76.14 16.96 3.64 3.26
1998-99 845,757 107,051 50,414 51,469 1,054,691 80.19 10.15 4.78 4.88
1999-00 2,828,906 110,126 48,675 54,455 3,042,162 92.99 3.62 1.60 1.79
2000-01 3,909,520 231,434 78,859 66,002 4,285,815 91.22 5.40 1.84 1.54
2001-02 9,021,049 255,742 109,874 86,194 9,471,912 95.24 2.70 1.16 0.91
2002-03 10,005,182 322,748 199,847 159,237 10,687,014 93.62 3.02 1.87 1.49
2003-04 12,187,051 556,709 271,116 146,087 13,160,962 92.60 4.23 2.06 1.11
2004-05 7,248,302 1,248,422 178,346 197,866 8,872,936 81.69 14.07 2.01 2.23
2005-06 3,455,629 1,052,333 121,734 125,538 4,755,235 72.67 22.13 2.56 2.64
2006-07 1,533,697 519,541 44,178 93,648 2,191,065 70.00 23.71 2.02 4.27
Apr-07 120,986 43,068 1,647 5,885 171,587 70.51 25.10 0.96 3.43
May-07 116,055 47,782 1,853 9,144 174,835 66.38 27.33 1.06 5.23
Jun-07 99,643 62,095 2,566 9,049 173,352 57.48 35.82 1.48 5.22
Jul-07 226,321 72,600 22,960 16,265 338,146 66.93 21.47 6.79 4.81
Aug-07 141,934 53,555 8,894 9,922 214,305 66.23 24.99 4.15 4.63
Sep-07 124,334 32,774 3,668 8,265 169,024 73.56 19.39 2.17 4.89
Oct-07 117,651 112,298 12,747 12,237 254,932 46.15 44.05 5.00 4.80
Nov-07 109,145 55,466 4,550 7,878 177,039 61.65 31.33 2.57 4.45
Dec-07 262,890 55,674 3,155 6,935 328,654 79.99 16.94 0.96 2.11
Jan-08 320,816 63,531 16,192 26,703 427,242 75.09 14.87 3.79 6.25
Feb-08 190,139 32,435 10,074 7,790 240,439 79.08 13.49 4.19 3.24
Mar-08 113,552 29,371 4,009 6,682 153,615 73.92 19.12 2.61 4.35
2007-08 1,943,470 660,622 92,318 126,760 2,823,170 68.84 23.40 3.27 4.49
Apr-08 134,674 37,498 18,858 7,897 198,928 67.7 18.85 9.48 3.97
May-08 162,937 23,651 12,001 7,973 206,563 78.88 11.45 5.81 3.86
Jun-08 120,268 31,453 16,556 14,058 182,334 65.96 17.25 9.08 7.71
April-June 2008 417,854 92,608 29,706 47,657 587,825 71.08 15.75 5.05 8.11 Source : NSE
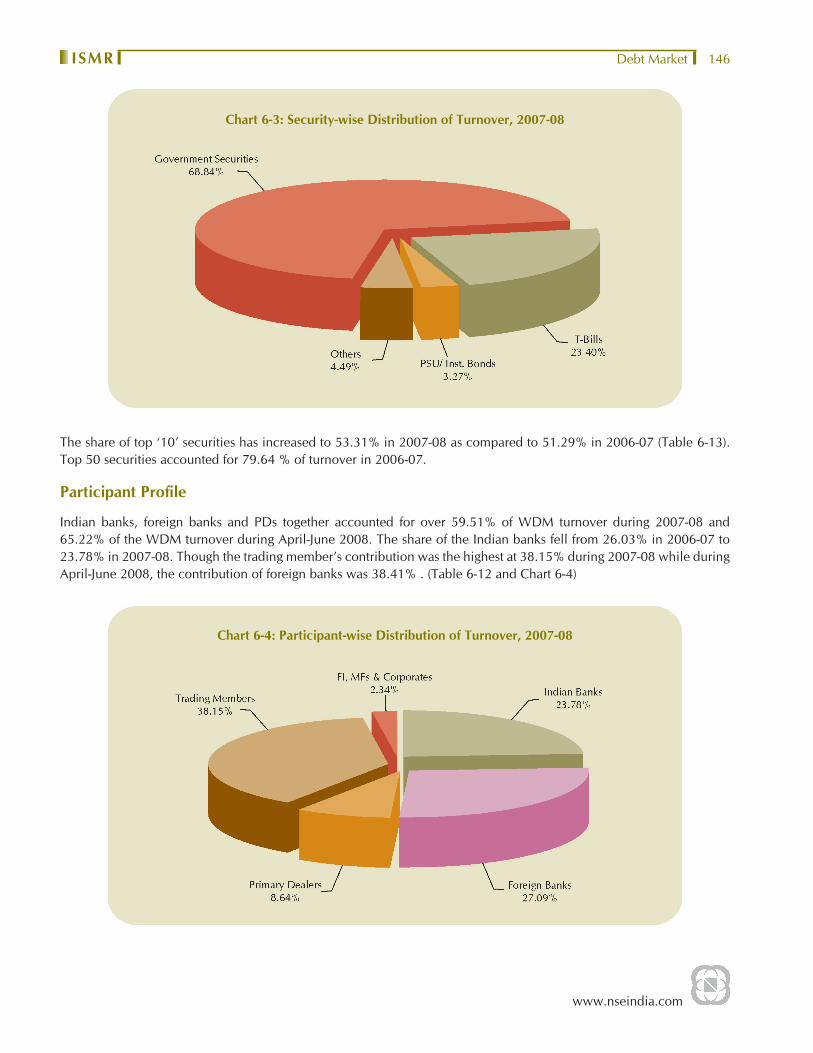
www.nseindia.com
Debt MarketISMR 146
Chart 6-3: Security-wise Distribution of Turnover, 2007-08
The share of top ‘10’ securities has increased to 53.31% in 2007-08 as compared to 51.29% in 2006-07 (Table 6-13). Top 50 securities accounted for 79.64 % of turnover in 2006-07.
Participant Profi le
Indian banks, foreign banks and PDs together accounted for over 59.51% of WDM turnover during 2007-08 and 65.22% of the WDM turnover during April-June 2008. The share of the Indian banks fell from 26.03% in 2006-07 to 23.78% in 2007-08. Though the trading member’s contribution was the highest at 38.15% during 2007-08 while during April-June 2008, the contribution of foreign banks was 38.41% . (Table 6-12 and Chart 6-4)
Chart 6-4: Participant-wise Distribution of Turnover, 2007-08
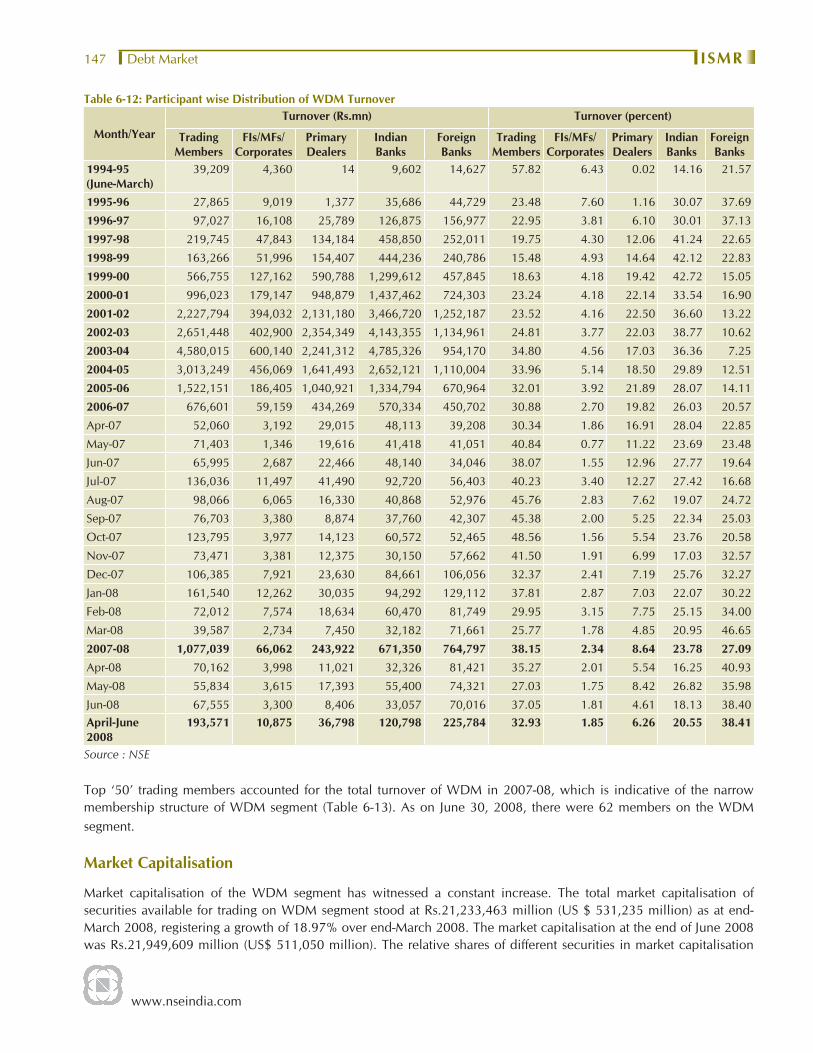
www.nseindia.com
Debt Market ISMR147
Table 6-12: Participant wise Distribution of WDM Turnover
Month/YearTurnover (Rs.mn) Turnover (percent)
Trading Members
FIs/MFs/ Corporates
Primary Dealers
Indian Banks
Foreign Banks
Trading Members
FIs/MFs/ Corporates
Primary Dealers
Indian Banks
Foreign Banks
1994-95 (June-March)
39,209 4,360 14 9,602 14,627 57.82 6.43 0.02 14.16 21.57
1995-96 27,865 9,019 1,377 35,686 44,729 23.48 7.60 1.16 30.07 37.69
1996-97 97,027 16,108 25,789 126,875 156,977 22.95 3.81 6.10 30.01 37.13
1997-98 219,745 47,843 134,184 458,850 252,011 19.75 4.30 12.06 41.24 22.65
1998-99 163,266 51,996 154,407 444,236 240,786 15.48 4.93 14.64 42.12 22.83
1999-00 566,755 127,162 590,788 1,299,612 457,845 18.63 4.18 19.42 42.72 15.05
2000-01 996,023 179,147 948,879 1,437,462 724,303 23.24 4.18 22.14 33.54 16.90
2001-02 2,227,794 394,032 2,131,180 3,466,720 1,252,187 23.52 4.16 22.50 36.60 13.22
2002-03 2,651,448 402,900 2,354,349 4,143,355 1,134,961 24.81 3.77 22.03 38.77 10.62
2003-04 4,580,015 600,140 2,241,312 4,785,326 954,170 34.80 4.56 17.03 36.36 7.25
2004-05 3,013,249 456,069 1,641,493 2,652,121 1,110,004 33.96 5.14 18.50 29.89 12.51
2005-06 1,522,151 186,405 1,040,921 1,334,794 670,964 32.01 3.92 21.89 28.07 14.11
2006-07 676,601 59,159 434,269 570,334 450,702 30.88 2.70 19.82 26.03 20.57
Apr-07 52,060 3,192 29,015 48,113 39,208 30.34 1.86 16.91 28.04 22.85
May-07 71,403 1,346 19,616 41,418 41,051 40.84 0.77 11.22 23.69 23.48
Jun-07 65,995 2,687 22,466 48,140 34,046 38.07 1.55 12.96 27.77 19.64
Jul-07 136,036 11,497 41,490 92,720 56,403 40.23 3.40 12.27 27.42 16.68
Aug-07 98,066 6,065 16,330 40,868 52,976 45.76 2.83 7.62 19.07 24.72
Sep-07 76,703 3,380 8,874 37,760 42,307 45.38 2.00 5.25 22.34 25.03
Oct-07 123,795 3,977 14,123 60,572 52,465 48.56 1.56 5.54 23.76 20.58
Nov-07 73,471 3,381 12,375 30,150 57,662 41.50 1.91 6.99 17.03 32.57
Dec-07 106,385 7,921 23,630 84,661 106,056 32.37 2.41 7.19 25.76 32.27
Jan-08 161,540 12,262 30,035 94,292 129,112 37.81 2.87 7.03 22.07 30.22
Feb-08 72,012 7,574 18,634 60,470 81,749 29.95 3.15 7.75 25.15 34.00
Mar-08 39,587 2,734 7,450 32,182 71,661 25.77 1.78 4.85 20.95 46.65
2007-08 1,077,039 66,062 243,922 671,350 764,797 38.15 2.34 8.64 23.78 27.09Apr-08 70,162 3,998 11,021 32,326 81,421 35.27 2.01 5.54 16.25 40.93
May-08 55,834 3,615 17,393 55,400 74,321 27.03 1.75 8.42 26.82 35.98
Jun-08 67,555 3,300 8,406 33,057 70,016 37.05 1.81 4.61 18.13 38.40 April-June 2008
193,571 10,875 36,798 120,798 225,784 32.93 1.85 6.26 20.55 38.41
Source : NSE
Top ‘50’ trading members accounted for the total turnover of WDM in 2007-08, which is indicative of the narrow membership structure of WDM segment (Table 6-13). As on June 30, 2008, there were 62 members on the WDM segment.
Market Capitalisation
Market capitalisation of the WDM segment has witnessed a constant increase. The total market capitalisation of securities available for trading on WDM segment stood at Rs.21,233,463 million (US $ 531,235 million) as at end-March 2008, registering a growth of 18.97% over end-March 2008. The market capitalisation at the end of June 2008 was Rs.21,949,609 million (US$ 511,050 million). The relative shares of different securities in market capitalisation

www.nseindia.com
Debt MarketISMR 148
maintained the trend of 2006-07 with the Government securities accounting for the highest share of 65.57% of total market capitalisation at the end of March 2008 (Chart 6-5). The growth of market capitalisation of WDM is presented in Table 6-14
Table 6-13: Share of Top ‘N’ Securities/Trading Members/ Participants in Turnover in WDM Segment
YearIn Percent
Top 5 Top 10 Top 25 Top 50 Top 100Securities
1994-95 42.84 61.05 80.46 89.81 97.161995-96 57.59 69.46 79.60 86.58 93.241996-97 32.93 48.02 65.65 78.32 90.171997-98 30.65 46.92 71.25 85.00 92.151998-99 26.81 41.89 64.30 78.24 86.661999-00 37.11 55.57 82.12 90.73 95.282000-01 42.20 58.30 80.73 89.97 95.132001-02 51.61 68.50 88.73 94.32 97.192002-03 43.10 65.15 86.91 92.74 96.132003-04 37.06 54.43 81.58 90.66 95.142004-05 43.70 57.51 71.72 80.59 89.552005-06 47.42 59.78 72.02 81.04 89.362006-07 40.90 51.29 65.82 77.15 86.912007-08 39.65 53.31 68.35 79.64 49.55April-June 2008 40.42 55.55 71.30 84.42 94.38
Trading Members1994-95 51.99 73.05 95.37 100.00 --1995-96 44.36 68.58 96.10 100.00 --1996-97 30.02 51.27 91.57 99.96 100.001997-98 27.17 47.85 83.38 99.82 100.001998-99 29.87 50.45 86.55 99.98 100.001999-00 32.38 53.41 84.46 100.00 --2000-01 35.17 54.25 86.82 100.00 --2001-02 35.18 58.68 88.36 100.00 --2002-03 31.77 53.71 85.49 100.00 --2003-04 30.72 53.01 86.71 100.00 --2004-05 35.75 56.84 86.74 100.00 --2005-06 39.68 60.63 89.38 100.00 --2006-07 57.75 78.01 96.43 100.00 --2007-08 65.32 80.24 97.60 100.00 --April-June 2008 76.16 89.79 99.45 100.00 --
Participants1994-95 18.37 27.38 38.40 42.20 --1995-96 29.66 47.15 70.49 76.32 76.581996-97 25.27 44.92 67.00 76.33 77.101997-98 23.60 38.96 65.59 77.96 80.221998-99 22.47 37.39 62.79 79.27 84.511999-00 15.54 27.87 52.51 74.76 81.322000-01 17.51 28.85 50.64 69.72 76.782001-02 17.49 29.25 50.19 69.16 76.492002-03 17.27 28.29 49.22 68.14 75.202003-04 16.66 25.69 44.25 59.87 65.172004-05 16.82 28.64 47.24 61.71 66.002005-06 17.50 30.53 53.61 65.84 67.972006-07 25.85 40.65 59.99 68.17 69.092007-08 28.36 40.64 55.58 61.77 61.84April-June 2008 34.39 47.87 62.83 67.08 67.09
Source: NSE.

www.nseindia.com
Debt Market ISMR149
Tabl
e 6-
14: M
arke
t Cap
italis
atio
n of
WD
M S
ecur
ities
Mon
th/Y
ear
(end
of
per
iod)
Mar
ket C
apita
lisat
ion
(In R
s. m
n.)
(In p
er c
ent)
Gov
t. Se
curi
ties
PSU
bon
dsSt
ate
loan
sT-
bills
Oth
ers
Tota
lTo
tal (
US
$ m
n.)
Gov
t. se
curi
ties
PSU
bon
ds
Stat
e lo
ans
T-bi
lls
Oth
ers
Mar
-00
3,19
8,65
039
3,57
039
4,77
015
3,45
079
9,89
04,
940,
330
113,
257
64.7
57.
977.
993.
1116
.19
Mar
-01
3,97
2,28
036
3,65
044
6,24
017
7,25
084
8,94
05,
808,
360
124,
536
68.3
96.
267.
683.
0514
.62
Mar
-02
5,42
6,01
039
9,44
061
3,85
023
8,49
089
0,16
07,
567,
950
155,
081
71.7
05.
288.
113.
1511
.76
Mar
-03
6,58
0,01
738
3,82
872
0,94
034
9,18
861
0,83
98,
644,
812
181,
996
76.1
24.
448.
344.
047.
06
Mar
-04
9,59
3,01
756
8,31
979
3,40
332
6,92
087
6,97
912
,158
,638
280,
218
78.9
04.
676.
532.
697.
21
Mar
-05
10,0
61,0
7068
3,98
12,
232,
082
735,
018
905,
193
14,6
17,3
4433
4,11
168
.83
4.68
15.2
75.
036.
19
Mar
-06
10,5
97,8
9088
7,16
02,
419,
270
701,
860
1,06
9,56
015
,675
,740
351,
395
67.6
15.
6615
.43
4.48
6.82
Mar
-07
11,8
22,7
77
896
,275
2
,498
,474
1
,151
,827
1
,478
,652
17
,848
,006
40
9,45
266
.24
5.02
14.0
06.
458.
28
Apr
-07
11,8
81,8
45
902
,892
2
,458
,876
1
,194
,330
1
,531
,337
17
,969
,280
44
9,56
966
.12
5.02
13.6
86.
658.
53
May
-07
11,9
37,4
86
902
,926
2
,471
,047
1
,258
,924
1
,556
,343
18
,126
,726
45
3,50
865
.86
4.98
13.6
36.
958.
58
Jun-
0712
,161
,753
8
89,4
04
2,5
03,9
89
1,4
43,7
52
1,6
16,1
91
18,6
15,0
89
465,
727
65.3
34.
7813
.45
7.76
8.68
Jul-0
712
,523
,073
9
12,9
95
2,4
76,1
40
1,5
05,1
34
1,6
28,6
61
19,0
46,0
03
476,
507
65.7
54.
7913
.00
7.90
8.55
Aug
-07
12,6
83,4
36
902
,834
2
,556
,007
1
,549
,239
1
,676
,548
19
,368
,064
48
4,56
565
.49
4.66
13.2
08.
008.
66
Sep-
0712
,821
,085
9
14,6
71
2,5
86,8
26
1,4
54,3
68
1,7
68,9
15
19,5
45,8
65
489,
013
65.5
94.
6813
.23
7.44
9.05
Oct
-07
13,0
95,7
94
920
,936
2
,633
,288
1
,554
,732
1
,805
,854
20
,010
,603
50
0,64
165
.44
4.60
13.1
67.
779.
02
Nov
-07
13,1
49,8
48
946
,256
2
,686
,667
1
,436
,503
1
,848
,156
20
,067
,429
50
2,06
265
.53
4.72
13.3
97.
169.
21
Dec
-07
13,1
84,1
87
942
,875
2
,789
,658
1
,241
,693
1
,867
,399
20
,025
,812
50
1,02
165
.84
4.71
13.9
36.
209.
32
Jan-
0813
,574
,854
9
65,4
15
2,9
43,4
11
1,2
43,9
29
1,9
71,0
44
20,6
98,6
53
517,
855
65.5
84.
6614
.22
6.01
9.53
Feb-
0813
,865
,662
9
74,3
28
3,0
71,1
23
1,2
06,6
48
2,0
13,0
01
21,1
30,7
62
528,
666
65.6
24.
6114
.53
5.71
9.53
Mar
-08
13,9
22,1
92
962
,685
3
,156
,607
1
,115
,621
2
,076
,357
21
,233
,463
53
1,23
565
.57
4.53
14.8
75.
259.
77
Apr
-08
14,3
76,4
27
985
,243
3
,147
,158
1
,102
,799
2
,074
,881
21
,686
,508
50
4,92
566
.29
4.54
14.5
15.
099.
57
May
-08
14,3
87,4
30
988
,451
3
,179
,717
1
,264
,692
2
,101
,541
21
,921
,831
51
0,40
465
.63
4.51
14.5
05.
779.
59
Jun-
0814
,340
,716
1
,010
,848
3
,170
,955
1
,330
,607
2
,096
,483
21
,949
,609
51
1,05
065
.33
4.61
14.4
56.
069.
55
Sour
ce :
NSE

www.nseindia.com
Debt MarketISMR 150
Chart 6-5: Market Capitalisation of WDM Segment at the end of June 2008
YieldsThe yields (yield-to-maturity) on government and corporate securities of different maturities of 0-1 year, 5-6 years, 9-10 years and above 10 years are presented in (Table 6-15). The yields on government and corporate securities showed an upward trend through out 2007-08.
Table 6-15: Yields on Government and Corporate Securities, 2006-07
Month/ YearGovernment Securities Corporate Securities
0-1 year 5-6 years 9-10 years Above 10 years
0-1 year 5-6 years 9-10 years Above 10 years
Apr-06 5.88 6.88 7.16 7.45 6.88 7.33 8.32 8.33May-06 5.82 6.85 7.45 7.88 6.71 7.96 8.15 8.61Jun-06 7.02 7.90 8.23 8.55 6.94 6.76 8.65 8.88Jul-06 6.49 7.47 8.20 8.68 6.89 7.62 8.93 9.24Aug-06 6.55 7.52 8.04 8.27 6.96 7.96 9.23 9.32Sep-06 6.61 7.41 7.73 7.95 7.50 8.46 8.98 8.85Oct-06 6.69 7.40 7.75 7.98 7.71 8.35 8.82 8.87Nov-06 6.76 7.36 7.61 7.61 7.88 8.32 8.79 8.86Dec-06 6.96 7.53 7.54 7.59 9.22 8.42 9.11 8.93Jan-07 7.19 7.62 7.65 7.73 9.03 9.04 9.06 9.00Feb-07 7.36 7.86 7.91 8.07 10.72 9.37 9.44 9.05Mar-07 7.40 8.00 8.09 8.27 10.82 10.09 9.57 9.85Apr-07 7.34 8.14 8.14 8.45 9.60 10.53 10.04 10.12May-07 7.30 8.02 8.17 8.39 9.72 10.30 10.00 10.04Jun-07 7.02 7.90 8.23 8.49 8.63 10.11 10.08 10.30Jul-07 5.24 7.26 7.86 8.17 7.46 8.78 9.65 9.52Aug-07 6.73 7.69 7.90 8.30 8.78 9.42 9.57 9.69Sep-07 7.10 7.68 7.83 8.34 8.74 9.36 9.97 9.91Oct-07 6.97 7.72 7.87 8.40 8.42 9.17 9.58 9.62Nov-07 7.47 7.77 7.90 8.28 0.00 9.09 9.45 9.58Dec-07 7.58 7.79 7.87 8.16 8.69 9.04 9.39 9.45Jan-08 7.11 7.48 7.60 7.88 8.94 8.98 9.06 9.22Feb-08 7.15 7.45 7.53 7.78 9.71 9.17 9.24 9.37Mar-08 7.24 7.55 7.69 8.20 8.54 9.45 9.38 9.47Apr-08 7.10 7.85 8.00 8.46 8.82 9.53 9.49 9.65May-08 7.31 7.83 7.97 8.54 8.75 9.40 9.64 9.62Jun-08 8.30 8.58 8.40 9.15 9.81 10.02 9.88 9.97
Source: NSE.

www.nseindia.com
Debt Market ISMR151
WDM ProductsZero Coupon Yield Curve
Keeping in mind the requirements of the banking industry, fi nancial institutions, mutual funds, insurance companies, that have substantial investment in sovereign papers, NSE disseminates a ‘Zero Coupon Yield Curve’ (NSE Zero Curve) to help in valuation of securities across all maturities irrespective of its liquidity in the market. This product has been developed by using Nelson-Siegel model to estimate the term structure of interest rate at any given point of time and been successfully tested by using daily WDM trades data. This is being disseminated daily.
The ZCYC depicts the relationship between interest rates in the economy and the associated terms to maturity. It provides daily estimates of the term structure of interest rates using information on secondary market trades in government securities from the WDM segment. The term structure forms the basis for the valuation of all fi xed income instruments. Modeled as a series of cash fl ows due at different points of time in the future, the underlying price of such an instrument is calculated as the net present value of the stream of cash fl ows. Each cash fl ow, in such a formulation, is discounted using the interest rate for the associated term to maturity; the appropriate rates are read off the estimated ZCYC. Once estimated, the interest rate-maturity mapping is used to compute underlying valuations even for securities that do not trade on a given day. The daily ZCYC captures the changes in term structure, and is used to track the value of portfolios of government securities on a day-to-day basis.
The estimates of daily ZCYC are available from February 1998. (Chart 6-6) plots the spot interest rates at different maturities for the period April 2007 till June 2008.
Chart 6-6: Zero Coupon Yield Curve, 2007-08
FIMMDA-NSE MIBID /MIBOR
A reference rate is an accurate measure of the market price. In the fi xed income market, it is an interest rate that the market respects and closely matches. On these lines, NSE has been computing and disseminating the NSE Mumbai Inter-bank Bid Rate (MIBID) and NSE Mumbai Inter-bank Offer Rate (MIBOR) for the overnight money market from June 15, 1998, the 14-day
MIBID/MIBOR from November 10, 1998 and the 1 month and 3 month MIBID/MIBOR from December 1, 1998. In view of the robust methodology of computation of these rates and their extensive use by market participants, these have
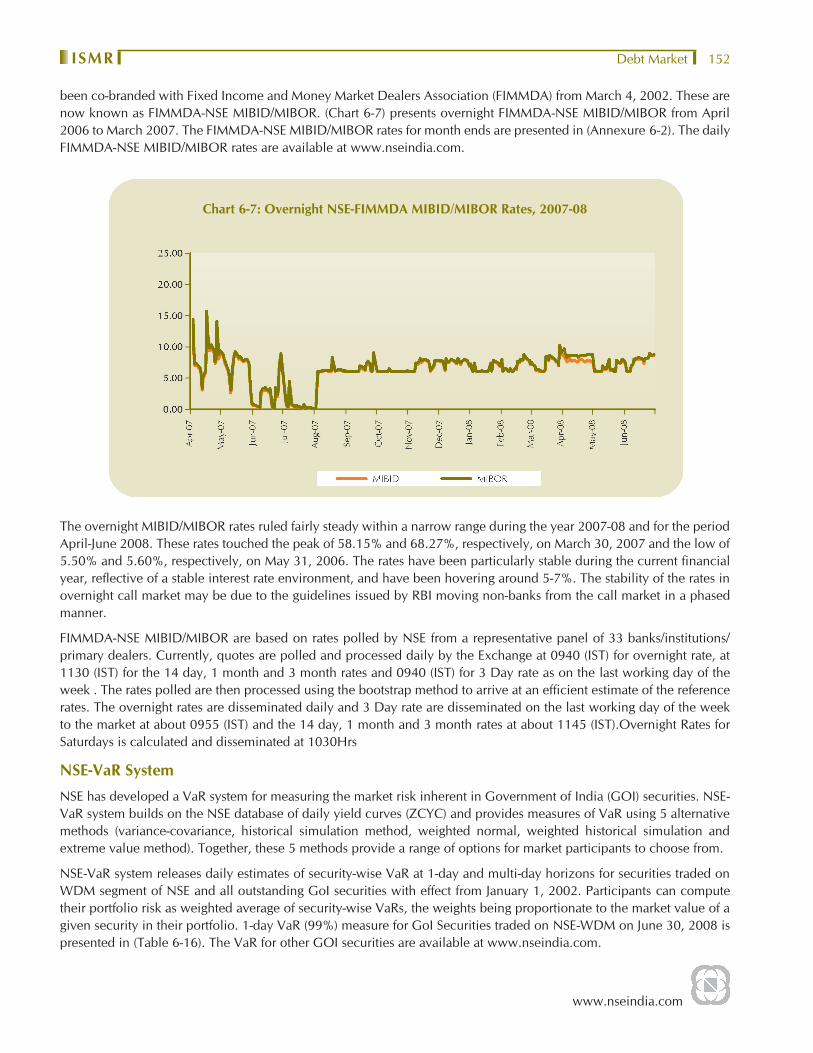
www.nseindia.com
Debt MarketISMR 152
been co-branded with Fixed Income and Money Market Dealers Association (FIMMDA) from March 4, 2002. These are now known as FIMMDA-NSE MIBID/MIBOR. (Chart 6-7) presents overnight FIMMDA-NSE MIBID/MIBOR from April 2006 to March 2007. The FIMMDA-NSE MIBID/MIBOR rates for month ends are presented in (Annexure 6-2). The daily FIMMDA-NSE MIBID/MIBOR rates are available at www.nseindia.com.
Chart 6-7: Overnight NSE-FIMMDA MIBID/MIBOR Rates, 2007-08
The overnight MIBID/MIBOR rates ruled fairly steady within a narrow range during the year 2007-08 and for the period April-June 2008. These rates touched the peak of 58.15% and 68.27%, respectively, on March 30, 2007 and the low of 5.50% and 5.60%, respectively, on May 31, 2006. The rates have been particularly stable during the current fi nancial year, refl ective of a stable interest rate environment, and have been hovering around 5-7%. The stability of the rates in overnight call market may be due to the guidelines issued by RBI moving non-banks from the call market in a phased manner.
FIMMDA-NSE MIBID/MIBOR are based on rates polled by NSE from a representative panel of 33 banks/institutions/primary dealers. Currently, quotes are polled and processed daily by the Exchange at 0940 (IST) for overnight rate, at 1130 (IST) for the 14 day, 1 month and 3 month rates and 0940 (IST) for 3 Day rate as on the last working day of the week . The rates polled are then processed using the bootstrap method to arrive at an effi cient estimate of the reference rates. The overnight rates are disseminated daily and 3 Day rate are disseminated on the last working day of the week to the market at about 0955 (IST) and the 14 day, 1 month and 3 month rates at about 1145 (IST).Overnight Rates for Saturdays is calculated and disseminated at 1030Hrs
NSE-VaR System
NSE has developed a VaR system for measuring the market risk inherent in Government of India (GOI) securities. NSE-VaR system builds on the NSE database of daily yield curves (ZCYC) and provides measures of VaR using 5 alternative methods (variance-covariance, historical simulation method, weighted normal, weighted historical simulation and extreme value method). Together, these 5 methods provide a range of options for market participants to choose from.
NSE-VaR system releases daily estimates of security-wise VaR at 1-day and multi-day horizons for securities traded on WDM segment of NSE and all outstanding GoI securities with effect from January 1, 2002. Participants can compute their portfolio risk as weighted average of security-wise VaRs, the weights being proportionate to the market value of a given security in their portfolio. 1-day VaR (99%) measure for GoI Securities traded on NSE-WDM on June 30, 2008 is presented in (Table 6-16). The VaR for other GOI securities are available at www.nseindia.com.
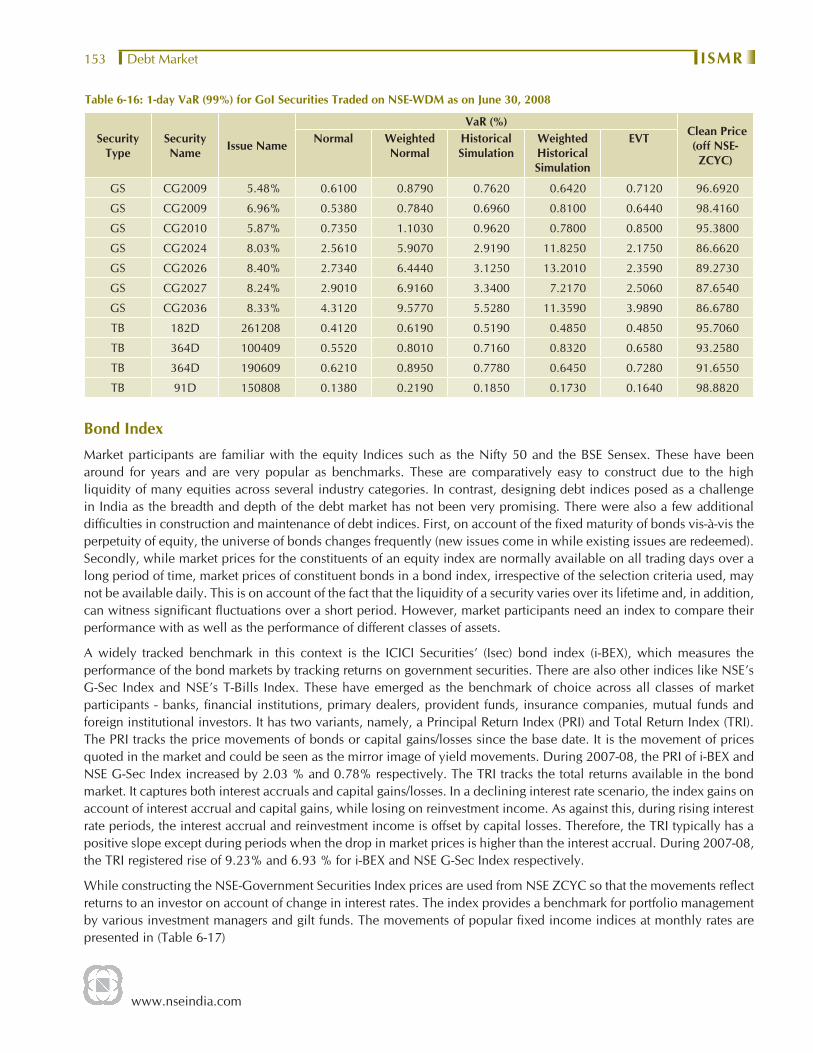
www.nseindia.com
Debt Market ISMR153
Table 6-16: 1-day VaR (99%) for GoI Securities Traded on NSE-WDM as on June 30, 2008
Security Type
Security Name Issue Name
VaR (%) Clean Price
(off NSE-ZCYC)
Normal Weighted Normal
Historical Simulation
Weighted Historical Simulation
EVT
GS CG2009 5.48% 0.6100 0.8790 0.7620 0.6420 0.7120 96.6920
GS CG2009 6.96% 0.5380 0.7840 0.6960 0.8100 0.6440 98.4160
GS CG2010 5.87% 0.7350 1.1030 0.9620 0.7800 0.8500 95.3800
GS CG2024 8.03% 2.5610 5.9070 2.9190 11.8250 2.1750 86.6620
GS CG2026 8.40% 2.7340 6.4440 3.1250 13.2010 2.3590 89.2730
GS CG2027 8.24% 2.9010 6.9160 3.3400 7.2170 2.5060 87.6540
GS CG2036 8.33% 4.3120 9.5770 5.5280 11.3590 3.9890 86.6780
TB 182D 261208 0.4120 0.6190 0.5190 0.4850 0.4850 95.7060
TB 364D 100409 0.5520 0.8010 0.7160 0.8320 0.6580 93.2580
TB 364D 190609 0.6210 0.8950 0.7780 0.6450 0.7280 91.6550
TB 91D 150808 0.1380 0.2190 0.1850 0.1730 0.1640 98.8820
Bond Index
Market participants are familiar with the equity Indices such as the Nifty 50 and the BSE Sensex. These have been around for years and are very popular as benchmarks. These are comparatively easy to construct due to the high liquidity of many equities across several industry categories. In contrast, designing debt indices posed as a challenge in India as the breadth and depth of the debt market has not been very promising. There were also a few additional diffi culties in construction and maintenance of debt indices. First, on account of the fi xed maturity of bonds vis-à-vis the perpetuity of equity, the universe of bonds changes frequently (new issues come in while existing issues are redeemed). Secondly, while market prices for the constituents of an equity index are normally available on all trading days over a long period of time, market prices of constituent bonds in a bond index, irrespective of the selection criteria used, may not be available daily. This is on account of the fact that the liquidity of a security varies over its lifetime and, in addition, can witness signifi cant fl uctuations over a short period. However, market participants need an index to compare their performance with as well as the performance of different classes of assets.
A widely tracked benchmark in this context is the ICICI Securities’ (Isec) bond index (i-BEX), which measures the performance of the bond markets by tracking returns on government securities. There are also other indices like NSE’s G-Sec Index and NSE’s T-Bills Index. These have emerged as the benchmark of choice across all classes of market participants - banks, fi nancial institutions, primary dealers, provident funds, insurance companies, mutual funds and foreign institutional investors. It has two variants, namely, a Principal Return Index (PRI) and Total Return Index (TRI). The PRI tracks the price movements of bonds or capital gains/losses since the base date. It is the movement of prices quoted in the market and could be seen as the mirror image of yield movements. During 2007-08, the PRI of i-BEX and NSE G-Sec Index increased by 2.03 % and 0.78% respectively. The TRI tracks the total returns available in the bond market. It captures both interest accruals and capital gains/losses. In a declining interest rate scenario, the index gains on account of interest accrual and capital gains, while losing on reinvestment income. As against this, during rising interest rate periods, the interest accrual and reinvestment income is offset by capital losses. Therefore, the TRI typically has a positive slope except during periods when the drop in market prices is higher than the interest accrual. During 2007-08, the TRI registered rise of 9.23% and 6.93 % for i-BEX and NSE G-Sec Index respectively.
While constructing the NSE-Government Securities Index prices are used from NSE ZCYC so that the movements refl ect returns to an investor on account of change in interest rates. The index provides a benchmark for portfolio management by various investment managers and gilt funds. The movements of popular fi xed income indices at monthly rates are presented in (Table 6-17)

www.nseindia.com
Debt MarketISMR 154
Table 6-17: Debt Market Indices, 2007-08 and April-June 2008
At the end of the month
I Sec I-BEX (Base August 1, 1994=1000) NSE-T-Bills Index NSE-G Sec Index
TRI PRI TRI PRI TRI PRI
Apr-05 3618.70 1294.29 198.56 198.56 237.68 117.26
May-05 3701.75 1316.10 199.20 199.20 239.46 117.42
Jun-05 3758.31 1328.02 200.23 200.23 243.71 118.92
Jul-05 3758.06 1319.44 201.42 201.42 244.23 118.48
Aug-05 3771.29 1315.55 202.52 202.52 242.50 117.28
Sep-05 3791.01 1313.83 203.31 203.31 243.21 117.16
Oct-05 3820.32 1315.54 204.20 204.20 244.00 117.25
Nov-05 3845.28 1315.63 205.16 205.16 244.79 116.93
Dec-05 3868.40 1314.93 205.75 205.75 249.19 118.38
Jan-06 3851.46 1300.30 206.81 206.81 244.73 115.80
Feb-06 3858.77 1294.54 207.64 207.64 244.56 115.00
Mar-06 3851.96 1282.36 209.16 209.16 244.03 114.25
Apr-06 3894.74 1288.17 210.99 210.99 244.24 114.09
May-06 3878.34 1273.56 210.95 210.95 240.92 112.08
Jun-06 3820.07 1245.31 211.25 211.25 242.84 112.29
Jul-06 3821.74 1236.92 212.87 212.87 233.69 107.95
Aug-06 3899.46 1253.58 214.51 214.51 240.51 110.5
Sep-06 3975.15 1269.72 215.45 215.45 244.61 111.95
Oct-06 4018.27 1274.90 216.16 216.16 244.91 111.53
Nov-06 4128.44 1301.83 217.98 217.98 252.04 114.18
Dec-06 4100.89 1284.33 218.39 218.39 250.07 112.51
Jan-07 4066.43 1264.38 220.24 220.24 248.68 111.08
Feb-07 4068.54 1256.91 221.21 221.21 248.02 110.26
Mar-07 4076.09 1250.01 222.52 222.52 246.91 109.40
Apr-07 4069.77 1239.62 224.19 224.19 246.89 108.70
May-07 4114.76 1245.33 225.61 225.61 247.79 108.46
Jun-07 4130.32 1241.87 227.15 227.15 254.61 110.78
Jul-07 4253.34 1271.47 229.17 229.17 256.55 111.20
Aug-07 4231.31 1256.53 230.03 230.03 261.09 112.64
Sep-07 4251.29 1254.59 231.44 231.44 256.39 110.02
Oct-07 4297.44 1260.58 232.50 232.50 258.24 110.12
Nov-07 4315.46 1258.08 234.08 234.08 259.29 110.06
Dec-07 4383.47 1270.47 235.58 235.58 262.58 110.73
Jan-08 4480.57 1291.24 237.26 237.26 268.01 112.30
Feb-08 4488.96 1285.74 238.51 238.51 269.25 112.33
Mar-08 4445.35 1264.82 239.71 239.71 264.01 109.55
Apr-08 4411.69 1247.01 241.18 241.18 265.37 109.66
May-08 4412.02 1239.23 242.83 242.83 265.93 109.32
Jun-08 4289.21 1196.03 243.85 243.85 249.21 101.85
Source: ICICI Securities and NSE

www.nseindia.com
Debt Market ISMR155
Policy Debate2
Repos in corporate bonds
A repo market is an important constituent of a well functioning corporate debt market. In a repo trade, a market participant pledges a corporate paper in exchange for funds for a specifi c period and at a rate determined by the market. Secondary market trading cannot take place unless there are enough dealers offering quotes in the market. Since dealers operate with funded portfolios, they will be able to offer quotes at low spreads only if they are able to carry their stocks at a low cost. Repos allow them to do this by enabling them to borrow against the securities in their inventory.
Repo transactions are currently permitted only in the Central government securities, treasury bills and state development loans. The success of the government securities market owes a lot to the work done by Primary Dealers (PDs) appointed by RBI. PDs have access to both call and repo market for their funding. As more and more participants have been phased out of the call market, the dependence on repos has grown. Today, direct market repos and third party repos are both important sources of fi nance for dealers in government securities.
The absence of a similar arrangement for corporate repos acts a serious dampener for this market. Banks are currently not allowed to enter into repo contracts on securities other than government securities. This puts corporate bonds at a considerable disadvantage. As a result the secondary market for corporate bonds remains dormant. The use of tripartite repos overcomes many of the systemic risk concerns that arise out of direct repos, and a product on the lines described below will result in the creation of secondary market liquidity for corporate bonds.
The above has been highlighted by the Government appointed High Level Committee on Corporate Bonds and Securitisation, December, 2005 (R. H. Patil Committee). The Committee has, inter-alia, recommended that in order to improve secondary market trading, repos in corporate bonds should be permitted to be operated by the proposed clearing entities for corporate bonds. It will give an opportunity to investors who have illiquid corporate bonds to recycle the same and borrow money against these securities.
The Report of Committee on Infrastructure Financing, May 2007 (Deepak Parikh Committee) has also pointed out that secondary market trading in corporate bonds cannot take place unless there are enough dealers offering quotes in the market. Since dealers operate with funded portfolios, they are able to offer quotes at low spreads only if they can carry their stocks at a low cost. The success of government securities market is due to the availability of repos which enable the dealers to carry their stocks at a low cost. The absence of similar arrangement for corporate bond market puts it at a considerable disadvantage.
Regulators need to take steps to introduce repos in corporate bonds to enhance the liquidity in these markets.
2 The views and approaches refl ected in the policy debates are not necessarily of the NSE.

www.nseindia.com
Debt MarketISMR 156
Ann
exur
e 6-
1: B
usin
ess
Gro
wth
of W
DM
Seg
men
t
Mon
th/Y
ear
All
Trad
esRe
tail
Trad
esN
o. o
f Act
ive
Secu
ritie
s N
umbe
r of
Tr
ades
Turn
over
(R
s. m
n.)
Ave
rage
D
aily
Tu
rnov
er
(Rs.
mn.
)
Ave
rage
Tr
ade
Size
(R
s. m
n.)
Turn
over
(U
S $
mn.
)A
vera
ge
Dai
ly
Turn
over
(U
S $
mn.
)
Num
ber
of T
rade
sTu
rnov
er
(Rs.
mn.
)Tu
rnov
er (U
S $
mn.
)Sh
are
in T
otal
Tu
rnov
er
(%)
2000
-01
1,0
38
64,
470
4,28
5,81
5 1
4,83
0 66
.48
91,
891
318
498
1,31
828
.26
0.03
2001
-02
979
144,
851
9,47
1,91
232
,775
65.3
9 1
94,0
97
672
378
1,09
422
.42
0.01
2002
-03
1,12
316
7,77
810
,687
,014
35,9
8363
.70
224
,990
75
81,
252
2,99
563
.05
0.03
2003
-04
1,07
818
9,51
813
,160
,962
44,7
6569
.44
303
,318
1,
032
1,40
03,
317
76.4
50.
03
2004
-05
1,1
51
124,
308
8,87
2,93
630
,283
71.3
8 2
02,8
10
692
1,27
84,
101
93.7
40.
05
2005
-06
897
61,
891
4,7
55,2
35
17,
547
76.8
3 1
06,5
96
393
892
3
,104
69
.58
0.0
7
2006
-07
762
1
9,57
5 2
,191
,065
8
,980
11
1.93
50,
265
206
399
1
,015
23
.29
0.0
5
Apr
-07
98
928
1
71,5
87
9,0
31
184.
90 4
,293
22
6 1
2 3
0 0.
75 0
.02
May
-07
145
1
,093
1
74,8
35
8,3
26
159.
96 4
,374
20
8 1
8 6
0 1.
50 0
.03
Jun-
07 1
43
1,0
65
173
,352
8
,255
16
2.77
4,3
37
207
38
60
1.50
0.0
3
Jul-0
7 1
84
2,0
89
338
,146
1
5,37
0 16
1.90
8,4
60
385
9
30
0.75
0.0
1
Aug
-07
128
1
,230
2
14,3
05
10,
205
174.
20 5
,362
25
5 8
4
0 1.
00 0
.02
Sep-
07 1
48
934
1
69,0
24
8,4
51
180.
97 4
,229
21
1 2
7 4
0 1.
00 0
.02
Oct
-07
147
1
,411
2
54,9
32
11,
588
180.
67 6
,378
29
0 1
0 4
0 1.
00 0
.02
Nov
-07
110
1
,083
1
77,0
39
8,4
30
163.
47 4
,429
21
1 7
2
0 0.
50 0
.01
Dec
-07
117
1
,585
3
28,6
54
17,
298
207.
40 8
,223
43
3 1
2 4
0 1.
00 0
.01
Jan-
08 1
44
2,3
59
427
,242
1
8,57
6 18
1.11
10,
689
465
27
70
1.75
0.0
2
Feb-
08 1
18
1,4
97
240
,439
1
1,44
9 16
0.61
6,0
15
286
7
20
0.50
0.0
1
Mar
-08
148
9
05
153
,615
8
,534
16
9.70
3,8
43
214
36
40
1.00
0.0
3
2007
-08
601
1
6,17
9 2
,823
,170
1
1,38
0 17
4.50
70,
632
285
211
4
90
12.2
6 0
.02
Apr
-08
122
1
,016
1
98,9
28
9,9
46
195.
80 4
,632
23
2 6
2
1 0.
490.
01
May
-08
137
1
,200
2
06,5
63
10,
328
172.
10 4
,809
24
0 3
4
0.
090.
00
Jun-
08 1
90
956
1
82,3
34
8,6
83
190.
70 4
,245
20
2 1
06
203
4.
730.
11
Apr
il-Ju
ne 2
008
449
3
,172
5
87,8
25
28,
957
185
.32
13,
686
674
115
2
28
5.3
1 0.
04
Sour
ce :
NSE
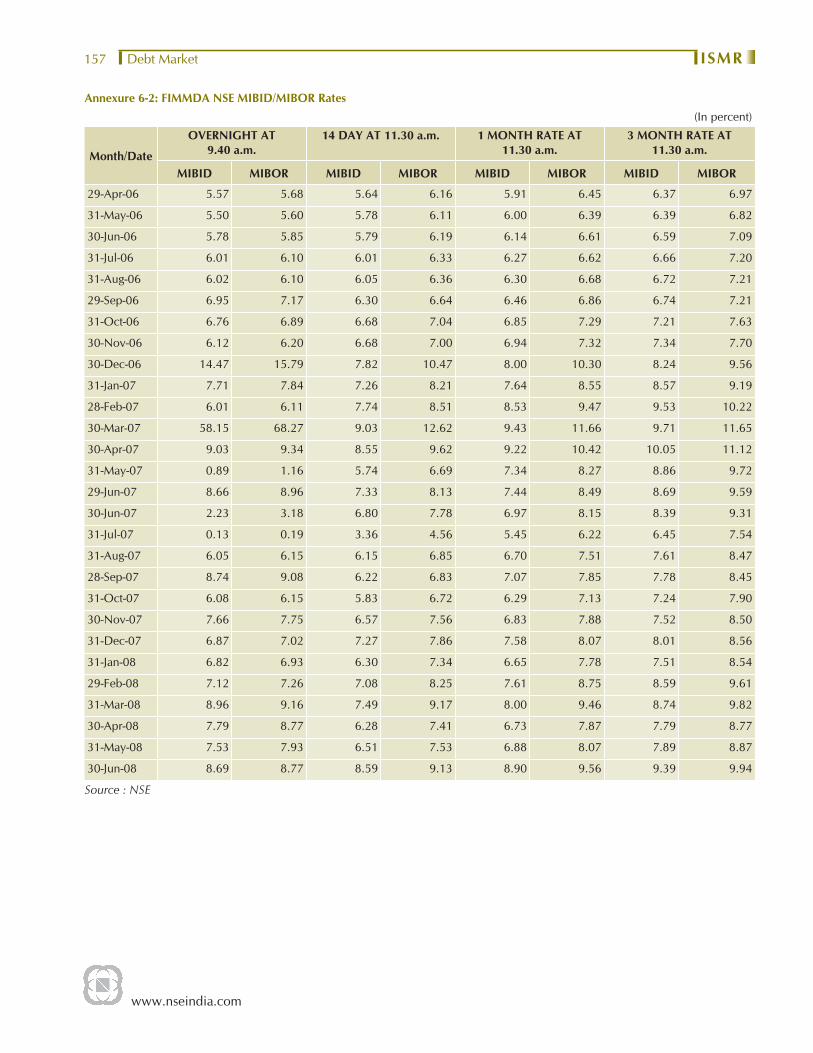
www.nseindia.com
Debt Market ISMR157
Annexure 6-2: FIMMDA NSE MIBID/MIBOR Rates(In percent)
Month/Date
OVERNIGHT AT 9.40 a.m.
14 DAY AT 11.30 a.m. 1 MONTH RATE AT 11.30 a.m.
3 MONTH RATE AT 11.30 a.m.
MIBID MIBOR MIBID MIBOR MIBID MIBOR MIBID MIBOR
29-Apr-06 5.57 5.68 5.64 6.16 5.91 6.45 6.37 6.97
31-May-06 5.50 5.60 5.78 6.11 6.00 6.39 6.39 6.82
30-Jun-06 5.78 5.85 5.79 6.19 6.14 6.61 6.59 7.09
31-Jul-06 6.01 6.10 6.01 6.33 6.27 6.62 6.66 7.20
31-Aug-06 6.02 6.10 6.05 6.36 6.30 6.68 6.72 7.21
29-Sep-06 6.95 7.17 6.30 6.64 6.46 6.86 6.74 7.21
31-Oct-06 6.76 6.89 6.68 7.04 6.85 7.29 7.21 7.63
30-Nov-06 6.12 6.20 6.68 7.00 6.94 7.32 7.34 7.70
30-Dec-06 14.47 15.79 7.82 10.47 8.00 10.30 8.24 9.56
31-Jan-07 7.71 7.84 7.26 8.21 7.64 8.55 8.57 9.19
28-Feb-07 6.01 6.11 7.74 8.51 8.53 9.47 9.53 10.22
30-Mar-07 58.15 68.27 9.03 12.62 9.43 11.66 9.71 11.65
30-Apr-07 9.03 9.34 8.55 9.62 9.22 10.42 10.05 11.12
31-May-07 0.89 1.16 5.74 6.69 7.34 8.27 8.86 9.72
29-Jun-07 8.66 8.96 7.33 8.13 7.44 8.49 8.69 9.59
30-Jun-07 2.23 3.18 6.80 7.78 6.97 8.15 8.39 9.31
31-Jul-07 0.13 0.19 3.36 4.56 5.45 6.22 6.45 7.54
31-Aug-07 6.05 6.15 6.15 6.85 6.70 7.51 7.61 8.47
28-Sep-07 8.74 9.08 6.22 6.83 7.07 7.85 7.78 8.45
31-Oct-07 6.08 6.15 5.83 6.72 6.29 7.13 7.24 7.90
30-Nov-07 7.66 7.75 6.57 7.56 6.83 7.88 7.52 8.50
31-Dec-07 6.87 7.02 7.27 7.86 7.58 8.07 8.01 8.56
31-Jan-08 6.82 6.93 6.30 7.34 6.65 7.78 7.51 8.54
29-Feb-08 7.12 7.26 7.08 8.25 7.61 8.75 8.59 9.61
31-Mar-08 8.96 9.16 7.49 9.17 8.00 9.46 8.74 9.82
30-Apr-08 7.79 8.77 6.28 7.41 6.73 7.87 7.79 8.77
31-May-08 7.53 7.93 6.51 7.53 6.88 8.07 7.89 8.87
30-Jun-08 8.69 8.77 8.59 9.13 8.90 9.56 9.39 9.94
Source : NSE
www.nseindia.com
Derivatives MarketISMR 158
Derivatives Market
Introduction
Growth of the markets often gives rise to demand for new, different instruments to enable the investors to diversify and control the different risks in the capital markets. Demand for derivative instruments, like options and futures contracts, was one such demand. A market for derivative products emerged as a result of the willingness of risk-averse economic agents to guard against uncertainties arising out of fl uctuations in asset prices. Derivatives are meant to facilitate hedging of price risk of inventory holding or a fi nancial/commercial transaction over a certain period. Derivative products initially emerged as hedging devices against fl uctuations in commodity prices and commodity-linked derivatives were the sole forms of such products for a long time. The fi nancial derivatives gained prominence in post-1970 period due to growing instability in the fi nancial markets and became very popular, accounting for about two-thirds of total transactions in derivative products. In the recent years, the market for fi nancial derivatives has grown both in terms of variety of instruments available, their complexity and turnover.
Derivatives trading commended in June 2000, after SEBI approval, on the NSE and BSE. Trading fi rst commenced in Index futures contracts, followed by index options in June 2001, options in individual stocks in July 2001 and futures in single stock derivatives in November 2000.Thus, in 2000 and 2001, the Indian equity market reached the logical conclusion of the reforms program which began in 1994.
India’s experience with the launch of equity derivatives market has been extremely positive. The derivatives turnover on the NSE has surpassed the equity market turnover. The turnover of derivatives on the NSE increased from Rs. 23,654 million (US $ 207 million) in 2000-01 to Rs. 130,904,779 million (US $ 3,275,076 million) in 2007-08. India is one of the most successful developing countries in terms of a vibrant market for exchange-traded derivatives. This reiterates the strengths of the modern development of India’s securities markets, which are based on nationwide market access, anonymous electronic trading, and a predominantly retail market. There is an increasing sense that the equity derivatives market is playing a major role in shaping price discovery.
The factors that have been driving the growth of fi nancial derivatives worldwide, as also in India are increased volatility in asset prices in fi nancial markets; increased integration of national fi nancial markets with international markets; development of more sophisticated risk management tools, providing economic agents a wider choice of risk management strategies and innovations in the derivatives markets, which optimally combine the risks and returns over a large number of fi nancial assets.

www.nseindia.com
Derivatives Market ISMR159
Table 7-1 : Benchmark Indices Contracts & Volume in futures & Options Segment of NSE for the fi scal 2007-08 and the quarter(April 2008- June 2008)
Indices No of Contracts
Traded Value (Rs. Mn.)
Traded Value
(US $ Mn.)
Percent-age of
Contracts to total
contracts
No of Contracts
Traded Value (Rs. Mn.)
Traded Value
(US $ Mn.)
Percentage of
Contracts to total
contracts
Index Futures
2007-08 April 2008-June 2008
NIFTY 152,838,395 37,508,314.90 938,411.68 72.11 37,764,776.00 8,900,319.60 207,225.14 57.94
MINIFTY 2,070,453 212,484.80 5,316.11 0.98 2,936,717.00 277,386.40 6,458.36 4.51
BANKNIFTY 1,217,536 375,130.30 9,385.30 0.57 423,192.00 70,150.20 1,633.30 0.65
CNXIT 211,363 50,441.60 1,261.99 0.10 35,181.00 7,560.90 176.04 0.05
JUNIOR 228,888 53,329.70 1,334.24 0.11 5,189.00 1,104.70 25.72 0.01
NFTYMCAP50 11,790 2,725.40 68.19 0.01 1,335.00 259.50 6.04 0.002
CNX100 20,154 4,246.10 106.23 0.01 79.00 18.20 0.42 0.0001
Index Options
NIFTY 55,360,252 13,620,323.80 340,763.67 26.12 23,989,447.00 5,710,611.00 132,959.51 36.81
MINIFTY 4,679 551.10 13.79 0.00 16,963.00 2,568.80 59.81 0.03
BANKNIFTY 41 10.30 0.26 0.00 2,214.00 220.00 5.12 0.003
CNXIT 55 11.50 0.29 0.00 3.00 0.60 0.01 0.00
JUNIOR 1,001 209.20 5.23 0.00 - - - -
NFTYMCAP50 6 1.90 0.05 0.00 - - - -
CNX100 4 0.90 0.02 0.00 - - - -
Total of all Indices 211,964,617 51,827,782 1,296,667 100.00 65,175,096.00 14,970,199.90 348,549.47 100.00
Total of Nifty Index Futures and Options
208,198,647 51,128,639 1,279,175 98.22 61,754,223.00 14,610,930.60 340,184.65 94.75
Global Derivatives Markets 1 As per the FIA Annual Volume Survey, more than 15 billion futures and options contracts were traded during 2007 on the 54 exchanges that report to the FIA, a remarkable increase of 28% from the previous year. Looking back at the last three years, the growth rates were 19% in 2006, 12% in 2005, and 9% in 2004. The last time this much growth was seen was in 2003 when volumes increased by 31% from 6.2 billion to 8.1 billion (Table 7-2).
1 Data source is Futures Industry Magazine, March/April 2008

www.nseindia.com
Derivatives MarketISMR 160
Table 7-2: Year Wise Trend of Derivatives Trading (in terms of contracts)(in millions)
Year US Exchanges Non-US Exchanges Global
1992 550.39 387.83 938.22
1993 523.36 538.36 1,061.72
1994 807.87 779.83 1,587.70
1995 776.64 905.99 1,682.63
1996 793.63 975.34 1,768.97
1997 905.16 1,025.07 1,930.23
1998 1,033.20 1,142.65 2,175.81
1999 1,100.86 1,301.98 2,405.84
2000 1,313.65 1,675.80 2,989.45
2001 1,578.62 2,768.70 4,347.32
2002 1,844.90 4,372.38 6,217.28
2003 2,172.52 5,990.22 8,162.54
2004 2,795.21 6,069.50 8,864.71
2005 3,525.00 6,448.67 9,973.67
2006 4,616.73 7,245.48 11,862.21
2007 6,137.20 9,049.47 15,186.67
Source : FI Futures Industry, March/April 2008. The magazine of the FIA
The upward trend in growth in derivatives segment is being witnessed across all the segments of the exchange traded derivative contracts. However, Equity futures and options, both index and single stock, are the most powerful drivers, together accounting for 68.36% of increase in volumes of exchange traded derivative contracts in 2007 over the 2006 levels. The trading in foreign currency derivatives grew at 39.43% in 2007 followed by Agricultural derivatives which registered growth of 32.02% (Table 7-3).
Table 7-3: Global Exchange traded derivatives volume by category(in millions)
GLOBAL 2007 2006 (%) ChangeEquity Indices 5,616.82 4,453.95 26.1
Interest Rate 3,740.88 3,193.44 17.14
Individual Equities 4,091.92 2,876.49 42.25
Energies 496.41 385.97 28.61
Agricultural 645.64 489.03 32.02
Metals 256.07 218.68 17.09
Currency 334.71 240.05 39.43
Others 4.23 4.36 -2.98
Total Volume 15,186.67 11,862.21 28.03
Source : FI Futures Industry, March/April 2008. The magazine of the FIA
The details for the top 20 contracts for the year 2007 are presented in (Table 7-4). With 2.64 billion contracts, Kospi 200 options contract was the most traded in 2007 followed by Euro-Dollar Futures of CME having traded 621.47 million contracts. E-mini S&P 500 Futures, CME contract saw an increase of 61% in its traded volumes and moved to 3rd

www.nseindia.com
Derivatives Market ISMR161
position in the list of top traded contracts in 2007 from 6th position in 2006. Another contract which witnessed a sharp increase in its volume in 2007 was the DJ Euro Stoxx 50 Futures contract leading to its positions’ improvement from 8th to 6th in 2007.
Table 7-4: Top 20 Contracts for the year 2007
(in millions - net of individual equities)
Rank Contract 2007 2006 Volume Change % Change
1 Kospi 200 Options, Korea Exchange 2,642.68 2,414.42 228.26 9.45
2 Eurodollar Futures, CME 621.47 502.08 119.39 23.78
3 E-mini S&P 500 Index Futures, CME 415.35 257.93 157.42 61.03
4 10-Year T-Note Futures, CME 349.23 255.57 93.66 36.65
5 Euro-Bund Futures, Eurex 338.32 319.89 18.43 5.76
6 DJ Euro Stoxx 50 Futures, Eurex 327.03 213.51 113.52 53.17
7 Eurodollar Options on Futures , CME 313.03 268.96 44.07 16.39
8 DJ Euro Stoxx 50 Options, Eurex 251.44 150.05 101.39 67.57
9 1-Day Interbank Deposit Futures, BM&F 221.63 161.65 59.98 37.10
10 3 month Euribor Futures, Liffe 221.41 202.09 19.32 9.56
11 TIIE 28-Day Interbank Rate Futures, MexderTIIE 28 Futures, Eurex 220.61 264.16 -43.55 -16.49
12 Powershares QQQ ETF Options * 185.81 112.07 73.74 65.80
13 Euro-Schatz Futures, Eurex 181.10 165.32 15.78 9.55
14 Euro-Bobl Futures, Eurex 170.91 167.31 3.60 2.15
15 5 Year T-Note Futures, CBOT CME 166.21 124.87 41.34 33.11
16 S&P 500 Index Options, CBOE 158.08 104.31 53.77 51.55
17 iShare Russell 2000 ETF Options * 154.06 80.95 73.11 90.32
18 SPDR S&P 500 ETF Options * 141.61 64.91 76.70 118.16
19 S&P CNX Nifty Futures, NSE India 138.79 70.29 68.51 97.47
20 Light Sweet Crude Oil Futures, CME Nymex 121.53 71.05 50.48 71.05
Source: FI Futures Industry, March/April 2008. The monthly magazine of the FIA.* Traded as multiple U.S options exchanges
In terms of trading volumes in single stock futures, while the NSE was ranked fi rst (1st) in terms on number of contracts traded in 2006, it has shifted to second position as the Johannesburg Stock Exchange (JSE) overtook NSE with a 265.49 million contracts traded in 2007 at the JSE as against 179.33 contracts on the NSE (Table 7-5).
Table 7-5: Futures on Individual Equities (Stock Futures) (Number of Contracts- in million)
Exchange 2007 2006 % Change
JSE South Africa 265.49 69.67 281.06
National Stock Exchange of India 179.32 100.29 78.81
Eurex 52.46 35.59 47.41
Liffe 75.27 29.52 155.00
MEFF 21.29 21.23 0.30
Source: WFE 2007 Annual Report and Statistics.
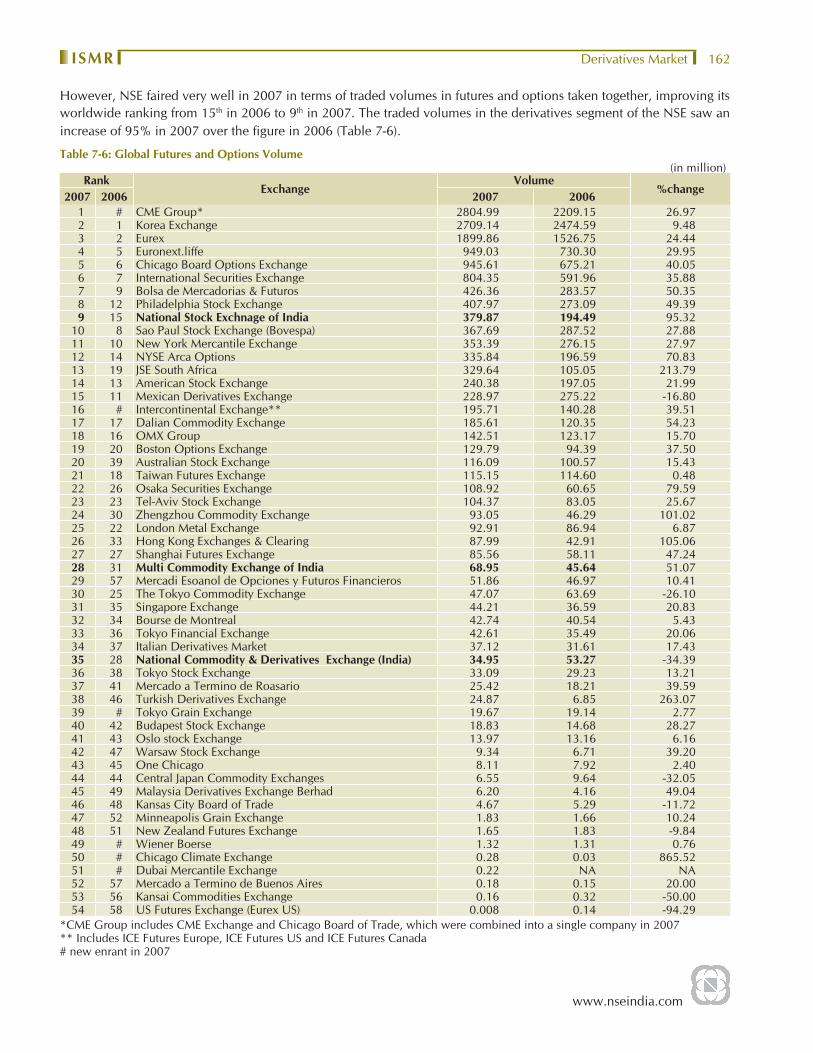
www.nseindia.com
Derivatives MarketISMR 162
However, NSE faired very well in 2007 in terms of traded volumes in futures and options taken together, improving its worldwide ranking from 15th in 2006 to 9th in 2007. The traded volumes in the derivatives segment of the NSE saw an increase of 95% in 2007 over the fi gure in 2006 (Table 7-6).
Table 7-6: Global Futures and Options Volume(in million)
Rank Exchange
Volume%change
2007 2006 2007 20061 # CME Group* 2804.99 2209.15 26.972 1 Korea Exchange 2709.14 2474.59 9.483 2 Eurex 1899.86 1526.75 24.444 5 Euronext.liffe 949.03 730.30 29.955 6 Chicago Board Options Exchange 945.61 675.21 40.056 7 International Securities Exchange 804.35 591.96 35.887 9 Bolsa de Mercadorias & Futuros 426.36 283.57 50.358 12 Philadelphia Stock Exchange 407.97 273.09 49.399 15 National Stock Exchnage of India 379.87 194.49 95.32
10 8 Sao Paul Stock Exchange (Bovespa) 367.69 287.52 27.8811 10 New York Mercantile Exchange 353.39 276.15 27.9712 14 NYSE Arca Options 335.84 196.59 70.8313 19 JSE South Africa 329.64 105.05 213.7914 13 American Stock Exchange 240.38 197.05 21.9915 11 Mexican Derivatives Exchange 228.97 275.22 -16.8016 # Intercontinental Exchange** 195.71 140.28 39.5117 17 Dalian Commodity Exchange 185.61 120.35 54.2318 16 OMX Group 142.51 123.17 15.7019 20 Boston Options Exchange 129.79 94.39 37.5020 39 Australian Stock Exchange 116.09 100.57 15.4321 18 Taiwan Futures Exchange 115.15 114.60 0.4822 26 Osaka Securities Exchange 108.92 60.65 79.5923 23 Tel-Aviv Stock Exchange 104.37 83.05 25.6724 30 Zhengzhou Commodity Exchange 93.05 46.29 101.0225 22 London Metal Exchange 92.91 86.94 6.8726 33 Hong Kong Exchanges & Clearing 87.99 42.91 105.0627 27 Shanghai Futures Exchange 85.56 58.11 47.2428 31 Multi Commodity Exchange of India 68.95 45.64 51.0729 57 Mercadi Esoanol de Opciones y Futuros Financieros 51.86 46.97 10.4130 25 The Tokyo Commodity Exchange 47.07 63.69 -26.1031 35 Singapore Exchange 44.21 36.59 20.8332 34 Bourse de Montreal 42.74 40.54 5.4333 36 Tokyo Financial Exchange 42.61 35.49 20.0634 37 Italian Derivatives Market 37.12 31.61 17.4335 28 National Commodity & Derivatives Exchange (India) 34.95 53.27 -34.3936 38 Tokyo Stock Exchange 33.09 29.23 13.2137 41 Mercado a Termino de Roasario 25.42 18.21 39.5938 46 Turkish Derivatives Exchange 24.87 6.85 263.0739 # Tokyo Grain Exchange 19.67 19.14 2.7740 42 Budapest Stock Exchange 18.83 14.68 28.2741 43 Oslo stock Exchange 13.97 13.16 6.1642 47 Warsaw Stock Exchange 9.34 6.71 39.2043 45 One Chicago 8.11 7.92 2.4044 44 Central Japan Commodity Exchanges 6.55 9.64 -32.0545 49 Malaysia Derivatives Exchange Berhad 6.20 4.16 49.0446 48 Kansas City Board of Trade 4.67 5.29 -11.7247 52 Minneapolis Grain Exchange 1.83 1.66 10.2448 51 New Zealand Futures Exchange 1.65 1.83 -9.8449 # Wiener Boerse 1.32 1.31 0.7650 # Chicago Climate Exchange 0.28 0.03 865.5251 # Dubai Mercantile Exchange 0.22 NA NA52 57 Mercado a Termino de Buenos Aires 0.18 0.15 20.0053 56 Kansai Commodities Exchange 0.16 0.32 -50.0054 58 US Futures Exchange (Eurex US) 0.008 0.14 -94.29
*CME Group includes CME Exchange and Chicago Board of Trade, which were combined into a single company in 2007** Includes ICE Futures Europe, ICE Futures US and ICE Futures Canada# new enrant in 2007

www.nseindia.com
Derivatives Market ISMR163
Derivatives market survey by WFE-May 2008The World Federation of Exchanges carried out an annual survey of derivatives markets for the International Options Markets Association (IOMA) derivatives exchanges, covering the markets in its member countries. The survey completed in May 2008 covered derivative markets in 52 exchanges.
The main fi ndings of the 2007 IOMA survey are listed below:
1. 2007 was again a brilliant year for most segments of derivatives trading.
2007 Stock Stock index STIR LTIR Currency
Number of contracts traded (millions)
Options 3,729 3,743 472 188 46
Futures 626 1,698 1,546 1,530 287
Growth rate of contracts traded
Options 35 % 18 % 22 % 6 % 91 %
Futures 118 % 45 % 15 % 20 % 36 %
Note: STIR: short term interest rate productsLTIR: long term interest rate products
The growth of equity products, which account for 64 % of global derivative markets for the number of traded contracts, accelerated in 2007 for all types of products.
• Stock options and index options are increasingly traded around the world. The growth of stock options trading volume more than doubled in 2007 and caught up with stock index options. Meanwhile, the latter are the type of derivatives products listed on the greatest (and increasing) number of exchanges. Volumes in the Korean KOSPI 200 contract are huge (2.4 billion contracts traded) and increased again in 2007, although less rapidly than the rest of the market.
• Volumes of stock futures more than doubled again in 2007. The most successful exchanges in this segment challenge traditional markets like the JSE South Africa and the National Stock Exchange of India, which are ranked fi rst in terms, respectively, of number of contracts traded and notional value of trading. Regarding index futures, growth has accelerated continuously : + 17 % in 2004, + 32 % in 2006, + 45 % in 2007.
• Short term interest rate products were the only segment of the market that showed lower rates of growth, but the fi gures were still very impressive. The concentration of the market became more pronounced, with only 16 exchanges listing options or futures, and the two leaders, CME Group and Liffe accounting for 71 % of global trading.
• Long term interest rate products showed a contrasting picture, where the growth of options was the smallest of all segments, while the growth of futures accelerated to 20 %. The concentration of the market is even stronger than on short term products : CBOT (now part of CME Group) and Eurex account for 92 % of global trading volume.
• Currency derivatives are still a relatively small segment of organized markets. However, the growth rate, which is similar to 2006 (42 %), is higher than that of most other products.
2. The growth of derivatives market signals a general trend in the global economy, where fi nancial markets are more and more active all around the world. Again in 2007, cash markets grew even more rapidly than derivatives markets : the number of trades in equity shares increased 73 % in 2007, though the growth in value of cash equities traded was lower than that.
3. The concentration of derivatives business has not changed much in the past three years. Trading of equity products and commodity futures are still less concentrated in the top fi ve exchanges than interest rate and currency products. However, the trend towards more concentration of single stocks derivatives trading on the biggest exchanges

www.nseindia.com
Derivatives MarketISMR 164
continued in 2007, while the concentration of index option trading decreased slightly. Also, concentration can be analysed by the share of the 5 and 10 most active members in the total trading volume of the exchanges. Thus, Wiener Börse is the most concentrated market: nearly 100 % of transactions are realised by the 5 biggest members. European markets are more concentrated than their counterparts in other regions, except for the Italian Stock Exchange. On the opposite position, the 5 most active members on the National Stock Exchange of India represents less than 15 % of the total trading volume of the market.
4. The ratio of open positions to turnover is still higher on stock options than on other products, but it has decreased over time, and the trend accelerated in 2007 ; and although retail trading has been more important for that class of products than others, the velocity of trading has been rising.
Policy Developments
I. Comprehensive Guidelines on Derivatives trading by banks
As indicated by the RBI in its Mid-term Review of Annual Policy for year 2006-07, an Internal Group was constituted by the Bank to review the existing guidelines on derivatives and formulate comprehensive guidelines on derivatives by banks. Based on based on the recommendations of this Group and a public consultation process, comprehensive guidelines on derivatives trading by banks were released by the RBI in April 2007.
The main contents of these guidelines are:
a. Broad principles for undertaking derivative transactions
The guidelines lay down that the major requirements for undertaking any derivative transaction from the regulatory perspective would include:
• Market-makers may undertake a transaction in any derivative structured product (a combination of permitted cash and generic derivative instruments) as long as it is a combination of two or more of the generic instruments permitted by RBI and does not contain any derivatives as underlying;
• Market-makers should be in a position to arrive at the fair value of all derivative instruments, including structured products on the basis of the following approach :
• Marking the product to market, if a liquid market in the product exists. • In the case of structured products, marking the constituent generic instruments to market. • If (a) and (b) are not feasible, marking the product to model, provided: • All the model inputs are observable market variables. • Full particulars of the model, including the quantitative algorithm should be documented.
• All references to Primary Dealers in these guidelines apply to stand-alone PDs, not Bank- PDs.
• All permitted derivative transactions, including roll over, restructuring and novation shall be contracted only at prevailing market rates.
• All risks arising from derivatives exposures should be analysed and documented, both at transaction level and portfolio level.
• The management of derivatives activities should be an integral part of the overall risk management policy and mechanism. It is desirable that the board of directors and senior management understand the risks inherent in the derivatives activities being undertaken.
• Market-makers should have a ‘Suitability and Appropriateness Policy’ vis-à-vis users in respect of the products offered, on the lines indicated in these guidelines.
• Market-makers may, where they consider necessary, maintain cash margin/liquid collateral in respect of derivative transactions undertaken by users on mark-to-market basis.

www.nseindia.com
Derivatives Market ISMR165
b. Permissible derivative instruments
The RBI permitted banks to trade in the following types of derivative instruments, subject to certain conditions:
• Rupee interest rate derivatives – Interest Rate Swap (IRS), Forward Rate Agreement (FRA), and Interest Rate Futures (IRF).
• Foreign Currency derivatives – Foreign Currency Forward, Currency Swap and Currency Option.
II. Permission for acceptance of Foreign Sovereign Securities as collateral from Foreign Institutional Investors (FIIs) for Exchange Traded Derivative Transactions
For Exchange Traded Derivative transactions, FIIs were required to deposit the collateral with the clearing members, in the form of cash. Under the existing guidelines for clearing members, as per SEBI Circular dated July 28, 1999, for collateral purposes, at least 50% of the liquid assets, is required to be in the form of cash or cash equivalents, and the rest can be in the form of non-cash components. The Reserve Bank of India (RBI) vide A. P. (DIR Series) Circular no. 2 dated July 19, 2007 permitted clearing corporations and clearing members –
a. to open and maintain demat accounts with foreign depositories and to acquire, hold, pledge and transfer the foreign sovereign securities, offered as collateral by FIIs;
b. to remit the proceeds arising from corporate action, if any, on such foreign sovereign securities; and
c. to liquidate such foreign sovereign securities if the need arises.
Accordingly, SEBI issued a circular on September 11, 2007 permitting clearing members to accept foreign sovereign securities with ‘AAA’ rating, (hereinafter referred to as “sovereign securities”) as collateral from FII client with the following necessary safeguards:
i. Before accepting sovereign securities as collateral from FII, the clearing member would be required to enter into a written agreement with the FII and also with the clearing corporation, containing, inter alia, the following terms:
a. In the event of any dispute regarding liquidation or return of the sovereign securities tendered as collateral, or any other incidental matter, the courts in India will have jurisdiction to decide such disputes. Alternatively, the agreement may contain an arbitration clause.
b. The agreement shall also contain the right of the clearing corporation as well as the clearing member to liquidate the sovereign securities tendered as collateral, in the event of default by clearing member or FII, as the case may be.
ii. The clearing member shall take due care to ensure that the sovereign securities tendered as collateral are available for liquidation in the event of insolvency of the FII or any intermediary or any other person located overseas through whom the securities are held.
iii. The clearing corporation shall also take due care to ensure that sovereign securities tendered as collateral are available for liquidation in the event of insolvency of the clearing member or any intermediary or other person located overseas through whom the securities are held.
iv. The clearing corporation shall take adequate care to ensure that the sovereign securities accepted by it as margin are tendered under a mechanism which does not unduly hinder timely liquidation in the event of default by the clearing member.
SEBI further provided that:
• The clearing corporation shall value the collateral tendered by applying due haircuts. The haircut may either be a fi xed percentage or VaR based. A higher haircut may be considered to cover the expected time frame for liquidation. A market determined price as obtained from an internationally recognized data vendor shall be considered for

www.nseindia.com
Derivatives MarketISMR 166
valuation. The prices shall be converted into rupee terms on a daily basis. The rupee value so used for conversion shall be the “RBI Reference rate”. The RBI reference rate shall be disclosed by the clearing corporation to the clearing members, so as to enable them to report the value of the margins collected from FIIs.
• The sovereign securities tendered as collateral shall be treated as part of the cash component of the liquid assets of the clearing member, and shall be subject to the condition that the value of the sovereign securities shall not be more than 10% of the total value of the cash component of the liquid assets of the clearing member.
• The existing procedure for acceptance and release of collateral tendered by domestic investors in the case of domestic securities shall be adopted mutatis mutandis for the sovereign securities tendered by FII, except to the extent specifi cally provided otherwise.
III. Introduction of mini derivative (Futures & Options) contract on Index (Sensex & Nifty)
Pursuant to the recommendation of the SEBI appointed Derivatives Market Review Committee (DMRC) the SEBI Board approved the introduction of mini derivatives contract on Index (Sensex and Nifty). Accordingly, SEBI issued a circular on December 27, 2007, providing as follows:
• To begin with, the mini derivative contract on Index (Sensex and Nifty) would have a minimum contract size of Rs. 1 lakh at the time of its introduction in the market.
• The existing risk containment and other measures applicable for existing exchange traded equity Index derivative contracts would also be extended to the mini derivative contract on Index.
IV. Introduction of Volatility Index
The SEBI appointed Derivatives Market Review Committee (DMRC) had recommended the introduction of Volatility Index and Futures and Options on this Index. Accordingly, SEBI, in January, 2008 permitted Exchanges to construct a Volatility Index and disseminate the same. Volatility Index is a measure of market’s expectation of volatility over the near term. Volatility is often described as the “rate and magnitude of changes in prices” is often referred to as risk. Volatility Index is a measure, of the amount by which an underlying Index is expected to fl uctuate, in the near term, (calculated as annualised volatility, denoted in percentage e.g. 20%) based on the order book of the underlying index options.
The NSE has accordingly designed the fi rst India VIX volatility index and started dessminating the same with effect from April 08, 2008. This index is based on the Nifty 50 Index Option prices. From the best bid-ask prices of Nifty 50 Options contracts, a volatility fi gure (%) is being calculated indicating the expected market volatility over the next 30 calendar days.
V. Long Term Options contracts on S&P CNX NIFTY
The SEBI Derivatives Market Review Committee (DMRC) recommended the introduction of new derivative products in the Indian market, with option contracts on indices and stocks with life/tenure of up to 5 years (60 months) being one of them. Accordingly SEBI approved introduction of Long Term Options contracts on S&P CNX NIFTY for trading in F&O segment. The cycle for Long Term Options contracts on S&P CNX NIFTY would be as
The 3 serial month contracts would continue to exist.
The 3 quarterly months of the cycle March / June / September / December would be available.
After these, 5 following semi-annual months of the cycle June / December would be available, so that at any point in time there would be options contracts with atleast 3 year tenure available.
Revised contract specifi cations for Nifty Options is given in the table 1 below.
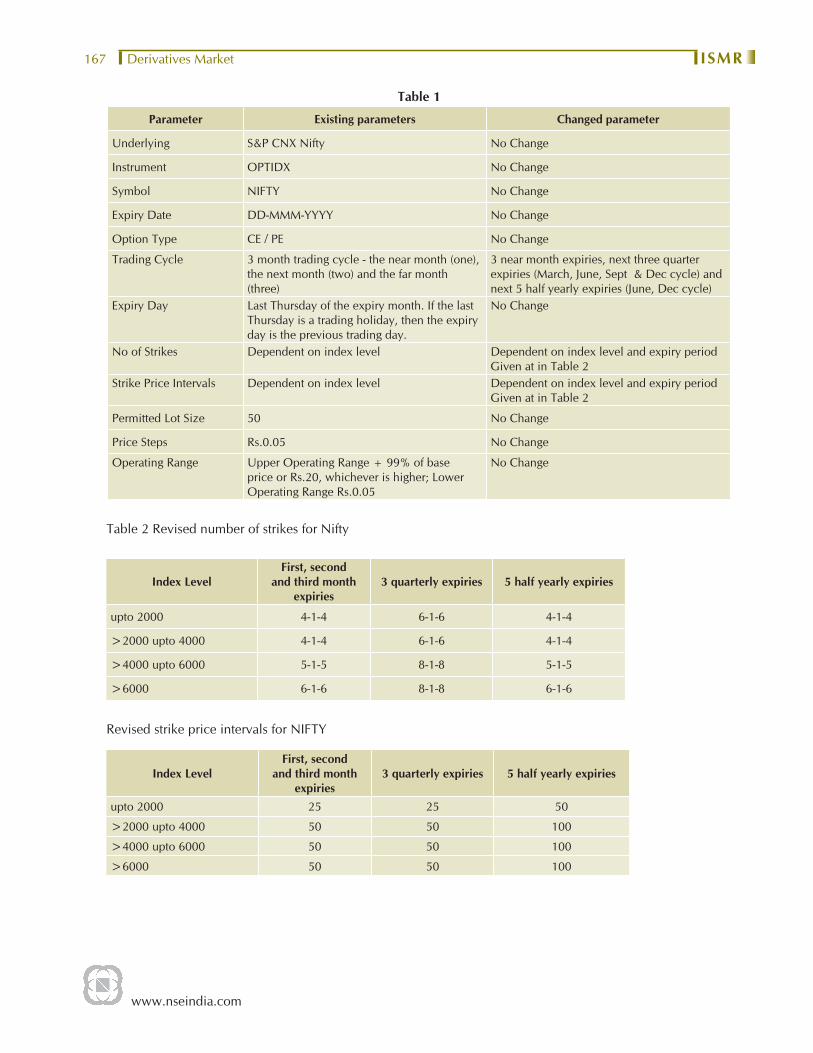
www.nseindia.com
Derivatives Market ISMR167
Table 1
Parameter Existing parameters Changed parameter
Underlying S&P CNX Nifty No Change
Instrument OPTIDX No Change
Symbol NIFTY No Change
Expiry Date DD-MMM-YYYY No Change
Option Type CE / PE No Change
Trading Cycle 3 month trading cycle - the near month (one), the next month (two) and the far month (three)
3 near month expiries, next three quarter expiries (March, June, Sept & Dec cycle) and next 5 half yearly expiries (June, Dec cycle)
Expiry Day Last Thursday of the expiry month. If the last Thursday is a trading holiday, then the expiry day is the previous trading day.
No Change
No of Strikes Dependent on index level Dependent on index level and expiry periodGiven at in Table 2
Strike Price Intervals Dependent on index level Dependent on index level and expiry periodGiven at in Table 2
Permitted Lot Size 50 No Change
Price Steps Rs.0.05 No Change
Operating Range Upper Operating Range + 99% of base price or Rs.20, whichever is higher; Lower Operating Range Rs.0.05
No Change
Table 2 Revised number of strikes for Nifty
Index LevelFirst, second
and third month expiries
3 quarterly expiries 5 half yearly expiries
upto 2000 4-1-4 6-1-6 4-1-4
>2000 upto 4000 4-1-4 6-1-6 4-1-4
>4000 upto 6000 5-1-5 8-1-8 5-1-5
>6000 6-1-6 8-1-8 6-1-6
Revised strike price intervals for NIFTY
Index LevelFirst, second
and third month expiries
3 quarterly expiries 5 half yearly expiries
upto 2000 25 25 50
>2000 upto 4000 50 50 100
>4000 upto 6000 50 50 100
>6000 50 50 100

www.nseindia.com
Derivatives MarketISMR 168
VI Introduction of Futures and Options contracts on S&P CNX Defty Index
Trading in Futures and options on CNX Defty index was introduced w.e.f. 10th December 2008.The contraction specifi cations are mentioned in the table below.
Underlying Index S&P CNX Defty
Security descriptor Futures : FUTIDX DEFTYOptions : OPTIDX DEFTY
Price steps Re. 0.05
Permitted lot size 150
Price Bands No Price bands
Trading Cycle Maximum of three months – the near month, the next month and the far month. New contract shall be introduced on the next trading day following the expiry of near month contract
Expiry day Last Thursday of the expiry month or the previous trading day if the last Thursday is a trading holiday
Settlement basis Cash settlement
Style of option European
Market Design Only two exchanges in India have been permitted to trade in derivatives contracts, the NSE and the BSE. NSE’s contribution to the total turnover in the market is nearly 99%. Hence, the market design enumerated in this section is the derivative segment of NSE (hereafter referred to as the F&O segment). The different aspects of market design for F&O segment of the exchanges can be summarized as follows:
Trading Mechanism
• NEAT-F&O system: a fully automated screen-based, anonymous order driven trading system for derivatives on a nationwide basis.
• There are four entities in the trading system:
1. Trading members who can trade either on their own account or on behalf of their clients including participants.
2. Clearing members who are members of NSCCL and carry out risk management activities and confi rmation/inquiry of trades through the trading system. These clearing members are also trading members and clear trades for themselves and/or others.
3. Professional clearing members are clearing members who are not trading members. Typically, banks and custodians become PCMs and clear and settle for their trading members.
Participants who are client of trading members like fi nancial institutions. These clients may trade through multiple trading members, but settle their trades through a single clearing member only.
Membership The members are admitted by NSE for its F&O segment in accordance with the rules and regulations of the Exchange and the norms specifi ed by the SEBI. The eligibility criteria for membership on F&O segment has been mentioned in Chapter 4 Secondary Market – Trading. At the end of June 2008, there were 983members in the F&O segment.
Contracts available
• Index futures and index options contracts on NSE based on Nifty 50 Index, CNX IT Index, Bank Nifty Index, CNX Nifty Junior, CNX 100, Nifty Midcap 50 and S&P CNX Defty.
• Stock Futures and options, based on 265 individual securities. • Interest rate Futures rate contracts on Notional 91 day t-bill and Notional 10 year bond (6%
coupon bearing and zero coupon bond).

www.nseindia.com
Derivatives Market ISMR169
Charges Transaction charges payable to the exchange by the trading member for the trades executed by him on the F&O segment are fi xed at Rs. 2 per lakh of turnover (0.002%) subject to a minimum of Rs. 1,00,000 per year. However for the transactions in the options sub-segment the transaction charges are levied on the premium value at the rate of 0.05% (each side) instead of on the strike price as levied earlier.Derivatives on S&P CNX Defty both futures and options was started with effect from December 10, 2008. Transaction charges in respect of all trades done from December 10, 2008 till March 31, 2009 in the futures and options contracts of S&P CNX Defty have been waivedTransaction charges payable to the exchange by the trading member for the trades executed by him on the F&O segment are fi xed at Rs. 2 per lakh of turnover (0.002%) subject to a minimum of Rs. 1,00,000 per year. However for the transactions in the options sub-segment the transaction charges are levied on the premium value at the rate of 0.05% (each side) instead of on the strike price as levied earlier.Derivatives on S&P CNX Defty both futures and options was started with effect from December 10, 2008. Transaction charges in respect of all trades done from December 10, 2008 till March 31, 2009 in the futures and options contracts of S&P CNX Defty have been waivedSecurities Transaction Tax
The trading members are also required to pay securities transaction tax (STT) on non-delivery transactions at the rate of 0.017 (payable by the seller) for derivatives w. e. f June 1, 2008.
Taxable securities transaction Rate (%) Taxable Value Payable by
Sale of an option in securities 0.017 Option premium
Seller
Sale of an option in securities, where option is exercised
0.125 Settlement Price
Purchaser
Sale of a futures in securities 0.017 Sale Price Seller
Value of taxable securities transaction relating to an “option in securities” will be the option premium, in case of sale of an option in securities. Value of taxable securities transaction relating to an “option in securities” will be the settlement price, in case of sale of an option in securities, where option is exercised. Contribution to Investor Protection FundThe trading members contribute to Investor Protection Fund of F&O segment at the rate of Re.1/- per Rs. 100 crore of the traded value (each side) in case of Futures segment and Rs.1/- per Rs. 100 crore of the premium amount (each side) in case of Options segment.
Clearing and Settlement
• National Securities Clearing Corporation Limited (NSCCL) undertakes clearing and settlement of all trades executed on the futures and options (F&O) segment of the NSE.
• Index as well as stock options and futures are settled in cash.
Risk Management Framework
NSCCL has developed a comprehensive risk containment mechanism for the F&O segment. The salient features of risk containment mechanism on the F&O segment are:
a. The fi nancial soundness of the members is the key to risk management. Therefore, the requirements for membership in terms of capital adequacy (net worth, security deposits) are quite stringent.
b. NSCCL charges an upfront initial margin for all the open positions of a Clearing Member. It specifi es the initial margin requirements for each futures/options contract on a daily basis. It also follows Value- at- Risk (VaR) based margining computed through SPAN. The CM in turn collects the initial margin from the Trading Members (TMs) and their respective clients.
www.nseindia.com
Derivatives MarketISMR 170
c. The open positions of the members are marked to market based on contract settlement price for each contract at the end of the day. The difference is settled in cash on a T+1 basis.
d. NSCCL’s on-line position monitoring system monitors a CM’s open position on a real-time basis. Limits are set for each CM based on his effective deposits. The on-line position monitoring system generates alert messages whenever a CM reaches 70 %, 80 %, 90 % and a disablement message at 100 % of the limit. NSCCL monitors the CMs for Initial Margin violation, Exposure margin violation, while TMs are monitored for Initial Margin violation and position limit violation.
e. CMs are provided with a trading terminal for the purpose of monitoring the open positions of all the TMs clearing and settling through him. A CM may set exposure limits for the TM clearing and settling through him. NSCCL assists the CM to monitor the intra-day limits set up by a CM and whenever a TM exceed the limits, it stops that particular TM from further trading.
f. A member is alerted of his position to enable him to adjust his exposure or bring in additional capital. Margin violations result in disablement of trading facility for all TMs of a CM in case of a violation by the CM.
g. A separate settlement guarantee fund for this segment has been created out of the base capital of members.
The most critical component of risk containment mechanism for F&O segment is the margining system and on-line position monitoring. The actual position monitoring and margining is carried out on–line through Parallel Risk Management System (PRISM). PRISM uses SPAN®2 (Standard Portfolio Analysis of Risk). SPAN system is for the purpose of computation of on-line margins, based on the parameters defi ned by SEBI.
Risk Containment Measures
A. Eligibility Criteria for stock selection
The stock selection criteria for derivatives trading in India ensure that stock is large in terms of market capitalization, turnover and has suffi cient liquidity in the underlying market and there are no adverse issues related to market manipulation.
Eligibility Criteria for selection of stocks and indices for futures and options contracts
The following criteria was adopted by the Exchange w.e.f September 22, 2006, for selecting stocks and indices on which Futures & Options contracts are to be introduced.
1. Eligibility criteria of stocks
• The stock are to be chosen from amongst the top 500 stocks in terms of average daily market capitalisation and average daily traded value in the previous six months on a rolling basis.
• The stock’s median quarter-sigma order size over the last six months should be not less than Rs. 0.10 million (Rs. 1 lac). For this purpose, a stock’s quarter-sigma order size would mean the order size (in value terms) required to cause a change in the stock price equal to one-quarter of a standard deviation.
• The market wide position limit in the stock should not be less than Rs. 500 million (Rs. 50 crores). The market wide position limit (number of shares) is be valued taking the closing prices of stocks in the underlying cash market on the date of expiry of contract in the month. The market wide position limit of open position (in terms of the number of underlying stock) on futures and option contracts on a particular underlying stock is :
• 20% of the number of shares held by non-promoters in the relevant underlying security i.e. free-fl oat holding.
2 SPAN ® is a registered trademark of the Chicago Mercantile (CME) used here under license.

www.nseindia.com
Derivatives Market ISMR171
• If an existing security fails to meet the eligibility criteria for three months consecutively, then no fresh month contract can be issued on that security.
However, the existing unexpired contracts may be permitted to trade till expiry and new strikes may also be introduced in the existing contract months.
Selection criteria for unlisted companies
For unlisted companies coming out with initial public offering, if the net public offer is Rs. 500 crore or more, then the Exchange may consider introducing stock options and stock futures on such stocks at the time of its’ listing in the cash market.
Re-introduction of dropped stocks
• A stock which is dropped from derivatives trading may become eligible once again. In such instances, the stock is required to fulfi ll the eligibility criteria for three consecutive months to be re-introduced for derivatives trading.
Eligibility criteria of stocks for derivatives trading especially on account of corporate restructuring
The eligibility criteria for stocks for derivatives trading on account of corporate restructuring is as under:
I. All the following conditions should be met in the case of shares of a company undergoing restructuring through any means, for eligibility to re-introduce derivative contracts on that company from the fi rst day of listing of the post restructured company/(s)’s (as the case may be) stock (herein referred to as post restructured company) in the underlying market,
a) the Futures and options contracts on the stock of the original (pre restructure) company were traded on any exchange prior to its restructuring;
b) the pre restructured company had a market capitalisation of at least Rs.1000 crores prior to its restructuring;
c) the post restructured company would be treated like a new stock and if it is, in the opinion of the exchange, likely to be at least one-third the size of the pre restructuring company in terms of revenues, or assets, or (where appropriate) analyst valuations; and
d) in the opinion of the exchange, the scheme of restructuring does not suggest that the post restructured company would have any characteristic (for example extremely low free fl oat) that would render the company ineligible for derivatives trading,
II. If the above conditions are satisfi ed, then the exchange takes the following course of action in dealing with the existing derivative contracts on the pre-restructured company and introduction of fresh contracts on the post restructured company
a) In the contract month in which the post restructured company begins to trade, the Exchange shall introduce near month, middle month and far month derivative contracts on the stock of the restructured company.
b) In subsequent contract months, the normal rules for entry and exit of stocks in terms of eligibility requirements would apply. If these tests are not met, the exchange does not permit further derivative contracts on this stock and future month series are not be introduced.
2. Eligibility criteria of Indices
• The Exchange may consider introducing derivative contracts on an index if the stocks contribution to 80% weight age of the index are individually eligible for derivative trading. However, no single ineligible stocks in the index shall have a weightage of more than 5% in the index.”

www.nseindia.com
Derivatives MarketISMR 172
• The above criteria is applied every month, if the index fails to meet the eligibility criteria for three months consecutively, then no fresh month contract shall be issued on that index. However, the existing unexpired contracts are permitted to trade till expiry and new strikes may also be introduced in the existing contracts.
B. Margins Requirements
As pointed out above, one of the critical components of risk containment mechanism for F&O segment is the margining system. This is explained below:
• Initial margin: Margin in the F&O segment is computed by NSCCL upto client level for open positions of CMs/TMs. These are required to be paid up-front on gross basis at individual client level for client positions and on net basis for proprietary positions. NSCCL collects initial margin for all the open positions of a CM based on the margins computed by NSE-SPAN. A CM is required to ensure collection of adequate initial margin from his TMs up-front. The TM is required to collect adequate initial margins up-front from his clients.
Initial margin requirement is based on 99% VaR and worst case loss over a specifi ed horizon, which depends on the time in which Mark to Market margin is collected. A portfolio based margining approach has been adopted which takes an integrated view of the risk involved in the portfolio of each individual client comprising of his positions in all derivative contracts. The initial margin requirements are based on worst scenario, loss of a portfolio of an individual client to cover 99% VaR over a one day horizon across various scenarios of price changes and volatility shifts.
• Premium Margin: In addition to Initial Margin, Premium Margin is charged at client level. This margin is required to be paid by a buyer of an option till the premium settlement is complete.
• Assignment Margin for Options on Securities: Assignment margin is levied in addition to initial margin and premium margin. It is required to be paid on assigned positions of CMs towards interim and fi nal exercise settlement obligations for option contracts on individual securities, till such obligations are fulfi lled. The margin is charged on the net exercise settlement value payable by a CM towards interim and fi nal exercise settlement.
• Exposure margins: Clearing members are subject to exposure margins in addition to initial margins.
• Client Margins: NSCCL intimates all members of the margin liability of each of their client. Additionally members are also required to report details of margins collected from clients to NSCCL, which holds in trust client margin monies to the extent reported by the member as having been collected form their respective clients.
C. Exposure Monitoring and Position Limit
Another component of the risk management framework for derivatives segment is the stiputation of exposure limits and position limits on trading in different categories of contracts by market participants. These are summarized below:
Index Options Index Futures Stock Options Stock FuturesExposure Limit
33.33 times the liquid net-worth of the member. Liquid net-worth is the total liquid assets deposited with the Exchange/ Clearing Corporation towards initial margin and the capital adequacy, LESS initial margin applicable to the total gross position at any given point of time of all trades cleared through the clearing member.
33.33 times the liquid net-worth of the member.
Higher of 5% or 1.5 sigma of the notional value of gross open position.
Higher of 5% or 1.5 sigma of the notional value of gross open position.
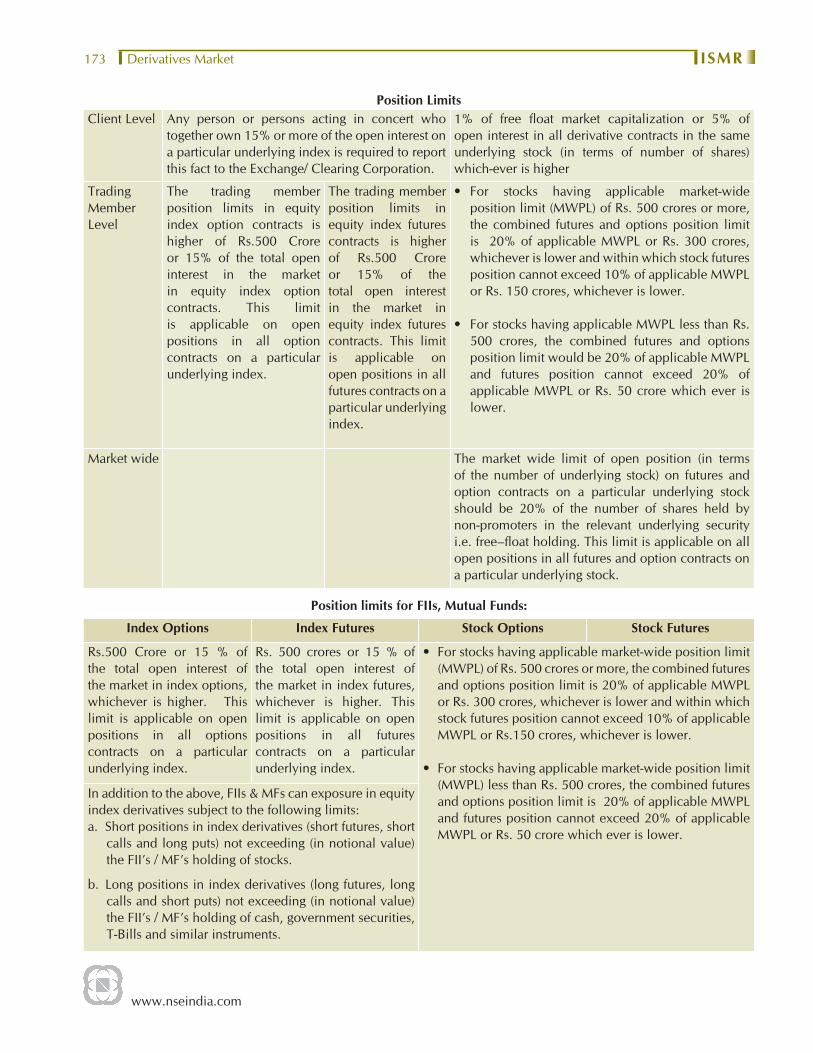
www.nseindia.com
Derivatives Market ISMR173
Position LimitsClient Level Any person or persons acting in concert who
together own 15% or more of the open interest on a particular underlying index is required to report this fact to the Exchange/ Clearing Corporation.
1% of free fl oat market capitalization or 5% of open interest in all derivative contracts in the same underlying stock (in terms of number of shares) which-ever is higher
Trading Member Level
The trading member position limits in equity index option contracts is higher of Rs.500 Crore or 15% of the total open interest in the market in equity index option contracts. This limit is applicable on open positions in all option contracts on a particular underlying index.
The trading member position limits in equity index futures contracts is higher of Rs.500 Crore or 15% of the total open interest in the market in equity index futures contracts. This limit is applicable on open positions in all futures contracts on a particular underlying index.
• For stocks having applicable market-wide position limit (MWPL) of Rs. 500 crores or more, the combined futures and options position limit is 20% of applicable MWPL or Rs. 300 crores, whichever is lower and within which stock futures position cannot exceed 10% of applicable MWPL or Rs. 150 crores, whichever is lower.
• For stocks having applicable MWPL less than Rs. 500 crores, the combined futures and options position limit would be 20% of applicable MWPL and futures position cannot exceed 20% of applicable MWPL or Rs. 50 crore which ever is lower.
Market wide The market wide limit of open position (in terms of the number of underlying stock) on futures and option contracts on a particular underlying stock should be 20% of the number of shares held by non-promoters in the relevant underlying security i.e. free–float holding. This limit is applicable on all open positions in all futures and option contracts on a particular underlying stock.
Position limits for FIIs, Mutual Funds:
Index Options Index Futures Stock Options Stock Futures
Rs.500 Crore or 15 % of the total open interest of the market in index options, whichever is higher. This limit is applicable on open positions in all options contracts on a particular underlying index.
Rs. 500 crores or 15 % of the total open interest of the market in index futures, whichever is higher. This limit is applicable on open positions in all futures contracts on a particular underlying index.
• For stocks having applicable market-wide position limit (MWPL) of Rs. 500 crores or more, the combined futures and options position limit is 20% of applicable MWPL or Rs. 300 crores, whichever is lower and within which stock futures position cannot exceed 10% of applicable MWPL or Rs.150 crores, whichever is lower.
• For stocks having applicable market-wide position limit (MWPL) less than Rs. 500 crores, the combined futures and options position limit is 20% of applicable MWPL and futures position cannot exceed 20% of applicable MWPL or Rs. 50 crore which ever is lower.
In addition to the above, FIIs & MFs can exposure in equity index derivatives subject to the following limits:a. Short positions in index derivatives (short futures, short
calls and long puts) not exceeding (in notional value) the FII’s / MF’s holding of stocks.
b. Long positions in index derivatives (long futures, long calls and short puts) not exceeding (in notional value) the FII’s / MF’s holding of cash, government securities, T-Bills and similar instruments.

www.nseindia.com
Derivatives MarketISMR 174
D. NSE - Span
The objective of NSE-SPAN is to identify overall risk in a portfolio of all futures and options contracts for each member. The system treats futures and options contracts uniformly, while at the same time recognising the unique exposures associated with options portfolios, like extremely deep out-of-the-money short positions and inter-month risk.
Its over-riding objective is to determine the largest loss that a portfolio might reasonably be expected to suffer from one day to the next day based on 99% VaR methodology.
SPAN considers uniqueness of option portfolios. The following factors affect the value of an option:
• Underlying market price.
• Volatility (variability) of underlying instrument, and
• Time to expiration.
• Interest rate
• Strike price
As these factors change, the value of options maintained within a portfolio also changes. Thus, SPAN constructs scenarios of probable changes in underlying prices and volatilites in order to identify the largest loss a portfolio might suffer from one day to the next. It then sets the margin requirement to cover this one-day loss.
The complex calculations (e.g. the pricing of options) in SPAN are executed by NSCCL. The results of these calculations are called risk arrays. Risk arrays, and other necessary data inputs for margin calculation are provided to members daily in a fi le called the SPAN Risk Parameter fi le. Members can apply the data contained in the Risk Parameter fi les, to their specifi c portfolios of futures and options contracts, to determine their SPAN margin requirements.
Hence, members need not execute a complex option pricing calculation, which is performed by NSCCL. SPAN has the ability to estimate risk for combined futures and options portfolios, and also re-value the same under various scenarios of changing market conditions.
NSCCL generates six risk parameters fi le for a day taking into account price and volatilities at various time intervals and are provided on the website of the Exchange
Market Design For Currency Derivatives Currency derivatives have been launched on the NSE in August, 2008. The market design, including the risk management framework for this new product is summarized below:
Eligibility criteria
The following entities are eligible to apply for membership subject to the regulatory norms and provisions of SEBI and as provided in the Rules, Regulations, Byelaws and Circulars of the Exchange -
1. Individuals;
2. Partnership Firms registered under the Indian Partnership Act, 1932;
3. Corporations, Companies or Institutions or subsidiaries of such Corporations, Companies or Institutions set up for providing fi nancial services;
4. Such other person as may be permitted under the Securities Contracts (Regulation) Rules 1957
Professional Clearing Member (PCM)
The following persons are eligible to become PCMs of NSCCL for Currency Futures Derivatives provided they fulfi l the prescribed criteria:
1. SEBI Registered Custodians; and
2. Banks recognised by NSEIL/NSCCL for issuance of bank guarantees

www.nseindia.com
Derivatives Market ISMR175
Banks authorized by the Reserve Bank of India under section 10 of the Foreign Exchange Management Act, 1999 as ‘AD Category - I bank’ are permitted to become trading and clearing members of the currency futures market of the recognized stock exchanges, on their own account and on behalf of their clients, subject to fulfi lling the following minimum prudential requirements:
a) Minimum net worth of Rs. 500 crores.
b) Minimum CRAR of 10 per cent.
c) Net NPA should not exceed 3 per cent.
d) Made net profi t for last 3 years.
The AD Category - I banks which fulfi ll the prudential requirements are required to lay down detailed guidelines with the approval of their Boards for trading and clearing of currency futures contracts and management of risks.
AD Category - I banks which do not meet the above minimum prudential requirements and AD Category - I banks which are Urban Co-operative banks or State Co-operative banks can participate in the currency futures market only as clients, subject to approval therefore from the respective regulatory Departments of the Reserve Bank.
Other applicable eligibility criteria
1. Where the applicant is a partnership fi rm/corporate entity, the applicant shall identify a Dominant Promoter Group as per the norms of the Exchange at the time of making the application. Any change in the shareholding of the company including that of the said Dominant Promoter Group or their shareholding interest shall be effected only with the prior permission of NSEIL/SEBI.
2. The applicant has to ensure that at any point of time they would ensure that atleast individual/one partner/one designated director/compliance offi cer would have a valid NCFM certifi cation as per the requirements of the Exchange. The above norm would be a continued admittance norm for membership of the Exchange.
3. An applicant must be in a position to pay the membership and other fees, deposits etc, as applicable at the time of admission within three months of intimation to him of admission as a Trading Member or as per the time schedule specifi ed by the Exchange.
4. The trading members and sales persons in the currency futures market must have passed a certifi cation programme which is considered adequate by SEBI. The approved users and sales personnel of the trading member should have passed the certifi cation programme.
5. To begin with, FIIs and NRIs would not be permitted to participate in currency futures market.
6. Strict enforcement of “Know your customer” rule is required. Therefore every client shall be registered with the member. The members are also required to make their clients aware of the risks involved in derivatives trading by issuing to the client the Risk Disclosure Document and obtain a copy of the same duly signed by the client. The members shall enter into a member constituent agreement as stipulated.
7. The Exchange may specify such standards for investor service and infrastructure with regard to any category of applicants as it may deem necessary, from time to time.
Position limits
Client Level Position Limit: The client level position limit as prescribed in the Report of the RBI-SEBI Standing Technical Committee shall be applicable where the gross open position of the client across all contracts exceeds 6% of the total open interest or 5 million USD, whichever is higher.
www.nseindia.com
Derivatives MarketISMR 176
The client level gross open position would be computed on the basis of PAN across all members.
Trading Member Level Position Limit: The trading member position limit shall be higher of 15% of the total open interest or 25 million USD. However, the position limit for a Trading Member, which is a bank, shall be higher of 15% of the total open interest or 100 million USD.
Margins
• Initial Margins: Initial margin shall be payable on all open positions of Clearing Members, upto client level, and shall be payable upfront by Clearing Members in accordance with the margin computation mechanism and/ or system as may be adopted by the Clearing Corporation from time to time. Initial Margin shall include SPAN margins, futures fi nal settlement margin and such other additional margins, that may be specifi ed by the Clearing Corporation from time to time.
• Calendar Spread Margins: A currency futures position in one expiry month which is hedged by an offsetting position in a different expiry month would be treated as a calendar spread. The calendar spread margin shall be Rs. 250/- per contract for all months of spread. The benefi t for a calendar spread would continue till expiry of the near month contract.
• Minimum Margins: The minimum margin percentage shall be 1.75% on the fi rst day of currency futures trading and 1 % thereafter which shall be scaled up by look ahead period as may be specifi ed by the Clearing Corporation from time to time
• Futures Final Settlement Margin: Futures Final Settlement Margin shall be levied at the clearing member level in respect of the fi nal settlement amount due. The fi nal settlement margins shall be levied from the last trading day of the contract till the completion of pay-in towards the Final Settlement.
• Extreme Loss margins: Clearing members shall be subject to extreme loss margins in addition to initial margins. The applicable extreme loss margin shall be 1% on the mark to market value of the gross open positions or as may be specifi ed by the relevant authority from time to time.
Charges
In order to encourage active participation in the Currency Derivatives segment, the Exchange, has waived the transaction charges till March 31, 2009.However, every Trading Member participating in trading in the Currency Derivatives segment at any time during the waiver period shall be required to make a lump sum contribution of Rs.500/- as contribution to Investor Protection Fund.
Market Outcome
Trading Volumes
NSE’s derivatives market has been witnessing a tremendous advancement in terms of volumes and array of products accessible for trading. The market has achieved a growth of 78% over the past one year where the turnover has augmented to Rs. 130,904,779 million (3,275,076 US $ million) in 2007-08 from Rs. 73,562,714 million (US $ 1,687,605 million) in 2006-07. The trading value in F&O segment of the NSE stood at Rs 108,40,643 million (US $ 252,401 million) in June, 2008. (Table 7-7).

www.nseindia.com
Derivatives Market ISMR177
Table 7-7: Trade Details of Derivatives Market
Month/Year
NSE BSE TOTAL
No. of Contracts
Traded
Turnover (Rs. mn.)
Turnover (US$
million)
No. of Contracts
Traded
Turnover (Rs.mn.)
Turnover (US$
million)
No. of Contracts
Traded
Turnover (Rs. mn.)
Turnover (US$ million)
2003-04 56,886,776 21,306,492 491,046 382,258 124,520 2,870 57,269,034 21,431,012 493,916
2004-05 77,017,185 25,470,526 582,183 531,719 161,120 3,683 77,548,904 25,631,646 585,866
2005-06 157,619,271 48,242,504 1,081,428 103 60 1.34 157,619,374 48,242,564 1,081,429
2006-07 216,883,573 73,562,714 1,687,605 1,781,670 590,070 13,537 218,665,243 74,152,784 1,701,142
Apr-07 26,540,967 6,162,866 154,187 483,332 155,850 3,899 27,024,299 6,318,716 158,086
May-07 28,383,804 7,234,428 180,996 494,245 170,160 4,257 28,878,049 7,404,588 185,254
Jun-07 30,731,428 8,065,421 201,787 508,258 177,550 4,442 31,239,686 8,242,971 206,229
Jul-07 34,737,234 10,150,765 253,960 564,606 204,450 5,115 35,301,840 10,355,215 259,075
Aug-07 40,235,925 10,567,313 264,381 554,657 200,110 5,007 40,790,582 10,767,423 269,388
Sep-07 34,119,312 10,728,888 268,424 537,551 215,030 5,380 34,656,863 10,943,918 273,803
Oct-07 49,385,474 18,336,630 458,760 519,574 239,850 6,001 49,905,048 18,576,480 464,761
Nov-07 35,521,913 15,173,045 379,611 458,249 222,680 5,571 35,980,162 15,395,725 385,182
Dec-07 30,253,304 12,742,301 318,797 678,810 203,140 5,082 30,932,114 12,945,441 323,879
Jan-08 44,730,463 14,538,809 363,743 1,008,630 222,830 5,575 45,739,093 14,761,639 369,318
Feb-08 33,185,704 8,992,169 224,973 855,792 225,640 5,645 34,041,496 9,217,809 230,618
Mar-08 37,187,672 8,212,145 205,458 789,667 185,790 4,648 37,977,339 8,397,935 210,106
2007-08 425,013,200 130,904,779 3,275,076 7,453,371 2,423,080 60,622 432,466,571 133,327,859 3,335,698
Apr-08 33,729,824 7,664,307 178,447 166,607 40,630 946 33,896,431 7,704,937 179,393
May-08 33,840,055 7,979,084 185,776 179,060 45,580 1,061 34,019,115 8,024,664 186,837
Jun-08 51,601,129 10,840,643 252,401 59,962 13,600 317 51,661,091 10,854,243 252,718
April 08 -June 08 119,171,008 26,484,033 616,625 405,629 99,810 2,324 119,576,637 26,583,843 618,949
BSE’s derivatives segment saw an unprecedented increase in its trading volume in 2007-08. The volumes increased from Rs. 590,070 million (US $ 13,537 million) in 2006-07 to Rs. 2,423,080 million (US $ 60,622 million) in 2007-08, a rise of 311%. However, the share of BSE in the total derivative markets turnover remains a miniscule 1.81%.
Looking at the product-wise turnover on the NSE (Table 7-8 and Chart 7-1), it is seen that stock futures account for the highest percentage turnover among the various products, followed by index futures. In 2007-08 index futures accounted for 29% and stock futures accounted for 58% of the total derivatives markets turnover on the NSE.. Thus, it is evident from the statistics that the futures are more popular than options; futures contracts on securities being the most popular. During the fi rst quarter 2008-09, a rise in the volumes is noticed in Index options which accounted for 22 % of the total derivatives turnover.

www.nseindia.com
Derivatives MarketISMR 178
Tabl
e 7-
8: P
rodu
ct w
ise
turn
over
on
the
deri
vativ
es s
egm
ent o
f NSE
Year
Inde
x Fu
ture
sSt
ock
Futu
res
Inde
x O
ptio
nsSt
ock
Opt
ions
Tota
lA
vera
ge
Dai
ly
Turn
over
(R
s. m
n.)
No.
of
cont
ract
sTu
rnov
er
(Rs.
mn.
)%
sha
re
in to
tal
turn
over
No.
of
cont
ract
sTu
rnov
er
(Rs.
mn.
)%
sha
re
in to
tal
turn
over
No.
of
cont
ract
sN
otio
nal
Turn
over
(R
s.m
n.)
% s
hare
in
tota
l tu
rnov
er
No.
of
cont
ract
sN
otio
nal
Turn
over
(R
s. m
n)
% s
hare
in
tota
l tu
rnov
er
No.
of
cont
ract
sTu
rnov
er
(Rs.
mn)
2004
-05
21,
635,
449
7,7
21,4
70
30.3
2 4
7,04
3,06
6 1
4,84
0,56
0 58
.27
3,2
93,5
58
1,2
19,5
36
4.79
5,04
5,11
2 1,
688,
360
6.63
77,
017,
185
25,
469,
820
101
,070
2005
-06
58,
537,
886
15,1
37,5
50
31.3
8 8
0,90
5,49
3 2
7,91
6,97
0 57
.87
12,
935,
116
3,3
84,6
90
7.02
5,24
0,77
6 1,
802,
530
3.74
157,
619,
271
48,
241,
740
192
,200
2006
-07
81,
487,
424
25,3
95,7
40
34.5
2 1
04,9
55,4
01
38,
309,
670
52.0
8 2
5,15
7,43
8 7
,919
,060
10
.77
,283
,310
1,
937,
950
2.63
16,
883,
573
73,
562,
420
295
,430
2007
-08
15
6,59
8,57
9 38
,206
,673
29
.19
203
,587
,952
75
,485
,632
57
.66
55,
366,
038
13,
621,
109
10.4
19,
460,
631
3,59
1,36
6 2.
74 2
5,01
3,20
0 13
0,90
4,77
8 5
21,5
33
Apr
-08
12,
063,
172
2,8
01,0
03
36.5
5 1
5,60
1,53
1 3
,369
,009
43
.96
5,3
65,2
31
1,3
35,6
49
17.4
3 6
99,8
90
158
,647
2.
07 3
3,72
9,82
4 7
,664
,306
3
83,2
15
May
-08
11,
161,
427
2,6
76,4
07
33.5
4 1
6,69
3,26
0 3
,801
,607
47
.64
5,0
78,9
60
1,2
90,6
65
16.1
8 9
06,4
08
210
,405
2.
64 3
3,84
0,05
5 7
,979
,084
3
98,9
54
Jun-
08 1
7,94
1,87
0 3
,779
,390
34
.86
19,
154,
946
3,7
59,8
67
34.6
8 1
3,56
4,43
6 3
,087
,086
28
.48
939
,877
2
14,2
99
1.98
51,
601,
129
10,
840,
643
516
,221
Apr
il 08
- Ju
ne 0
8 4
1,16
6,46
9 9
,256
,800
34
.95
51,
449,
737
10,
930,
483
41.2
7 2
4,00
8,62
7 5
,713
,400
21
.57
2,54
6,17
5 5
83,3
50
2.20
119,
171,
008
26,
484,
033
434
,164
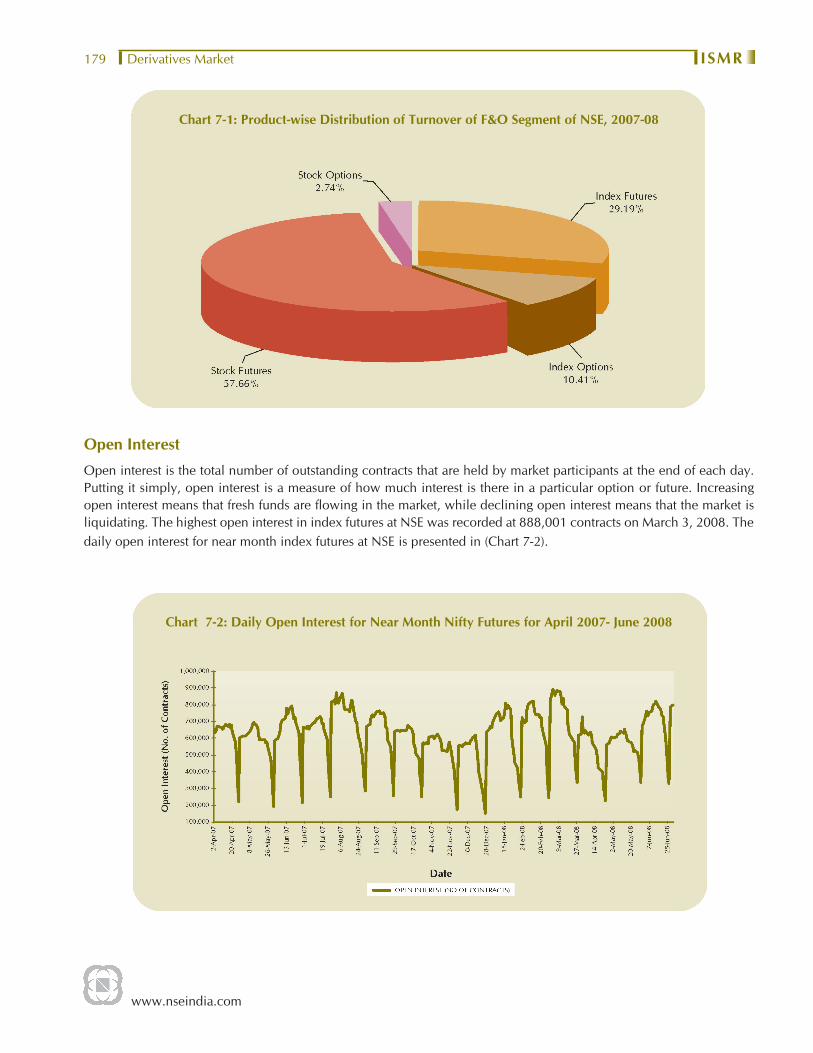
www.nseindia.com
Derivatives Market ISMR179
Chart 7-1: Product-wise Distribution of Turnover of F&O Segment of NSE, 2007-08
Open Interest
Open interest is the total number of outstanding contracts that are held by market participants at the end of each day. Putting it simply, open interest is a measure of how much interest is there in a particular option or future. Increasing open interest means that fresh funds are fl owing in the market, while declining open interest means that the market is liquidating. The highest open interest in index futures at NSE was recorded at 888,001 contracts on March 3, 2008. The daily open interest for near month index futures at NSE is presented in (Chart 7-2).
Chart 7-2: Daily Open Interest for Near Month Nifty Futures for April 2007- June 2008

www.nseindia.com
Derivatives MarketISMR 180
Implied Interest Rate
In the futures market, implied interest rate or cost of carry is often used inter-changeably. Cost of carry is more appropriately used for commodity futures, as by defi nition it means the total costs required to carry a commodity or any other good forward in time. The costs involved are storage cost, insurance cost, transportation cost and the fi nancing cost. In case of equity futures, the carry cost is the cost of fi nancing minus the dividend returns. Assuming zero dividends, the only relevant factor is the cost of fi nancing.
Implied interest rate is the percentage difference between the future value of an index and the spot value, annualized on the basis of the number of days before the expiry of the contract. Carry cost or implied interest rate plays an important role in determining the price differential between the spot and the futures market. By comparing the implied interest rate and the existing interest rate level, one can determine the relative cost of futures’ market price. Implied interest rate is also a measure of profi tability of an arbitrage position. Theoretically, if the futures price is less than the spot price plus cost of carry or if the futures price is greater than the spot price plus cost of carry, arbitrage opportunities exist.
The futures prices are available for different contracts at different points of time. (Chart 7-3) presents Nifty 50 futures close prices for the near month contracts, and the spot Nifty 50 close values from April 2007 to June 2008. The difference between the future and the spot price is called basis. As the time to expiration approaches, the basis reduces. Daily implied interest rate for Nifty 50 futures from April 2007 to June 2008 is presented in (Chart 7-4). The implied interest rate for near month Nifty 50 futures as on last trading of the month is presented in (Table 7-9). It is observed that index futures market suffers from mispricing in the sense that futures trade at discount to underlying. This may be due to restrictions on short sales and lack of maturity.
Chart 7-3: Nifty Futures and Spot Price (April 2007-June 2008)
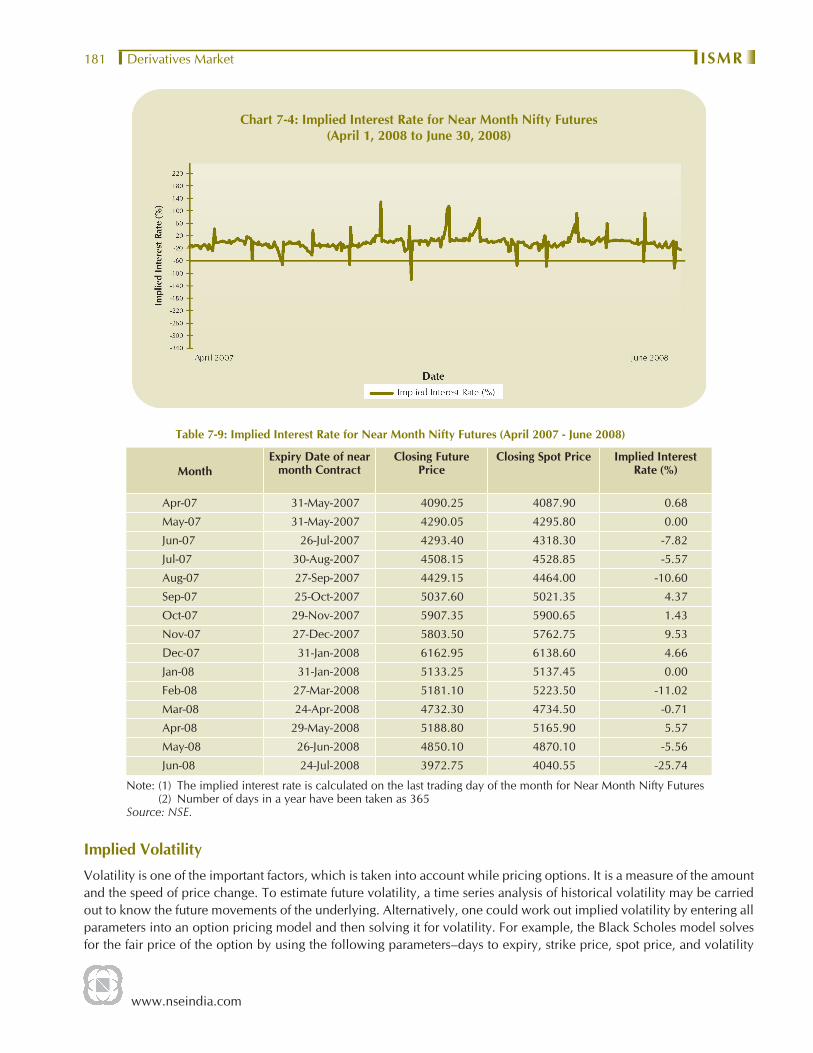
www.nseindia.com
Derivatives Market ISMR181
Chart 7-4: Implied Interest Rate for Near Month Nifty Futures (April 1, 2008 to June 30, 2008)
Table 7-9: Implied Interest Rate for Near Month Nifty Futures (April 2007 - June 2008)
MonthExpiry Date of near
month ContractClosing Future
PriceClosing Spot Price Implied Interest
Rate (%)
Apr-07 31-May-2007 4090.25 4087.90 0.68
May-07 31-May-2007 4290.05 4295.80 0.00
Jun-07 26-Jul-2007 4293.40 4318.30 -7.82
Jul-07 30-Aug-2007 4508.15 4528.85 -5.57
Aug-07 27-Sep-2007 4429.15 4464.00 -10.60
Sep-07 25-Oct-2007 5037.60 5021.35 4.37
Oct-07 29-Nov-2007 5907.35 5900.65 1.43
Nov-07 27-Dec-2007 5803.50 5762.75 9.53
Dec-07 31-Jan-2008 6162.95 6138.60 4.66
Jan-08 31-Jan-2008 5133.25 5137.45 0.00
Feb-08 27-Mar-2008 5181.10 5223.50 -11.02
Mar-08 24-Apr-2008 4732.30 4734.50 -0.71
Apr-08 29-May-2008 5188.80 5165.90 5.57
May-08 26-Jun-2008 4850.10 4870.10 -5.56
Jun-08 24-Jul-2008 3972.75 4040.55 -25.74
Note: (1) The implied interest rate is calculated on the last trading day of the month for Near Month Nifty Futures (2) Number of days in a year have been taken as 365Source: NSE.
Implied Volatility
Volatility is one of the important factors, which is taken into account while pricing options. It is a measure of the amount and the speed of price change. To estimate future volatility, a time series analysis of historical volatility may be carried out to know the future movements of the underlying. Alternatively, one could work out implied volatility by entering all parameters into an option pricing model and then solving it for volatility. For example, the Black Scholes model solves for the fair price of the option by using the following parameters–days to expiry, strike price, spot price, and volatility

www.nseindia.com
Derivatives MarketISMR 182
of underlying, interest rate, and dividend. This model could be used in reverse to arrive at implied volatility by putting the current price of the option prevailing in the market.
Putting it simply implied volatility is the estimate of how volatile the underlying will be from the present until the currency of option. If volatility is high, then the options premiums are relatively expensive and vice-versa. However, implied volatility estimate can be biased, especially if they are based upon options that are thinly traded samples.
Settlement
All derivative contracts are currently cash settled. During 2007-08, the cash settlement amounted to Rs. 15,65,192.40 million with settlement of futures and of options accounting for Rs. 1,446,547 million and Rs. 67,601.70 million) respectively. The detail of the settlement statistics in the F&O segment is presented in (Table 7-10).
Table 7-10: Settlement Statistics in F&O Segment
Month/Year
(In Rs. mn.) (In US $ mn.)Index/Stock Futures Index/Stock Options Total Total
MTM Settlement Final Settlement Premium Settlement
Exercise Settlement
Apr-06 74,135.00 974.70 2,371.30 1,043.20 78,524.20 1,801.43
May-06 135,940.00 1,350.70 3,260.50 1,241.80 141,793.00 3,252.88
Jun-06 68,541.00 502.90 2,653.60 970.10 72,667.60 1,667.07
Jul-06 28,100.00 560.50 1,973.20 736.00 31,369.70 719.65
Aug-06 15,580.00 388.90 1,927.10 1,147.90 19,043.90 436.89
Sep-06 28,265.00 271.00 1,923.70 727.40 31,187.10 715.46
Oct-06 22,182.00 279.50 2,225.40 641.50 25,328.40 581.06
Nov-06 24,120.00 573.80 2,123.30 1,330.20 28,147.30 645.73
Dec-06 59,688.00 346.20 2,943.00 882.50 63,859.70 1,465.01
Jan-07 36,640.00 990.40 2,765.20 1,213.30 41,608.90 954.55
Feb-07 59,817.00 1,152.80 3,214.10 592.80 64,776.70 1,486.04
Mar-07 60,129.00 584.00 4,563.40 1,361.70 66,638.10 1,528.75
2006-07 613,137.00 7,975.40 31,943.80 11,888.40 664,944.60 15,254.52 Apr-07 41,629.00 419.60 3,855.80 1,883.60 47,788.00 1,195.60
May-07 32,511.00 949.20 2,941.30 2,114.30 38,515.80 963.62
Jun-07 37,945.00 725.90 3,670.70 922.40 43,264.00 1,082.41
Jul-07 49,352.00 716.40 4,981.50 2,476.70 57,526.60 1,439.24
Aug-07 112,990.00 1,076.00 5,998.40 1,438.80 121,503.20 3,039.86
Sep-07 53,000.00 1,034.20 5,696.20 5,836.20 65,566.60 1,640.40
Oct-07 159,240.00 2,226.10 9,184.10 6,698.40 177,348.60 4,437.04
Nov-07 162,480.00 2,823.80 6,151.10 3,271.70 174,726.60 4,371.44
Dec-07 141,250.00 771.70 4,783.80 2,036.00 148,841.50 3,723.83
Jan-08 397,680.00 1,051.10 7,779.50 7,674.30 414,184.90 10,362.39
Feb-08 136,790.00 640.00 6,045.80 1,698.80 145,174.60 3,632.09
Mar-08 121,680.00 687.20 6,513.50 1,871.40 130,752.10 3,271.26
2007-08 1,446,547.00 13,121.20 67,601.70 37,922.60 1,565,192.50 39,159.18 Apr-08 53,915.00 667.10 7,859.60 1,640.20 64,081.90 1,492.01
May-08 56,015.00 2,036.40 6,035.90 1,907.80 65,995.10 1,536.56
Jun-08 91,828.00 1,373.00 11,260.00 3,418.60 107,879.60 2,511.75
April 08-June 08 201,758.00 4,076.50 25,155.50 6,966.60 237,956.60 5,540.32
www.nseindia.com
Derivatives Market ISMR183
Policy Debates3
New products
India has seen a tremendous growth in its derivatives markets. However, there are many products which are yet to be launched in Indian markets. Rupee currency futures is one such product which has recently been launched on the NSE and other exchanges. In the rest of the world, new and innovative derivative products are being traded. These include, weather derivatives, Volume futures/options, Energy derivatives, Credit derivatives etc. Going ahead, our market regulators too needs to strive towards expanding the universe of available hedging instruments in the form of derivatives by encouraging fi nancial innovation.
Institutional participation in derivatives markets
One major question concerns institutional participation in the equity derivatives market. This issue has been highlighted by the High Level Expert Committee on Making Mumbai an International Financial Centre (Percy Mistry Committee) in its Report. The Committee points out that though we can take credit for the success of Nifty derivatives market, this market is still riddled with weaknesses. Liquidity is limited to a maturity of one month and at-the-money options. In the NSE derivatives markets, liquidity for the NSE derivatives market, liquidity for options lags futures liquidity by too wide a margin. Some of these problems can be resolved by having an adequate mass of institutional investors, with suffi cient room for manoeuvre, so that they could perform their proper role.
Internationally, banks and mutual funds are major players on the equity derivatives market. In India, owing to a variety of regulatory and governance problems, this has just not materialized. In 2007-08, FIIs accounted for 40.36% of the open interest in the derivatives markets, with the share of mutual funds being only 6.03% and proprietary trades accounting for 11.33%. A major part of the open interest was held by “others” including retail investors.
SEBI’s rules governing mutual funds have eased most of the legitimate diffi culties of mutual funds in terms of regulatory restrictions. Rules governing FIIs, and insurance companies, have been partly eased. Banks currently continue to face stringent regulatory hurdles. Banks need to be allowed to participate in these markets as players and not just hedgers. As these players start utilizing the equity derivatives market, the market could see an enormous increase in liquidity.
OTC vs. Exchange traded derivatives
OTC (over-the-counter) contracts, such as forwards and swaps, are bilaterally negotiated between two parties. The terms of an OTC contract are fl exible, and are often customized to fi t the specifi c requirements of the user. OTC contracts have substantial credit risk, which is the risk that the counterparty that owes money defaults on the payment. In India, OTC derivatives were, till recently, illegal except for specifi c contracts under FRAs/IRS on domestic currency as allowed by RBI. However, RBI Act has been amended in 2006 to provide that such derivative contracts, as may be specifi ed by the RBI from time to time, shall be valid if atleast one of the partied to the transaction is the RBI, a scheduled bank or such other agency falling under the purview of the RBI under certain Acts. Thus, OTC contracts have been granted a legal status.
An exchange-traded contract, such as a futures contract, has a standardized format that specifi es the underlying asset to be delivered, the size of the contract, and the logistics of delivery. They trade on organized exchanges with prices determined by the interaction of many buyers and sellers. Contract performance is guaranteed by a clearinghouse/corporation. Margin requirements and daily marking-to-market of futures positions substantially reduce the credit risk of exchange-traded contracts, relative to OTC contracts.
3 The views and approaches refl ected in the policy debates are not necessarily of the NSE.

www.nseindia.com
Derivatives MarketISMR 184
The Percy Mistry Committee and more recently, the Committee on Financial Sector Reforms (CFSR) (Raghuram Rajan) have emphasised the importance of exchange-traded derivatives. The latter report says that: “For simple derivatives
– such as currency forwards – the exchange is a superior method for organising the market as compared with the OTC market.”
It further adds that, “while both OTC derivatives and exchange-traded derivatives undoubtedly have a role to play in a sophisticated fi nancial system, there is merit in encouraging the migration of trading in standardised products to the exchange so as to mitigate risk. There is certainly no case for biasing public policy against exchange-traded, and in favour of, OTC.”
The recent events in global fi nance amplify the importance of exchange-traded derivatives. The credit default swap is a perfectly good product - as long as it is transacted on an exchange with a Clearing corporation acting as a counterpary. However, when transacted OTC, this product has induced systemic risk. The fact that some of the features of OTC derivatives are information asymmetry and lack of transparency, the dynamic nature of their gross credit exposures and high concentration of activates in major institutions, these products are inherently risky.
In order to control the associated systemic risks with increased size of derivative transactions, the CFSR has suggested a two-pronged strategy. First, standardised products should be encouraged to migrate to exchanges. Second, clearing corporations such as NSCC and CCIL must be encouraged to offer risk management services for the OTC market. If these two strategies are applied fully, systemic risk will then be limited to the small class of OTC derivatives positions which are not understood by the clearing corporations.
Consolidation of cash and derivative markets technology
The World Federation of Exchanges, in June 2008, concluded a study on best practices in respect of the merging of cash and derivatives market technology within a national jurisdiction. Several Exchanges were targeted who have either merged cash and derivative markets, or who have created a derivative market having established a cash one. The study showed that there is no clear best practice as such, that each case needs to be examined on its own merits. The study does show that there are surprisingly more reasons not to consolidate technology than to do so.
Some of the highlights of the study are presented below:
The arguments in favor of consolidation
Cost savings and rationalization: Signifi cant savings of up to 30 % can be realised in the reduction of trading systems from two to one. Each trading system needs several environments to be supported for testing, training, member testing, performance and development. All of these require hardware and staff to support them.
Members cost savings: Members experience signifi cant savings through not having to pay for two sets of distinct network connections (not including all of the resiliency connections), systems for receiving market data and for trading in general.
Flexibility of market models, cross asset margining: A single system allows many different products to be traded alongside each other, whether derivatives, fi xed income or equities. Cross asset margining can be achieved without integration; however an integrated system will allow real-time risk management. It should be noted that all the Exchanges studied do not do real-time cross asset margining as its benefi ts are considered marginal.
Contingent order functionality: The ability to trade derivatives whilst also trading their underlying stocks reduces risk in hedging situations. This is only truly possible at the Stock Exchange on a consolidated system.
The reasons that Exchanges have given for not consolidating
Operational risk: Increasing complexity brings a higher risk of failure or of poor performance. Derivative systems need market confi guration on a much greater basis than cash markets.

www.nseindia.com
Derivatives Market ISMR185
Lack of congruence between market participants: Some Exchanges have a completely different set of organizations trading cash verses derivatives, thus there are insuffi cient benefi ts to members in consolidating platforms.
Members have different systems for trading cash and derivatives: Many members in the established markets have completely different systems for internal trading of cash and derivatives, and thus do not benefi t from a consolidated platform.
Ability to manage change on different markets: With different systems, changes can be made to one market without requiring all members to test and redevelop their systems. Derivative markets tend to change more, however only 25 % (on average) of the equities markets participants trade derivatives too, thus the cash market participants are inconvenienced by redevelopment and testing which they do not benefi t from.
Performance issues: Keeping the systems separate ensures that problems in one do not affect the other and that in high-volume markets the processing in the central order book is kept to a minimum.
The study concludes that the optimal model is one where both the cash and the derivatives systems are based on the same technology, but different servers performing trading, with different versions of software. Members should be able to communicate with the central markets through the same messaging middleware, so that they only have one connection to the Exchange, minimizing communication costs. The Exchange also benefi ts through only needing one set of development, support, maintenance, running fewer testing environments; meanwhile avoids problems with operational risk and performance.
The Indian model in on the lines of the above conclusion and it is likely that many more exchanges would be moving towards this model.

www.nseindia.com
Foreign Institutional Investors in IndiaISMR 186
Foreign Institutional Investors in India
Evolution of policy framework1
Until the 1980s, India’s development strategy was focused on self-reliance and import-substitution. Current account defi cits were fi nanced largely through debt fl ows and offi cial development assistance. There was a general disinclination towards foreign investment or private commercial fl ows. Since the initiation of the reform process in the early 1990s, however, India’s policy stance has changed substantially, with a focus on harnessing the growing global foreign direct investment (FDI) and portfolio fl ows. The broad approach to reform in the external sector after the Gulf crisis was delineated in the Report of the High Level Committee on Balance of Payments (Chairman: C. Rangarajan). It recommended, inter alia, a compositional shift in capital fl ows away from debt to non-debt creating fl ows; strict regulation of external commercial borrowings, especially short-term debt; discouraging volatile elements of fl ows from non-resident Indians (NRIs); gradual liberalisation of outfl ows; and dis-intermediation of Government in the fl ow of external assistance.
After the launch of the reforms in the early 1990s, there was a gradual shift towards capital account convertibility. From September 14, 1992, with suitable restrictions, FIIs and Overseas Corporate Bodies (OCBs) were permitted to invest in fi nancial instruments.2 The policy framework for permitting FII investment was provided under the Government of India guidelines vide Press Note dated September 14, 1992, which enjoined upon FIIs to obtain an initial registration with SEBI and also RBI’s general permission under FERA. Both SEBI’s registration and RBI’s general permissions under FERA were to hold good for fi ve years and were to be renewed after that period. RBI’s general permission under FERA could enable the registered FII to buy, sell and realise capital gains on investments made through initial corpus remitted to India, to invest on all recognised stock exchanges through a designated bank branch, and to appoint domestic custodians for custody of investments held. The Government guidelines of 1992 also provided for eligibility conditions for registration, such as track record, professional competence, fi nancial soundness and other relevant criteria, including registration with a regulatory organisation in the home country. The guidelines were suitably incorporated under the SEBI (FIIs) Regulations, 1995. These regulations continue to maintain the link with the government guidelines by inserting a clause to indicate that the investment by FIIs should also be subject to Government guidelines. This linkage has allowed the Government to indicate various investment limits including in specifi c sectors.
With coming into force of the Foreign Exchange Management Act, (FEMA), 1999 in 2000, the Foreign Exchange Management (Transfer or issue of Security by a Person Resident Outside India) Regulations, 2000 were issued to provide the foreign exchange control context where foreign exchange related transactions of FIIs were permitted by RBI. A philosophy of preference for institutional funds, and prohibition on portfolio investments by foreign natural persons has been followed, except in the case of Non-resident Indians, where direct participation by individuals takes place. Right
1 Source: Report of Expert Group on Encouraging FII Flows and Checking the Vulnerability of Capital Markets to Speculative fl ows, November, 2005
2 An OCB is a company, partnership fi rm, society and other corporate body owned directly or indirectly to the extent of at least sixty per cent by NRIs and includes overseas trust in which not less than sixty per cent benefi cial interest is held by NRIs directly or indirectly but irrevocably.

www.nseindia.com
Foreign Institutional Investors in India ISMR187
from 1992, FIIs have been allowed to invest in all securities traded on the primary and secondary markets, including shares, debentures and warrants issued by companies which were listed or were to be listed on the Stock Exchanges in India and in schemes fl oated by domestic mutual funds.
Historical evolution of FII Policy is summarized below:
Date Policy changeSeptember 1992 FIIs allowed to invest by the Government Guidelines in all securities in both primary and secondary
markets and schemes fl oated by mutual funds. Single FIIs to invest 5 per cent and all FIIs allowed to invest 24 per cent of a company’s issued capital. Broad based funds to have 50 investors with no one holding more than 5 per cent.The objective was to have reputed foreign investors, such as, pension funds, mutual fund or investment trusts and other broad based institutional investors in the capital market.
November 1996 100 per cent debt FIIs were permitted to give operational fl exibility to FIIs.April 1997 Aggregated limit for all FIIs increased to 30 per cent subject to special procedure and resolution.
The objective was to increase the participation by FIIs.April 1998 FIIs permitted to invest in dated Government securities subject to a ceiling. Consistent with the
Government policy to limit the short-term debt, a ceiling of USD 1 billion was assigned which was increased to USD 1.75 billion in 2004.
June 1998 Aggregate portfolio investment limit of FIIs and NRIs/PIOs/OCBs enhanced from 5 per cent to 10 per cent and the ceilings made mutually exclusive. Common ceilings would have negated the permission to FIIs. Therefore, separate ceilings were prescribed.
June 1998 Forward cover allowed in equity.FIIs permitted to invest in equity derivatives. The objective was to make hedging instruments available.
February 2000 Foreign fi rms and high net-worth individuals permitted to invest as sub-accounts of FIIs. Domestic portfolio manager allowed to be registered as FIIs to manage the funds of sub-accounts. The objective was to allow operational fl exibility and also give access to domestic asset management capability.
March 2001 FII ceiling under special procedure enhanced to 49 per cent. The objective was to increase FII participation
September 2001 FII ceiling under special procedure raised to sectoral cap.December 2003 FII dual approval process of SEBI and RBI changed to single approval process of SEBI. The objective
was to streamline the registration process and reduce the time taken for registration.November 2004 Outstanding corporate debt limit of USD 0.5 billion prescribed. The objective was to limit short-
term debt fl ows.April 2006 Outstanding corporate debt limit increased to USD 1.5 billion prescribed.
The limit on investment in Government securities was enhanced to USD 2 bn. This was an announcement in the Budget of 2006-07
November, 2006 FII investment upto 23% permitted in infrastructure companies in the securities markets, viz. stock exchanges, depositories and clearing corporations.This is a decision taken by Government following the mandating of demutualization and corporatization of stock exchanges.
January and October, 2007
FIIs allowed to invest USD 3.2 billion in Government Securities (limits were raised from USD 2 billion in two phases of USD 0.6 billion each in January and October)
June, 2008 While reviewing the External Commercial Borrowing policy, the Government increased the cumulative debt investment limits from US $3.2 billion to US $5 billion and US $1.5 billion to US $3 billion for FII investments in Government Securities and Corporate Debt, respectively.

www.nseindia.com
Foreign Institutional Investors in IndiaISMR 188
As is evident from the above, the evolution of FII policy in India has displayed a steady and cautious approach to liberalisation of a system of quantitative restrictions (QRs). The policy liberalisation has taken the form of (i) relaxation of investment limits for FIIs; (ii) relaxation of eligibility conditions; and (iii) liberalisation of investment instruments accessible for FIIs.
Policy Developments
I. Permission for Short selling of Equity Shares by SEBI registered FIIs
SEBI registered FIIs / subaccounts of FIIs were permitted to buy / sell equity shares / debentures of Indian companies. However, they were not allowed to engage in short selling and were required to take delivery of securities purchased and give delivery of securities sold.
After a due consultation process, it was decided to permit FIIs registered with SEBI and sub-accounts of FIIs to short sell, lend and borrow equity shares of Indian companies, subject to such conditions as may be prescribed in that behalf by the Reserve Bank and the SEBI / other regulatory agencies from time to time.
Accordingly, RBI, through a circular dated 31st December, 2007, permitted the above subject to the following conditions:
(i) The FII participation in short selling as well as borrowing / lending of equity shares will be subject to the current FDI policy and short selling of equity shares by FIIs would not be permitted for equity shares which are in the ban list and / or caution list of Reserve Bank.
(ii) Borrowing of equity shares by FIIs would only be for the purpose of delivery into short sale.
(iii) The margin / collateral would be maintained by FIIs only in the form of cash. No interest would be paid to the FII on such margin/collateral.
RBI further provided that the designated custodian banks should separately report all transactions pertaining to short selling of equity shares and lending and borrowing of equity shares by FIIs in their daily reporting with a suitable remark (short sold / lent / borrowed equity shares) for the purpose of monitoring by the Reserve Bank.
SEBI also issued an amendment to the FII Regulations permitting FIIs to short sell and lend and borrow securities.
II. FII investments in Debt Securities
SEBI vide its circular dated January 19, 2007 announced the increase in the cumulative debt investment limit available for investment by FIIs/ Sub Accounts in Government Securities/ T-Bills from US $2 billion to US $2.6 billion. This limits was further enhanced to US $3.2 billion vide SEBI circular dated January 31, 2008.
It was noticed that there was no uniformity among custodians with respect to considering investments by FIIs in debt oriented mutual fund units either as debt or equity. In consultation wit RBI, SEBI decided that investments by FIIs/ Sub Accounts in debt oriented mutual fund units (including units of money market and liquid funds) should henceforth be considered as corporate debt investments and reckoned within the stipulated limit of US $1.5 billion, earmarked for FII/ Sub Account investments in corporate debt.
In view of the above, the following was made applicable with immediate effect:
1. Henceforth, there would be no demarcation between 100% debt and normal 70:30 FIIs/ Sub Accounts for the purposes of allocation of debt investment limits. The individual limits allocated to the 100% debt FIIs/ Sub Accounts stand cancelled.
2. The allocation of unutilized/ unallocated limits for investments in Government Securities/ T-Bills would be on fi rst-come-fi rst-serve basis. The allocation would be valid for a period of 15 days from the date of the allocation letter, on the expiry of which the unutilized limits would lapse.

www.nseindia.com
Foreign Institutional Investors in India ISMR189
3. As mentioned above, the investments by FIIs/ Sub Accounts in debt oriented mutual fund schemes should now be reckoned as investments in corporate debt. On re-calculating the investment fi gures for investments by FIIs/ Sub Accounts in corporate debt, by including their investments in units of debt oriented mutual funds, it is seen that the corporate debt investments exceed the permissible limit of US $1.5 billion. Thus, in order to conform to the stated limit, there should be no further investment, or rollover, of existing position in corporate debt, by both 100% debt and normal 70:30 FIIs, till the holdings fall within the stipulated limit of US $1.5 billion.
III. Foreign investment in Commodity Exchanges
Government of India decided to allow foreign investment in Commodity Exchanges subject to the following conditions:
i) There would be a composite ceiling of 49% Foreign Investment, with a FDI limit of 26% and an FII limit of 23%.
ii) FDI will be allowed with specifi c approval of the Government.
iii) The FII purchases in equity of Commodity Exchanges will be restricted only to the secondary markets.
iv) Foreign Investment in Commodity Exchanges would also be subject to compliance with the regulations issued, in this regard, by the Forward Market Commission.
Accordingly, a necessary circular was issued by RBI on 28th April, 2008.
IV. Foreign investment in Credit Information Companies
The Government decided to allow foreign investment in Credit Information Companies in compliance with the Credit Information Companies (Regulations) Act 2005 and subject to the following:
i) The aggregate Foreign Investment in Credit Information Companies would be 49%.
ii) Foreign Investment upto 49% would be allowed only with the prior approval of FIPB and regulatory clearance from RBI.
iii) Investment by SEBI Registered FIIs would be permitted only through purchases in the secondary market to an extent of 24%.
iv) Investment by SEBI Registered FIIs would be within the overall limit of 49% for Foreign Investment.
Accordingly, a necessary circular was issued by RBI on 28th April, 2008.
V. FII investments in Debt Securities
The Government reviewed the External Commercial Borrowing policy and increased the cumulative debt investment limits from US $3.2 billion to US $5 billion and US $1.5 billion to US $3 billion for FII investments in Government Securities and Corporate Debt, respectively. Accordingly, SEBI issued a necessary circular giving effect to this decision on June 6, 2008.
It was further provided that the enhanced limits should be allocated among the FIIs on a ‘fi rst come fi rst served’ basis in terms of SEBI’s earlier circular dated January 31, 2008, subject to a ceiling of US $200 million per registered entity.
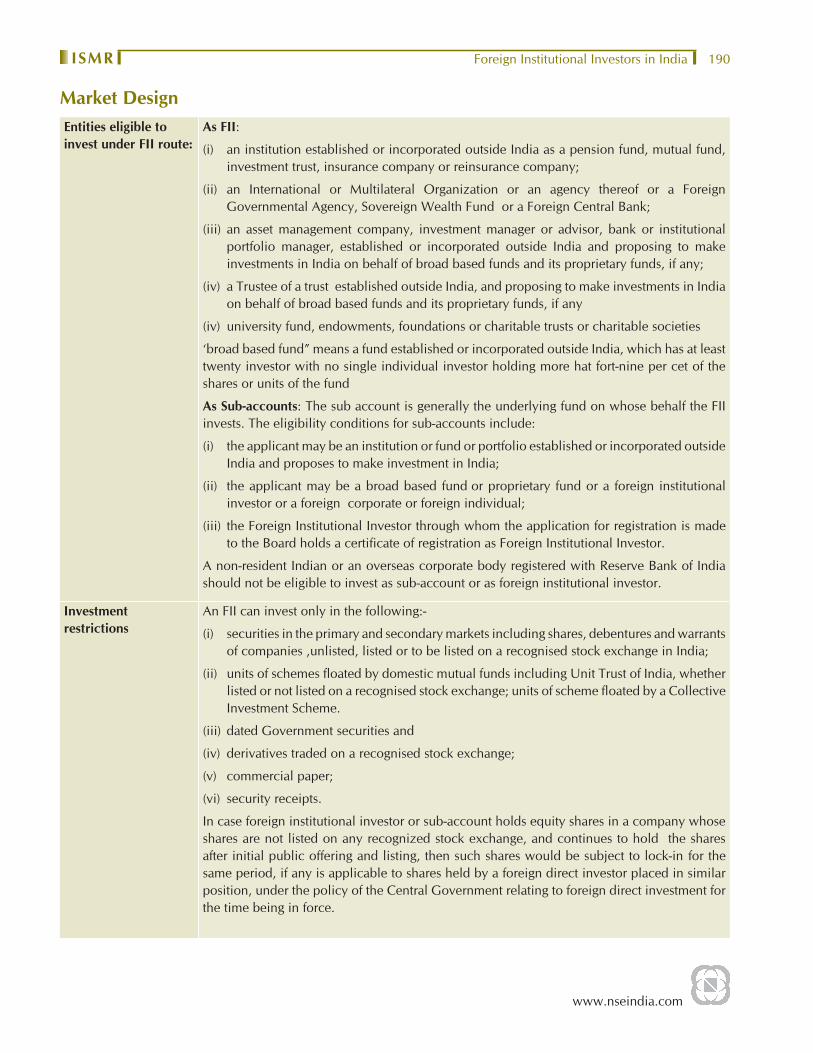
www.nseindia.com
Foreign Institutional Investors in IndiaISMR 190
Market DesignEntities eligible to invest under FII route:
As FII:
(i) an institution established or incorporated outside India as a pension fund, mutual fund, investment trust, insurance company or reinsurance company;
(ii) an International or Multilateral Organization or an agency thereof or a Foreign Governmental Agency, Sovereign Wealth Fund or a Foreign Central Bank;
(iii) an asset management company, investment manager or advisor, bank or institutional portfolio manager, established or incorporated outside India and proposing to make investments in India on behalf of broad based funds and its proprietary funds, if any;
(iv) a Trustee of a trust established outside India, and proposing to make investments in India on behalf of broad based funds and its proprietary funds, if any
(iv) university fund, endowments, foundations or charitable trusts or charitable societies
‘broad based fund” means a fund established or incorporated outside India, which has at least twenty investor with no single individual investor holding more hat fort-nine per cet of the shares or units of the fund
As Sub-accounts: The sub account is generally the underlying fund on whose behalf the FII invests. The eligibility conditions for sub-accounts include:
(i) the applicant may be an institution or fund or portfolio established or incorporated outside India and proposes to make investment in India;
(ii) the applicant may be a broad based fund or proprietary fund or a foreign institutional investor or a foreign corporate or foreign individual;
(iii) the Foreign Institutional Investor through whom the application for registration is made to the Board holds a certifi cate of registration as Foreign Institutional Investor.
A non-resident Indian or an overseas corporate body registered with Reserve Bank of India should not be eligible to invest as sub-account or as foreign institutional investor.
Investment restrictions
An FII can invest only in the following:-
(i) securities in the primary and secondary markets including shares, debentures and warrants of companies ,unlisted, listed or to be listed on a recognised stock exchange in India;
(ii) units of schemes fl oated by domestic mutual funds including Unit Trust of India, whether listed or not listed on a recognised stock exchange; units of scheme fl oated by a Collective Investment Scheme.
(iii) dated Government securities and
(iv) derivatives traded on a recognised stock exchange;
(v) commercial paper;
(vi) security receipts.
In case foreign institutional investor or sub-account holds equity shares in a company whose shares are not listed on any recognized stock exchange, and continues to hold the shares after initial public offering and listing, then such shares would be subject to lock-in for the same period, if any is applicable to shares held by a foreign direct investor placed in similar position, under the policy of the Central Government relating to foreign direct investment for the time being in force.

www.nseindia.com
Foreign Institutional Investors in India ISMR191
The total investments in equity and equity related instruments (including fully convertible debentures, convertible portion of partially convertible debentures and tradable warrants) made by a FII in India, whether on his own account or on account of his sub- accounts, should not be less than seventy per cent of the aggregate of all the investments of the Foreign Institutional Investor in India, made on his own account and on account of his sub-accounts. However, this is not applicable to any investment of the foreign institutional investor either on its own account or on behalf of its sub-accounts in debt securities which are unlisted or listed or to be listed on any stock exchange if the prior approval of the SEBI has been obtained for such investments. Further, SEBI while granting approval for the investments may impose conditions as are necessary with respect to the maximum amount which can be invested in the debt securities by the foreign institutional investor on its own account or through its sub-accounts. A foreign corporate or individual is not eligible to invest through the hundred percent debt route.Investments made by FIIs in security receipts issued by securitization companies or asset reconstruction companies under the Securitiation and Reconstruction of Financial Assets and Enforcement of Security Interest Act, 2002 are not eligible for the investment limits mentioned above. No foreign institutional can invest in security receipts on behalf of its sub-account.FII Investment in secondary markets:SEBI regulations provide that a foreign institutional investor or sub-account can transact in the Indian securities market only on the basis of taking and giving delivery of securities purchased or sold. However, this does not apply to any transactions in derivatives on a recognised stock exchange.Further, SEBI has, in December, 2007 permitted FIIs and sub-accounts to enter into short selling transactions only in accordance with the framework specifi ed by SEBI in this regard.No transaction on the stock exchange would be carried forward and the transaction in securities would be only through stock broker who has been granted a certifi cate by SEBI.They has also been allowed to lend or borrow securities in accordance with the framework specifi ed by SEBI in this regard.A Foreign institutional investor can issue, or otherwise deal in offshore derivative instruments, directly of indirectly wherein the offshore derivative instruments are issued only to persons who are regulated by an appropriate foreign regulatory authority and the ODIs are issued after compliance with ‘know your client’ norms.
General Obligations And Responsibilities
Certain general obligations and responsibilities relating to appointment of domestic custodians, designated bank, investment advice in publicly accessible media etc. have been laid down on the FIIs operating in the country in the SEBI, FII Regulations 1995.
Allocation of Funds The SEBI registered FII should restrict allocation of its investment between equities and debt in the Indian Capital Market in the ratio 70:30. The FII may form a 100 % debt fund and get such fund registered with SEBI. Investment in debt securities by FIIs are subject to limits if any stipulated by SEBI in this regard.
Private Placement with FIIs
SEBI registered FIIs have been permitted to purchase shares/convertible debentures of an Indian company through offer/private placement subject to the ceiling of 10% of the paid up capital of the Indian company for individual FII/sub account and 24% for all FIIs/sub accounts put together. Indian company is permitted to issue such shares provided that:(i) in the case of public offer, the price of shares to be issued is not less than the price at
which shares are issued to residents and(ii) in the case of issue by private placement, the price is not less than the price arrived at in
terms of SEBI guidelines issued by the erstwhile Controller of Capital issues as applicable. Purchases can also be made of Partially Convertible debentures, Fully Convertible debentures, Rights/Renunciations/Warrants/Units of Domestic Mutual Fund Schemes.

www.nseindia.com
Foreign Institutional Investors in IndiaISMR 192
Risk Management
Forward Cover & Cancellation and Rebooking
Authorized Dealer Banks can offer forward cover to FIIs to the extent of total inward remittance of liquidated investment. Rebooking of cancelled forward contracts is allowed up to a limit of 2 % of the market value of the entire investment of FIIs in equity and/or debt in India. The limit for calculating the eligibility for rebooking will be based upon market value of the portfolio as at the beginning of the fi nancial year (April-March). The outstanding contracts have to be duly supported by underlying exposure at all times. The AD Category –I bank has to ensure that (i) that total forward contracts outstanding doesn’t exceed the market value of portfolio and (ii) forward contracts permitted to be rebooked doesn’t exceed 2 % of the market value as determined at the beginning of the fi nancial year. The monitoring of forward cover is to be done on a fortnightly basis.
FII Position Limits In Derivatives Contracts
SEBI registered FIIs are allowed to trade in all exchange traded derivative contracts on the stock exchanges in India subject to the position limits as prescribed by SEBI from time to time. These have been listed out in Chapter 7.
Monitoring of Position Limits for FII
Clearing Corporation monitors the open positions of the FII/ sub-account of the FII for each underlying security and index, against the position limits specifi ed at the level of FII/ sub-accounts of FII respectively, at the end of each trading day.
Monitoring of investment position by RBI
The Reserve Bank of India (RBI) monitors the investment position of FIIs in listed Indian Companies, reported by Custodian Banks on a daily basis in Form LEC(FII).
Caution List
When the total holdings of FIIs/NRIs under the Scheme reach the trigger limit, which is 2 % below the applicable limit. Reserve Bank issues a notice to all the designated branches of an Authorised Dealer banks stating that any further purchases of shares of the particular Indian company will require prior approval of Reserve Bank. (For companies with paid-up capital of Rs.1,000 crore and above, the trigger limit is 0.5 % below the applicable limit). RBI gives case-by case approvals to FIIs for purchase of shares of companies included in the Caution List. This is done on fi rst-come-fi rst served basis.
Ban List
Once the shareholding by FIIs/NRIs reaches the overall ceiling/sectoral cap/statutory limit, Reserve Bank puts the company on the Ban List. Once a company is placed on the Ban List, no FII or NRI can purchase the shares of the company under the Portfolio Investment Scheme.
Margin Requirements SEBI registered FIIs/sub-accounts are allowed to keep with the trading member/clearing member amount suffi cient to cover the margins prescribed by the exchange/Clearing House and such amounts as may be considered to meet the immediate needs.
Investment by FIIs under Portfolio Investment Scheme
RBI has given general permission to SEBI registered FIIs/sub-accounts to invest under the Portfolio Investment Scheme (PIS).
• Total holding of each FII/sub account under this scheme should not exceed 10% of the total paid up capital or 10 % of the paid up value of each series of convertible debentures issued by the Indian company.
• Total holding of all the FIIs/sub-accounts put together should not exceed 24 % of the paid up capital or paid up value of each series of convertible debentures. This limit of 24 % can be increased to the sectoral cap / statutory limit as applicable to the Indian Company concerned, by passing a resolution of its Board of Directors followed by a special resolution to that effect by its General Body.
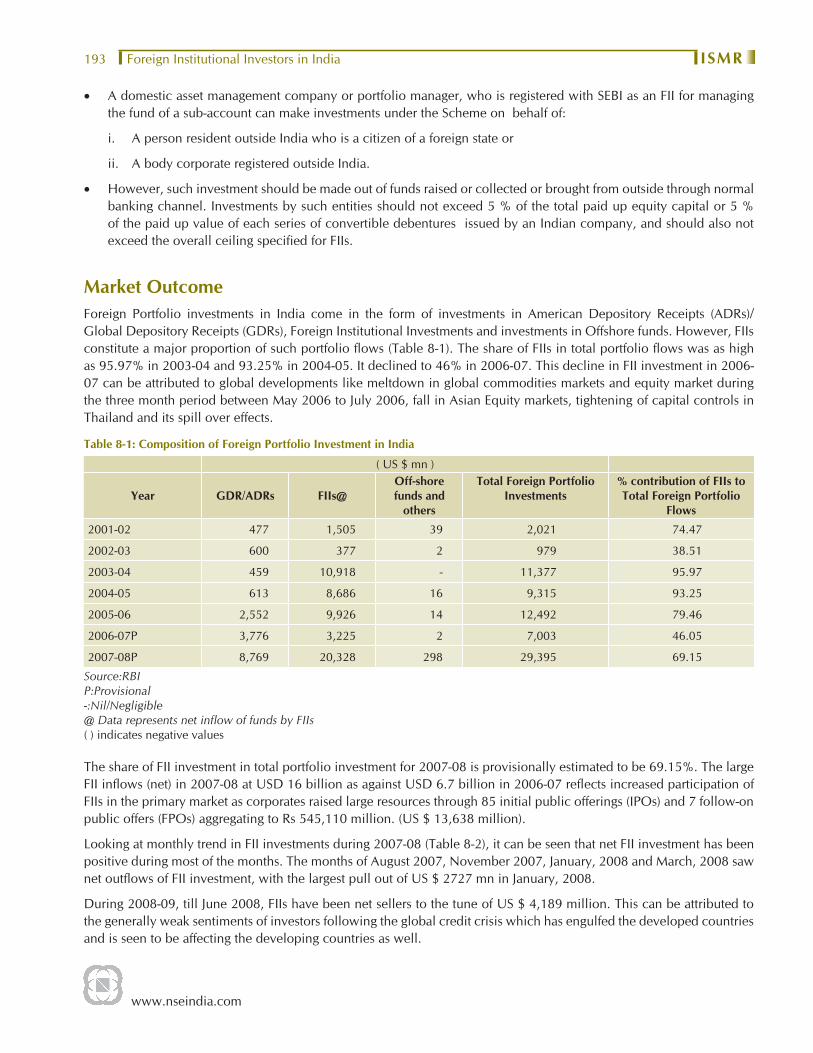
www.nseindia.com
Foreign Institutional Investors in India ISMR193
• A domestic asset management company or portfolio manager, who is registered with SEBI as an FII for managing the fund of a sub-account can make investments under the Scheme on behalf of:
i. A person resident outside India who is a citizen of a foreign state or
ii. A body corporate registered outside India.
• However, such investment should be made out of funds raised or collected or brought from outside through normal banking channel. Investments by such entities should not exceed 5 % of the total paid up equity capital or 5 % of the paid up value of each series of convertible debentures issued by an Indian company, and should also not exceed the overall ceiling specifi ed for FIIs.
Market Outcome Foreign Portfolio investments in India come in the form of investments in American Depository Receipts (ADRs)/Global Depository Receipts (GDRs), Foreign Institutional Investments and investments in Offshore funds. However, FIIs constitute a major proportion of such portfolio fl ows (Table 8-1). The share of FIIs in total portfolio fl ows was as high as 95.97% in 2003-04 and 93.25% in 2004-05. It declined to 46% in 2006-07. This decline in FII investment in 2006-07 can be attributed to global developments like meltdown in global commodities markets and equity market during the three month period between May 2006 to July 2006, fall in Asian Equity markets, tightening of capital controls in Thailand and its spill over effects.
Table 8-1: Composition of Foreign Portfolio Investment in India
( US $ mn )
Year GDR/ADRs FIIs@Off-shore funds and
others
Total Foreign Portfolio Investments
% contribution of FIIs to Total Foreign Portfolio
Flows
2001-02 477 1,505 39 2,021 74.47
2002-03 600 377 2 979 38.51
2003-04 459 10,918 - 11,377 95.97
2004-05 613 8,686 16 9,315 93.25
2005-06 2,552 9,926 14 12,492 79.46
2006-07P 3,776 3,225 2 7,003 46.05
2007-08P 8,769 20,328 298 29,395 69.15
Source:RBIP:Provisional-:Nil/Negligible@ Data represents net infl ow of funds by FIIs( ) indicates negative values
The share of FII investment in total portfolio investment for 2007-08 is provisionally estimated to be 69.15%. The large FII infl ows (net) in 2007-08 at USD 16 billion as against USD 6.7 billion in 2006-07 refl ects increased participation of FIIs in the primary market as corporates raised large resources through 85 initial public offerings (IPOs) and 7 follow-on public offers (FPOs) aggregating to Rs 545,110 million. (US $ 13,638 million).
Looking at monthly trend in FII investments during 2007-08 (Table 8-2), it can be seen that net FII investment has been positive during most of the months. The months of August 2007, November 2007, January, 2008 and March, 2008 saw net outfl ows of FII investment, with the largest pull out of US $ 2727 mn in January, 2008.
During 2008-09, till June 2008, FIIs have been net sellers to the tune of US $ 4,189 million. This can be attributed to the generally weak sentiments of investors following the global credit crisis which has engulfed the developed countries and is seen to be affecting the developing countries as well.

www.nseindia.com
Foreign Institutional Investors in IndiaISMR 194
Table 8-2: Trends in FII Investment
PeriodPurchases (Rs. mn.)
Sales (Rs. mn.)
Net Investment (Rs. mn.)
Net Investment (US $ mn.)
Cumulative Net Investment (US $ mn.)
2001-02 499,199 411,650 87,552 1,846 15,242
2002-03 470,601 443,710 26,889 562 15,804
2003-04 1,448,575 990,940 457,645 9,949 25,754
2004-05 2,169,530 1,710,730 458,800 10,173 35,927
2005-06 3,449,780 3,055,120 394,660 9,334 477,063
2006-07 5,205,090 4,896,680 308,410 6,709 51,967
Apr-06 452,340 444,640 7,700 174 45,433
May-06 487,380 553,850 (66,470) (1,473) 43,960
Jun-06 404,080 395,320 8,760 193 44,153
Jul-06 269,670 256,700 12,970 285 44,438
Aug-06 283,950 229,480 54,470 1,173 45,611
Sep-06 340,570 279,230 61,340 1,318 46,929
Oct-06 395,740 309,040 86,700 1,879 48,808
Nov-06 548,590 446,730 101,860 2,213 51,021
Dec-06 442,070 469,730 (27,660) (599) 50,422
Jan-07 457,700 474,520 (16,820) (370) 50,052
Feb-07 582,570 500,620 81,950 1,834 51,886
Mar-07 540,430 536,820 3,610 82 51,967
2007-08 9,480,196 8,818,422 661,774 16,040 68,006
Apr-07 506,333 429,118 77,215 1,752 53,718
May-07 521,276 468,080 53,196 1,265 54,982
Jun-07 502,029 491,016 11,013 269 55,252
Jul-07 873,316 647,223 226,093 5,545 60,797
Aug-07 618,209 689,832 (71,623) (1772) 59,025
Sep-07 711,648 523,770 187,878 4,609 63,634
Oct-07 1,354,118 1,123,217 230,901 5,684 69,392
Nov-07 885,105 948,295 (63,190) (1,567) 67,750
Dec-07 910,238 821,327 88,911 2,204 69,954
Jan-08 1,093,346 1,204,166 (110,820) (2,747) 67,207
Feb-08 792,984 750,682 42,302 1,049 68,256
Mar-08 711,594 721,696 (10,102) (250) 68,006
2008-09 1,844,490 2,013,450 (168,960) (4,189) 63,819
Apr-08 623,290 629,560 (6,270) (155.00) 67,852
May-08 589,660 641,410 (51,740) (1,283) 66,569
Jun-08 631,540 742,480 (110,950) (2,751) 63,819
April 2008 - June 2008 1,844,490 2,013,450 (168,960) (4,189) 63,819
Source: SEBI.( ) indicates negative values

www.nseindia.com
Foreign Institutional Investors in India ISMR195
Number of Foreign Institutional Investors (FIIs)
As of March 2008, there were 1,319 FIIs registered with SEBI, as against 997 in March 2007.
SEBI Registered FIIs in India
Year1992-
931993-
941994-
951995-
961996-
971997-
981998-
991999-
002000-
012001-
022002-
032003-
042004-
052005-
062006-
072007-
08
End of March
0 3 156 353 439 496 450 506 527 490 502 540 685 882 997 1,319
Source: SEBI
Foreign Institutional Investments- Equity and Debt
FIIs were allowed to invest in the Indian Capital Market securities from September 1992, however investment by them were fi rst made in January 1993. Till December 1998, investments were related to equity only as the Indian gilts market was opened up for FII investment in April 1998. Investments in debt were made from January 1999. Foreign Institutional Investors (FIIs) continued to invest large funds in the Indian securities market. For two consecutive years in 2004-05 and 2005-06, net investment in equity showed year-on-year increase of 10%.
Highest net investment in equity by FIIs was seen in 2007-08 of Rs. 534,038 million (US $ 13,361 million) an increase of 112% over the 2006-07 net investment fi gure of Rs 252,370 million (US $ 5,790 million) During the fi rst quarter of the fi scal 2008-09, FIIs have been net sellers in the equity market. They have sold equity worth Rs. 140,325 million (US $ 3,267 million) (Table 8-3)
Table 8-3: Net Investments by Foreign Institutional Investors in Equity and Debt ( Rs. million)
Year
FIIs
Net Investment in Equity
Net Investment in Debt
2001-02 80,670 6,850
2002-03 25,280 600
2003-04 399,590 58,050
2004-05 441,230 17,590
2005-06 488,010 (73,340)
2006-07 252,370 56,070
Apr-06 5,220 2,490
May-06 (73,540) 7,070
Jun-06 4,800 3,960
Jul-06 11,450 1,520
Aug-06 46,430 8,050
Sep-06 54,250 7,090
Contd.
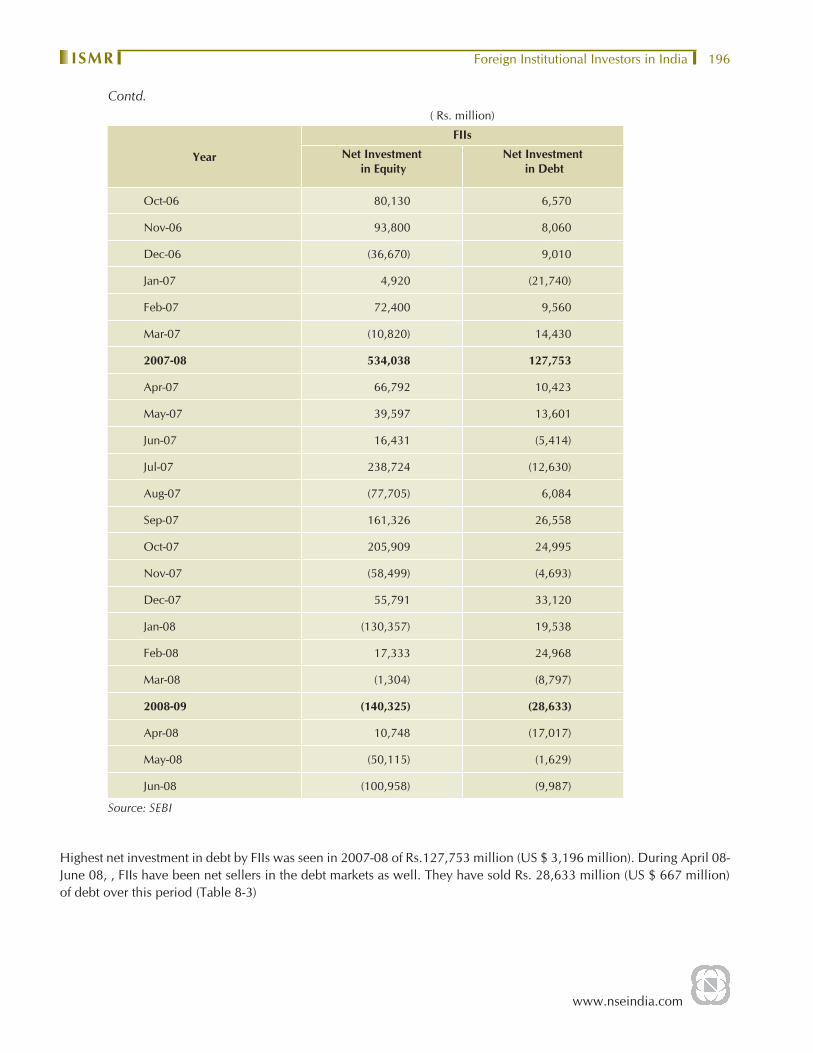
www.nseindia.com
Foreign Institutional Investors in IndiaISMR 196
( Rs. million)
Year
FIIs
Net Investment in Equity
Net Investment in Debt
Oct-06 80,130 6,570
Nov-06 93,800 8,060
Dec-06 (36,670) 9,010
Jan-07 4,920 (21,740)
Feb-07 72,400 9,560
Mar-07 (10,820) 14,430
2007-08 534,038 127,753
Apr-07 66,792 10,423
May-07 39,597 13,601
Jun-07 16,431 (5,414)
Jul-07 238,724 (12,630)
Aug-07 (77,705) 6,084
Sep-07 161,326 26,558
Oct-07 205,909 24,995
Nov-07 (58,499) (4,693)
Dec-07 55,791 33,120
Jan-08 (130,357) 19,538
Feb-08 17,333 24,968
Mar-08 (1,304) (8,797)
2008-09 (140,325) (28,633)
Apr-08 10,748 (17,017)
May-08 (50,115) (1,629)
Jun-08 (100,958) (9,987)
Source: SEBI
Highest net investment in debt by FIIs was seen in 2007-08 of Rs.127,753 million (US $ 3,196 million). During April 08- June 08, , FIIs have been net sellers in the debt markets as well. They have sold Rs. 28,633 million (US $ 667 million) of debt over this period (Table 8-3)
Contd.

www.nseindia.com
Foreign Institutional Investors in India ISMR197
Share of FIIs in NSE Listed Companies
The FII ownership of shares in various sectors of NSE listed companies is presented in (Table 8-4). At the end of March 2008 FIIs held the highest stake of 19.15 % in the Banking sector followed by Finance and Information Technology of 17.44 % and 16.00 % respectively. The total percentage of shares held by FIIs across different sectors was 10.62 % of the total shares of the companies listed on NSE as at end March 2008 and 9.94 % at the end of June 2008.
Table 8-4: FII Share in different sectors of companies listed on NSE
SectorsEnd of March 2007 End of March 2008 End of June 2008
Percentage Share of Foreign institutional Investors
Banks 18.41 19.15 17.10
Engineering 11.45 10.63 9.24
Finance 18.18 17.44 15.83
FMCG 11.91 14.07 13.46
Information Technology 14.53 16.00 16.30
Infrastructure 7.15 8.86 8.16
Manufacturing 9.57 9.46 8.51
Media & Entertainment 15.20 11.71 11.08
Petrochemicals 5.83 4.73 5.38
Pharmaceuticals 11.17 10.69 10.30
Services 13.09 10.70 10.89
Telecommunication 11.17 9.12 9.18
Miscellaneous 8.19 9.30 9.94
Total stake of FIIs in all the Sectors 10.78 10.62 9.94
Source : NSE
The most commonly used indicator of stock market development is the size of the market, measured by Market Capitalisation ratio. Market Capitalisation ratio is the value of listed shares on the country’s exchanges divided by GDP of the country. In the year 2007-08, market capitalisation ratio of the FIIs (Market capitalisation of FII holdings / GDP) on NSE was 15.08 %. The share of FIIs market capitalisation to the total market capitalization of NSE at end March 2008 was 14.66 %.
2006-07 2007-08
Market Capitalisation Ratio 13.14% 15.08%
Market Capitalisation of FII holdings (Rs. Million) 5,421,606 7,121,181
GDP (Rs. Million) 41,257,250 47,234,000
Market Capitalisation of FIIs holding to Total Market Capitalisation of NSE 16.10% 14.66%
Market Capitalisation- FII holding (Rs.million) 5,421,606 7,121,181
Market Capitalisation- Total of NSE (in Rs. Million) 33,673,500 48,581,217
Source : NSE, Central Statistical Organisation

www.nseindia.com
Knowledge InitiativesISMR 198
Knowledge Initiatives
Several initiatives have been taken over the last few years with a view to develop the skills of market intermediaries, educate the investors and promote high quality research in the securities market. In order to further improve the skills and widen the knowledge base of people involved in the securities market, SEBI has set up the National Institute of Securities Markets (NISM). NISM would design and implement the entire gamut of educational initiatives, including education, training, certifi cation, research and consultancy in the area of securities market and allied subjects for securities market professionals in India and neighboring countries.
Quality IntermediationIn some of the developed and developing markets, there is a system of testing and certifi cation for persons joining market intermediaries. This ensures that these personnel have a minimum required knowledge about the market and the existing regulations. The benefi ts of this system are wide spread. While the intermediaries are assured of qualifi ed staff, the employees get an opportunity to improve their career prospects. This in turn instills confi dence in the investors to be associated with the securities market.
The formal educational or training programme on securities markets is not adequate to cover their areas of operations. For instance, no academic course teaches how to maintain depository accounts or to sell mutual fund products, issue contract notes or clear and settle trades on a stock exchange. As a result, a need for certifi cation was being increasingly felt by the regulators as well as by the securities industry.
NSE’s Certifi cation in Financial Markets [NCFM]
National Stock Exchange’s Certifi cation in Financial Markets (NCFM), a testing and certifi cation mechanism, has become extremely popular and is sought after by the candidates as well as employers due to its unique on-line testing and certifi cation programme. It offers all the certifi cations mandated by SEBI, NSDL, AMFI, FIMMDA and NSE itself. The entire process from generation of question paper, testing, assessing, scores reporting and certifying is fully automated-there is absolutely no human intervention. It allows tremendous fl exibility in terms of testing centres, dates and timing by providing easy accessibility and convenience to candidates as they can be tested at any time and from any location. The purpose is to test the practical knowledge and skills that are required to operate in the fi nancial markets, in a very secure and unbiased manner.
NCFM offers a comprehensive range of modules covering many different areas in fi nance. NCFM currently tests expertise in the modules mentioned below in Table 9-1.
During the year 2008-09, NCFM introduced the Derivative Market (Dealers) Module Test in Gujarati language and Hindi Language and launched various new modules. The ‘FEDAI-NSE Currency Futures (Basic) Module’ was launched in September 2008 to equip the dealers, investors, students, participants etc. with knowledge on the Currency Futures markets and products. On January 7, 2009 the module on ‘Mutual Funds: A Beginners Module’ was launched with a view to educate and create awareness about the role and function of mutual funds. On February 2, 2009 NCFM certifi cation on the module on ‘Option Trading Strategies’ was introduced.

www.nseindia.com
Knowledge Initiatives ISMR199
Table 9-1: NCFM Module Test Details
Sr. No. Name of Module Fees (Rs.)
Test Duration
(in minutes)
No. of Questions
Maximum Marks
Pass Marks
(%)
Certifi cate Validity
(in years)
1 Financial Markets: A Beginners’ Module 750 60 50 100 50 5
2 Mutual Funds : A Beginners’ Module 750 60 50 100 50 5
3 Securities Market (Basic) Module 1500 105 60 100 60 5
4 Capital Market (Dealers) Module 1500 105 60 100 50 5
5 Derivatives Market (Dealers) Module 1500 120 60 100 60 3
6 FIMMDA-NSE Debt Market (Basic) Module 1500 120 60 100 60 5
7 NSDL–Depository Operations Module 1500 75 60 100 60 # 5
8 Commodities Market Module 1800 120 60 100 50 3
9 AMFI-Mutual Fund (Basic) Module 1000 90 62 100 50 No limit
10 AMFI-Mutual Fund (Advisors) Module 1000 120 72 100 50 5
11 Surveillance in Stock Exchanges Module 1500 120 50 100 60 5
12 Corporate Governance Module 1500 90 100 100 60 5
13 Compliance Offi cers (Brokers) Module 1500 120 60 100 60 5
14 Compliance Offi cers (Corporates) Module 1500 120 60 100 60 5
15Information Security Auditors Module (Part-1) 2250 120 90 100 60
2Information Security Auditors Module (Part-2) 2250 120 90 100 60
16 FPSB India Exam 1 to 4* 1500 per exam
120 75 140 60 NA
17 FEDAI-NSE Currency Futures (Basic) Module 1500 120 60 100 60 3
18 Options Trading Strategies Module 1500 120 60 100 60 5
# Candidates securing 80% or more marks in NSDL-Depository Operations Module ONLY will be certifi ed as ‘Trainers’.
* Modules of Financial Planning Standards Board India (Certifi ed Financial Planner Certifi cation) i.e. (i) Risk Analysis & Insurance Planning (ii) Retirement Planning & Employee Benefi ts (iii) Investment Planning and (iv) Tax Planning & Estate Planning. The fees for FPSB Modules 1-4 would be revised to Rs. 2000/- per exam from test date April 1, 2009 onwards.
The curriculum for each of the module (except FPSB India Exam 1 to 4) is available on our website: www.nseindia.com > NCFM > Curriculum & Study Material.
Through a system of certifi cation, it can be ensured that intermediation is carried out by trained personnel. This would induce investors to use their services. Industry/SROs/Regulators have made a modest beginning, but adequate attention is not given to this dimension of the market. Though NCFM has been offering a wide range of modules, there is still scope to offer such certifi cations for each category of intermediary/activity. SEBI also specifi ed certifi cation as a mandatory requirement for all operational level employees for all types of intermediaries. Thus, it is required that all new employees joining the intermediaries and all intermediaries joining the market, should be certifi ed. The employees should also be required to update their skills and expertise by seeking certifi cation at intervals of fi ve years. There should be an arrangement to maintain a database of certifi ed professionals and enforce a code of conduct for them so as to enable prospective employers access the database to meet their personnel requirements. This would enhance the knowledge and skill of the intermediaries (including regulators and SROs), who, in turn, can educate and guide the investors in securities and issuers of securities.
www.nseindia.com
Knowledge InitiativesISMR 200
CBSE – NSE joint certifi cation in Financial Markets
CBSE and NSE introduced a joint certifi cation in Financial Markets for std. XI and XII. The course, titled “Financial Markets Management” had been introduced by CBSE for academic year 2007 - 2008. Students can opt for this course instead of Science, Arts, Commerce etc. The new course comprises of various subjects, such as Languages, Economics, Business Studies, Accounting for Business etc. Besides these, two fi nancial market related subjects, “Introduction to Financial Markets – I” and “Introduction to Financial Markets – II” will be taught in Std. XI and XII respectively. Students opting for the course would be required to take the NCFM on-line tests in “Financial Markets : A Beginners Module” in Std. XI and both “Capital Markets (Dealers) Module and Derivatives Markets (Dealers) Module”, in Std. XII.
The course is in its second year and over 1500 students are enrolled for the course. This is the fi rst such attempt to introduce fi nancial literacy in a formal way in schools.
NSE Blackboard Series
To create awareness of the NSE & CBSE Financial Management Course initiative for the CBSE XI & XII students and reinforce the need and importance of such an initiative, a unique series featuring the details of the NSE & CBSE Financial Management course initiative is broadcasted on CNBC TV18 channel twice a week.
Research Initiatives Knowledge management is very important in today’s competitive world. It acts as a tool which helps to acquire the cutting edge in a globalised fi nancial market. The regulators and SROs have been actively promoting academicians and market participants to carry out research about various topics in the various segments of securities market.
NSE Research Initiative
NSE administers a scheme called the NSE Research Initiative. This aims at improving the market effi ciency further. The initiative fosters research with a purpose to support and facilitate stock exchanges to design market microstructure, to help participants frame their strategies, assist regulators to frame regulations, and in general to broaden the knowledge horizon of the securities market. The initiative has received tremendous response from the academics as well as the market participants from within and outside the country. The studies completed under the research initiative are presented in Table 9-2. During the year 2008, fi ve research papers were completed under the NSE Research Initiative. The completed papers are available on the NSE website www.nseindia.com.
Data Dissemination
NSE compiles, maintains and disseminates high quality data to market participants, researchers and policy-makers. This acts as a valuable input for formulating strategy, doing research and making policies. NSE has been maintaining the historical database of all the details of every order placed on its trading system and every trade executed. This data is disseminated through monthly CD/DVDs releases which are priced at a nominal rate. The following information is available on CDs/DVDs:
• Summary information about each security’s high price, low price, closing price and last traded price, turnover (value and volume), and number of trades for each trading day.
• Database of stock market indices computed by IISL. Both intra day and end of day information is available for Nifty, CNX Midcap and Defty.
• Snapshots of limit order book of NSE at different points during a day.
• Database of circulars issued during the month. Every development in the market in terms of market design is documented in these circulars.
Besides, NSE’s web-site itself is a storehouse of information.
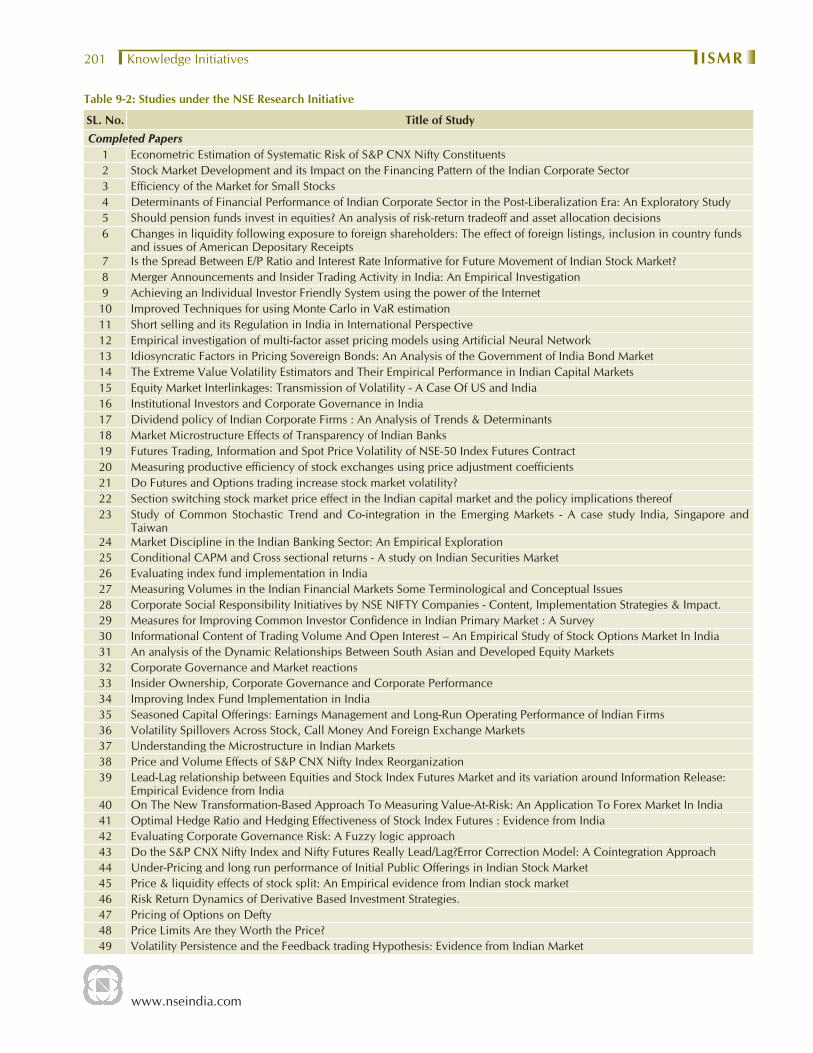
www.nseindia.com
Knowledge Initiatives ISMR201
Table 9-2: Studies under the NSE Research Initiative
SL. No. Title of StudyCompleted Papers
1 Econometric Estimation of Systematic Risk of S&P CNX Nifty Constituents2 Stock Market Development and its Impact on the Financing Pattern of the Indian Corporate Sector3 Effi ciency of the Market for Small Stocks4 Determinants of Financial Performance of Indian Corporate Sector in the Post-Liberalization Era: An Exploratory Study5 Should pension funds invest in equities? An analysis of risk-return tradeoff and asset allocation decisions6 Changes in liquidity following exposure to foreign shareholders: The effect of foreign listings, inclusion in country funds
and issues of American Depositary Receipts7 Is the Spread Between E/P Ratio and Interest Rate Informative for Future Movement of Indian Stock Market?8 Merger Announcements and Insider Trading Activity in India: An Empirical Investigation9 Achieving an Individual Investor Friendly System using the power of the Internet
10 Improved Techniques for using Monte Carlo in VaR estimation11 Short selling and its Regulation in India in International Perspective12 Empirical investigation of multi-factor asset pricing models using Artifi cial Neural Network13 Idiosyncratic Factors in Pricing Sovereign Bonds: An Analysis of the Government of India Bond Market14 The Extreme Value Volatility Estimators and Their Empirical Performance in Indian Capital Markets15 Equity Market Interlinkages: Transmission of Volatility - A Case Of US and India16 Institutional Investors and Corporate Governance in India17 Dividend policy of Indian Corporate Firms : An Analysis of Trends & Determinants18 Market Microstructure Effects of Transparency of Indian Banks19 Futures Trading, Information and Spot Price Volatility of NSE-50 Index Futures Contract20 Measuring productive effi ciency of stock exchanges using price adjustment coeffi cients21 Do Futures and Options trading increase stock market volatility?22 Section switching stock market price effect in the Indian capital market and the policy implications thereof23 Study of Common Stochastic Trend and Co-integration in the Emerging Markets - A case study India, Singapore and
Taiwan24 Market Discipline in the Indian Banking Sector: An Empirical Exploration25 Conditional CAPM and Cross sectional returns - A study on Indian Securities Market26 Evaluating index fund implementation in India27 Measuring Volumes in the Indian Financial Markets Some Terminological and Conceptual Issues28 Corporate Social Responsibility Initiatives by NSE NIFTY Companies - Content, Implementation Strategies & Impact.29 Measures for Improving Common Investor Confi dence in Indian Primary Market : A Survey30 Informational Content of Trading Volume And Open Interest – An Empirical Study of Stock Options Market In India31 An analysis of the Dynamic Relationships Between South Asian and Developed Equity Markets32 Corporate Governance and Market reactions33 Insider Ownership, Corporate Governance and Corporate Performance34 Improving Index Fund Implementation in India35 Seasoned Capital Offerings: Earnings Management and Long-Run Operating Performance of Indian Firms36 Volatility Spillovers Across Stock, Call Money And Foreign Exchange Markets37 Understanding the Microstructure in Indian Markets38 Price and Volume Effects of S&P CNX Nifty Index Reorganization39 Lead-Lag relationship between Equities and Stock Index Futures Market and its variation around Information Release:
Empirical Evidence from India40 On The New Transformation-Based Approach To Measuring Value-At-Risk: An Application To Forex Market In India41 Optimal Hedge Ratio and Hedging Effectiveness of Stock Index Futures : Evidence from India42 Evaluating Corporate Governance Risk: A Fuzzy logic approach43 Do the S&P CNX Nifty Index and Nifty Futures Really Lead/Lag?Error Correction Model: A Cointegration Approach44 Under-Pricing and long run performance of Initial Public Offerings in Indian Stock Market45 Price & liquidity effects of stock split: An Empirical evidence from Indian stock market46 Risk Return Dynamics of Derivative Based Investment Strategies.47 Pricing of Options on Defty48 Price Limits Are they Worth the Price?49 Volatility Persistence and the Feedback trading Hypothesis: Evidence from Indian Market

www.nseindia.com
Knowledge InitiativesISMR 202
Investor Awareness and EducationNSE has been carrying out investor awareness and education seminars on a regular basis in various centres across the country. Informative brochures and booklets have been prepared for educating investors which are distributed free of cost at the seminars. 415 Investor Awareness Programmes were conducted during the year 2008.
Investor awareness efforts for Currency Derivatives
NSE is the fi rst Exchange to launch trading in currency futures in India. Trading in INRUSD currency futures contract started on 29th August 2008 at NSE. Trading in the fi rst day itself was very lively with nearly 70,000 contracts being traded.
There is already an active OTC market for forwards with an average daily turnover of over USD 34 billion in India. Now for the fi rst time, it would be possible to trade on the currency futures on an Exchange platform. With electronic trading and effi cient risk management systems, Exchange traded currency future would benefi t the universe of participants including corporate and individual investors, and would provides them new opportunities in this market segment.
To spread awareness on this new product, more than 220 interactive sessions have been organized in association with its members, trade associations and professional groups at major towns across the country. The participants were explained about the features of Exchange traded Currency Futures, the trading and settlement function at the Exchange and also its usage.
Some of the highlights of the Awareness program on Currency Derivatives include
• Roadshows with major trade promotion councils, export promotion councils, Chambers of Commerce and professional bodies.
• Programs at more than 68 locations across India.
• Tie up with NSE members to promote awareness among market participants.
• Faculty comprising of consultants and experts in Forex market.
Investor Protection Fund
Despite the various efforts taken by the regulators and exchange, some problems do arise. A cushion in the form of Investor Protection Funds (IPFs) is set up by the stock exchanges. The purpose of the IPF is to take care of investor claims, which may arise out of non-settlement of obligations by the trading members. The IPF is also used to settle claims of such investors whose trading member has been declared a defaulter. Further, the stock exchanges have been allowed to utilise interest income earned on IPF for investor education, awareness and research.
The Companies Act, 1956 also provides for an Investor Education and Protection Fund (IEPF) to protect the interests of small shareholders. The fund is utilised for conducting direct education programmes, organising seminars, promoting research activities and providing legal assistance to genuine investor litigants through investor grievances forums. The fund is managed by a committee comprising both government and non-government members. The IEPF is constituted from grants received from the government and from the unclaimed dividends, share application money, matured deposits and unclaimed debentures of the corporates.
IEPF provides fi nancial assistance to any organisation/entity/person with a viable project proposal on investors’ education and protection. The eligible entities are those registered under the Societies Registration Act or formed as Trusts or incorporated Companies. They should be in existence for a minimum period of 2 years employing a minimum of 20 members and be governed by properly established rules, regulations and or by-laws prior to its date of application for registration. In addition, they should not be a profi t making entity. The limit for each entity for assistance would be subject to 5% of the budget of IEPF during that fi nancial year and not exceeding 50% of the amount to be spent on the proposed programme/activity.

www.nseindia.com
Knowledge Initiatives ISMR203
NOTES

NOTES