indian journal of economics and development print...
TRANSCRIPT
Print ISSN 2277-5412Online ISSN 2322-0430
Indian Journal of Economics and Development
Volume 13No. 3
July-September, 2017
Indian Journal of conomics E
and Development 2277-5412
n d I T om Reu rs)I dexe in ESC ( h son te
CABI
SOED
NAAS rated
www.soed.inIndexed inCite Factor
N A J E DI DI N CON EV
2322-0430
Society of Economics and Developmentwww.soed.in

Chief Editor
Editors
Members
Dr. S.S. ChahalPunjab Agricultural University, Ludhiana (India)
Dr. S.S. ChhinaKhalsa College, Amritsar (India)
Dr. Mini GoyalPunjab Agricultural University, Ludhiana (India)
Dr. Sanjay KumarPunjab Agricultural University, Ludhiana (India)
Dr. Shalini SharmaPunjab Agricultural University, Ludhiana (India)
Dr. Anupama UppalPunjabi University, Patiala (India)
Dr. Catherine Neumeyer, Strategic Policy Branch, Agriculture and Agri-Food Canada, Ottawa (Canada)
Dr. Timothy J. Colwill, Research Economist, Agriculture and Agri-food Canada, Ottawa (Canada)
Dr. I.P. Singh, SK Rajasthan Agricultural University, Bikaner (India)
Dr. Inderpal Singh, Trade and Investment, Economic Policy and Strategy, NSW (Australia)
Dr. J.L. Sharma, Eternal University, Baru Sahib (India)
Dr. Jasdev Singh, Punjab Agricultural University, Ludhiana (India)
Dr. Seema Bathla, Jawaharlal Nehru University, New Delhi (India)
Dr. K.K. Datta, National Dairy Research Institute, Karnal (India)
Dr. M.K.Sekhon, Punjab Agricultural University, Ludhiana (India)
Dr. Y.C. Singh, Central Agricultural University, Manipur (India)
Dr. Naresh Singla, Central University of Punjab, Bathinda
Dr. R.B.Hile, MPKV, Rahuri (India)
Dr. Ardi Gunardi, Pasundan University, Bandung (Indonesia)
Dr. Ravinderpal Singh Gill, Agriculture and Agri-Food Canada, Ottawa (Canada)
Dr. Richard Kwasi Bannor, University of Energy & Natural Resources, Sunyani-Ghana
Dr. Rohit Singla, Boston College, Fulton (USA)
Dr. Sadiq Mohammed Sanusi, Federal University of Technology, Minna (Nigeria)
Dr. V.P. Luhach, CCS Haryana Agricultural University, Hisar (India)
Ms. Donata Ponsian Kemirembe, Division of Environment, Vice President's Office, Dar es Salaam (Tanzania)
Dr. Deepak Upadhya, Local Initiatives for Biodiversity, Research and Development, Pokhara, Kaski (Nepal)
Dr. Baljinder Kaur Sidana, Punjab Agricultural University, Ludhiana (India)
Dr. Sangeet Ranguwal, Punjab Agricultural University, Ludhiana (India)
Dr. Varinderpal Singh, Guru Angad Dev Veterinary and Animal Sciences University, Ludhiana (India)
Indian Journal of Economics and Development
Editorial Board

rRep
intABSTRACTIndian society experiences various inequalities in the field of education and employment wherein the scheduled castes subsist on the minimal levels. They are lagging behind in the developmental process. The main objective of the paper is to analyse these two parameters among scheduled castes of rural Punjab. The paper is divided into three sections. To begin with, the educational and employment situation of scheduled castes is compared with general population in India and in Punjab. Thereafter, the relationship between these two components is considered. In the next part, their educational status and inequality in the occupational structure is examined. The paper revealed that the diminutive educational as well as occupational status of the scheduled castes in rural areas of Punjab represents their disappointing situation. The paper is based on the secondary as well as primary data. Secondary data is taken from Census of India and various issues of NSSO. Primary data is collected from three districts of Punjab namely SAS Nagar, Hoshiarpur and Sri Muktsar Sahib districts.
KeywordsEducation, employment, scheduled castes
JEL CodesD71, E24, I21, I24, O17, P25
inequality, informalisation, rural Punjab,
Balwinder Singh Tiwana, Ravita and Manpreet Kaur
Department of Economics, Punjabi University, Patiala-147002
Corresponding author's email: [email protected]
Received: January 17, 2017 Accepted: July 27, 2017
Education and Employment Situation in India: A Case Study of Rural Punjab
Indian Journal of Economics and Development (2017) 13(3), 424-433
DOI: 10.5958/2322-0430.2017.00199.8
www.soed.in
NAAS Score: 4.82 www.naasindia.org
UGC Approved
INTRODUCTIONEconomic progress of any nation exclusively rests on
the expansion of its economic possessions and in this regard, human resource is an imperative factor which adds to the economic reserves of the country. The two leading steps for realizing the objectives of economic growth and manipulating the human resources optimally comprise of educating the masses and employing them in productive jobs. These two components are inter-related to each other in such a way that both of them are complementary to each other. On the one hand, education serves as the major ingredient for enabling the individuals to earn their livelihood and on the other hand, employment augments their proficiency and efficiency in profession. Thus, the link between education and job is through the capability of the educational system to identify potentially productive prospective employees (Varghese, 1988).
Along with the assurance against loss of employment, education helps to combat unemployment among the natives. Individuals as well as the community reap the
economic and social benefits as a result of qualitative education. Education; defined as the aggregate of all the teaching–learning and social processes; develops the abilities, attitudes and other forms of behaviour of practical values of a person in the society and enhances his social competence and optimum individual development (Srivastava, 2014). Employment covers both employees and self-employed persons, who are engaged in some productive activity that falls within the production boundary of the system (The European Union Labour Force Survey, 1996). Consequently, education provides groundwork for attaining social values and economic expertise and employment enhances the production and productivity levels.
Education affects the economic system directly and indirectly, where a rise in individual's wage is a direct effect and an increase in education is an indirect effect (Bashir et al., 2012). But, the Indian society experiences various inequalities in the field of education and employment which are considered imperative for speedy economic growth and qualitative transformation. Vast
424

rRep
int
majority of the people in India are dependent on the income earned from casual and unskilled sources. They subsist on the minimal levels with low level of education, employment and income. This is due to the fact that in India, the economic growth, mixed with social justice, is not smooth wherein the former is given more emphasis than the latter resulting in asymmetrical economic development. Moreover, this economic growth has contemplated jobless economic growth especially, among the weaker sections of the society. Their employment opportunities are most affected by the minimal levels of education. The need for a big push in education and employment has been the foremost policy challenge confronting the Indian economy, particularly among the weaker sections of the community.
Among the weaker sections of Indian economy, scheduled castes comprise of 16.6 per cent of the total Indian population (Census of India, 2011). They have been deprived of the social and economic endowments since long time. Their status and reputation has been generally linked to those occupations which are regarded as ritually unclean. However, their condition has improved to some extent since independence due to the protective measures in the Indian Constitution and the reservations in the government recruitments. But, still the poorest of the poor belong to these castes and even after more than 50 years of planned initiatives, fair distribution of opportunities among these backward communities appears merely hoping against hope (Mohanty, 2001). Many factors constitute their painstaking life and they had been lagging behind in the developmental process.
In Punjab, the scheduled castes are certainly not as poor as their counterparts in other States. In fact, they are comparatively prosperous (Government of Punjab, 2004). But, the lack of quality education, regular employment and lack of participation in social and political processes among the Scheduled Castes has resulted in the continuance of their backwardness. Improving the human capital base through education among the backward communities could be one of mechanism that helps in breaking the fetter of their backwardness (Motkuri, 2013). So, it becomes indispensable to know about the degree of inequality faced by the scheduled castes in education and employment in India, especially in Punjab. OBJECTIVES AND METHODOLOGY
The main objective of the paper is to analyse the educational and employment situation among scheduled castes of rural Punjab. The paper is divided into three sections. To begin with, the educational and employment situation of scheduled castes is compared with general population in India and in Punjab. Thereafter, the relationship between these two components is considered. In the next part, their educational status and inequality in the occupational structure in rural Punjab is examined. The paper is based on the secondary as well as primary data. Secondary data is taken from Census of
India and various issues of NSSO. Primary data is collected from three districts of Punjab namely SAS Nagar, Hoshiarpur and Sri Muktsar Sahib districts. These districts are selected on the basis of low, medium and high concentration of scheduled caste population, respectively.Section I: Educational and Employment Status of Scheduled Castes in India and Punjab
This section deals with the educational and employment status of scheduled castes and general population in India as well as in Punjab state. First and the foremost step to explore their situation in education is to investigate their literacy rate. A person aged seven and above, who can both read and write with understanding in any language, is treated as literate (Census of India, 2011). Besides, the National Literacy Mission defines literacy as 'acquiring the skills of reading, writing and arithmetic and the ability to apply them to one's day-to-day life' (Govinda & Biswal, 2005) which denotes the functional literacy. Table 1 demonstrates the difference in literacy levels among the scheduled castes and the overall population in India and Punjab.
The literacy rate in India and Punjab has risen among the scheduled castes and the overall population from 1991 to 2011. The credit for the improvement in the literacy rate goes to the endeavours of the Indian government which includes Sarva Shiksha Abhiyan, Education for All and mid-day meal scheme. But, the increase in literacy rate is more among scheduled castes as compared to overall population both in India and Punjab. This could be because of the “Reservation Policy” introduced by Dr. B.R. Ambedkar, which might have provided several opportunities to these socially backward classes in the field of education (Dutta & Sivaramakrishnan, 2013). Moreover, literacy rate is more in Punjab in comparison to India. In India, the overall literacy rate is 52.2 in 1991 which increased to 64.8 in 2001 and 74 per cent in 2011. Among scheduled castes, it was 37.4 per cent in 1991 which increased 28.7 percentage points in 2011. No doubt, literacy rate is more in Punjab, but, its increase is less than India. The overall literacy rate has increased from 58.5 per cent in 1991 to 75.8 per cent in 2011. The literacy rate among scheduled castes in Punjab has increased from 41.1 per cent in 1991 to 56.2 per cent in 2001 and further to 64.8 per cent in 2011. Thus, whether the literacy rate has increased more among scheduled
Year India Punjab
Overall SCs Overall SCs
1991 52.2 37.4 58.5 41.12001 64.8 34.8 69.7 56.22011 74.0 66.1 75.8 64.8Per cent change 21.8 28.7 17.3 23.7
Table 1. Literacy rate in India and Punjab
Source: Census of India, 1991, 2001, 2011
425
Tiwana et al.: Education and employment situation in India: A case study of rural Punjab

rRep
int
castes, still they are far behind in their educational status both in India and Punjab. This is attributed to lack of educational resources, privatization, extreme poverty accompanied by humiliation and bullying by the higher castes (Saravanakumar & Palanisamy, 2013).
In addition to examining the differentials in educational status, there is requisite to take a look at the employment discrepancy among the general and scheduled caste population in India, especially in Punjab. In Indian economy, the leading aspects for the appraisal of employment situation comprise of Labour Force Participation Rate and Worker Population Ratio which continue to have crucial importance in the determination of the structure and extent of existing human resources. The Labour Force Participation Rate is a measure of the proportion of a country's working-age population that engages actively in the labour market, either by working or looking for work. It provides an indication of the relative size of the supply of labour force available to engage in the production of goods and services. The Worker Population Ratio signifies the proportion of workers/employed persons in the total population (Government of India, 2014). These two indicators are reflected in Table 2.
The table reveals that in India, there is decrease of 3.3 percentage points in both the indicators in overall population from 1993-94 to 2011-12, but, the labour force participation rate has increased 14.6 percentage points and worker population ratio has decreased by 0.8 percentage points among scheduled castes. During this time period, in Punjab, overall the LFPR has decreased 12 percentage points whereas WPR has increased 4.7 percentage points. Among scheduled castes, the LFPR and WPR both have increased 8.9 and 12 percentage points, respectively. On the whole, the table shows that overall LFPR has decreased and it has increased among scheduled castes both in India and Punjab. In case of WPR, it has shown decreasing trend in India and increasing trend in Punjab both among scheduled castes and overall population. Undoubtedly, scheduled castes are performing better in employment related indicators, but, in particular, they are concentrated in rural areas/agriculture, and the way in which they get absorbed into the non-agricultural sectors is through casual labour in the unorganized segments of industry and services-in
low productivity, low-wage jobs (Government of India, 2011a).Section II: Relationship between Education and Employment
It is impossible to distract from the reality that while India has realized the initiative of sky-scraping economic growth, however, this has been basically the jobless economic growth. This entails enormous efforts in the field of education as well as employment in the economy. The intense bond between these two factors indicates the necessity of their equivalent development at a considerable large scale. Firstly, this correlation is highlighted in Indian economy among general population and scheduled castes in Table 3.
The table throws a light on the distribution of per 1000 persons aged above 15 years & above by main activity and educational classification according to UPS approach. Among employed persons, scheduled castes are employed more than overall population up to secondary level of education but, after that from higher secondary to graduate level of education, overall employed persons are more as compared to SCs. There are 640 persons and 652 persons per 1000 persons among overall and scheduled castes who are post graduate & above.
Per 1000 unemployed persons are more among overall population and scheduled castes at all levels of education, but, on the whole there are 26 and 25 persons per 1000 persons are unemployed overall and scheduled castes, respectively. As the education level goes up, more of the scheduled caste persons go out of the labour force as compared to the overall population. On the whole, 475 and 454 persons out of 1000 persons are not in labour force in overall population and scheduled caste population, respectively.Section III: Educational and Occupational Structure of Scheduled Castes in Rural Punjab
Punjab, with 31.94 percent of scheduled caste population, occupies the first position in terms of percentage of SC to State population (Punjab Primary Census Abstract, 2011). There are 37 Scheduled Castes in Punjab. These include two segments: Mazhabis and Ramdasias. The Scheduled Castes whose profession is scavenging and cleaning are Mazhabis or Rangretas and the Ramdasias or Ravidasias are engaged in the profession of leather work or weaving (Ram, 2004). As
Year LFPR WPR
India Punjab India Punjab
Overall SCs Overall SCs Overall SCs Overall SCs
1993-94 42.8 41.3 55.5 35.1 42.0 40.3 36.4 29.72004-05 43.0 43.8 43.4 42.4 42.0 42.8 41.6 40.62011-12 39.5 55.9 43.5 44.0 38.6 39.5 41.1 41.7Percentage change -3.3 14.6 -12 8.9 -3.4 -0.8 4.7 12
Table 2. Employment situation in India and Punjab
Source: NSSO, Various Issues
426
Indian J Econ Dev 13(3): 2017 (July-September)

rRep
int
compared to rest of India, the caste hierarchy in Punjab is considered to be relatively weak (Government of Punjab, 2004). However, although lesser in extent, one could easily observe the typical features of the caste system in Punjab that made scheduled castes suffer the same social disabilities as their counterparts in other Indian states (Sharma, 2012). Still, the scheduled castes in Punjab need that support from the society and the government which can lead them to a prosperous social and economic life.
Taking three districts into consideration, namely, SAS Nagar, Hoshiarpur and Sri Muktsar Sahib districts, primary data has been collected to inspect the educational as well as occupational structure of the scheduled castes in rural Punjab. To explore the condition of the scheduled castes regarding these two indicators, it is imperative to identify their demographic composition. Demography constitutes the most important factor for analyzing the population statistics of any region. The demographic
characteristics of rural scheduled caste households in Punjab are represented in Table 4.
The Table 4 revealed that out of 2184 persons, 1159 are males and 1025 are females. In SAS Nagar district, out of 681 persons, 360 (52.86 per cent) are males and 321 (47.14 per cent) are females. In Hoshiarpur district, there are 565 persons wherein 52.21 per cent are males and 47.79 per cent are females. Further, Sri Muktsar Sahib district comprises of 938 persons out of which 504 (53.73 per cent) are males and 434 (46.27 per cent) are females. Among all the sampled households, sex ratio is 884 in rural areas of Punjab which is very low. Moreover, the sex ratio is worked out 891 in SAS Nagar district. Due to low child sex ratio, Sri Muktsar Sahib district has the lowest sex ratio of 861 among the selected districts of Punjab. The main reason behind this is their preference for male child because sons are considered as earning source for the family. The sex ratio is the highest (915) in Hoshiarpur
Description Employed Unemployed Not in Labour Force
Overall SCs Overall SCs Overall SCs
Not Literate 487 512 7 9 506 479Below Primary 539 570 8 10 454 420Primary 586 628 10 12 405 361Middle 542 592 17 19 441 389Secondary 434 431 20 22 545 547Higher Secondary 401 386 38 45 562 569Diploma/Certificate 442 416 74 82 484 502Graduate 546 529 87 101 367 370PG & above 640 652 89 130 270 217Total 499 520 26 25 475 454
Table 3. Distribution per 1000 of persons aged above 15 years & above by main activity and educational classification according to UPS approach in India (2014)
Source: NSSO, 2014
Age SAS Nagar Sri Muktsar Sahib Hoshiarpur All sampled households
Male Female Total Male Female Total Male Female Total Male Female Total
Up to 9 44(6.46)
47(6.90)
91(13.36)
91(9.70)
80(8.53)
171(18.23)
32(5.66)
32(5.67)
64(11.33)
167(7.65)
159(7.28)
326(14.92)
9-14 52(7.63)
48(7.05)
100(14.68)
76(8.10)
55(5.86)
131(13.96)
40(7.08)
36(6.37)
76(13.45)
168(7.69)
139(6.36)
307(14.06)
15-59 235(34.51)
202(29.66)
437(64.17)
300(31.98)
263(28.04)
563(60.02)
192(33.98)
174(30.80)
366(64.78)
727(33.29)
639(29.26)
1366(62.55)
60-65 9(1.32)
10(1.47)
19(2.79)
19(2.03)
19(2.03)
38(4.06)
17(3.01)
9(1.59)
26(4.60)
45(2.06)
38(1.74)
83(3.80)
65 & above
20(2.94)
14(2.06)
34(5.00)
18(1.92)
17(1.81)
35(3.73)
14(2.48)
19(3.36)
33(5.84)
52(2.38)
50(2.29)
102(4.67)
Total 360(52.86)
321(47.14)
681(100.00)
504(53.73)
434(46.27)
938(100.00)
295(52.21)
270(47.79)
565(100.00)
1159(53.07)
1025(46.93)
2184(100.00)
Sex ratio
892 861 915 884
Table 4. Demographic features of scheduled caste households in rural Punjab
Source: Primary Survey, 2013-14; Figures in parentheses represent the percentages
427
Tiwana et al.: Education and employment situation in India: A case study of rural Punjab

rRep
int
district as compared to other districts under study. The literacy being high in this district, the sex ratio is relatively favourable here as educated people give equal importance to the male-female children (Rani, 2011).
The demographic composition of the sampled households' points out that majority of the scheduled caste persons (62.55 per cent) fall in the age-group of 15-59 years out of which 33.29 per cent are males and 29.26 per cent are females. The productive age-group, that is, 15-59 years has the highest percentage of persons in all the three districts which constitute 563 persons (60.02 per cent) in Sri Muktsar Sahib district, 437 persons (64.17 per cent) in SAS Nagar district and 366 persons (64.78 per cent) in Hoshiarpur district. From the analysis, it is clear that majority of persons belong to this age-group that is considered as the working population. Remaining persons are incorporated in the dependent age-groups of up to 15 years and 59 years & above which consist of 37.45 persons among all the sampled households, 35.83 per cent in SAS Nagar district, 35.22 per cent in Hoshiarpur district and 39.98 per cent in Sri Muktsar Sahib district.
Adding on, education is regarded as the footstep to render basic economic as well as social amenities to the
backward classes. It is a known fact that the scheduled castes are historically deprived of the basic education. Undoubtedly, the various government initiatives such as Sarva Shiksha Abhiyan, Right to Education Act and other constitutional provisions have geared up their educational standards, but, still they are underprivileged regarding this major component. Based on the primary data from rural areas of three districts, the education level among the scheduled caste households has been given in Table 5. The table shows that majority of males (12.77 per cent) and females (15.66 per cent) are illiterate in the rural areas of Punjab. Only 10.07 per cent males and 8.75 per cent females have obtained education up to primary level whereas 8.38 per cent males and 6.59 per cent females are educated up to middle level. As much as 12.13 per cent, 6 per cent, 1.97 per cent, 0.28 per cent and 0.69 per cent persons have acquired secondary, senior secondary, graduation, post-graduation and other technical education, respectively.
The district-wise analysis shows that majority of the males (11.45 per cent) have got secondary education in SAS Nagar district followed by 10.80 per cent in Hoshiarpur district and 4.37 per cent in Sri Muktsar Sahib district. In Sri Muktsar Sahib district, there are the highest
District/ GenderEducation level
SAS Nagar Sri Muktsar Sahib Hoshiarpur All sampled households
Male Femal Total Male Femal Total Male Femal Total Male Femal Total
Up to 7years
23(3.37)
20(2.94)
43(6.31)
47(5.01)
37(3.94)
84(8.95)
8(1.42)
11(1.95)
19(3.37)
78(3.57)
68(3.11)
146(6.68)
Illiterate 61(8.96)
84(12.33)
145(21.29)
183(19.51)
197(21.00)
380(40.51)
5(6.19)
61(10.80)
96(16.99)
279(12.77)
342(15.66)
621(28.43)
BelowPrimary
27(3.96)
40(5.88)
67(9.84)
49(5.22)
49(5.22)
98(10.44)
28(4.96)
26(4.60)
54(9.56)
104(4.76)
115(5.27)
219(10.03)
Primary 76(11.16)
67(9.84)
143(21.00)
100(10.66)
74(7.89)
174(18.55)
44(7.79)
50(8.85)
94(16.64)
220(10.07)
191(8.75)
411(18.82)
Middle 71(10.43)
65(9.54)
136(19.97)
56(5.97)
39(4.16)
95(10.13)
56(9.91)
40(7.08)
96(16.99)
183(8.38)
144(6.59)
327(14.97)
Secondary 78(11.45)
26(3.82)
104(15.27)
41(4.37)
22(2.35)
63(6.72)
61(10.80)
37(6.55)
98(17.35)
180(8.24)
85(3.89)
265(12.13)
SeniorSecondary
17(2.50)
14(2.06)
31(4.56)
15(1.60)
10(1.07)
25(2.67)
48(8.50)
27(4.78)
75(13.28)
80(3.66)
51(2.34)
131(6.00)
Graduation 6(0.88)
3(0.44)
9(1.32)
9(0.96)
6(0.64)
15(1.60)
10(1.76)
9(1.59)
19(3.35)
25(1.14)
18(0.83)
43(1.97)
PostGraduation
1(0.15)
0(0.00)
1(0.15)
1(0.11)
0(0.00)
1(0.11)
0(0.00)
4(0.71)
4(0.71)
2(0.09)
4(0.19)
6(0.28)
Technical &ProfessionalEducation,Diplomas etc.
0(0.00)
2(0.29)
2(0.29)
3(0.32)
0(0.00)
3(0.32)
5(0.88)
5(0.88)
10(1.76)
8(0.37)
7(0.32)
15(0.69)
Total 360(52.86)
321(47.14)
681(100.00)
504(53.73)
434(46.27)
938(100.00)
295(52.21)
270(47.79)
565(100.00)
1159(53.07)
1025(46.93)
2184(100.00)
Table 5. Educational status of scheduled caste households in rural Punjab
Source: Primary Survey, 2013-14; Figures in parentheses represent the percentages
428
Indian J Econ Dev 13(3): 2017 (July-September)

rRep
int
percentage of illiterate males (19.51 per cent) and females (21 per cent). The main reason for this is the lack of awareness among people regarding education as well as lack of schools and school infrastructure in this district. Hoshiarpur district has the least number of illiterate males (6.19 per cent) and females (10.80 per cent). The percentage of persons getting graduation (3.35), post-graduation (0.71) and other technical and professional education (1.76) are the highest in Hoshiarpur district. Thus, the number of literates is high in this district as compared to other two selected districts which may be due to the fact that district occupies a very high position in terms of availability of schools per lakh population (Government of Punjab, 2008). The analysis further indicates that as the level of education increases, the participation of females in education is decreasing. This shows the gender inequality in education. For these women, the hardships associated with living in a 'low-income' developing nation and the deprivations associated with minority status are compounded by a patriarchal value system (Dunn, 1993).
Economic status represents the economic capacity of families to meet their material and non-material needs (Yadollahi & Paim, 2010). It determines whether an individual is earning, earning dependant or dependant. Table 6 represents the economic status of scheduled caste households in rural Punjab. The table shows that among all the households taken together, majority of the persons (54.72 per cent) are dependent followed by main earners of the family (24.54 per cent) and earning dependents (20.74 per cent).
In all the three districts also, dependants are in maximum numbers, that is, 58.88 per cent in SAS Nagar district, 57.70 per cent in Hoshiarpur district and 49.89 per cent in Sri Muktsar Sahib district. In Sri Muktsar Sahib district, scheduled caste households have less income as compared to other two districts due to which women also earn along with men. This has resulted in fewer dependants in Sri Muktsar Sahib district, i.e. there
are 26.97 per cent earning persons in district as compared to nearly 22 per cent both in Hoshiarpur and SAS Nagar districts. The earning dependents include 23.13 per cent, 19.47 per cent and 18.50 per cent in Sri Muktsar Sahib, Hoshiarpur and SAS Nagar districts, respectively. Therefore, the number of dependents is more than earning persons and earning dependents taken together among all the households taken together and among all the three districts except Sri Muktsar Sahib where they are less by a minute difference.
The other elements of employment can be examined by identifying the employment status of individuals, that is, whether the earning persons are self-employed, regular employee or casual labourers. Persons who operate their own farm or non-farm enterprises or are engaged independently in a profession or trade on own-account or with one or a few partners are considered as self-employed. Persons working in others farm or non-farm enterprises and getting in return salary or wages on a regular basis are the regular salaried/wage employees. A person casually engaged in others farm or non-farm enterprises and getting in return wage according to the terms of the daily or periodic work contract is a casual wage labour (Government of India, 2014).
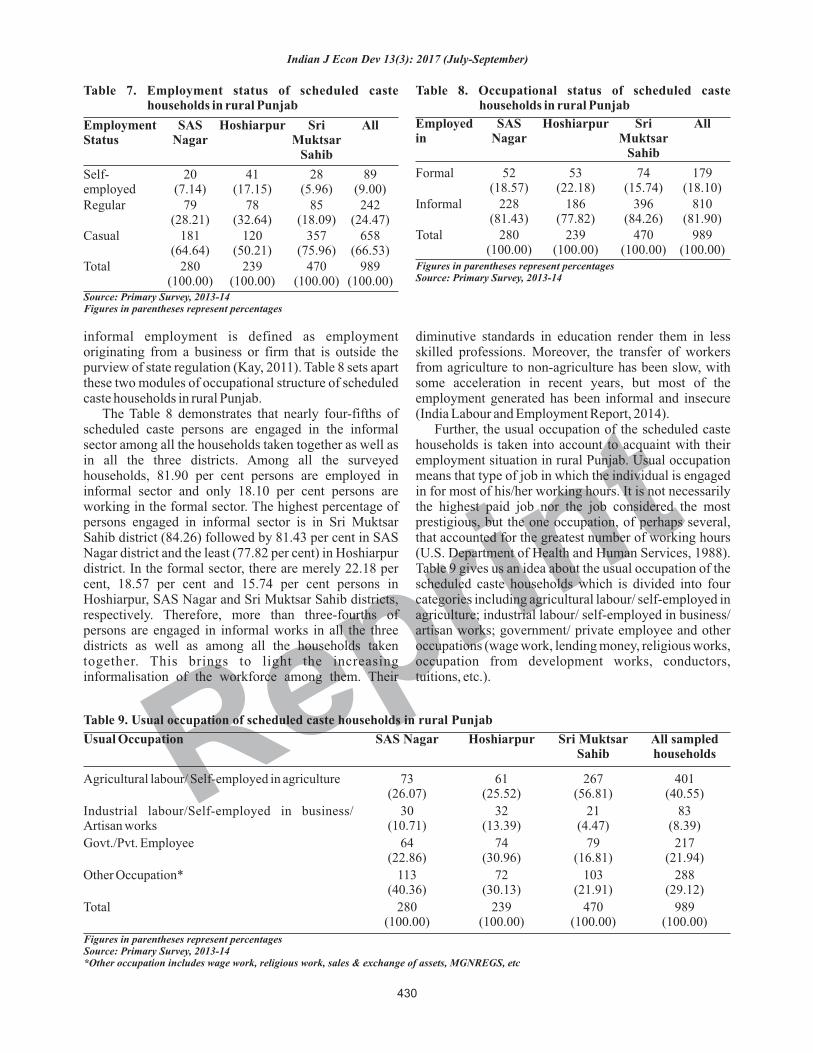
The employment status of scheduled caste households in rural Punjab is represented in Table 7. Majority of the persons, among all the households taken together and among all the surveyed districts, are casual labourers followed by regular and self-employed persons. Among all the households taken together, 66.53 per cent persons are casual labourers followed by 24.47 per cent regular employed persons and 9 per cent self-employed persons. About three-fourths of employed persons in Sri Muktsar Sahib district are casual labourers majority of which are agricultural labourers. 64.64 per cent persons in SAS Nagar district and 50.21 per cent) in Hoshiarpur district are casual labourers. The regular employed persons are the highest in Hoshiarpur district (32.64 per cent) followed by 28.21 per cent in SAS Nagar district and the least in Sri Muktsar Sahib district (18.09 per cent). About 5.96 per cent, 7.14 per cent and 17.15 per cent persons are self-employed in Sri Muktsar Sahib, SAS Nagar and Hoshiarpur districts, respectively. Thus, among the employed persons in selected districts of rural Punjab, the maximum numbers of persons are casual labourers followed by regular employees and the self-employed. These households possess little, if any, physical or human capital assets, mainly the cultivated land and depend for their livelihood on the irregular, fluctuating and uncertain casual labour employment tied mainly to seasonal agricultural activities and dependent on the vagaries of weather (Sundaram & Tendulkar, 2003).
Taking into consideration the occupational status, it points towards the employment of an individual in the formal or informal sector. Formal employment is defined as employment originating from a business or firm that is registered with the state. On the other hand,
Sri Muktsar Sahib
Economic Status
SAS Nagar
Hoshiarpur Sri Muktsar
Sahib
All sampled
households
Earning 154(22.61)
129(22.83)
253(26.97)
536(24.54)
Earning Dependant
126(18.50)
110(19.47)
217(23.13)
453(20.74)
Dependant 401(58.88)
326(57.70)
468(49.89)
1195(54.72)
Total 681(100.00)
565(100.00)
938(100.00)
2184(100.00)
Table 6. Economic status of scheduled caste households in rural Punjab
Source: Primary Survey, 2013-14Figures in parentheses represent percentages
429
Tiwana et al.: Education and employment situation in India: A case study of rural Punjab
rRep
int
informal employment is defined as employment originating from a business or firm that is outside the purview of state regulation (Kay, 2011). Table 8 sets apart these two modules of occupational structure of scheduled caste households in rural Punjab.
The Table 8 demonstrates that nearly four-fifths of scheduled caste persons are engaged in the informal sector among all the households taken together as well as in all the three districts. Among all the surveyed households, 81.90 per cent persons are employed in informal sector and only 18.10 per cent persons are working in the formal sector. The highest percentage of persons engaged in informal sector is in Sri Muktsar Sahib district (84.26) followed by 81.43 per cent in SAS Nagar district and the least (77.82 per cent) in Hoshiarpur district. In the formal sector, there are merely 22.18 per cent, 18.57 per cent and 15.74 per cent persons in Hoshiarpur, SAS Nagar and Sri Muktsar Sahib districts, respectively. Therefore, more than three-fourths of persons are engaged in informal works in all the three districts as well as among all the households taken together. This brings to light the increasing informalisation of the workforce among them. Their
Employment Status
SAS Nagar
Hoshiarpur Sri Muktsar
Sahib
All
Self-employed
20(7.14)
41(17.15)
28(5.96)
89(9.00)
Regular 79(28.21)
78(32.64)
85(18.09)
242(24.47)
Casual 181(64.64)
120(50.21)
357(75.96)
658(66.53)
Total 280(100.00)
239(100.00)
470(100.00)
989(100.00)
Table 7. Employment status of scheduled caste households in rural Punjab
Source: Primary Survey, 2013-14Figures in parentheses represent percentages
Usual Occupation SAS Nagar Hoshiarpur Sri MuktsarSahib
All sampled households
Agricultural labour/ Self-employed in agriculture 73(26.07)
61(25.52)
267(56.81)
401(40.55)
Industrial labour/Self-employed in business/ Artisan works
30(10.71)
32(13.39)
21(4.47)
83(8.39)
Govt./Pvt. Employee 64(22.86)
74(30.96)
79(16.81)
217(21.94)
Other Occupation* 113(40.36)
72(30.13)
103(21.91)
288(29.12)
Total 280(100.00)
239(100.00)
470(100.00)
989(100.00)
Table 9. Usual occupation of scheduled caste households in rural Punjab
Figures in parentheses represent percentagesSource: Primary Survey, 2013-14*Other occupation includes wage work, religious work, sales & exchange of assets, MGNREGS, etc
Employed in
SAS Nagar
Hoshiarpur Sri Muktsar
Sahib
All
Formal 52(18.57)
53(22.18)
74(15.74)
179(18.10)
Informal 228(81.43)
186(77.82)
396(84.26)
810(81.90)
Total 280(100.00)
239(100.00)
470(100.00)
989(100.00)
Table 8. Occupational status of scheduled caste households in rural Punjab
Figures in parentheses represent percentagesSource: Primary Survey, 2013-14
diminutive standards in education render them in less skilled professions. Moreover, the transfer of workers from agriculture to non-agriculture has been slow, with some acceleration in recent years, but most of the employment generated has been informal and insecure (India Labour and Employment Report, 2014).
Further, the usual occupation of the scheduled caste households is taken into account to acquaint with their employment situation in rural Punjab. Usual occupation means that type of job in which the individual is engaged in for most of his/her working hours. It is not necessarily the highest paid job nor the job considered the most prestigious, but the one occupation, of perhaps several, that accounted for the greatest number of working hours (U.S. Department of Health and Human Services, 1988). Table 9 gives us an idea about the usual occupation of the scheduled caste households which is divided into four categories including agricultural labour/ self-employed in agriculture; industrial labour/ self-employed in business/ artisan works; government/ private employee and other occupations (wage work, lending money, religious works, occupation from development works, conductors, tuitions, etc.).
430
Indian J Econ Dev 13(3): 2017 (July-September)
rRep
int
The Table 9 revealed that among all the households taken together, the mainstream population (40.55 per cent) is engaged in agriculture sector followed by 29.12 per cent persons in other occupations, 21.94 per cent persons as government or private employees and the least (8.39 per cent) are engaged in industrial labour or self-employed in small business or artisan works. In the agriculture sector, there are 56.81 per cent, 26.07 per cent and 25.52 per cent persons in Sri Muktsar Sahib, SAS Nagar and Hoshiarpur districts, respectively. The highest percentage of persons engaged in industrial labour or self-employed in business or artisan works is in Hoshiarpur district (13.39) followed by 10.71 per cent in SAS Nagar district and the least in Sri Muktsar Sahib district (4.47 per cent), respectively. There are 30.96 per cent, 22.86 per cent and 16.81 per cent persons in Hoshiarpur, SAS Nagar and Muktsar districts, respectively who are government or private employees. In SAS Nagar district, 40.36 per cent persons are engaged in other occupations such as wage work, religious work, sales, and exchange of assets, MGNREGS, etc. while there are 30.13 per cent and 21.91 per cent persons in Hoshiarpur and Sri Muktsar Sahib districts, respectively who are engaged in other occupations. Therefore, the maximum numbers of persons are employed in the agricultural sector whether as agricultural labourers or self-employed in agriculture and the least number of persons are engaged in small business or industrial labour or artisan works. They have suffered from the dual disabilities of severe economic exploitation and social discrimination due to which they are mainly dependent upon the agricultural pursuits and other low income generating occupations (Government of Punjab, 2015).CONCLUSIONS AND POLICY RECOMMENDATIONS
To recapitulate, the educational as well as occupational status of the scheduled castes in rural areas of Punjab represents their disappointing situation. Their low sex ratio, that is, 884 females per 1000 males gives the foremost impression of their retarded development as it is less in comparison to 895 females per 1000 males in Punjab state as a whole. The optimistic view of their satisfactory performance in employment is clear from the fact that majority of the population belongs to the productive age-group. However, it does not incorporate with their educational level as majority of scheduled caste persons are illiterate. Comparing the three districts, scheduled caste persons in Hoshiarpur district have quite superior level of education whereas Sri Muktsar Sahib district is backward. In addition to this, while individuals in working population are more, but, dependant persons are more in comparison to earning and earning dependants. Therefore, education as well as occupation constitutes two leading aspects of development which need to be pushed up among the scheduled castes in rural Punjab. Firstly, it requires upgrading their social structure and then, escalating their educational standards along
with boosting up their employment in formal and government sector. The empowerment of scheduled castes coincided with the inclusive growth strategy are the need of the hour for the improvement of their condition.
In view of above discussion, it can be perceived that social exclusion has made Punjab State deaf and dumb. It has hastened the poverty and joblessness among the excluded groups due to which they just dream of earning the bread rather than prolonged development. It calls for the provision of safety nets for their modest survival in the globalised world to ensure execution of macro policies in their favour.
Firstly, the traditional caste system needs to be eradicated in India, especially in Punjab. The scheduled castes must not be perceived as slaves and downtrodden individuals rather they must be ensured equal chances for their development. While some of the people belonging to the marginalised classes have improved their economic standards, but still they are not given same stratum as given to the upper castes due to which they are still in the web of social prejudice. This prejudice based on caste must be condensed to augment the marginalised classes and they must be liberated to choose the right path of their life. A purposeful affirmative action by the administrators is accountable in this direction.
Emphasis should not be on the enrolment of students in education, rather focus should be on the human resource development through high educational qualification of these people. Extra charges of education which include the books, uniforms etc. must also be dealt by the government. Education must be free up to the post-graduation level for these people. Agricultural colleges and ITIs must be established in Punjab state to provide skill and self- employment to youths from backward classes. Guidance institutes are needed for their safe future so that they can become capable of clearing IAS, IPS exams. No doubt, there is special provision of scholarship for scheduled caste students in Punjab, but, the amount of these scholarships is very small at the earlier stage of education. Therefore, the students must be acquainted with scholarships with adequate amount in kind or in cash. Reservations in private schools along with the government ones can be of great help for the inclusion of the excluded groups.
In Punjab state, majority of the scheduled castes are employed as labourers in the agricultural sector and their wages are very low. In view of this, minimum wages must be prescribed in the agricultural sector in order to maintain their minimum standards of living. Furthermore, this sector must be furnished with new employment opportunities. Regular jobs must be assigned to unskilled as well as skilled workers in the public sector where wages are quite certain. They must be endowed with preferential treatment for hiring along with enhancing entrepreneurship for running their small business.
As the scheduled caste women form the most excluded segment due to gender and caste, their empowerment is an
431
Tiwana et al.: Education and employment situation in India: A case study of rural Punjab

rRep
int
obligatory step for stipulating their position. Gender discrimination must be abolished at the work places and in the distribution of wages. Resources must be allocated equally towards the education of boys and girls. Social security for the women is also considered indispensable for the inclusion of women in the social undertakings.
Equitable distribution of land, assets and capital and up gradation of skills in small industries must form the main agenda of the Punjab government. A step ahead towards co-operative farming on the public lands can be of great help for generating income of the downtrodden people. The surplus from agriculture must be allocated among these people on priority basis. Incentives must be placed before the officers and the staff members for the effective accomplishment of beneficiary oriented programmes.
In Punjab, the agriculture subsists as the forerunner regarding employment, but, the allocation of investment together with its continuously declining share in GDP after economic reforms has retarded the position of scheduled castes in this state. It necessitates the government to emphasise the policies focusing the required investments in the agricultural sector to reinforce its relationship with the non-farm sectors of Punjab, that is, with the secondary and the tertiary sectors. This would boost up the growth in the primary sector without negotiating with the employment decrease.
The study points out the informalisation of labour among the scheduled castes in Punjab. The necessity arises for diversifying the occupations through escalating mobility among the labourers with regard to the more productive jobs. Education is the prerequisite for perking up the labour markets and trimming down the casualisation and informalisation of labour.REFERENCESBashir, S., Herath, J., & Gebremedhin, T. (2012). An empirical
analysis of higher education and economic growth in West Virginia. Seattle: Agricultural and Applied Economics Association Annual Meeting . Retrieved from http://ageconsearch.umn.edu/bitstream/124829/2/Bashir.pdf
Dunn, D. (1993). Inequality in education and employment in scheduled castes and tribes of India. Population Research and Policy Review, 12 (1), 53-70.
Dutta, S., & Sivaramakrishnan, L. (2013). Disparity in the literacy level among the scheduled and non-scheduled
stpopulation: Indian scenario in the 21 Century. Transitions Institute of Indian Geographers, 35 (2), 185-200.
Government of India. (2011). Census of India-2011. India: Office of Registrar General and Census Commissioner, Min is t ry o f Home Affa i r s . Re t r i eved f rom http://censusindia.gov.in/.
Government of India. (2011a). Report of the working group on employment, planning and policy for the twelfth five year plan (2012-2017). New Delhi: Labour, Employment and Manpower (LEM) Division, Planning Commission. R e t r i e v e d f r o m h t t p : / / p l a n n i n g c o m m i s s i o n . gov.in/aboutus/committee/wrkgrp12/wg_emp_planing.pdf
Government of India. (2011b). State primary census abstract-2011. India: Office of Registrar General and Census
Commissioner, Ministry of Home Affairs. Retrieved from http://www.censusindia.gov.in/2011census/hlo/pca/PCA_pdf/PCA-CRC-0300.pdf
Government of India. (2014). Report on fourth annual employment-unemployment survey. Volume I (2013-14). Chandigarh: Labour Bureau, Ministry of Labour and Employment. Retrieved from http://labourbureau. nic.in/Report%20%20Vol%201%20final.pdf
Government of Punjab. (2004). Punjab human development report 2004. Chandigarh: Government of Punjab. Retrieved from planningcommission.nic.in/plans/ stateplan/sdr_pdf/shdr_pun04.pdf
Government of Punjab. (2008). District human development report Hoshiarpur. Chandigarh: Population Research Cen t re , Pan jab Unive r s i ty. Re t r i eved f rom www.pbplanning.gov.in/HDR/DHDR_hoshiarpur_full.pdf
Government of Punjab. (2015). Scheduled castes sub plan 2013-14. Government of Punjab: Department of Welfare, Directorate of Scheduled Castes Sub Plan. Retrieved from http://welfarepunjab.gov.in/SCSP/archieves/SCHEDULED % 2 0 C A S T E S % 2 0 S U B % 2 0 P L A N % 2 0 2 0 1 3 -14%20ENGLISH.pdf
Govinda, R., & Biswal, K. (2005). Mapping literacy in India: Who are the illiterates and where do we find them? UNESCO: Background paper prepared for the 'Education for All Global Monitoring Report 2006- Literacy for Life. Retrieved from http://unesdoc.unesco.org/images/ 0014/001460/146016e.pdf
Institute for Human Development. (2014). India labour and employment report 2014: Workers in the era of globalisation. New Delhi: Academic Foundation and Institute of Human Development.
Kay, D.D. (2011). The Relationship between formal and informal employment in South Africa. (M.Sc. Thesis), Graduate College of the University of Illinois, Urbana-Champaign). Retrieved from https://www.ideals. illinois.edu/bitstream/handle/2142/24306/Kay_David
Mohanty, B.B. (2001). Land distribution among scheduled caste and tribes. Economic and Political Weekly, 36(40), 3857-3868.
Motkuri, V. (2013). Stagnant structure of workforce among scheduled tribes (STs) in Andhra Pradesh: A macro view. MPRA Paper No. 48558, Germany: Munich University Library.
Ram, R. (2004). Untouchability in India with a difference: Ad Dharam, Dalit Assertion and caste conflicts in Punjab. Asian Survey, 44(6), 895-912.
Rani, A. (2011). Poverty in Punjab: A district level study. (Ph.D. Dissertation, Guru Nanak Dev University, Amritsar). Retrieved from http://hdl.handle.net/10603/10225
Saravanakumar, S., & Palanisamy, M. (2013). Status of primary education of scheduled caste children. International Journal of Research in Humanities and Social Sciences, 1 (8), 54-61.
Sharma, N. (2012). Caste in Punjab: Political marginalisation and cultural assertion of scheduled castes in Punjab. Journal of Punjab Studies, 19 (1), 27-47.
Srivastava, A.K. (2014). Basics in education: Textbook for B.Ed. course. New Delhi: Publication Division, National Council of Educational Research and Training. Retrieved from http://www.ncert.nic.in/pdf_files/basic_in_education
Sundaram, K., & Tendulkar S. D. (2003). Poverty among social and economic groups in India in the 1990s. Economic and
432
Indian J Econ Dev 13(3): 2017 (July-September)

rRep
int
Political Weekly, 38 (50), 5263-5276.The European Union Labour Force Survey. (1996). Methods
and definitions. The European System of Accounts and EUROSTAT, Retrieved from https://stats.oecd.org/ glossary/detail.asp?ID=779
U.S. Department of Health and Human Sciences. (1988). Guidelines for reporting occupation and industry on death certificates. Hyattsville: Public Health Service, National Centre for Health Statistics. Retrieved from
https://www.cdc.gov/nchs/data/misc/hb_occup.pdfVarghese, N.V. (1988). Education-employment relations: A
case study of organised sectors in India. Occasional Paper No. 76, UNESCO: International Institute for Educational Planning. Retrieved from unesdoc.unesco.org/images /0008/000804/080445eo.pdf
Yadollahi, M., & Paim, L.H. (2010). Measurement of family economic status. Journal of American Sciences, 6 (11), 756-760.
433
Tiwana et al.: Education and employment situation in India: A case study of rural Punjab