journal of international economics - european central bank · journal of international economics...
TRANSCRIPT

Journal of International Economics 87 (2012) 134–146
Contents lists available at ScienceDirect
Journal of International Economics
j ourna l homepage: www.e lsev ie r.com/ locate / j i e
Firms and the global crisis: French exports in the turmoil☆
Jean-Charles Bricongne a, Lionel Fontagné c,a, Guillaume Gaulier a, Daria Taglioni b, Vincent Vicard a,⁎a Banque de France, Franceb World Bank, USA and European Central Bank, Germanyc Paris School of Economics (University Paris 1), France
☆ Thispaper represents the views of the authors anddoethe Banque de France, the World Bank Group or theacknowledge helpful comments from two anonymous refrom Nicolas Berman, Matthieu Bussière, Anne-Celia DiKrautheim, Thierry Mayer, Marc Melitz, Linda Tesar and pLaurent Cligny provided research assistance in the early s⁎ Corresponding author.
E-mail address: [email protected] (V.
0022-1996/$ – see front matter © 2011 Elsevier B.V. Adoi:10.1016/j.jinteco.2011.07.002
a b s t r a c t
a r t i c l e i n f oArticle history:Received 19 July 2010Received in revised form 5 July 2011Accepted 15 July 2011Available online 6 August 2011
JEL classification:F02F10G01
Keywords:Financial crisisCredit constraintsInternational trade collapseFirms' heterogeneityIntensive and extensive margins
Global trade contracted quickly and severely during the global crisis. This paper uses a unique dataset ofFrench firms tomatch export data to firm-level credit constraints and shows thatmost of the 2008–2009 tradecollapse was due to the unprecedented demand shock and to product characteristics. While all firms havebeen affected by the crisis, the effect on large firms has been mainly at the intensive margin and has resultedin a smaller portfolio of products being offered to export destinations. The effect on smaller exporters has beento reduce the range of destinations served or to stop exporting altogether. Credit constraints have been anadded aggravation for firms active in high financial dependence sectors. However, the share of creditconstrained firms is small and their number has not increased hugely during the crisis, with the result that theoverall impact of credit constraints on trade has been limited.
snot necessarily reflect those ofEuropean Central Bank. We
ferees, and helpful suggestionssdier, Jozef Konings, Sebastianarticipants in various seminars.tages of this research.
Vicard).
1 O'Rourke (2009)2 An exception is t
new cars.
ll rights reserved.
© 2011 Elsevier B.V. All rights reserved.
1. Introduction
In the last quarter of 2008 and the first quarter of 2009 tradecontracted in an exceptionally sudden, severe and globally synchro-nized fashion. This collapse was unparalleled in its suddenness: thedecline inworld trade reached 30% in just fourmonths, from September2008 to January 2009. It also seemingly was out of line with the declinein world GDP, which contracted by less than 3% over the same period.
Beyond the fall in demand and the limited resurgence ofprotectionism (Baldwin and Evenett, 2009), this sharp and dispro-portionate with GDP fall in trade has been attributed to two effects:first, a composition effect; second, financing difficulties and a shortageof liquidity linked to the intensification of the financial crisis.
In terms of the first effect, merchandize trade tends to be hit thehardest by demand shocks because it concerns mainly durable goodsand other postponable production (Eaton et al., 2009; Bénassy-Quéréet al., 2009; Levchenko et al., 2009). Exports are two to three timesmore volatile than GDP because a large fraction of trade is in durable
goods (Engel and Wang, 2008). In addition, in sectors that are highlydependent on global supply chains, goods are traded several timesbefore reaching the consumer (Tanaka, 2009; Yi, 2009). Therefore, thelarge drop in demand for internationally fragmented sectors explainssome of the unusually high discrepancy between the drop in overallactivity and the contraction in trade.1 Bems et al. (2010) apply aLeontief framework to a global bilateral input–output table, suggestingthat demand can account for 70% of the trade collapse if compositioneffects and fragmentation are taken into account. The rapid communi-cation among firms may explain the suddenness of inventoryadjustments (Alessandria et al., 2010) and why the downsizing oftrade was so synchronized and homogeneous worldwide (Baldwin,2009). In addition, recent fiscal stimulus packages have been orientedmostly toward non-tradeables such as construction and infrastructure.2
Given the financial origin of the crisis, financial constraints andliquidity shortages havealsobeen suggested tobedeterminants. Even innormal times,finance is particularly important for trade for at least threereasons. First, exporting entails importantfixed costs such as the costs oflearning about export market profitability, foreign distribution net-works, regulatory compliance, etc. Second, exporting is a more riskyactivity than domestic transactions only. Third, exporting involves
has posited a convincing numerical example.he fiscal incentives in several countries for domestic purchases of

4 While we consider all exporters located in France, whatever the nationality of theirownership, in the rest of the text we sometimes loosely describe our dataset as“French exporters”.
5 A detailed description of our dataset is available in Appendix A.6 While we use all the information collected by the French Customs, the data are
135J.-C. Bricongne et al. / Journal of International Economics 87 (2012) 134–146
longer lags between production and delivery, with median shipmenttimes of 2–3 months. Hence, exporters often need well functioningcredit lines tomaintain healthy cash flows. The introduction of financialfrictions in standard models of firm heterogeneity à la (Melitz, 2003)implies that entry costs, marginal costs and cut-off conditions becomemore restrictive. Churn and the associated reallocation ofmarket sharesfrom the least productive (and hence smaller) firms to the mostproductive exporters are higher in the presence of credit constraints(Manova, 2008). Additional financial constraints during episodes ofcrisis, might leave negative legacies for export performance (Auboin,2009). Using cross-country, cross-industry import data for the US, Chorand Manova (2010) show that the deterioration of money market ratesplayed a role in the recent trade collapse. According to Amiti andWeinstein (2009), the decrease in financing explains one-third of the1993 Japanese export collapse following the banking crisis. Moregenerally, cross-country evidence from 23 past banking crises suggeststhat export growth is particularly slow in sectors reliant on externalfinance (Iacovone and Zavacka, 2009). This view that trade financeplayed a role in the recent trade crisis is challenged, however, in the caseof US imports and exports (Levchenko et al., 2009) and also by thefindings from IMF/BAFT surveys. According to the latter, the availability oftrade finance was generally maintained over the course of the crisis,although the cost of trade credit increased and therewas a—potentially—long lasting shift toward structured trade finance (G20, 2010).
Micro-economic adjustments to large and temporary shocks arenot well understood. On the one hand, based on their size and/or lackof collateral and credit guarantees, smaller and less productive firmsmay be more affected by demand shocks and credit restrictions(Greenaway et al., 2007; Muuls, 2008), and firms operating in sectorsexhibiting structurally higher financial dependence are likely also tobe more sensitive to tighter credit conditions (Rajan and Zingales,1998). The result may be adjustments at the extensive margin. On theother hand, there are sunk costs to firms' entering foreign markets orexpanding their product ranges. Since for already active firmsentering and exiting are more time consuming than changing thescale of operations, firms confronted by an exogenous shock ofuncertain duration will likely prefer adjustments at the intensivemargin to a reorganizing or downsizing in the scale of their operations(Melitz and Ottaviano, 2007). Given the dominance of large firms intrade, in the aggregate, firms should respond to a demand shock firstat the intensive margin, then adjustments to the product, country andfirm extensive margins. Empirical evidence on the 1997 Asian crisissupports the intuition that a large part of the adjustment is at theintensive margin. Bernard et al. (2009) investigate the impact of theAsian crisis on individual US exporters and find that most of thedecline in US exports took place at the intensive margin.3
Our paper contributes to this debate by shedding light on the typeof adjustments that took place during the 2008–2009 trade collapse—mostly at the intensive margin. It assesses the relative importance, atfirm level, of the channels through which this trade collapsematerialized. It quantifies the joint effects of demand, compositionand financial constraints on the value of individual firms' exports,based on a unique database that combines firm trade data, brokendown by product and destination, with direct information on firm-level credit constraints and balance sheet data. To the best of ourknowledge, this is the first paper to address these issues usingconsistent and exhaustive information on individual firms' exportsand financial constraints before and throughout a trade crisis. Anotherimportant contribution is that we have access to monthly data, whichallow more precise assessment of the deployment of the trade crisis.
Our results are clear-cut. We do not observe a drastic reduction inthe number of French exporters. Most of the downsizing activitiestook place at the intensive margin of the top 1% of exporters. Small
3 Similarly, during the 1987–92 US export boom, most of the adjustments took placeat the intensive margin (Bernard and Jensen, 2004).
exporters tended to make adjustments at the product or destinationmargins, or exited export entirely. When we control for demand atsector and destination levels, we find that large and small firms areevenly impacted. Additional financial constraints during the crisisexacerbated the difficulties for financially constrained firms, but thiseffect was quantitatively quite small in the aggregate since only asmall number of firms were affected. As we do not rule out thepossibility of an overestimation of the credit channel, this impact maybe even smaller. These contrasting findings help to reconcile theopposing views in the literature regarding the respective roles ofdemand and financial constraints as determinants of the tradecollapse.
The rest of the paper is organized as follows. Section 2 discussesthe adjustment to the margins of trade in response to the shock, thesectoral, geographical, product and price dimensions of the tradecollapse and the distribution of losses across firms. Section 3 providesa firm level econometric investigation of the relative importance ofthe different channels of the trade collapse. Section 4 concludes andhighlights some implications of our results.
2. Crisis impact on individual firms — the facts
We exploit a dataset of individual exporters located in France.4
France is similar to several other countries in terms of its exportingbeing limited mainly to a very select club of “champions”, flanked by alarge number of marginal competitors exporting on an irregular basis(Mayer and Ottaviano, 2007). Some 1,000 individual exportersaccount for two-thirds of the annual exports of France, the 5th largestworld exporter.
Monthly exports by destination and product category, dataprovided by the French Customs, are observed for the period January2000 to April 2009. Our unit of observation is the value exported eachmonth by a French resident company, in each 8-digit CombinedNomenclature (CN-8 hereafter) sector to each export destination.5
These data provide two main advantages. First, they enableinvestigation of the dynamics of the exporter distribution based onthe whole universe of exporters.6 Second, they allow us to observetheir individual contributions to the value or diversity of exports inthe sector to which they belong.
2.1. A glance at the 2008–2009 collapse
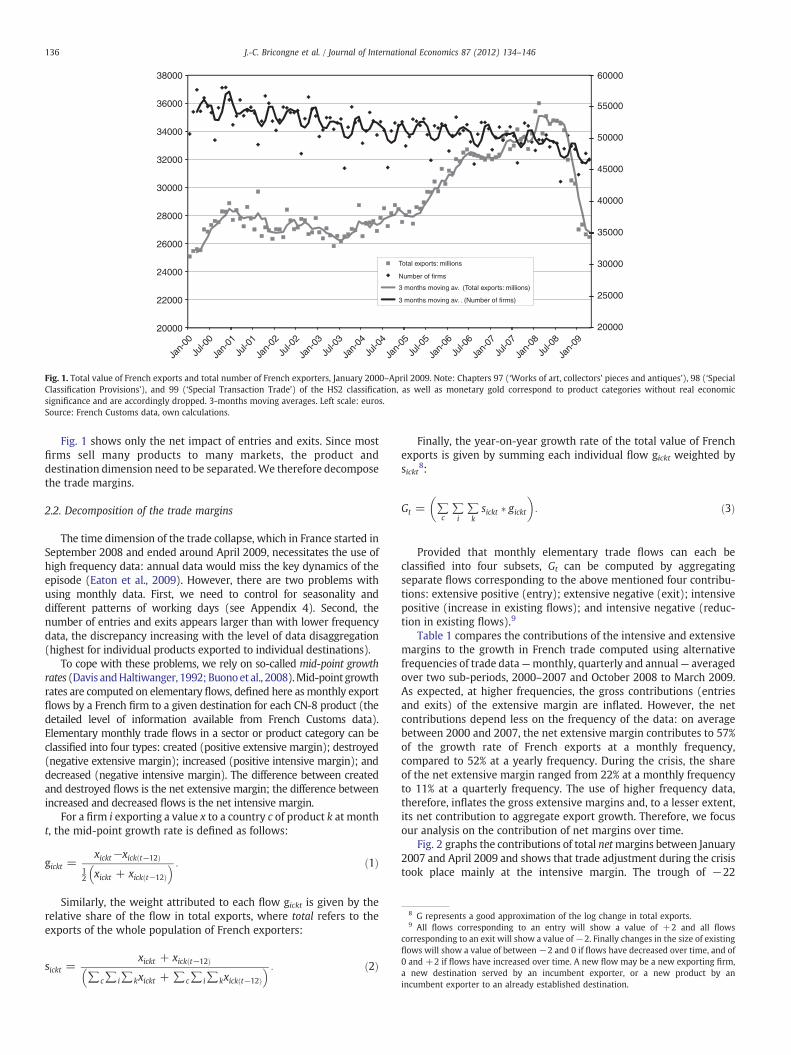
In the context of the recent crisis, a first glance at the data onFrench exporters seems to confirm the intuition from the theory thattotal trade responds initially to a shock by adjusting at the intensivemargin. Fig. 1 points to a steep decline in the value of total exportsafter September 2008. The number of French exporters, which wasdecreasing since 2000, appears to have contracted further during therecent crisis, from 50,458 units in October 2008 to 46,616 units inApril 2009. While seasonality and number of working days might bebiasing the results to a degree, overall we can say that some 3800firms ceased exporting, corresponding to 7% of the average number ofmonthly exporters over the ten-year period considered.7 Finally,comparison of the data series relative to total export values versusdata relating to the number of exporters suggests that most of theadjustment was at the intensive rather than the extensive margin.
subject to censoring of the smallest exporters: see Appendix A for further details.7 This figure may be overestimated since the value exported by some firms may
have fallen below the reporting thresholds during the crisis. See Appendix A for moreinformation on the threshold applying to the export reporting obligation.
35000
40000
45000
50000
55000
60000
28000
30000
32000
34000
36000
38000
20000
25000
30000
20000
22000
24000
26000
Total exports: millions
Number of firms
3 months moving av. . (Number of firms)
3 months moving av. (Total exports: millions)
Jan-
00
Jul-0
0
Jan-
01
Jul-0
1
Jan-
02
Jul-0
2
Jan-
03
Jul-0
3
Jan-
04
Jul-0
4
Jan-
05
Jul-0
5
Jan-
06
Jul-0
6
Jan-
07
Jul-0
7
Jan-
08
Jul-0
8
Jan-
09
Fig. 1. Total value of French exports and total number of French exporters, January 2000–April 2009. Note: Chapters 97 (‘Works of art, collectors' pieces and antiques’), 98 (‘SpecialClassification Provisions’), and 99 (‘Special Transaction Trade’) of the HS2 classification, as well as monetary gold correspond to product categories without real economicsignificance and are accordingly dropped. 3-months moving averages. Left scale: euros.Source: French Customs data, own calculations.
8 G represents a good approximation of the log change in total exports.9 All flows corresponding to an entry will show a value of +2 and all flows
corresponding to an exit will show a value of−2. Finally changes in the size of existingflows will show a value of between −2 and 0 if flows have decreased over time, and of0 and +2 if flows have increased over time. A new flow may be a new exporting firm,a new destination served by an incumbent exporter, or a new product by anincumbent exporter to an already established destination.
136 J.-C. Bricongne et al. / Journal of International Economics 87 (2012) 134–146
Fig. 1 shows only the net impact of entries and exits. Since mostfirms sell many products to many markets, the product anddestination dimension need to be separated.We therefore decomposethe trade margins.
2.2. Decomposition of the trade margins
The time dimension of the trade collapse, which in France started inSeptember 2008 and ended around April 2009, necessitates the use ofhigh frequency data: annual data would miss the key dynamics of theepisode (Eaton et al., 2009). However, there are two problems withusing monthly data. First, we need to control for seasonality anddifferent patterns of working days (see Appendix 4). Second, thenumber of entries and exits appears larger than with lower frequencydata, the discrepancy increasing with the level of data disaggregation(highest for individual products exported to individual destinations).
To cope with these problems, we rely on so-called mid-point growthrates (Davis andHaltiwanger, 1992; Buonoet al., 2008).Mid-point growthrates are computed on elementary flows, defined here asmonthly exportflows by a French firm to a given destination for each CN-8 product (thedetailed level of information available from French Customs data).Elementary monthly trade flows in a sector or product category can beclassified into four types: created (positive extensive margin); destroyed(negative extensive margin); increased (positive intensive margin); anddecreased (negative intensive margin). The difference between createdand destroyed flows is the net extensive margin; the difference betweenincreased and decreased flows is the net intensive margin.
For a firm i exporting a value x to a country c of product k at montht, the mid-point growth rate is defined as follows:
gickt =xickt−xick t−12ð Þ
12 xickt + xick t−12ð Þ� � : ð1Þ
Similarly, the weight attributed to each flow gickt is given by therelative share of the flow in total exports, where total refers to theexports of the whole population of French exporters:
sickt =xickt + xick t−12ð Þ
∑c∑i∑kxickt + ∑c∑i∑kxick t−12ð Þ� � : ð2Þ
Finally, the year-on-year growth rate of the total value of Frenchexports is given by summing each individual flow gickt weighted bysickt8:
Gt = ∑c∑i∑ksickt � gickt
� �: ð3Þ
Provided that monthly elementary trade flows can each beclassified into four subsets, Gt can be computed by aggregatingseparate flows corresponding to the above mentioned four contribu-tions: extensive positive (entry); extensive negative (exit); intensivepositive (increase in existing flows); and intensive negative (reduc-tion in existing flows).9
Table 1 compares the contributions of the intensive and extensivemargins to the growth in French trade computed using alternativefrequencies of trade data—monthly, quarterly and annual— averagedover two sub-periods, 2000–2007 and October 2008 to March 2009.As expected, at higher frequencies, the gross contributions (entriesand exits) of the extensive margin are inflated. However, the netcontributions depend less on the frequency of the data: on averagebetween 2000 and 2007, the net extensive margin contributes to 57%of the growth rate of French exports at a monthly frequency,compared to 52% at a yearly frequency. During the crisis, the shareof the net extensive margin ranged from 22% at a monthly frequencyto 11% at a quarterly frequency. The use of higher frequency data,therefore, inflates the gross extensive margins and, to a lesser extent,its net contribution to aggregate export growth. Therefore, we focusour analysis on the contribution of net margins over time.
Fig. 2 graphs the contributions of total netmargins between January2007 and April 2009 and shows that trade adjustment during the crisistook place mainly at the intensive margin. The trough of −22

Table 1Contributions to mid-point growth rates: monthly, quarterly and yearly data.
2000–2007 Oct 2008–March 2009
Month Quarter Year Month Quarter
Total entry 31.6 24.8 17.0 24.0 17.6Total exit −29.9 −23.2 −15.5 −27.7 −19.4Net extensive margin 1.7 1.6 1.5 −3.7 −1.8Intensive positive 20.6 20.7 20.4 17.3 16.6Intensive negative −19.4 −19.3 −19.0 −30.8 −31.9Net intensive margin 1.2 1.4 1.4 −13.5 −15.3Total 3.0 2.9 2.9 −17.1 −17.1
Source: French Customs data, own calculations.Note: Contributions in p.p. to the total growth rate in percent. Chapters 97 (‘Works ofart, collectors' pieces and antiques’), 98 (‘Special Classification Provisions’), and 99(‘Special Transaction Trade’) of the HS2 classification, as well as monetary gold, aredropped. Simple averages of contributions calculated for each year, with the exceptionof last row. Exporters are ranked according to the value of their exports within a sector.
137J.-C. Bricongne et al. / Journal of International Economics 87 (2012) 134–146
percentage points in the net intensive margin occurred in February2009.10
The contribution of the net extensive margin for firms, productsand destinations appears to be of second order importance. Table 2shows that the share of the net extensivemargin in the overall changein the value of exports was 21% during the crisis, compared to 58% innormal times (2000–07). This pattern holds for all components of theextensive margin: entry and exit of firms, products or destinations.Lastly, it appears that firms' patterns of expansion to new countrieshave been maintained, possibly because the entry costs had alreadybeen incurred.11
The uneven results at the margins suggest that we shouldinvestigate the impact of the crisis on firms of different sizes. Themargins are computed for four groups of firms ranked by the size oftheir sectoral exports: the smallest group includes the smaller 80% ofexporters, the next ranked 80–95% percentile, the next 95–99%percentile and the largest group includes 1% of exporters. In order toconstruct each group, we rank firms according to their HS 2-digitsector of activity and the total value of exports relative to the exportsof all other firms exporting in the same sector, for a given month.12
Turning to the results of our decomposition, the largest 1% ofexporters mostly explains the aggregate numbers — both before andduring the crisis (see Table 2) — reflecting the highly skeweddistribution of exports. During the trade collapse, 75% of the intensivemargin loss was absorbed by the largest 1% of exporters, whichaccounted for only 23% of the extensive margin. Large exportersabsorbed the shock mostly through the intensive margin (accountingfor 92% of their loss). Their contribution to the extensive margin wasmainly at product level. Smaller exporters, on the other hand,recorded more important losses at the extensive margin. For thebottom 80% of exporters, 76% of total losses in exports came from theextensive margin, 53 percentage points from the firm extensivemargin and 20 percentage points from the destination extensivemargin. Adjustments during the crisis contrast with the relativelymore proportionate contributions of each margin during the previousperiod of export expansion.
10 Our monthly frequency data potentially under-estimate the contribution of theintensive margin. The predominance of the intensive margin is confirmed in otherstudies of the trade crisis; see in particular Behrens et al. (2010) on Belgian firms.11 It is interesting that product churn reduced: a 37% reduction in the grosscontribution of product exits partially compensates for the decrease in the grosscontribution of product entries.12 An individual firm can belong to different quantiles in different sectors if it exportsin more than one HS 2-digit category. Our definition is consistent with the choice ofanalyzing the universe of French exporters. Any other definition of quantile aimed atmaintaining their population constant, would miss at least entry decisions.
Overall, these results show that large firms absorbed the largestpart of the 2008–2009 trade collapse, mainly at the intensive marginand by reducing their product portfolios. Nevertheless, small playerswere hurt by the crisis and many were forced to exit because theywere unable to adjust.
2.3. Further characterizations of the trade collapse: the sectoral,geographic and price dimensions
In order to characterize the channels through which the tradecollapse took place, we investigate whether, during the crisis period,sectoral and geographical specializations as well as price changeswere important determinants of the patterns of the trade collapse.Wecheck whether our findings differ for different sized firms.
Starting with the role of different geographic and sectoralspecializations across firms, we conduct a shift-share decomposition.We can compute this decomposition algebraically. However, there is adrawback to algebraic methods, which is the dependence of theresults on the ordering of the effects: first computing geographicaleffects and then sectoral effects yields a different result from doing thereverse. To overcome this problem and to evaluate the statisticalsignificance of the results, we use an econometric method that allowsus to capture the estimated parameters associated with sectoral andgeographical fixed effects.13 Specifically, we regress elementarygrowth rates (mid-point growth rates in our case) — weighted bysickt as defined above, i.e. exports at time t plus exports at time t−12divided by the sum of total exports (all exporters, sectors anddestinations) at times t and t−12 — for each period t on three sets ofdummy variables: country, sector, size-group. Marginal averages (i.e.the marginal impact of a given sector or destination or size) arecomputed from the estimated fixed effects and compared to theunconditional estimations.14 Decomposition of this variance showsthat sector effects contribute more during the crisis (36%) thanpreviously (29%). Country effects contribute 64% (71% beforeSeptember 2008) and size effects account for less than 1%. Overall,the three sets of effects account for 27% of total export growthvariance during the crisis (20% before the crisis).
Large and small exporters are similarly affected by the crisis if wecontrol for the geographical and sectoral orientations of exports. Largeexporters are disproportionately represented in adversely affectedsectors (e.g. the car industry) or in exports to markets hit heavily bythe crisis. Small firms are concentrated in destinations or sectorswhich were relatively less affected by the trade collapse, whichcushioned their losses. However, there is a difference between largeand small exporters related to the timing of events: the conditionalfigures suggest that the smallest exporters were hit earlier (starting inAugust 2008) than larger exporters, whose exports began to bedownsized in the last quarter of 2008. We can use the estimated fixedeffects to check to what extent particular destinations and productsare driving our results.
If we look at the geographical dimension of the trade collapse wesee that the geography of exports played aminor role, as confirmed byunusual synchronicity of the crisis at global level. The destinationsthat saw the highest reductions in exports are Europe (e.g. Spain,Portugal, United Kingdom) the United States and some important
13 This method was developed in work on regional economics to provide a statisticalbasis for the geographical structural analysis Jayet (1993); it was applied recently tointernational trade by Cheptea et al. (2005).14 The estimated fixed effects are computed as deviations from the world sampleaverage by normalizing the results. We use initial trade volumes as weights to redefinethe effects. Technically, the simple average of the estimated effects is subtracted fromeach effect, including omitted ones. Notice that this method generates identical resultsregardless of the effects omitted in the estimation procedure. This normalization isaimed solely at simplifying interpretation of the results and does not alter the finalresults in any way.

-0.1
-0.05
0
0.05
0.1
Net intensive
-0.25
-0.2
-0.15
Jan-07 Apr-07 Jul-07 Oct-07 Jan-08 Apr-08 Jul-08 Oct-08 Jan-09 Apr-09
Net ext firm
Net ext. Country
Net ext. Product
Fig. 2. Net margins' contributions to mid-point growth rates, French monthly exports (percent), January 2007–April 2009. Note: The net intensive margin is computed as the sum ofthe positive and negative intensive margin contributions; the net extensive margin is computed as the sum of entries and exits. Further details are provided in Section 2.2.Source: French Customs data, own calculations.
138 J.-C. Bricongne et al. / Journal of International Economics 87 (2012) 134–146
members of Factory Asia (Taiwan and China). There seems to be noclear pattern among the list of the least affected destinations (seeTable 3). Even a breakdown by financial development and remotenessdoes not reveal any noteworthy differences across countries.
Regarding the sectoral dimension, we classify the HS 2-digitcategories into broad sectors of activity: intermediate goods,consumption goods, automobiles, other transport, other equipment,
Table 2Contributions to mid-point growth rates, average 2006–2007 and average September2008–April 2009, French monthly exports.
Mean 2000/2007 Mean Sept. 2008/April 2009
Creditconstrainedfirms
0–80 99–100 Total 0–80 99–100 Total Total
Firm entry 1.3 1.8 6.4 1.0 1.2 4.7 5.3Firm exit −1.3 −1.5 −5.7 −1.3 −0.6 −4.7 −12.1Net firm 0.0 0.3 0.8 −0.2 0.6 0.0 −6.8Country entry 0.6 5.4 11.6 0.5 5.3 10.8 11.1Country exit −0.6 −5.0 −11.2 −0.6 −5.6 −12.5 −18.6Net Country 0.0 0.4 0.4 −0.1 −0.3 −1.8 −7.5Product entry 0.3 8.7 13.6 0.3 4.8 8.5 9.9Product exit −0.3 −8.2 −13.0 −0.3 −5.8 −10.1 −13.7Net Product 0.0 0.5 0.6 0.0 −1.1 −1.6 −3.8Net extensivemargin
0.0 1.2 1.7 −0.3 −0.8 −3.4 −18.1
Intensive positive 0.4 13.2 20.6 0.3 11.1 17.5 14.5Intensive negative −0.3 −12.6 −19.4 −0.4 −20.7 −30.2 −29.4Net intensivemargin
0.0 0.6 1.2 −0.1 −9.6 −12.7 −14.9
Total 0.0 1.8 3.0 −0.4 −10.4 −16.2 −33.0
Source: French Customs data, own calculations.Note: Contributions in p.p. to the total growth rate in percent. Chapters 97 (‘Works ofart, collectors' pieces and antiques’), 98 (‘Special Classification Provisions’), and 99(‘Special Transaction Trade’) of the HS2 classification, as well as monetary gold, aredropped. Margins are calculated as the weighted averages of the individual firms'contributions to the intensive and extensive margins. Exporters are ranked andassigned to each quantile group based on the value of their exports within a sector. Eachfirst column comprises exporters in the 0–80 percentiles, each second column thelargest 1% exporters. In the interests of simplicity, contributions for exporters in the 80–95 and 95–99 percentiles are not shown.
plus a residual grouping. We find that 11 out of the 15 most adverselyaffected sectors are classified as intermediate goods (see Table 4), andthat consumption goods dominate the least affected sectors.15 If weaggregate sectors across broad categories, we find that more than onethird of the deterioration is attributable to intermediate goods. Thismay be explained in part by the nominal changes linked to thebursting of the commodity price bubble: see below for a discussion.“Other equipment” and “automobiles” contribute a quarter and a fifthrespectively to overall trade developments.
Lastly, if we decompose value flows into quantities and unit valuesthis gives an idea of the role played by price adjustments in the period.We compute average price changes for total exports and vis-à-visindividual trade partners, using weighted averages of the elementaryprice changes.16
We decompose each elementary flow i as follows:
dln valueð Þi;t = t−12 = dln quantityð Þi;t = t−12 + dlnvalue
quantity
� �i;t = t−12
: ð4Þ
We then aggregate elementary changes similar to a Tornqvist priceindex, using the following formula:
∑i
wit dln valueð Þi;t = t−12 = ∑i
wit dln quantityð Þi;t = t−12
+ ∑i
wit dlnvalue
quantity
� �i;t = t−12
ð5Þ
where theweight factorwit is given by half the share of a flow over thetotal value of French exports in the two reference periods, i.e.
wit =12
valuei;t∑i valuei;t
+valuei;t−12
∑i valuei;t−12
!: ð6Þ
15 The only consumption goods that show up in this “top-15”, i.e. those in thecategory of “carpets and other textile floor coverings”, are mainly used as inputs in theconstruction sector. Some intermediates are among the least affected sectors, but oftenare inputs in non-durable consumer goods production.16 We follow common practice (despite its shortcomings) and use changes in unitvalues as proxies for changes in prices (Schott, 2004).

Table 3Most and least harmed destinations of French exports during the trade collapse.
Ranking Country Share in French exports, percent f.e.a
Most harmed destinations1 Taiwan 0.46 −0.272 Chile 0.15 −0.213 Ukraine 0.23 −0.164 Spain 9.32 −0.165 Argentina 0.23 −0.126 China 2.30 −0.097 Portugal 1.23 −0.098 United Kingdom 8.08 −0.079 Slovenia 0.31 −0.0610 United States of America 6.78 −0.0611 Poland 1.61 −0.0612 Turkey 1.40 −0.0513 Denmark 0.72 −0.0414 Romania 0.63 −0.0415 Czech Republic 0.85 −0.03
Least harmed destinations35 Thailand 0.25 0.0536 Finland 0.52 0.0737 Tunisia 0.81 0.0738 Brazil 0.78 0.0739 Cote d'Ivoire 0.18 0.0740 Canada 0.86 0.0841 Russian Federation 1.44 0.0842 Malaysia 0.36 0.0843 Israel 0.30 0.0944 Mexico 0.47 0.0945 Switzerland 2.81 0.1446 Australia 0.70 0.1647 Egypt 0.30 0.1648 Morocco 0.90 0.1649 Nigeria 0.30 0.1850 Algeria 1.10 0.36
Source: French Customs data, and own calculations.Note: Only the 50most popular destinations of French exports are reported in the Table.
a Normalized fixed effects (weighted average equals 0).
Table 4Most and least adversely affected sectors during the trade collapse.
Most harmed sectors
Ranking Sector HS-2code
Broadcategory
f.e.a
1 Lead and articles thereof. 78 interm −0.512 Copper and articles thereof. 74 interm −0.413 Ores, slag and ash. 26 interm −0.294 Vehicles o/t railw/tramw
roll-stock, pts; accessories.87 autom −0.27
5 Zinc and articles thereof. 79 interm −0.266 Nickel and articles thereof. 75 interm −0.247 Arms and ammunition.
parts and accessories thereof.93 other eqt −0.22
8 Ships, boats and floating structures. 89 other transp −0.199 Other vegetable textile fibers.
paper yarn; woven fab53 interm −0.19
10 Carpets and other textilefloor coverings.
57 cons −0.17
11 Iron and steel. 72 interm −0.1612 Raw hides and skins
(other than furskins) and leather.41 interm −0.16
13 Pulp of wood/of otherfibrous cellulosic mat. waste etc.
47 interm −0.15
14 Man-made staple fibers. 55 interm −0.1515 Man-made filaments. 54 interm −0.14
Least harmed sectors
Ranking Sector HScode
Broadcategory
f.e.a
81 Prod mill indust. malt. starches.inulin. wheat gluten
11 interm 0.16
82 Headgear and parts thereof. 65 cons 0.1683 Toys, games; sports requisites.
parts; access thereof95 cons 0.16
84 Cocoa and cocoa preparations. 18 cons 0.1885 Miscellaneous edible preparations. 21 cons 0.2086 Railw/tramw locom, rolling-stock;
parts thereof. etc.86 other transp 0.20
87 Articles of leather. saddlery/harness. travel goods etc.
42 cons 0.20
88 Meat and edible meat offal. 2 cons 0.2189 Pharmaceutical products. 30 cons 0.2390 Residues; waste from the food
indust. prepr ani fodder23 interm 0.25
91 Products of animal origin,nes or included.
5 interm 0.26
92 Prepr feathers; down. arti flower.articles human hair
67 misc 0.29
93 Live animals. 1 interm 0.3094 Fertilizers. 31 interm 0.3495 Coffee, tea, mat and spices. 9 cons 0.37
Source: French Customs data, and own calculations.Note: HS 2-digit sectors. “interm”stands for intermediate products; “cons”for
139J.-C. Bricongne et al. / Journal of International Economics 87 (2012) 134–146
We can now perform separate shift-share analyses for quantitiesand unit-value changes.17 Our results indicate that the contraction inexports for a number of commodities wasmainly the result of changesin unit values.18 This notwithstanding, in aggregate, the reduction inthe volumes exported accounts for most of the collapse, with only aminor impact of price changes (Table 5).19
The breakdown of unit value changes by destination reveals thatpricing to market strategies played a role. We find a positive 58%correlation between changes in euro-denominated prices (fixedeffects from the shift-share analysis) and bilateral exchange ratechanges: pass-through is incomplete.20
consumption goods, “other eqt”for other equipment and “other transp”for othertransport material.
a Normalized fixed effects (weighted average equals 0).
2.4. Evidence for financially constrained firmsWe identify financially constrained firms by exploiting thedatabase used by Aghion et al. (2010). Since 1992, French bankshave been legally obliged to report to the Système Interbancaire de
17 Important caveats to our analysis include that it is based exclusively on theintensive margin (continuous flows), and that we exclude all elementary flowswithout quantity reported (intra-EU trade flows for firms exporting overall less than460,000 euros per year to the other 26 members of the EU). We believe that neither ofthese restrictions biases the data: we show in Section 2 that the intensive margindominated the dynamics of trade during the crisis, and the threshold for intra-EU tradereporting is sufficiently low to be of second order importance.18 The sectors where contraction was driven by price changes include copper, lead,nickel, zinc, wood pulp and other vegetable textile fibers.19 The price index for French exports was 1.4% higher in April 2009 than in April2008. It was nearly unchanged compared to April 2007 (−0.1%).20 We consider here the 50 top destinations for French exporters.
Télécompensation, within four business days, any incident of a firmfailing to pay its creditors. These defaults on credits are called PaymentIncidents. The Banque de France collects this information and makes itavailable weekly on paper or via the Internet to all commercial banksand other credit institutions. The Banque de France allows free access tothe full histories of payment incidents for the previous 12 months.21
Payment incidents can be regarded as a generator of credit constraints;failure to pay or a payment incident during the previous yearwill have a
21 This service has the sole purpose of providing to banks and other creditinstitutions information on their customers, to enable them to adapt their supply ofcredit to this information. We eliminate from the sample payment incidents recordedfor technical reasons (mainly missing details related to bank account or issuer) or dueto contested claims.

Table 5Most and least adversely affected sectors: price and quantity decomposition.
Ranking Sector HS2 code Broad cat dlv dlq dlp
Most adversely affected sectors1 Furskin and artificial fur. manufactures thereof. 43 cons −0.30 −0.37 0.062 Vehicles o/t railw/tramw roll-stock, pts and accessories 87 autom −0.36 −0.35 −0.013 Lead and articles thereof. 78 interm −0.84 −0.27 −0.564 Ores, slag and ash. 26 interm −0.31 −0.23 −0.085 Machinery and mech appliance. parts, nuclear reactors, boilers 84 other eqt −0.17 −0.21 0.046 Iron and steel. 72 interm −0.22 −0.20 −0.027 Arms and ammunition. parts and accessories thereof. 93 other eqt −0.29 −0.18 −0.118 Railw/tramw locom, rolling-stock and parts thereof. etc. 86 other transp −0.52 −0.17 −0.359 Footwear, gaiters and the like. parts of such articles. 64 cons −0.09 −0.17 0.0810 Ships, boats and floating structures. 89 other transp −0.23 −0.16 −0.0611 Man-made staple fibers. 55 interm −0.16 −0.16 0.0012 Tin and articles thereof. 80 interm −0.15 −0.14 −0.0113 Special woven fab. tufted tex fab. lace. tapestries etc. 58 cons −0.05 −0.13 0.0814 Rubber and articles thereof. 40 interm −0.08 −0.13 0.0515 Man-made filaments. 54 interm −0.16 −0.13 −0.03
Least adversely affected sectors81 Coffee, tea, mate and spices. 9 cons 0.23 0.21 0.0382 Printed books, newspapers, pictures and other product etc. 49 cons 0.22 0.21 0.0083 Meat and edible meat offal. 2 cons 0.23 0.22 0.0184 Pharmaceutical products. 30 cons 0.27 0.22 0.0585 Optical, photo, cinema, meas, checking, precision, etc. 90 other eqt 0.21 0.22 −0.0186 Aircraft, spacecraft, and parts thereof. 88 other transp 0.28 0.22 0.0687 Musical instruments. parts and access of such articles 92 cons 0.19 0.23 −0.0488 Art of apparel and clothing access, knitted or crocheted. 61 cons 0.21 0.24 −0.0389 Pulp of wood/of other fibrous cellulosic mat. waste etc. 47 interm −0.12 0.24 −0.3690 Toys, games and sports requisites. parts and access thereof 95 cons 0.27 0.25 0.0291 Cereals. 10 interm 0.08 0.25 −0.1792 Cork and articles of cork. 45 interm 0.27 0.28 −0.0193 Articles of leather. saddlery/harness. travel goods etc. 42 cons 0.31 0.30 0.0094 Live animals. 1 interm 0.48 0.50 −0.0295 Umbrellas, walking-sticks, seat-sticks, whips, etc. 66 misc 0.37 0.64 −0.27
Source: French Customs data, own calculations.Note: dlv = average change in value between t and t−12; dlq = average change in quantity between t and t−12; dlp = average change in unit value between t and t−12;dlv=dlq+dlp. Average effects are computed as discussed in Eqs. (4)–(6). Normalized fixed effects (weighted average equals 0). Ranking of the sectors based on quantity impact.
140 J.-C. Bricongne et al. / Journal of International Economics 87 (2012) 134–146
negative and significant impact on the amount of any new bank loan. Itwill adversely affect the probability of contracting a new loan and thesize of a new loan (Aghion et al., 2010).
The number and share of exporters that experienced at least onepayment incident in the preceding 12 months are relatively stableover the period: on average, 2855 exporters experienced at least onepayment incident between January 2008 and April 2009. The figuresare respectively 2943 during the crisis period (September 2008 toApril 2009) and 2766 between January and August 2008 (versus 3003in 2007). The share of monthly exporters hit by payment incidentsslightly increased: 4.8% of French exporters during the January–April2009 period compared to 4.3% and 4.7% respectively over the sameperiods in 2008 and 2007. The distribution by size of firms of apayment incident shows a higher number for the smallest players. OurGroup 1 shows a ratio of 5.1% of firms affected in 2009 compared to4.0%, 3.1% and 2.0% respectively for groups 2–4. The figures are similarfor 2007 and 2008. The mean proportion of firms affected by paymentincidents in our sample shows no clear sectoral pattern, and thedispersion is limited as shown in the last column of Table 8 in theAppendix: 70% of sectors show a ratio of 4% to 5%. The outliers areCereals, Gums, Organic chemicals, Pharmaceutical products, Fertilizers,Ammunition (2%) and Ships (8%).
The decomposition of the margins for the sub-sample of financiallyconstrained Frenchexporters points to a limited increase in the negativecontribution of the intensive margin, compared to the whole sample ofFrench exporters (−14.9% compared to−12.7%, see the last column inTable 2). At the extensivemargin, however, the negative contribution islarge: i.e. −18.1% compared to −3.4%. The difference is explainedmostly by firm exits (−6.8% compared to 0.0%) and by destination-country exits (−7.5% compared to−1.8%).
We can conclude, therefore, that both product and firm-specificfeatures mattered during the trade collapse. In Section 3, we willexploit a dataset that matches individual firm exports with informationon financial constraints and pre-crisis balance sheet data. Thiswill allowus to quantify the relative contributions of the various determinants ofthe export collapse. Beyonddemand and composition effects,we expectthe impact of being financially constrained to affect mainly those firmsin sectors that rely heavily on external finance.
3. The role of financial constraints in the failure of theexport engine
The analysis in Section 2 indicates that demand, product and firmcharacteristics were all important in shaping the contraction in trade.This outcome is consistent with the story that the trade collapse wasthe result of a major fall in demand worldwide, compounded bycomposition and value chain effects, the elements that contribute toexplaining sectoral heterogeneity. In addition, based on the financialorigins of the crisis, it is likely that financial constraints played asignificant role.
3.1. Estimation strategy
Wewant to examinewhetherfinancial constraintswere a source ofheterogeneity in how French exporters adjusted to the crisis. First weneed to look at the measurement of the financial constraints faced byindividual exporters during the crisis. As already explained, weidentifyfinancially constrainedfirms using data on payment incidents,which provide us with a time-varying indicator of credit constraints.Payment incidents generated credit constraints due to their negative

141J.-C. Bricongne et al. / Journal of International Economics 87 (2012) 134–146
impact on the number of newbank loans (Aghion et al., 2010). This is adifferent measure from the firm-specific measure used by Minetti andZhu (2011) based on the responses to a survey (conducted in 2001)which asked firms whether the amount of credit they had obtainedwas less than they had originally requested at themarket interest rate.Based on this definition offinancial constraint, 4.4% of Italian exporterswere financially constrained and the value of their exports wasreduced by 38%. Our measure is exhaustive and not based on surveydata; it refers to the signal sent by defaulting firms to their lenders, notthe actual constraint on lending.Nevertheless, the orders ofmagnitudein terms of constrained firms are similar in each approach.
Although payment incidents have been shown to generate creditconstraint, this measure is not free of potential endogeneity bias. Italso may capture some exporters that were experiencing difficultiesand which failed because of a negative shock or low levels ofcompetitiveness, which rendered them no longer able either to exportor sell in the domestic market. The causality from financial constraintto export performance may be questionable, therefore. However, apayment incident does not necessarily reflect severe distress; it is anindication that payments were late. It is therefore very important thatour estimation strategy should include controls for the individualcharacteristics of the exporters, including potential distress. All ourestimations compare the impact of financial constraints on exportperformance before and during the crisis (i.e. before and afterSeptember 2008) using a difference-in-difference strategy: anyadditional impact due to the firm registering a payment incident, orsignaling distress other than the greater financial constraint thataccompanied the crisis, is thus controlled for. We check also whetherthese additional impacts are affecting all firms equally or firmsbelonging to those sectors that are the most dependent on externalfinance.
We also perform a series of robustness tests. First we focus on asubgroup of firms for which we have information on individualcharacteristics (net assets, productivity, dependence on externalfinance, cost of debt, leverage ratio) and interact these characteristicswith the crisis dummy. As an alternative, for the largest sample ofexporters, we rely on individual fixed effects in a double differenceestimation strategy. We restrict our sample to firms that faced afinancial constraint before and during the crisis so that we identifyonly the impact of financial constraints during the crisis on withinfirm variations over time. Thus, all unobserved characteristics —
including distress — are controlled for before and after the crisis.Finally, we control for the financial structure, or more precisely, theownership of the firm.
Still, such strategy does not fully rule out a reverse causality storywhereby an idiosyncratic negative demand shock may lead to anincident of payment to creditors for the exporter. To be more precise,our control variables (firm fixed effects) cannot fully control for suchan outcome since the negative demand shock for a firm's exports canbe time varying. Yet, the mentioned shortcoming in our estimationstrategy does not weaken our finding of limited impact of the creditchannel since it can only lead to an overestimation of the impact of thecredit channel on exports.
In Section 2, the mid-point growth rate was calculated for eachfirm at product level (CN 8), the most fine grained informationavailable from the French Customs database. In the econometricanalysis, we aggregate the product dimension of the data in sectors.Thus, we cumulate all products exported within a sector, at firm level,by destination. This categorization eliminates noise and makes thedataset more manageable; it also takes into account that the currentcrisis appears to have had a distinctive sectoral dimension.
3.2. Specification
Our baseline equation estimates exports growth over the period2008 M1 to 2009 M4 by means of ordinary least squares (OLS), the
choice of subperiod being constrained by computational capacitylimits.
gickt = α � dln importð Þckt + β � PIit+ γ � PIit � crisis + uct + vkt + ε
ð7Þ
Our dependent variable, the mid-point growth rate of firm i exportshas three dimensions: time t, HS2 sector k and destination c. It iscomputed on flows in value. We observe the export performance of105,310 firms that exported at least once during the period (recall thatgrowth rates are computed also for entries and exits).
A first determinant of the change in exports is the demand forimports in the sector, and each firm's destination markets. Wecompute this demand as sectoral ‘net’ imports in each destinationmarket, where French exports are subtracted from the destination'stotal imports. This procedure allows us to avoid endogeneityproblems. Data provided by the International Trade Centre (ITC)records monthly imports up to 2009 M4 for a subset of 52 countries,which, however, represent about 84% of the value of French exports.Based on these figures, this variable is able to control for the well-documented 2008–2009 contraction in global demand and, to someextent, reflects the extremely skewed sectoral dimension of the crisis.
A second determinant is the overall impact of the crisis,notwithstanding the demand and sectoral issues referred to above.Indeed, the general climate of uncertainty and its impact on businessconfidence, shortage of liquidity and more restricted access to thefinancing of business activities in some regions of the world, may haveexacerbated the contraction in both activity and trade, beyonddemand developments. To control for this we create a dummyvariable that takes the value 1 from 2008 M9 onwards.
In addition to investigating the determinants of export perfor-mance, this paper aims also to investigate the impact of financialconstraints. Our time-varying variable of credit constraints PaymentIncidents (PI thereafter) is defined in Section 2 and discussed in Sub-section 2.1. It is coded as a dummy variable that is equal to 1 if the firmexperienced at least one payment incident in the preceding12 months.
Country-time and HS2-time fixed effects act as sectoral deflators,controlling for any time-varying country and sectoral determinants,including the exchange rate and any sector specific shocks and also, toan extent, composition effects or sectoral differences in internation-ally fragmented production.
3.3. Results of the baseline estimations
The results of the baseline specification are reported in Table 6,columns (1) to (4). Experiencing a payment incident in the previous12 months has a significant negative impact on firm exports in normaltimes. In the period of the crisis, this negative impact was heightenedby 2 percentage points. This figure should be assessed against thebackground of a 17% year-on-year average drop in firm exports duringthe crisis. These results are relatively stable across estimations andalso robust to the inclusion of different control variables.
The literature on the link between financial dependence and firmperformance indicates that there is a sectoral dimension to thefinancial dependence of a firm: in general, the production functiondetermines the type of financial needs that dominate in a sector(Rajan and Zingales, 1998). Thus, it is likely that in good times a welldeveloped financial sector can be the source of comparativeadvantage in financially constrained sectors and in times of turmoil,this advantage will be reversed due to the shortage of credit. Tocontrol for the sectoral dimension, we construct an index of financialdependence for HS 2-digit industries similar to that in Rajan andZingales (1998). Thus, our index of external financial dependence isequal to 1 minus the ratio of the mean of internal financing over themean gross fixed capital formation over the period 2003–2007 for

Table 6Microeconomic determinants of the trade collapse.
(1) (2) (3)RZbmed.
(4)RZNmed.
(5)Weighted
dln(import) 0.065 0.065 0.072 0.050 0.285(0.004) (0.004) (0.006) (0.006) (0.002)
Incident of payment −0.269 −0.258 −0.260 −0.253 −0.097(0.004) (0.005) (0.007) (0.009) (0.002)
Crisis ∗ incidentof payment
−0.021 0.007 −0.074 −0.078(0.007) (0.009) (0.013) (0.005)
Obs. 6,154,401 6,154,401 4,185,385 1,969,016 6,154,401R2 0.01 0.01 0.01 0.01 0.08Nbr. firms 105,310 105,310 79,538 49,452 105,310Time*sector f.e. Yes Yes Yes Yes YesTime*country f.e. Yes Yes Yes Yes Yes
Source: French Customs data, own calculations.Note: Standard errors into parentheses. Intercept not reported.
142 J.-C. Bricongne et al. / Journal of International Economics 87 (2012) 134–146
each firm in the dataset.22 Data are taken from the FiBEn databaseconstructed by the Banque de France, which contains information onboth flow and stock accounting variables for a large sample of Frenchfirms, and is based on fiscal documents, balance sheets and profit andloss statements.23 We obtain the aggregation at the HS 2-digit sectorby computing the median value across firms. As the technologicalneeds of sectors are slow to evolve, we can assume that they are time-invariant over the period of estimation. The inclusion of sector-timefixed effects (on a monthly basis) allows us to control for sectoralvolatility over the cycle. An innovation of our paper with respect tothe related literature is that we calculate our indices of financialdependence based on a dataset of the firms included in our data-sample. We use this indicator to carry out separate regressions forsectors whose index of external financial dependence is below themedian, and for sectors whose index is above the median. The resultsfor the regression on sectors below themedian are reported in Table 6,column (3); those for sectors above the median are presented inTable 6, column (4). The additional negative effect of the crisis oncredit constrained firms seems to be driven entirely by developmentsin the sectors dependent on external finance. The differential impactin different sectors confirms also that our measure of credit constraintis not picking firms in distress.
Estimations weighted by the size of the firm's exports suggest aweaker effect of the PI variable in normal times, and a stronger effectduring the crisis (column (5)). A possible reason for this is that largerfirms are less affected by payment incidents in normal times whenbank credit is not constrained, while small firms are alwaysconstrained, regardless of the banks' loan policies.
3.4. Robustness checks
In this section, we present our robustness analysis related to thepotential endogeneity of the payment incident variable. First weenrich the baseline equation to control for a range of classic firm-leveldeterminants of export performance, including size (net assets),productivity (value added per employee), and a set of three variablesproviding measures of the financial dependence of the firm. To do so,we rely on a restricted sample of exporters for which individualcharacteristics are observable. We observe the dependence onexternal finance (internal financing over gross fixed capital forma-
22 We restrict our sample to firms that report data for at least 3 years during theperiod. We allocate each firm to its main HS2 sector and take the median value at thesector (HS2) level, keeping only sectors in which more than 30 firms report.23 The database contains accounting and financial data on all French companies witha turnover of at least 75,000 euros per year or with credit outstanding of at least38,000 euros (see http://www.banque-france.fr/gb/instit/services/page2.htm). Annualaccounting data are available for about 200,000 firms. These include almost 50% ofexporters recorded by the French Customs database over the period 2007 M1–2009 M4 and about 80% of the firms with 20 to 500 employees.
tion), the cost of debt (financial charges over value added) and theleverage ratio (debt over own funds). All the RHS firm-level variables,with the exception of Payment Incidents, are taken from the FiBEndatabase. Second, we retain the whole sample of exporters andcontrol for unobservable characteristics with individual fixed effects.
We first control (column (6) in Table 7) for firm heterogeneity insize (net assets) and productivity. We derive a sample of 45,822exporters out of a total sample of 105,310 firms exporting at least oncebetween January 2008 and April 2009. As expected, firms of differentsizes seem to be differently constrained by credit restrictions. Column(7) also includes the dependence on external finance (internalfinancing over gross fixed capital formation), cost of debt (financialcharges over value added) and leverage ratio (debt over own funds).We restrict our sample to 38,888 firms. The inclusion of theseadditional firm level controls reduces the magnitude of the coefficientof payment incident, but not the additional significant impact thatoccurs during the crisis.
Column (8) in Table 7 shows the firm fixed effects to control for theunobservable individual characteristics of 95,756 firms. Compared toTable 6, here we retain only those firms that were observed twice asexporters in a sector between January 2008 and April 2009. Firmsexiting in January 2008 or entering in April 2009 are no longerincluded in the estimation. Unobserved characteristics of firmsexperiencing a payment incident may reduce the average growth ofexports, but do not bias our estimates since we adopt a doubledifference estimation strategy.
Column (9), Table 7, shows the impact of credit constraints duringthe crisis only on the within firm variation. We therefore compare theexport performance of a given firm, before and after the crisis, ratherthan comparing credit constrained and unconstrained firms duringthe crisis, as above. The treated group is now firms that had a paymentincident before September 2008 and which survived during the crisis.This restricts our sample to 75,819 firms. The control group excludesfirms appearing after August 2008. The results confirm that exportingby financially constrained firms decreased more during the crisiscompared to exporting by the same group of firms before the crisis.
The results in column (10) refer to another type of robustness test:data are consolidated by ownership, so that all French-based firmsbelonging to the same proprietary group are clustered together. Moreprecisely, the trade flows from French-based subsidiaries areconsolidated in one observation and the Payment Incident variable isaveraged using exports as weights.
These robustness checks are in line with our initial results andovercome many of the shortcomings in our measure of financialconstraint. Experiencing a payment incident during the previous12 months reduces individual export performance under all circum-stances. During the 2008–2009 crisis, the impact of financialconstraints was heightened, in particular when controlling forunobserved characteristics of the firm. The robustness tests clearlyindicate that also during the crisis, demand continued to be the keydriver of exports. Furthermore, since a reverse causality betweendemand and the credit channel cannot be ruled out, the effect of creditconstraints relative to demand might be even less important thanestimated. Such outcome would reinforce our argument of asecondary role of financial constraints in explaining the trade collapse.
3.5. Do financial constraints affect exports specifically?
Having established that financial constraints mattered for indi-vidual firms during the crisis, we next want to examine whether theycaused exports to fall more than output. Since 80% to 90% ofinternational trade “involves some form of credit, insurance orguarantee” (Auboin, 2009), a shortage of trade finance specifically,would impact international trade over and above domestic output andsales. Since exhaustive data on domestic output, sales or employmentare not available on an intra-annual basis for French firms, we cannot

Table 7Microeconomic determinants of the trade collapse: robustness.
(6) (7) (8) Firm f.e. (9) Within (10) Group (11) Firm-HS2 f.e.
dln(import) 0.061 0.059 0.059 0.066 0.067 0.061(0.005) (0.005) (0.004) (0.004) (0.004) (0.004)
Incident of payment −0.076 −0.083 −0.041 −0.181 −0.272 −0.073(0.007) (0.007) (0.008) (0.008) (0.006) (0.020)
Crisis * incident of payment −0.043 −0.019 −0.107 −0.083 −0.033 −0.132(0.009) (0.010) (0.008) (0.011) (0.008) (0.026)
ln(net assets) −0.002 −0.004(0.001) (0.001)
Crisis * ln(net assets) 0.001 0.003(0.001) (0.001)
ln(VA/nbr employees) 0.023 0.024(0.002) (0.002)
Crisis * ln(VA/nbr employees) 0.002 −0.002(0.002) (0.002)
Internal financing/investment 0.000(0.000)
Crisis * int.financing/inv. 0.000(0.000)
Financial charges/VA −0.022(0.009)
Crisis *financial charges/VA 0.054(0.013)
Leverage ratio −0.001(0.001)
Crisis * leverage ratio −0.003(0.001)
Incident of payment*distance 0.018(0.021)
Crisis * incident of payment*distance −0.007(0.030)
Incident of payment*credit/GDP 0.040(0.021)
Crisis * incident of payment*credit/GDP 0.024(0.028)
Incident of payment*eurozone 0.003(0.013)
Crisis * incident of payment*eurozone −0.001(0.017)
Obs. 4,593,495 4,155,614 6,144,847 5,955,245 5,509,445 5,700,608R2 0.01 0.01 0.118407 0.01 0.01 0.16Nbr. firms 45,822 38,888 95,756 75,819 91,759 53,982Time*sector f.e. Yes Yes Yes Yes Yes YesTime*country f.e. Yes Yes Yes Yes Yes Yes
Source: French Customs data, own calculations.Note: Standard errors into parentheses. Intercept not reported. All financial variables are computed from FIBEn/Centrale des Bilans, Banque de France.
143J.-C. Bricongne et al. / Journal of International Economics 87 (2012) 134–146
directly test for an over-reaction of exports to domestic sales at firmlevel. However, an alternative way to identify a specific impact oftrade finance on exports is to focus on the impact of credit constrainton different destination markets for an individual exporter.
Recent theoretical models suggest several country characteristicsthat would influence the response of exports to a shortage of tradefinance.24 Exporters and importers can appeal to different forms oftrade finance — open account, cash in advance, or letter of credit —depending on the characteristics of the source and destinationcountries which will influence the risks and financing costs(Schmidt-Eisenlohr, 2010; Ahn, 2010). The time between productionand delivery magnifies the negative impact of financing costs on tradeflows, implying that credit constrained firms would reducemore theirexports to more distant destinations (Schmidt-Eisenlohr, 2010).Feenstra et al. (2011) however shows that when firms borrowworking capital and banks cannot observe whether firms use theirloans to finance production for domestic sales or exports, creditconstrained exporters would reduce their sales evenly acrossdestinations. To test this potential link between freight time andcredit constraints, we use the financial development of the destina-tion market (credit over GDP) as a proxy for financing costs, and the
24 Unlike Amiti and Weinstein (2009), “trade finance” covers all credits linked tointernational trade, whether a financial intermediary intervenes or not.
bilateral geographical distance as a proxy for time between produc-tion and delivery.We define dummies for destination over themedianof credit/GDP and distance and we control for a possible eurozoneeffect. These three determinants are interacted with the paymentincident and the crisis dummies, while controlling for firm-sectorfixed effects.
The results in Table 7 column (11) suggest that credit constraintsaffect exporters unevenly across destinations in normal times. Wefind that credit constraints cause bigger reductions in exports todestinations with larger financing costs, i.e. low credit/GDP ratio.However, this impact was not magnified during the crisis.25 But, asshown above, financial constraints played a specific role in thosesectors that were highly dependent on external finance. Our resultsare in line with recent empirical findings using different methodol-ogies. Paravisini et al. (2011) find that the elasticity of Peruvianexports to credit during the crisis does not vary with distance to thedestination market, using matched firm-credit data and identifyingcredit constraint through the differential impact of capital flowreversal on different banks during the crisis. Our results are alsoconsistent with the proportional drop in domestic sales and exportsfound by Behrens et al. (2010) for Belgian exporters.
25 Notice that distance interacted with incident of payment plays a significant role inneither normal times nor in crises.

144 J.-C. Bricongne et al. / Journal of International Economics 87 (2012) 134–146
3.6. Quantification
After showing that both supply and demand factors mattered, inthe final step of our analysis we quantify the weight of financialconstraints on aggregate exports, and for the subset of financiallyconstrained firms. In Section 3.3 we observed that financiallyconstrained exporters (exporters that experienced a paymentincident in the previous 12 months) faced a non-trivial cost in termsof exports, a cost that was heightened during the trade crisis. Thiseffect is explained totally by developments in sectors highlydependent on external finance. However, demand developments arethe main driver of export developments. Hence, it is not clear how ourestimates translate into the aggregate patterns.
In order to shed light on these issues, we compute the predictedmidpoint growth rate twice, including and excluding the additionalfinancial constraints during the crisis for the whole population ofexporters, and also for the sub-sample of financially constrainedexporters (Fig. 3). Even if other determinants of export performance(demand and export composition) dominate, credit constraintsduring the crisis significantly reduced exports for financially con-strained firms: about 20% of the drop in exports by financiallyconstrained firms can be explained by the variable Payment Incidents.However, in aggregate the impact is limited. Such conclusion isreinforced by a possible reverse causality which may lead tooverestimated coefficients on the credit channel.
Overall, our results help to reconcile the opposite views in theliterature regarding the determinants of the trade collapse. Financialconstraints are a significant determinant of exports, but the effect ofthe additional constraints faced during the crisis, if any, was small: thenumber of firms hit by these constraints was similarly small and thedrop in demandmight be echoed in payment incidents. Also the effectwas concentrated in those sectors relying heavily on external finance.Accordingly, the demand channel, including the related compositioneffects, played a big role during the crisis. These findings are in linewith those in Eaton et al. (2009) and can be reconciled with findingsshowing an important role for credit constraints such as Chor andManova (2010) and Amiti and Weinstein (2009). In particular, ourresults on the significance of financial constraints for financiallyconstrained firms (20% of the predicted mid-point growth rate) arequalitatively similar to those found by Amiti andWeinstein (2009) forJapanese firms in the 1990s. Amiti and Weinstein find a 33%contribution, but not accompanied by a concurrent major contraction
0,2
0,1
0
-0,1
-0,2
-0,3
-0,4
-0,5
-0,6Jan-08 Apr-08 Jul-08
All: financial constraints exclud.
All
Sample of financially constr. firms: financial constraints exclud.
Sample of financially constr. firms
Fig. 3. Predictedmidpoint growth rate for financially constrained firms versus all firms. Note:exclud.” show the predicted mid-point growth rates where additional financial constraintsbars “All” show the predicted mid-point growth rates given the actual financial constraintsfirms: financial constraints exclud.” show the predicted mid-point growth rates where afinancially constr. firms” show the predicted mid-point growth rates given the actual finan
in demand worldwide. One important implication of the results fromour quantification exercise is that, in the context of the 2008–2009crisis, financial constraints hardly account for the portion of aggregatetrade contraction that traditional macro and trade models are unableto explain.
4. Conclusion
Our paper addressed the question of whether firm characteristicsprevailed over other determinants, including demand and productcharacteristics, in the 2008–2009 trade collapse. Using a uniquedataset of French firms matching export data and financial con-straints, we find that both products and firm characteristics mattered.Most of the 2008–2009 trade collapse can be attributed to theunprecedented demand shock and product characteristics. Thecontribution of the net intensive margin of the top 1% exportersexplains three-fifths of the drop in French exports during the crisis.Smaller exporters were forced to reduce the range of destinationsserved or cease exporting. Credit constraints emerge as an aggravatingfactor. Credit constrained firms are defined as those firms thatexperienced a payment incident in the previous 12 months. Althoughother determinants of export performance dominated (namely,demand and export composition), credit constraints during the crisissignificantly worsened the export positions of financially constrainedfirms, accounting for about 20% of the drop in exports of these firms.However, as the share of these firms is small and their number did notincrease much during the crisis the overall impact of credit constraintson trade was limited. Due to possible reverse causality, such limitedimpact is clearly an upper bound of the effect of the credit channel.
An important implication of the results of our quantificationexercise is that, in the context of the 2008–2009 crisis, financialconstraints hardly account for the portion of aggregate tradecontraction that traditional macro and trade models are unable toexplain.
We controlled for many dimensions of the trade collapse episodein our analysis. We accounted and controlled for concurrentimportant factors, including composition effects and exchange ratechanges, by the inclusion in our estimations of import demand atsectoral level on destination markets, sector and country fixed effects,and by carrying out relevant decompositions of the margins ofadjustment. We controlled also for firm ownership, consolidating databy group. We developed methods to work with high frequency data,
Oct-08 Jan-09 Apr-09
computed from specification (5) in Table 6. The light gray bars “All: financial constraintsduring the crisis equal to zero for the whole sample of French exporters. The dark grayfor the whole sample of French exporters. The diamonds “Sample of financially constr.dditional financial constraints during the crisis equal to zero. The circles “Sample ofcial constraints for this sub-group of French exporters.

145J.-C. Bricongne et al. / Journal of International Economics 87 (2012) 134–146
discussing potential biases arising from their use and comparingresults with the results for annual data where applicable. We haveprovided direct evidence on firms' financial constraints and theirvariation over the crisis period.
There are avenues for further work using firm level data. Firstly,matching techniques could provide information about what distin-guishes firms that thrived in adversity from other firms in the sample.This would require a dedicated analysis. Secondly, the magnificationeffect of value chains referred to in many papers, is deserving of in-depth, stand-alone analysis. This is beyond the scope of the currentpaper and requires input–output tables at firm level; we have thisinformation only at the sectoral level. Thirdly, addressing whetherdomestic sales were less badly affected than exports would shed lighton the specificities of exporting activity.
Appendix A. Description of firm level export data
We rely on individual firm exports recorded monthly by theFrench Customs. The period covered is 2000 M1 to 2009 M4. Weexclude from the data the items belonging to HS2 Chapter 97 (‘Worksof art, collectors' pieces and antiques’), 98 (‘Special ClassificationProvisions’), and 99 (‘Special Transaction Trade’) as well as monetarygold. Each exporter is identified by a unique official identificationnumber (SIREN). Each exporter ships its products in one or moreproduct categories defined at the Combined Nomenclature 8-digitlevel, comprising some 10,000 different categories. Each category ofproduct exported by a given firm can be shipped to more than onemarket. Accordingly, the most fined grained information available inthe French Customs database is the value exported each month by aFrench resident firm in a CN8 category to each destination country.From a simple statistical point of view, the resulting four-dimensionaldata point is defined as an elementary flow. On average, 629,000elementary flows were recorded monthly over the period 2005 M1 to2009 M4. Changes in trade flows over time may originate fromchanges in any of the following: number of exporters, number ofproducts, destination markets served and value shipped per eachelementary flow. In our analysis, we use the above level of detail inSection 2. By contrast, in the econometric analysis in Section 3, weaggregate the product dimension of the data in HS 2-digit sectors. Thus,our dependent variable comprises export flows, where each data pointcorresponds to the value of exports in all the exported productscategorized under CN 8-digit categories belonging to the same HS 2-digit sector by eachFrenchexporter to eachdestination country. Inotherwords, we cumulate all products exported within a sector at the firmlevel, by destination.26 Consolidating, at the firm-level, the additionalinformation on the product dimension in the sectoral information helpsto evaluate the results. As well as eliminating noise from the data andmaking the dataset more manageable, this categorization takes intoaccount that the current crisis appears to have had a distinctive sectoraldimension, as stylized facts from aggregate data suggest (strongesteffect on durable goods, financial dependence of firms clearly followinga sectoral dimension, etc.).
It should be remembered that our dataset is subject to somelimitations linked to data-censoring. While we use all the informationcollected by the French Customs, the exports' reporting obligationapplies only if a firm exports above a legal threshold. Morespecifically, two different size thresholds apply, one for extra-EUtrade and one for intra-EU trade. For exports to non-EU countries,firms have an obligation to declare their exports if the yearlycumulated value of their exports is 1000 euros or more. For exportsto other EU Member states, the declaration is compulsory if the yearly
26 A firm can appear several times in the database, if it exports CN8 productsbelonging to more than one HS2 sector. Note however that, each time, only its exportsrelative to the relevant sector are taken into account.
cumulated value of exports to the other 26 EU Member states takentogether is larger than 150,000 euros. These size thresholds may biasnegatively the extensive margin, since small firms are more subject toextensive margin adjustments (see findings in Section 2). Usingmonthly data, however, it is unclear how this issue could be tackledeffectively. Moreover we are interested in changes over time, and notin absolute figures. Hence we consider this issue of second orderimportance.
Finally, it should be noted that there is considerable seasonality inour dataset and the number of working days is an importantdeterminant of monthly exports. We deseasonalize the data byapplying the coefficient of adjustment used by the French Customs tobroad categories of products, and focus on year-on-year variations,which means that month m of year t is compared to the same monthof year t−1.27
References
Aghion, P., P. Askenazy, N. Berman, G. Cette, and L. Eymard (2010). Credit constraintsand the cyclicality of R&D investment: evidence from France. Journal of theEuropean Economic Association Forthcoming.
Ahn, J. (2010). A theory of domestic and international trade finance. Mimeo ColumbiaUniversity.
Alessandria, G., J. Kaboski, and V. Midrigan (2010). The great trade collapse of 2008–09:an inventory adjustment. Mimeo.
Amiti, M., Weinstein, D., 2009. Exports and financial shocks. Working Paper 15556.National Bureau of Economic Research.
Auboin, M., 2009. Trade Finance: G20 and Follow-up. VoxEU.org, 5 June 2009.Baldwin, R., 2009. The Great Trade Collapse: What Caused It and What Does It Mean.
Centre for Economic Policy Research and VoxEu.org, London.Baldwin, R., Evenett, S., 2009. The collapse of global trade, murky protectionism, and the
crisis. Recommendations for the G20. Centre for Economic Policy Research andVoxEu.org, London.
Behrens, K., Corcos, G., Mion, G., 2010. Trade crisis? What trade crisis?.Bems, R., Johnson, R., Yi, K.-M., 2010. Demand spillovers and the collapse of trade in the
global recession. IMF Working Paper WP/10/142, International Monetary Fund.Bénassy-Quéré, A., Decreux, Y., Fontagné, L., Khoudour-Casteras, D., 2009. Economic
crisis and global supply chains. Working Paper 15, CEPII.Bernard, A., Jensen, B., Redding, S., Schott, P., 2009. The margins of U.S. trade (long
version). Working Paper 14662. National Bureau of Economic Research.Bernard, A.B., Jensen, J.B., 2004. Entry, expansion, and intensity in the US export boom,
1987–1992. Review of International Economics 12 (4), 662–675.Buono, I., Fadinger, H., Berger, S., 2008. Themicro dynamics of exporting: evidence from
French firms. MPRA Paper 12940. University Library of Munich, Germany.Cheptea, A., Gaulier, G., Zignago, S., 2005.World trade competitiveness: a disaggregated
view by shift-share analysis. Working Paper 23. CEPII.Chor, D., Manova, K., 2010. On the cliff and back? Credit conditions and international
trade during the global financial crisis. Technical Report, NBER Working Paper16174.
Davis, S.J., Haltiwanger, J.C., 1992. Gross job creation, gross job destruction, andemployment reallocation. Quarterly Journal of Economics 107 (3), 819–863.
Eaton, J., S. Kortum, B. Neiman, and J. Romalis (2009). Trade and the global recession.Mimeo.
Engel, C., Wang, J., 2008. International trade in durable goods: understanding volatility,cyclicity, and elasticities. NBER Working Papers 13814. National Bureau ofEconomic Research, Inc. February.
Feenstra, R.C., Li, Z., Yu, M., 2011. Exports and credit constraints under incompleteinformation: theory and evidence from China. Technical Report, NBER WorkingPapers 16940.
G20, 2010. G20 trade finance experts group April report: Canada–Korea chair'srecommendations for finance ministers. Technical Report, G20.
Greenaway, D., Guariglia, A., Kneller, R., 2007. Financial factors and exporting decisions.Journal of International Economics 73 (2), 377–395.
Iacovone, L., Zavacka, V., 2009. Banking crises and exports: lessons from the past. PolicyResearch Working Paper Series 5016. The World Bank.
Jayet, H., 1993. Analyse spatiale quantitative: une introduction. Economica, Paris.Levchenko, A., Lewis, L., Tesar, L., 2009. The collapse of international trade during the
2008–2009 crisis: in search of the smoking gun. Working Paper 952, ResearchSeminar in International Economics. University of Michigan.
Manova, K., 2008. Credit constraints, heterogeneous firms and international trade.NBER Working Paper, p. 14531.
Mayer, T., Ottaviano, G., 2007. The Happy Few: The Internationalisation of EuropeanFirms, Technical Report. Bruegel Blueprint.
Melitz, M., 2003. The impact of trade on intra-industry reallocations and aggregateindustry productivity. Econometrica 71 (6), 1695–1725.
27 See the French Customs website for more detail on the above mentionedcoefficients of adjustment (http://www.douane.gouv.fr/).

146 J.-C. Bricongne et al. / Journal of International Economics 87 (2012) 134–146
Melitz, M., Ottaviano, G., 2007. Market size, trade, and productivity. The Review ofEconomic Studies 75(1) (01), 295–316.
Minetti, R., Zhu, S.C., 2011. Credit constraints and firm export: microeconomic evidencefrom Italy. Journal of International Economics 83, 109–125.
Muuls, M., 2008. Exporters and credit constraints. a firm level approach. Research Series2008-09-22. National Bank of Belgium.
O'Rourke, K., 2009. Collapsing Trade in Barbie World. The Irish Economy.Paravisini, D., V. Rappoport, P. Schnabl, and D. Wolfenzon (2011). Dissecting the effect
of credit supply on trade: evidence from matched credit-export data. Mimeo, May.Rajan, R., Zingales, L., 1998. Financial dependence and growth. The American Economic
Review 88 (3), 559–586.
Schmidt-Eisenlohr, T., 2010. Towards a theory of trade finance. Working Papers 1023.Oxford University Centre for Business Taxation.
Schott, P., 2004. Across-product versus within-product specialization in internationaltrade. Quarterly Journal of Economics 119 (2), 647–678.
Tanaka, K., 2009. Trade Collapse and Vertical Foreign Direct Investment. VoxEU.org, 7thMay.
Yi, K.-M., 2009. The Collapse of Global Trade: The Role of Vertical Specialization. In:Baldwin, R., Evenett, S. (Eds.), The collapse of global trade, murky protectionism,and the crisis: Recommendations for the G20, Chapter 9. Centre for Economic PolicyResearch and VoxEu.org, pp. 45–48.