india technology product m&a industry monitor - an ispirt & signalhill report
TRANSCRIPT

India Technology Product M&AIndustry Monitor
November 2016

2
Executive Summary
Fundraising environment for technology product companies1 has seen a major slowdown after the 2014 & 2015 boom
After nearly $4.8bn and $6.2bn raised in 2014 & 2015, Tech Product PE/VC funding in Q1-Q3’16 has come down to $2.4bn
Growth-stage crunch driving slower VC/PE activity, which in turn has been driven by a sharp decline in hedge fund deals
M&A activity saw an uptick in 2014 & 2015 including a sharp surge for smaller deals (sub $5m) in 2015
M&A activity saw a surge in 2015 with deal value of ~$1.35bn (up 70% over 2014) across 137 deals (up 130% over 2014)
Nearly 80% of the deals during 2014 – Q3’16 were <$5m driven mainly by acqui-hires & restructuring
7 large deals (>$100m) also took place during this time period including 2 landmark cross-border transactions
For a healthy technology product ecosystem, further acceleration in later stage M&A and buyouts is required
The long-tail in tech product M&A in India kicks in very early with many deals below $5m and a steep drop thereafter
Both from an M&A and a PE buyout perspective, the India ecosystem is still relatively nascent and far behind the US
As companies mature and scale, the future offers brighter M&A and IPO prospects
Secondary transactions have already picked up; Macro and fundamental factors bode well long-term for the India story
(1) Note: The scope of this report covers fundraising and M&A activity of IP-driven companies with a significant product component across both consumer and enterprise tech, but excludes IT services companies
3
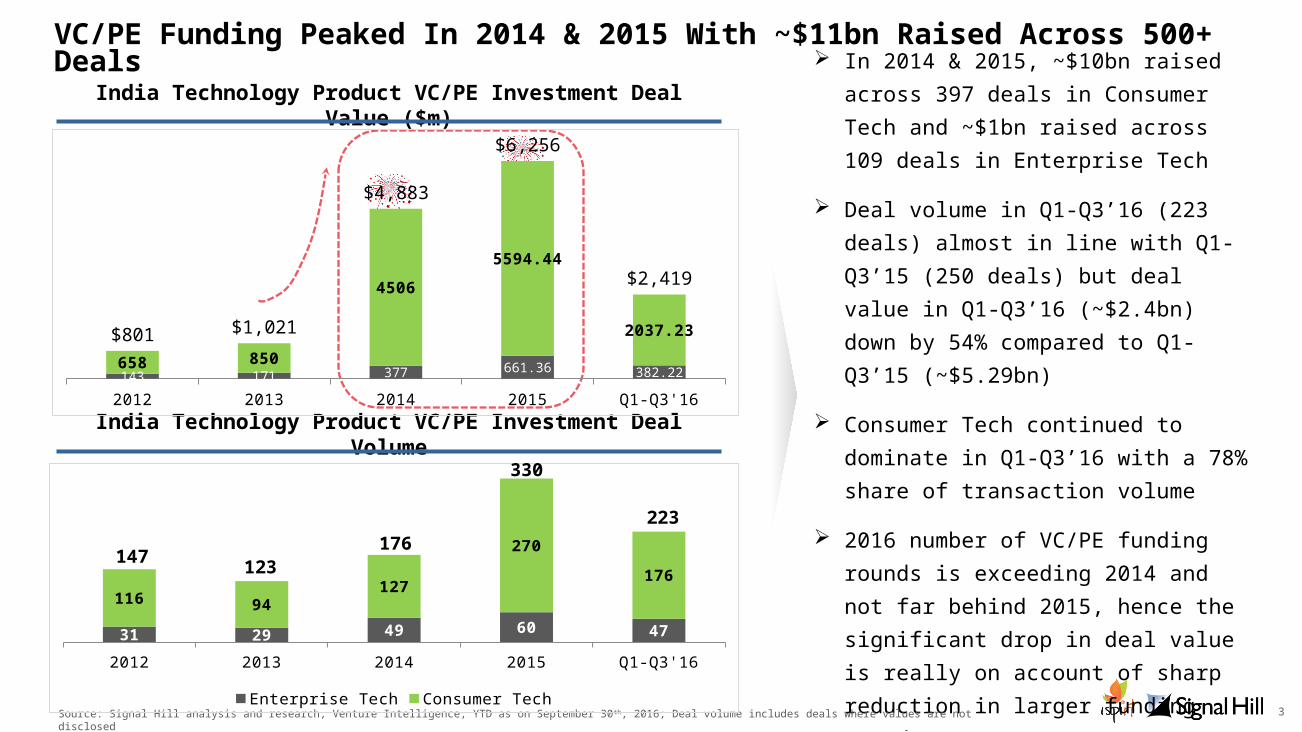
VC/PE Funding Peaked In 2014 & 2015 With ~$11bn Raised Across 500+ Deals
In 2014 & 2015, ~$10bn raised across 397 deals in Consumer Tech and ~$1bn raised across 109 deals in Enterprise Tech
Deal volume in Q1-Q3’16 (223 deals) almost in line with Q1-Q3’15 (250 deals) but deal value in Q1-Q3’16 (~$2.4bn) down by 54% compared to Q1-Q3’15 (~$5.29bn)
Consumer Tech continued to dominate in Q1-Q3’16 with a 78% share of transaction volume
2016 number of VC/PE funding rounds is exceeding 2014 and not far behind 2015, hence the significant drop in deal value is really on account of sharp reduction in larger funding roundsSource: Signal Hill analysis and research, Venture Intelligence, YTD as on September 30 th, 2016; Deal volume includes deals where values are not disclosed
India Technology Product VC/PE Investment Deal Value ($m)
India Technology Product VC/PE Investment Deal Volume
2012 2013 2014 2015 Q1-Q3'16143 171 377 661.36 382.22658 850
45065594.44
2037.23$801 $1,021
$4,883
$6,256
$2,419
2012 2013 2014 2015 Q1-Q3'1631 29 49 60 47
116 94127
270176
147 123 176
330
223
Enterprise Tech Consumer Tech
4
Q1'15 Q2'15 Q3'15 Q4'15 Q1'16 Q2'16 Q3'16
665 1150
2691
890 750 235959
164
$986$1,267
$2,855
$900 $793$380
$1,133
Enterprise Tech Consumer Tech
Q1'15 Q2'15 Q3'15 Q4'15 Q1'16 Q2'16 Q3'16
43 4456 58 55 55
3933 37 37
22 18 21
35
<$5m >=$5m
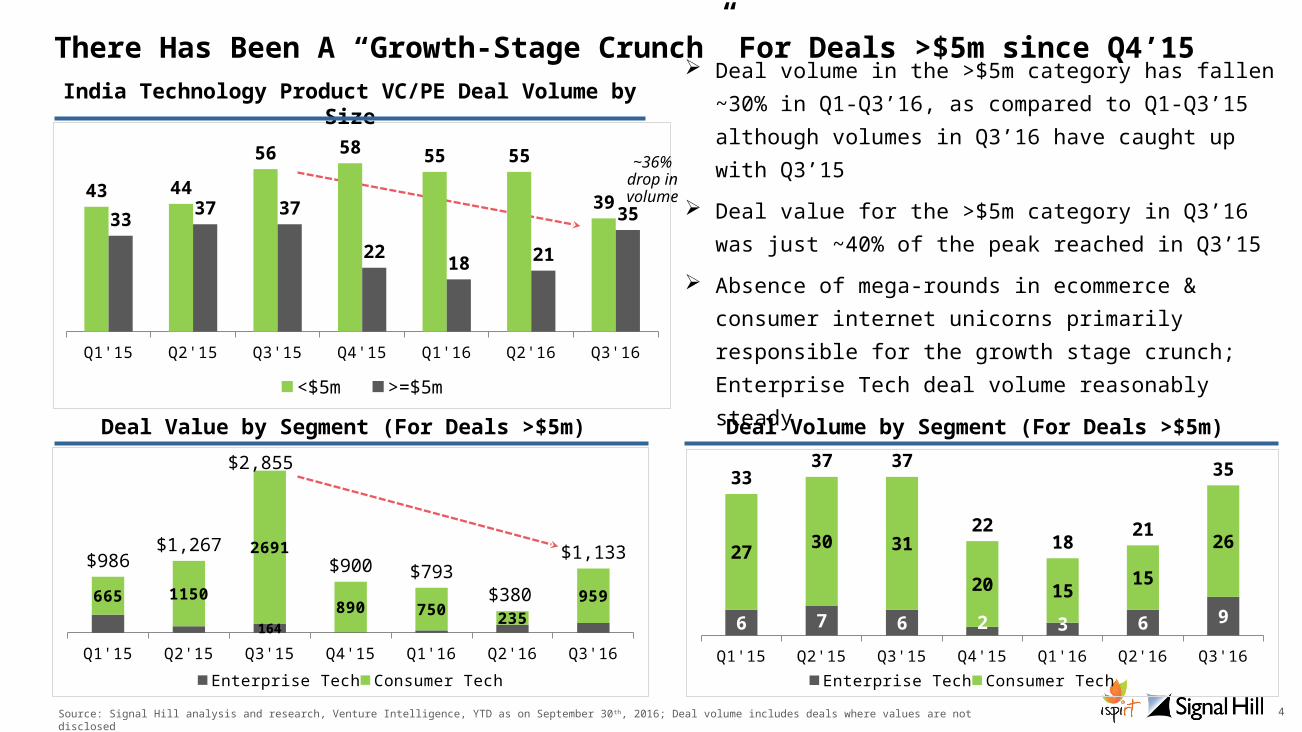
Deal volume in the >$5m category has fallen ~30% in Q1-Q3’16, as compared to Q1-Q3’15 although volumes in Q3’16 have caught up with Q3’15
Deal value for the >$5m category in Q3’16 was just ~40% of the peak reached in Q3’15
Absence of mega-rounds in ecommerce & consumer internet unicorns primarily responsible for the growth stage crunch; Enterprise Tech deal volume reasonably steady
India Technology Product VC/PE Deal Volume by Size
Deal Value by Segment (For Deals >$5m) Deal Volume by Segment (For Deals >$5m)
Source: Signal Hill analysis and research, Venture Intelligence, YTD as on September 30 th, 2016; Deal volume includes deals where values are not disclosed
~36% drop in volume
Q1'15 Q2'15 Q3'15 Q4'15 Q1'16 Q2'16 Q3'166 7 6 2 3 6 9
27 30 31
20 15 1526
3337 37
2218 21
35
Enterprise Tech Consumer Tech
There Has Been A “Growth-Stage Crunch” For Deals >$5m since Q4’15

5
Q1'15 Q2'15 Q3'15 Q4'15 Q1'16 Q2'16 Q3'16
9 7 83 1 1
54
7
1 3 2
1411
15
4 4 3 2
Tiger Global Other Hedge
Q1'15 Q2'15 Q3'15 Q4'15 Q1'16 Q2'16 Q3'16
19088
922535
175318.
837
475730
1759
569
130 62225
Disappearance Of Hedge Funds Largely Driving Drop in Deal Activity…
Hedge fund participation in funding reached its peak in Q3’15 when hedge funds collectively were responsible for ~$1.8bn in deal value (60% of total deal value in that quarter)
Hedge fund deal-making has fallen off a cliff in 2016 with an 86% decline in overall deal value in Q1-Q3’16 compared to the same period last year
Tiger Global, which led the charge in 2014 & 2015, has pulled back almost completely so far in 2016, with just 3 deals ($305m) in Q1-Q3’16 vs 24 deals ($1.8bn) in the same period last year
India Technology Product Deal Value by Hedge Fund Type ($m)
India Technology Product Deal Volume by Hedge Fund Type
Source: Signal Hill analysis and research, Venture Intelligence, YTD as on September 30 th, 2016; Deal volume includes deals where values are not disclosed
~87% drop in value
~87% drop in volume
6
Fund Q1-Q3 ’15
Q1-Q3’16
3 02 02 01 21 1
96%
4%
Consumer Tech Enterprise Tech
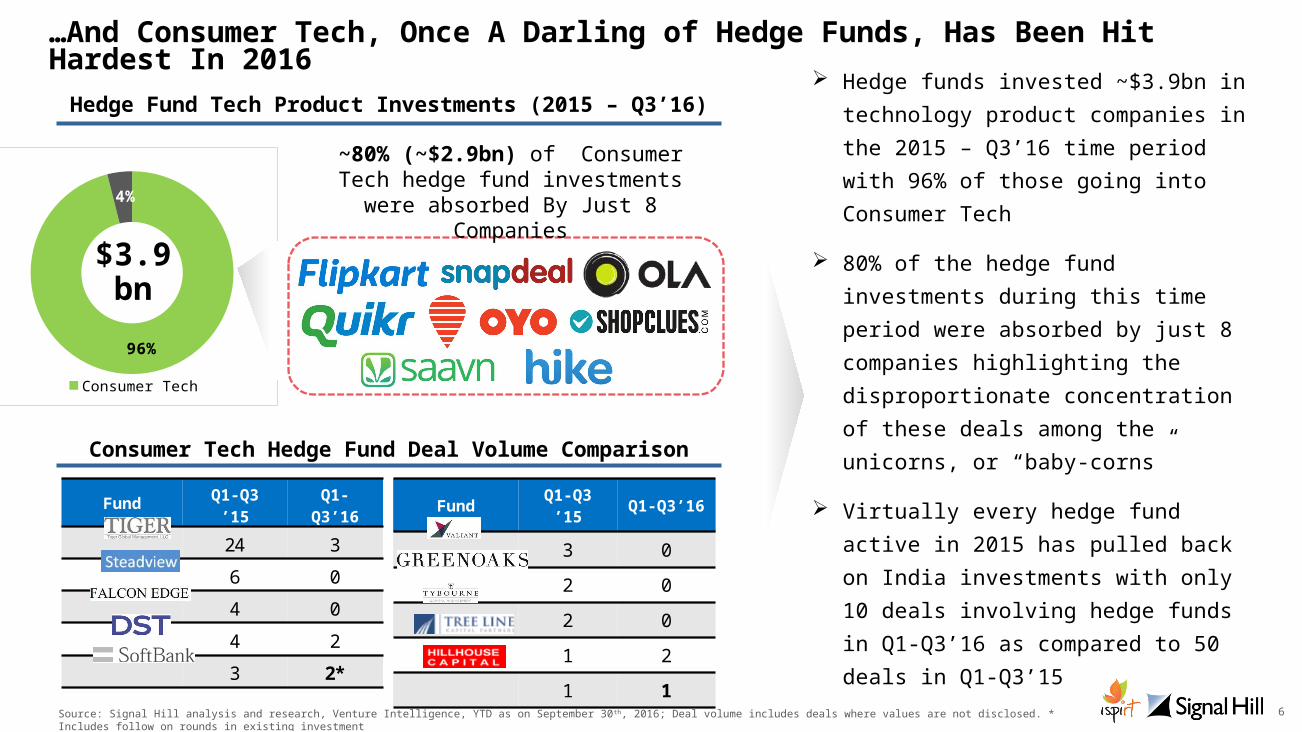
…And Consumer Tech, Once A Darling of Hedge Funds, Has Been Hit Hardest In 2016
Hedge funds invested ~$3.9bn in technology product companies in the 2015 – Q3’16 time period with 96% of those going into Consumer Tech
80% of the hedge fund investments during this time period were absorbed by just 8 companies highlighting the disproportionate concentration of these deals among the unicorns, or “baby-corns”
Virtually every hedge fund active in 2015 has pulled back on India investments with only 10 deals involving hedge funds in Q1-Q3’16 as compared to 50 deals in Q1-Q3’15
Consumer Tech Hedge Fund Deal Volume Comparison
Hedge Fund Tech Product Investments (2015 – Q3’16)
$3.9 bn
Fund Q1-Q3 ’15
Q1-Q3’16
24 3
6 0
4 0
4 2
3 2*
~80% (~$2.9bn) of Consumer Tech hedge fund investments
were absorbed By Just 8 Companies
Source: Signal Hill analysis and research, Venture Intelligence, YTD as on September 30 th, 2016; Deal volume includes deals where values are not disclosed. * Includes follow on rounds in existing investment

7
2012 2013 2014 2015 Q1-Q3'16
136 76
617
932
276
233 174 419
1,063
$205$308
$792
$1,350 $1,339
M&A Activity Suggests A Strong Uptick In 2014 and 2015… M&A activity saw a surge in 2015
with deal value exceeding $1.35bn (up 70% over 2014) across 137 deals (up 130% over 2014)
M&A deal volume thus far during Q1-Q3 ‘16 has been robust with 113 deals and full year 2016 M&A deal volume is likely to equal 2015 levels
M&A deal values thus far during Q1-Q3’16 have increased 55% from Q1-Q3’15 (mainly by the $900m Media.net acquisition)
Share of “Inbound” M&A volume for the time period 2014 – Q3’16 is ~15% and M&A value is ~48%, suggesting M&A continues to be largely driven by domestic deals
India Technology Product M&A Deal Value Trend ($m)
India Technology Product M&A Deal Volume Trend
Source: Signal Hill analysis and research, Venture Intelligence, YTD as on September 30 th, 2016; Deal volume includes deals where values are not disclosed
2012 2013 2014 2015 Q1-Q3'16 11 10 17 10 19 32 29
42
127 94 43 39 59
137 113
InBound Domestic
8
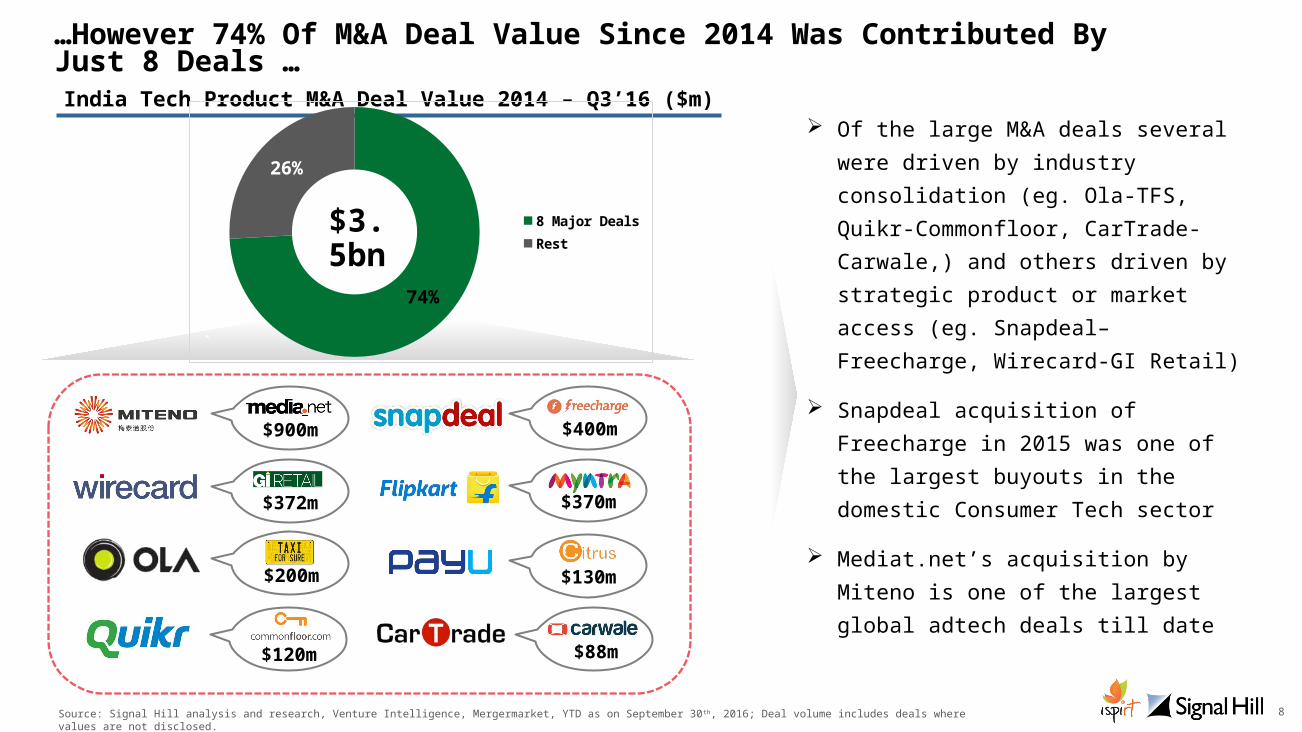
…However 74% Of M&A Deal Value Since 2014 Was Contributed By Just 8 Deals …
Of the large M&A deals several were driven by industry consolidation (eg. Ola-TFS, Quikr-Commonfloor, CarTrade-Carwale,) and others driven by strategic product or market access (eg. Snapdeal–Freecharge, Wirecard-GI Retail)
Snapdeal acquisition of Freecharge in 2015 was one of the largest buyouts in the domestic Consumer Tech sector
Mediat.net’s acquisition by Miteno is one of the largest global adtech deals till date
$400m
$372m $370m
$120m
$200m
$88m
`
India Tech Product M&A Deal Value 2014 – Q3’16 ($m)
$3.5bn
Source: Signal Hill analysis and research, Venture Intelligence, Mergermarket, YTD as on September 30 th, 2016; Deal volume includes deals where values are not disclosed.
74%
26%
8 Major DealsRest
$900m
$130m

9
Number Of Deals In 2015
…And ~80% Of Deal Volume Since 2014 Contributed By Smaller Deals <$5m
250 deals were <$5m out of a total 309 deals during the 2014 – Q3’16 time period
A substantial portion of the deal volume in the <$5m category driven by restructuring as well as acqui-hires (early stage companies being acquired by larger players)
In 2015, Enterprise Tech (with ~25% of deals being >$5m) had a greater share of larger deals as compared to Consumer Tech and ecommerce
India Technology Product M&A Deal Volume Trend
2014 2015 Q1-Q3'16
35
112 10324
25
59
137113
Consumer Tech Enterprise Tech
10
30
>=$5m <$5m
40
Source: Signal Hill analysis and research, Venture Intelligence, YTD as on September 30 th, 2016; Deal volume includes deals where values are not disclosed
15
8297

10
The Missing Middle In The India Technology Product M&A Ecosystem Whilst any M&A market will always follow
a long-tail distribution, the long-tail in Product Tech M&A in India kicks-in very early with many deals below $5m but a steep drop thereafter
Given the evolving stage of the Product Tech funding environment the number of large scale (>$100m) M&A deals is still modest, however it has seen an uptick with 7 such transactions taking place since 2014
However with only 52 deals between $5-100m with a total transaction value of $892m there is a missing middle in the India Product Tech M&A market
As the eco-system matures we expect a significant uptick in both volume and value terms in the mid-size and larger deal categoriesSource: Signal Hill analysis and research, Venture Intelligence, YTD as on September 30 th, 2016; Deal volume includes deals where values are not disclosed
Small Deals (<$5m) Mid-size Deals ($5-100m)
Large Deals (>$100m)
0
50
100
150
200
250
0
500
1000
1500
2000
2500
3000
$97
$892
$2,492
250
527
Deal Value ($m)
India Technology Product M&A (2014 – Q3’16)
11
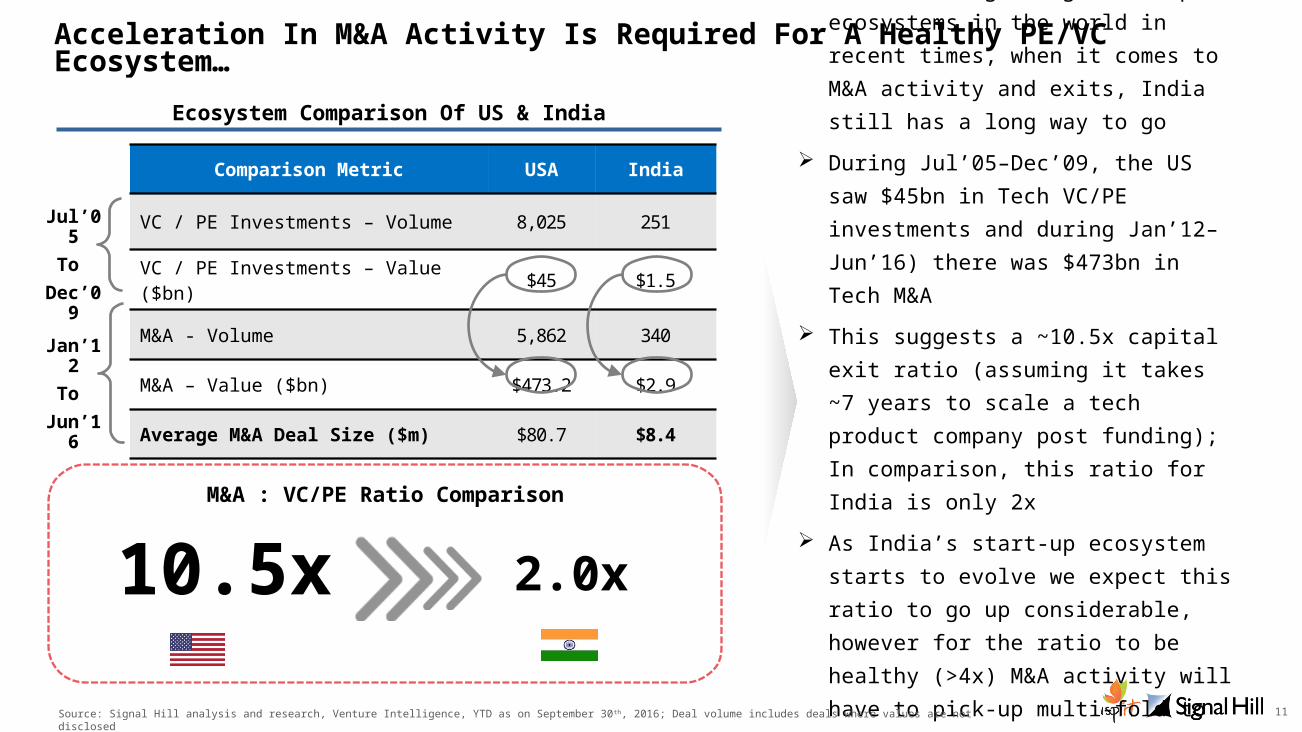
Acceleration In M&A Activity Is Required For A Healthy PE/VC Ecosystem…
Comparison Metric USA India
VC / PE Investments – Volume 8,025 251
VC / PE Investments – Value ($bn) $45 $1.5
M&A - Volume 5,862 340
M&A – Value ($bn) $473.2 $2.9
Average M&A Deal Size ($m) $80.7 $8.4
Although India has been amongst the fastest growing start-up ecosystems in the world in recent times, when it comes to M&A activity and exits, India still has a long way to go
During Jul’05–Dec’09, the US saw $45bn in Tech VC/PE investments and during Jan’12–Jun’16) there was $473bn in Tech M&A
This suggests a ~10.5x capital exit ratio (assuming it takes ~7 years to scale a tech product company post funding); In comparison, this ratio for India is only 2x
As India’s start-up ecosystem starts to evolve we expect this ratio to go up considerable, however for the ratio to be healthy (>4x) M&A activity will have to pick-up multi-fold to give returns to the large amounts of VC/PE capital that were raised in recent years
M&A : VC/PE Ratio Comparison
10.5x 2.0x
Source: Signal Hill analysis and research, Venture Intelligence, YTD as on September 30 th, 2016; Deal volume includes deals where values are not disclosed
Jul’05To
Dec’09
Jan’12To
Jun’16
Ecosystem Comparison Of US & India

12
…And The Buyout Market For Technology Product Companies Needs To Catch Up
Tech product buyout market in India is still in its early days but as companies mature, founders are more open to ceding control
IT Services buyouts in India have seen a sharp rise recently with several assets being in play of late
In comparison, there were 100+ Private Equity Tech product buyouts in USA since 2014 and the top 10 deals alone accounted for ~$102bn in deal value
Source: Signal Hill analysis and research, Venture Intelligence, Mergermarket, YTD as on September 30 th, 2016; Deal volume includes deals where values are not disclosed.
Tech Product Buyout Market Much More Nascent Than IT Services…
$1.1bn $300m $250m
…And Clearly A Long Way Behind The US
$90m$66m
Tech Product Buyouts Since
2014
IT Services Buyouts Since 2014
$102bn
Top 10 Product Buyouts
Since 2014
13
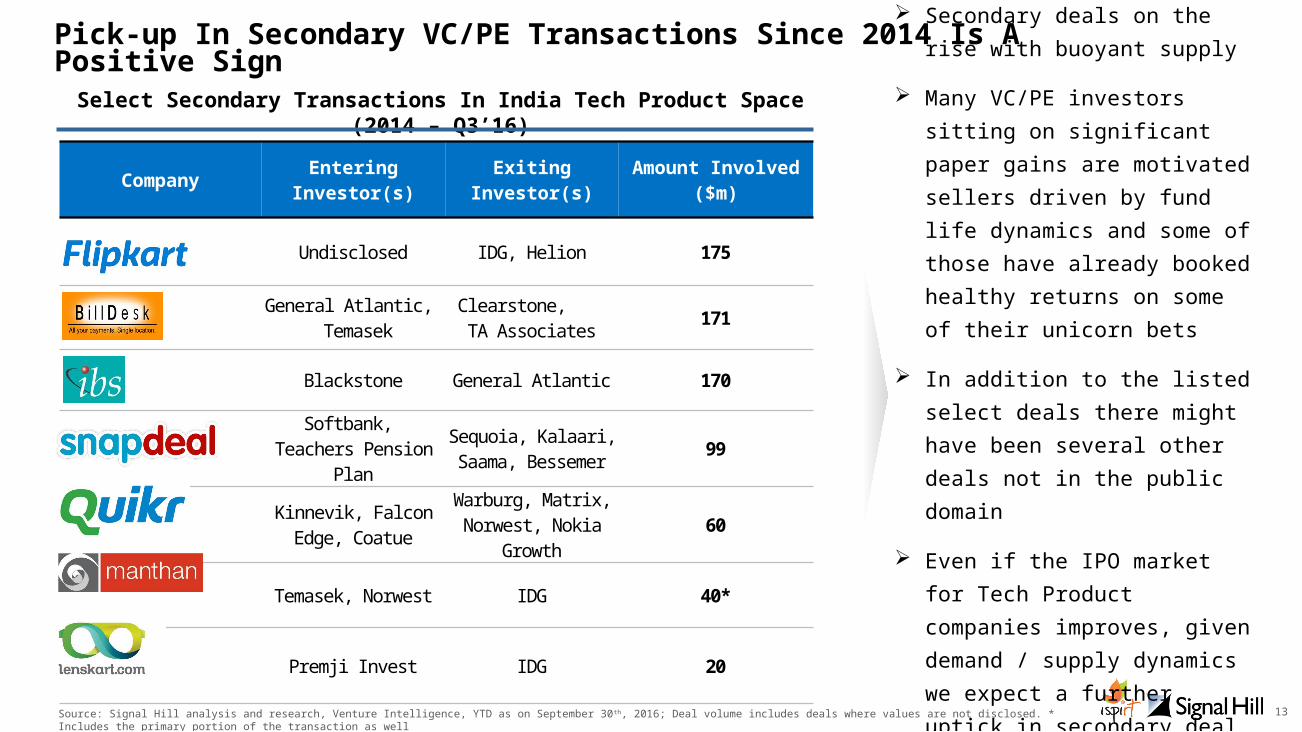
Pick-up In Secondary VC/PE Transactions Since 2014 Is A Positive Sign
Company Entering Investor(s)
Exiting Investor(s)
Amount Involved ($m)
Undisclosed IDG, Helion 175
General Atlantic, Temasek
Clearstone, TA Associates 171
Blackstone General Atlantic 170
Softbank, Teachers Pension Plan
Sequoia, Kalaari, Saama, Bessemer 99
Kinnevik, Falcon Edge, Coatue
Warburg, Matrix, Norwest, Nokia
Growth60
Temasek, Norwest IDG 40*
Premji Invest IDG 20
Secondary deals on the rise with buoyant supply
Many VC/PE investors sitting on significant paper gains are motivated sellers driven by fund life dynamics and some of those have already booked healthy returns on some of their unicorn bets
In addition to the listed select deals there might have been several other deals not in the public domain
Even if the IPO market for Tech Product companies improves, given demand / supply dynamics we expect a further uptick in secondary deal activitySource: Signal Hill analysis and research, Venture Intelligence, YTD as on September 30 th, 2016; Deal volume includes deals where values are not disclosed. * Includes the primary portion
of the transaction as well
Select Secondary Transactions In India Tech Product Space (2014 – Q3’16)
14
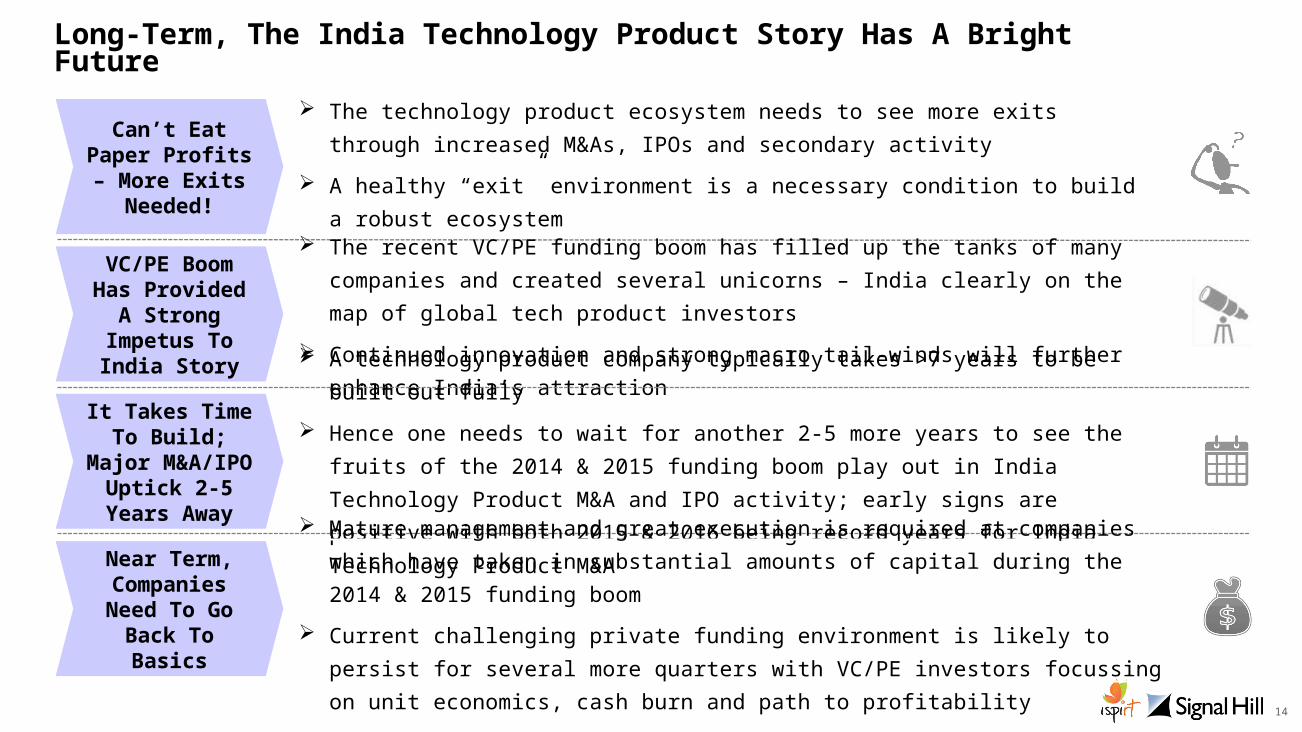
Long-Term, The India Technology Product Story Has A Bright Future
Can’t Eat Paper Profits – More Exits
Needed!
The technology product ecosystem needs to see more exits through increased M&As, IPOs and secondary activity
A healthy “exit” environment is a necessary condition to build a robust ecosystem
VC/PE Boom Has Provided
A Strong Impetus To India Story
It Takes Time To Build;
Major M&A/IPO
Uptick 2-5 Years AwayNear Term, Companies Need To Go
Back To Basics
The recent VC/PE funding boom has filled up the tanks of many companies and created several unicorns – India clearly on the map of global tech product investors
Continued innovation and strong macro tail-winds will further enhance India’s attraction A technology product company typically takes >7 years to be built out fully
Hence one needs to wait for another 2-5 more years to see the fruits of the 2014 & 2015 funding boom play out in India Technology Product M&A and IPO activity; early signs are positive with both 2015 & 2016 being record years for India Technology Product M&A Mature management and great execution is required at companies which have taken in substantial amounts of capital during the 2014 & 2015 funding boom
Current challenging private funding environment is likely to persist for several more quarters with VC/PE investors focussing on unit economics, cash burn and path to profitability
15
This document has been prepared by Signal Hill Capital Advisory India Private Limited (“SHI”) & Indian Software Product Industry Round Table (“iSPIRT”) for discussion purposes only. The information and opinions contained in this document are derived from public and private sources which we believe to be reliable and accurate but which, without further investigation cannot be warranted as to their accuracy, completeness or correctness. This information is supplied on the condition that SHI or iSPIRT and any partner, employee or affiliate of SHI or iSPIRT are not liable for any error or inaccuracy contained herein, whether negligently caused or otherwise, or for loss or damage suffered by any person due to such error, omission or inaccuracy as a result of such a supply. SHI and its affiliates and iSPIRT are also not liable for any loss or damage howsoever caused by relying on the information provided in this document. In particular any numbers, initial valuations and schedules contained in this document are preliminary and are for discussion purposes only and does not constitute an opinion.
Signal Hill is a leading independent advisory boutique serving the M&A and private capital raising needs of growth companies. Signal Hill’s experienced bankers provide deep domain expertise and an unyielding commitment to clients in our sectors: Internet & Digital Media, Internet Infrastructure, Services and Software. With over 700 completed transactions and offices in Baltimore, Bangalore, Boston, Nashville, New York, Reston and San Francisco, Signal Hill leverages deep strategic industry and financial sponsor relationships to help our clients achieve Greater Outcomes®.
iSPIRT is a non profit think tank that builds public goods for Indian product startups to thrive and grow. iSPIRT aims to do for Indian startups what DARPA or Stanford did in Silicon Valley. iSPIRT builds four types of public goods - technology building blocks (aka India stack), startup friendly policies, market access programs like M&A Connect and Playbooks that codify scarce tacit knowledge for product entrepreneurs of India.
Report AuthorsSignal Hill India: Klaas Oskam, George Anthraper, Arun Thathachari, Varun PotturuiSPIRT: Sharad Sharma, M. Thiyagarajan (Rajan)
Thank You