india country report 2017 - ministry of statistics and...
TRANSCRIPT

India Country Report
2017
Central Statistics Office Ministry of Statistics and Programme Implementation
Government of India

SAARC Development Goals – India Country Report – 2017 Page 2

SAARC Development Goals – India Country Report – 2017 Page 3
Dr. T.C.A. Anant Secretary
Government of India Ministry of Statistics and PI
Sardar Patel Bhavan, Sansad Marg, New Delhi-110001
Tel.: +91-11-23742150 Email : [email protected]
Foreword
SAARC as a regional forum, has great potential of regional
cooperation with strong bilateral linkages, mutual trust and
willingness among member countries to bring out social development
in the region. India constitutes over 70% of the area and population
among the eight SAARC nations and is strategically connected to
almost all the member nations.
Government of India is making efforts to bring all the
neighbouring countries on the board for upliftment of marginalized
and poor sections of the society in to the main stream. Indian
development planning, formulation of programmes and policies are
not only important for India but also for the entire SAARC countries.
The government has been implementing many programmes for social
and financial inclusion of the deprived classes which may also be
considered by the neighbouring countries as well.
I hope this report which gives the statistical appraisal of the
achievements made on some mutually agreed indicators of SAARC
Development Goals will be useful in assessing India’s progress on the
attainment of SAARC Development Goals.
October 2017 Dr. T. C. A. Anant New Delhi Chief Statistician of India and Secretary

SAARC Development Goals – India Country Report – 2017 Page 4

SAARC Development Goals – India Country Report – 2017 Page 5
Dr. Davendra Verma Director General
Government of India Ministry of Statistics and PI
West Block-9, R.K. Puram, New Delhi-110001
Tel.: 011-26108529 Email : [email protected]
Preface
The SAARC Development Goals consisting of 22 goals & 67 indicators representing the status of social development in the country.
The present report gives the statistical appraisal of the
achievements made on the SAARC Development Goals in India. In
addition to the mutually agreed indicators, some additional
indicators have also been included under different goals. Goal-wise
complete list of indicators used in this report has been given under
‘India’s SDGs Framework: Goals and Indicators’.
I wish to place on record my gratitude to all government
agencies which provided the necessary updated data for the
publication. Without their cooperation, timely preparation of the
Report would not have been possible. I would like to appreciate the
efforts of the team of officers of Social Statistics division in
preparing this Report.
October 2017 Davendra Verma New Delhi Director General


SAARC Development Goals – India Country Report – 2017 Page 7
OOffffiicceerrss ooff SSoocciiaall SSttaattiissttiiccss DDiivviissiioonn AAssssoocciiaatteedd wwiitthh tthhee
PPuubblliiccaattiioonn
DDrr DDaavveennddrraa VVeerrmmaa
DDiirreeccttoorr GGeenneerraall
SShhrrii PPrraavviinn SSrriivvaassttaavvaa
AAddddiittiioonnaall DDiirreeccttoorr GGeenneerraall
SSmmtt.. SSuunniitthhaa BBhhaasskkaarr
DDiirreeccttoorr
SSmmtt.. RRiicchhaa SShhaannkkeerr
DDiirreeccttoorr
SSmmtt.. SSoouummyyaa PP.. KKuummaarr
DDeeppuuttyy DDiirreeccttoorr
SShhrrii RRaavvii KKuummaarr
JJuunniioorr SSttaattiissttiiccaall OOffffiicceerr

SAARC Development Goals – India Country Report – 2017 Page 8

SAARC Development Goals – India Country Report – 2017 Page 9
Contents
Title Page. No.
Foreword 3 Preface 5 Highlights
Abbreviations 11 16
Introduction 20 SAARC Development Goals Framework: Goals & Indicators
23
Chapter 1 : Livelihood Development Goals
Goal 1 : Eradication of Hunger Poverty Goal 2 : Halve proportion of people in poverty by 2012 Goal 3 : Ensure adequate nutrition and dietary improvement
for the poor Goal 4 : Ensure a robust pro-poor growth process Goal 5 : Strengthen connectivity of poorer regions and of poor
as social Group Goal 6 : Reduce social and institutional vulnerability of the
poor, women and Children Goal 7 : Ensure access to affordable justice Goal 8 : Ensure effective participation of poor and of women in
anti-poverty policies and programmes
27-56
Chapter 2 : Health Development Goals
Goal 9 : Maternal health Goal 10 : Child health Goal 11 : Affordable health care Goal 12 : Improved hygiene and public health
57-68

SAARC Development Goals – India Country Report – 2017 Page 10
Chapter 3 :Education Development Goals
Goal 13 : Access to primary/ community schools for all children, boys and girls
Goal 14 : Completion of primary education cycle Goal 15 : Universal functional literacy Goal 16 : Quality education at primary, secondary and
vocational levels
69-78
Chapter 4 :Environment Development Goals
Goal 17 : Acceptable level of forest cover Goal 18 : Acceptable level of water and soil quality Goal 19 : Acceptable level of air quality Goal 20 : Conservation of bio-diversity Goal 21 : Wetland conservation Goal 22 : Ban on dumping of hazardous waste, including radio-
active waste
79-91
********

SAARC Development Goals – India Country Report – 2017 Page 11
Highlights Livelihood
General Government (Central and State Governments) expenditure
on social services as a proportion of GDP has been 7.4 per cent in
2016-17(BE).
The proportion of underweight children under five years of age
decreased to 36 percent in NFHS-4. Stunting decreased by a larger
margin, from 48 percent to 38 percent during 2005-06 to 2015-16.
The unemployment rate is estimated to be 5 per cent at All India
level under the Usual Principal Status(UPS) approach as per the 5th
Annual Employment & Unemployment Survey 2015-16.
The Telecom Sector is witnessing substantial growth in the number of
subscribers. As on May 2017, the subscriber base has increased to
1204.98 million (with 1180.82 million wireless subscribers) as
compared to 1058.86 million (2015-16).
13469 villages have been electrified upto 15th May 2017 and 256.81
lakh free electricity connections have been released to BPL
households up to 30th April 2017.
As per Fifth Annual Employment Unemployment Survey 2015-2016,
Labour Force Participation Rate(LFPR) is 50.3% at all India level (male
LFPR:75.0% ; female LFPR:23.7%) under UPS approach.
The mean age at marriage for women have increased from 19.5 years
in 1992 to 22.1 years in 2015.
According to SRS, the sex ratio at birth (number of female per 1000
male) for the country for the period 2013-15 (3-year average) has
been estimated at 900 showing a decline from the estimated figure
of 908 in 2010-12.

SAARC Development Goals – India Country Report – 2017 Page 12
Health
The national MMR level has been estimated as 167 per 100,000 live
births in 2011-13 against 327 in 1999-2001.
The proportion of births attended by skilled personnel has reached
81.4% in 2015-16 as compared to 46.6% in 2005-06.
Life expectancy in India has been continuously increasing, it has gone
up to 68.3 years in 2011-15 from 60.3 in 1991-95.
The Under-Five Mortality Rate has been lowered to 43 per 1000 live
births in 2015 from 55 in 2011.
The Infant Mortality Rate has been reduced to 34 per 1000 live births
in 2016 (36 for girl child and 33 for male child) from 44 in 2011.
The overall proportion of households with an improved drinking-
water sources are 89.9% in urban and 89.3 % in rural areas as per
NFHS-4 (2015-16).
Rural sanitation Coverage has increased to 64.11% as on 29.05.2017
from 38.55% in 2012-13.
The adult (15- 49 years) HIV prevalence at national level continued its
steady decline from 0.41% in 2001 to 0.26% in 2015.
The prevalence of TB in the country has reduced to 217 per lakh
population in 2015 from 289 per lakh population in 2000.
During 2016, the malaria incidence was around 11.0 lakhs cases (16
lakh cases in 2010), 7.2 lakhs Pf cases and 331 deaths.
Education
As per DISE 2015-16, the national Net Enrolment Rate (NER) is 87.30
at primary level against 88.08 in 2013-14.

SAARC Development Goals – India Country Report – 2017 Page 13
The gender parity index in primary education has gone up from 0.76
in 1990-91 to 1.03 in 2014-15.
The percentage of schools (all schools) having girls’ toilet was 37.42%
in 2005-06 which gradually increased to 97.62% in 2015-16.
Environment
Total forest cover of the country is 701,673 km2 which is 21.34% of
the geographical area of the country.
Only 43.8 per cent of India's households use clean fuels for cooking
(80.6% in urban and 24.0% in rural areas) as per NFHS-4.
As on July, 2017 the total protected areas is 162024.69 km2 which is
around 5% of the total geographical area of the country.
********

SAARC Development Goals – India Country Report – 2017 Page 14
Statistics at a glance for Important Indicators
S. no.
Indicator Latest Availability period
Data
1. Proportion of children under five years of age who are
underweight
Stunted
Wasted
2015-16
35.7% 38.4% 21.3%
2. Incidence of poverty
2011-12 21.9%
3. Percentage of persons below the Poverty Line
2011-12 25.7% - rural 13.7% -urban
21.9% overall
4. Economically active population (15-59 years)
2013 63.3 %
5. Government expenditure on social services as a proportion of GDP (BE)
2016-17 7.4 %
6. Telecom subscribers May 2017 1204.98 million
7. Wireless subscribers May 2017 1180.82 million
8. Free electricity connections released to BPL households.
April 2017 256.81 lakh
9. Participation in labour force in usual status (ps+ss).
2011-12 55% rural males, 25% rural females 56% urban males
16% urban females
10. Unemployment rate UPS approach 2015-16 5.0 % 11. Female Labour Force Participation Rate 2015-16 23.7%. 12. Life expectancy 2011-15 68.3 years 13. Infant Mortality Rate 2016 34 per 1000 live
births 36 for girl child
33 for male child
14. Under-five mortality rate 2015 43 per 1000

SAARC Development Goals – India Country Report – 2017 Page 15
live births 15. Sex ratio at birth 2013-15 900 16. Maternal Mortality Rate 2011-13 167 per
100,000 live births
17. Mean age at marriage for women 2015 22.1 years 18. Proportion of births attended by skilled
personnel 2015-16 81.4%
19. Proportion of households having access to improved water sources
2015-16 89.9 in urban and 89.3% in
rural 20. Rural Sanitation coverage 2016-17 63.68% 21. Adult (15- 49 years) HIV prevalence 2015 0.26% 22. Prevalence of TB 2015 217 per lakh
population 23. Malaria incidence 2016 1.1 million
cases 0.72 million Pf cases and 331
deaths 24. NER at primary level 2015-16 87.30 25. Gross enrolment ratio (GER) 2015-16 99.21 at
primary level 26. Gender Parity Index 2014-15 1.03 in
primary 27. Adult (age 15 & above) literacy rate 2014 71% 28. Percentage of schools (all schools) having
girls’ toilet 2015-16 97.6%
29. Cases pending in the Supreme Court of India
May 2017 60751
30. Total forest cover 2015 701673 km2 21.34% of the geographical
area. 31. Total Protected Areas 2017 162024.69
km2

SAARC Development Goals – India Country Report – 2017 Page 16
Abbreviations
AAY AIDS ANC APL ASFR AWC AYUSH BCG
Antyodaya Anna Yojana Acquired Immune Deficiency Syndrome Anti Natal Care Above Poverty Line Age-Specific Fertility Rate Anganwadi Centre Ayurveda, Yoga & Naturopathy, Unani, Siddha and Homoeopathy Bacille Calmette Guerin
BE BMI BOD
Budget Estimates Body Mass Index
Biochemical Oxygen Demand BPL BSBD CBHI
Below Poverty Line Basic Savings Bank Deposit Account
Central Bureau of Health Intelligence CDS Current Daily Status CFCs CIP
Chloro-Fluoro-Carbons Central Issue Price
CO2 Carbon Dioxide CPCB CRS
Central Pollution Control Board Community Radio Stations
CSO Central Statistics Office CWS DDUGJY
Current Weekly Status Deendayal Upadhyaya Gram Jyoti Yojana
DISE District Information System on Education DLHS DPT DTH EPI EPR GDI
District Level Household and Facility Survey Diphtheria, Pertussis and Tetanus Direct-to-Home Expanded Programme of Immunization Extended Producer Responsibility General Development Index
GDP Gross Domestic Product GER Gross Enrolment Ratio GPI Gender Parity Index HDI Human Development Index HDR HITS
Human Development Report Headend-in-the-sky
HIV Human Immunodeficiency Virus

SAARC Development Goals – India Country Report – 2017 Page 17
HSS HIV Sentinel Surveillance ICDS Integrated Child Development Scheme ICT Information & Communication Technology IDD Iodine Deficiency Disorders IMR Infant Mortality Rate ISACPA Independent South Asian Commission on Poverty Alleviation ISFR India State of Forest Report IT IPTV
Information Technology Internet Protocol Television
K Cal Kilo Calorie km Kilometre LFPR MDF
Labour force participation rate Moderately Dense Forest
MDGs Millennium Development Goals Mha MIB
Million Hectare Ministry of Information and Broadcasting
MMR MMRP MGNREGA MOHFW MOSPI MoRTH MPCE
Maternal Mortality Ratio Modified Mixed Reference Period Mahatma Gandhi National Rural Employment Guarantee Act Ministry of Health & Family Welfare Ministry of Statistics and Programme Implementation Ministry of Road Transport and Highways Monthly Per Capita Expenditure
MRP MSOs
Mixed Recall Period Multi System Operators
MSW Municipal Solid Waste NAAQS NACP NALSA
National Ambient Air Quality Standards National AIDS Control Programme National Legal Services Authority
NAMP National Air Quality Monitoring Programme NER Net Enrolment Ratio NFHS NFSA NHs NHDP NHM NITI NRDWP
National Family Health Survey National Food Security Act National Highways National Highways Development Project National Health Mission National Institution of Transforming India National Rural Drinking Water Programme
NSS National Sample Survey NSSO National Sample Survey Office

SAARC Development Goals – India Country Report – 2017 Page 18
OBCs Other Backward Classes ODP Ozone Depleting Potential ODF Open Defecation Free ODS OF OPWD
Ozone Depleting Substance Open Forest Other Public Works Departments
PC PCC PF
Personal Computer
Pollution Control Committees Plasmodium falciparum
PGR Poverty Gap Ratio PHR Poverty Headcount Ratio PLHIV People Living with HIV PLHA PMJDY PRIs
People Living with HIV/AIDS Pradhan Mantri Jan Dhan Yojana
Panchayati Raj Institutions PS Principal Status PWD RBD
Public Works Department Registration of Births and Deaths
RE Revised Estimates RGI RGSEAG RNI
Registrar General of India Rajiv Gandhi Scheme for Empowerment of Adolescent Girls Registrar of Newspapers for India
RSPM SBM-G
Respirable Suspended Particulate Matter Swachh Bharat Mission- Gramin
SCs SH SPCB
Scheduled Castes States Highways State Pollution Control Board
SPM Suspended Particulate Matter sq km Square Kilometre SRS Sample Registration System SS Subsidiary Status STs Scheduled Tribes STD STP
Sexually Transmitted Disease Sewage Treatment Plant
TB TPD TPDS
Tuberculosis Tons per day Targeted Public Distribution System
TRAI Telecom Regulatory Authority of India U5MR Under-Five Mortality Rate

SAARC Development Goals – India Country Report – 2017 Page 19
U-DISE UIP
Unified District Information System for Education Universal Immunisation Programme
UN United Nations UNDP UPS
United Nations Development Programme Usual Principal Status
URP Uniform Recall Period UTs VDS WBNP WHO
Union Territories Very dense forest Wheat Based Nutrition Programme World Health Organisation
WFPR Work Force Participation Rate WPR Worker Participation Rate
Conversions
1 Lakh 100 Thousands
10 Lakhs 1 Million
1 Crore 10 Millions
*****

SAARC Development Goals – India Country Report – 2017 Page 20
Introduction
SAARC Development Goals (Adaptation from “An Engagement with Hope”, ISACPA 2004)
At the Twelfth SAARC Summit held in Islamabad, Pakistan (4-
6 January 2004), the Heads of States in their declaration directed
the Independent South Asian Commission on Poverty Alleviation
(ISACPA) to submit to the Thirteenth SAARC Summit “a
comprehensive and realistic blue-print setting out SAARC
Development Goals for the next five years in the areas of poverty
alleviation, education, health, and environment giving due regard,
among others, to suggestions made in the ISACPA Report”.
In addition to this SAARC mandate, two other sources of
inspiration have guided preparation of the SAARC Development
Goals (SDGs): first, the regional imperative for galvanizing a popular
imagination which allows zero tolerance for a continuation of the
inhumanity of poverty, and secondly, the international imperative
of achieving the Millennium Development Goals (MDGs) by 2015. In
order to prepare the goals for the mandated areas of poverty
alleviation (livelihood), education, health and environment, ISACPA
took into consideration three key factors: the specificities of South
Asia, linkages with the international goals as set out in the MDGs,
and finally, the importance of focusing on process goals as much as
on outcome goals (for example, increasing the presence of skilled
birth attendants to influence the outcome goal of maternal health).
Taking the above factors into account, the ISACPA Report
recommended 22 priority goals to constitute the SAARC
Development Goals for the period 2007-2012 in the mandated

SAARC Development Goals – India Country Report – 2017 Page 21
areas of livelihood, health, education and environment. Of these, 8
Goals pertain to livelihood, 4 to health, 4 to education and 6 to
environment (Annex).
While the SAARC Development Goals express the regional
will for a comprehensive and strategic response to the problem of
poverty and social development, the formulation of specific targets
and indicators for these goals were left to be carried out at the
individual country level.
*****

SAARC Development Goals – India Country Report – 2017 Page 22

SAARC Development Goals – India Country Report – 2017 Page 23
SAARC Development Goals Framework : Goals & Indicators
Livelihood Goal 1 Eradication of Hunger Poverty Indicator 1 Malnutrition in children under five years Indicator 2 Malnutrition for overall population (in average intake) Goal 2 Halve proportion of people in poverty by 2012 Indicator 3 Percentage of people living on less than 1$ per day (PPP
terms) Indicator 4 Head count poverty ratio based on nationally determined
poverty line(s) Goal 3 Ensure adequate nutrition and dietary improvement for
the poor Indicator 5 Percentage of the poor covered by various food support
programmes Indicator 6 Micro-nutrient supplements e.g. % of people having
access to Vitamin A, iodized salt, etc. Goal 4 Ensure a robust pro-poor growth process Indicator 7 Budgetary/ fiscal expenditure for pro-poor growth sectors
as % of GDP, and as % of total government expenditures Indicator 8 % of poor covered by micro-credit and similar
programmes Indicator 9 Reduction of income/consumption inequality (Gini
Coefficient) Indicator 10 Rate of growth of employment (disaggregated) Indicator 11 Assets ownership by poor (quantifiable indicators to be
developed) Additional indicators
Rate of increase of income/consumption of bottom 20% of the population compared to top 20% of the population
Goal 5 Strengthen connectivity of poorer regions and of poor as social group
Indicator 12 Transport connectivity for the poor in rural areas (e.g., length of rural roads, availability of boats per 1000 population, average time/distance to reach nearest road/major population centre)

SAARC Development Goals – India Country Report – 2017 Page 24
Indicator 13 Communications connectivity : % of people using telephone/cell Phone
Indicator 14 % of rural population having access to electricity Indicator 15 Representation of the excluded groups
(dalits/tribals/indigenous groups) in local government Indicator 16 Mass media connectivity : percentage of people using TV
and radio Goal 6 Reduce social and institutional vulnerability of the poor,
women and children Indicator 17 % of children who are working Indicator 18 Share of women in employment
(wage/self/organized/unorganized) Indicator 19 Coverage or amount of public expenditure as % of GDP on
Social Protection for the Vulnerable Groups Indicator 20 Early marriage (average age at marriage, % of girls
married before legal age) Indicator 21 Birth registration (% of children registered) Indicator 22 Sex ratio at birth
Goal 7 Ensure access to affordable justice Indicator 23 Average time required in disposal of legal disputes Indicator 24 Access to alternate disputes resolution Indicator 25 Access to free legal aid for the poor (marginalized group)
Goal 8 Ensure effective participation of poor and of women in anti-poverty policies and programmes
Indicator 26 Percentage of women in local governments/ parliament/ civil services, etc.
Indicator 27 Gender Budgeting : Budgetary expenditures for women/ poor as % of total budgetary amount
Health Goal 9 Maternal health Indicator 28 Maternal Mortality Ratio (MMR) Indicator 29 Percentage of births covered by the skilled birth
attendants Indicator 30 Life expectancy of women as a ratio of life expectancy of
men Indicator 31 Age specific fertility rate of 15 to 24 years girls

SAARC Development Goals – India Country Report – 2017 Page 25
Goal 10 Child health Indicator 32 Immunisation coverage (measles can be a proxy) Indicator 33 Under 5 mortality rate (CMR) Indicator 34 IMR Indicator 35 Neo-natal mortality rate Goal 11 Affordable health care Indicator 36 Out of pocket expenditure on health as % of total
household expenditure Indicator 37 Total government expenditure on health as a % of GDP Indicator 38 % of budget allocated to primary health care vis-à-vis
total health budget Indicator 39 Number of doctors per 1000 population Goal 12 Improved hygiene and public health
Indicator 40 % of population with access to safe drinking water Indicator 41 % of population having access to sanitation Indicator 42 Policies on health education (number of programmes,
preventing and health promoting, on communicable diseases e.g. HIV/AIDS, TB and malaria
Indicator 43 Prevalence rate of HIV/AIDS, TB, Malaria
Education Goal 13 Access to primary/community schools for all children,
boys and girls Indicator 44 % of children having access to primary schools by
distance Indicator 45 Gross Enrolment Rate/Net Enrolment Rate Indicator 46 Public expenditure on education in terms of GDP Indicator 47 Gender parity at primary and secondary level
Goal 14 Completion of primary education cycle Indicator 48 Survival rates (along with drop-out)
Goal 15 Universal functional literacy Indicator 49 Adult literacy rate
Goal 16 Quality education at primary, secondary and vocational levels
Indicator 50 Percentage of trained teachers Indicator 51 Students teacher ratio Indicator 52 Percentage of schools with toilets for girls

SAARC Development Goals – India Country Report – 2017 Page 26
Environment Goal 17 Acceptable level of forest cover Indicator 53 Percentage of forest cover Indicator 54 Percentage or extent of community/social forest
Goal 18 Acceptable level of water and soil quality Indicator 55 Chemical fertilizers/ pesticides consumption per ha of
arable land Indicator 56 Percentage of contaminated wells/water sources Goal 19 Acceptable level of air quality Indicator 57 Carbon dioxide emissions (metric tons per capita) Indicator 58 Particulate matter (PM 2.5/10) in the major
metropolitan centres Indicator 59 Percentage of firewood in total energy mix
Goal 20 Conservation of bio-diversity Indicator 60 % and number of protected areas out of the total land
area (with management plan) Indicator 61 Number of protected species
Goal 21 Wetland conservation Indicator 62 Number and % of protected wetland/Ramsar sites
Goal 22 Ban on dumping of hazardous waste, including radio-active waste
Indicator 63 Solid waste generation per capita (kg p.a.) Indicator 64 % of waste treated Indicator 65 Regulatory framework for hazardous waste treatment
******

SAARC Development Goals : India Country Report – 2017 Page 27
Chapter 1 : Livelihood Goals
Goal 1 Eradication of Hunger Poverty
Goal 2 Halve proportion of people in poverty by 2012
Goal 3 Ensure adequate nutrition and
dietary improvement for the poor
Goal 4 Ensure a robust pro-poor growth process
Goal 5 Strengthen connectivity of poorer regions and
of poor as social group
Goal 6 Reduce social and institutional vulnerability
of the poor, women and children
Goal 7 Ensure access to affordable justice
Goal 8 Ensure effective participation of poor and of women in anti-
poverty policies and programmes

SAARC Development Goals : India Country Report – 2017 Page 28
Chapter 1 : Livelihood Goals
Goal 1: Eradication of Hunger Poverty
1.1 Malnutrition in children under five years
In developing countries, children and adults are vulnerable to
malnutrition because of low dietary intakes, infectious diseases, lack of
appropriate care and inequitable distribution of food within the
household.
Three standard indices of physical growth that describe the
nutritional status of children are:
• Height for age (stunting)
• Weight for height (wasting)
• Weight for age (underweight)
The latest available data from the 4th National Family Health Survey
(NFHS-4, 2015-16), depicts that around 38 percent children under five
years of age are stunted against 48 percent in 2005-06 and 35.7 percent
are underweight. Wasting is also quite a serious problem in India,
affecting 21percent of children under five years of age and more than
7% severely wasted.
Indicator NFHS-4 (2015-16)
NFHS-3
(2005-06)
Children under 5 years who are stunted (height-for-age)(%)
38.4 48.0
Children under 5 years who are wasted
(weight-for-height)(%)
21.0 19.8
Children under 5 years who are
underweight (weight-for-age)(%)
35.7 42.5

SAARC Development Goals : India Country Report – 2017 Page 29
The prevalence of stunting is still higher in Rural parts (41.2%) as
compared to Urban India(31%) and the decrease in stunting over time
was greater in rural areas than urban areas. The prevalence of
underweight in children is more in Rural (38.3%) than in urban (29.1%).
1.2 Malnutrition for overall population
The NFHS-4 results reveal improvement in the nutritional
indicators of persons in the age group 15-49 years. Both men and
women with less than normal BMI have reduced since 2005-06 to 2015-
16 substantially. The prevalence of anaemia has reduced among all.
However, the decrease was significantly high among children of age 6-
59 months (from 58% in 2005-06 to 69% in 2015-16).
Indicators related to Nutritional status(%) NFHS-4 (2015-16)
NFHS-3
(2005-06)
Children aged 6-59 months who are anaemic (<11.0 g/dl)
58.4 69.4
Non-pregnant women aged 15-49 years who are anaemic (<12.0 g/dl)
53.1 55.2
Pregnant women aged 15-49 years who are anaemic (<11.0 g/dl)
50.3 57.9
All women aged 15-49 years who are anaemic 53.0 55.3
Men aged 15-49 years who are anaemic (<13.0 g/dl) 22.7 24.2
Women aged 15-49 years whose Body Mass Index (BMI) is below normal (BMI < 18.5 kg/m2)
22.9 35.5
Men aged 15-49 years whose Body Mass Index (BMI) is below normal (BMI < 18.5 kg/m2)
20.2 34.2
*****

SAARC Development Goals : India Country Report – 2017 Page 30
Goal 2 :Halve Proportion of People in Poverty by 2012
2.1 Poverty Headcount ratio based on National poverty line
The Poverty Headcount Ratio(PHR)is the proportion of
population whose per capita income/consumption expenditure is
below an official threshold(s) set by the National Government. The
Planning Commission in the Government of India had estimated
poverty at National and State levels using the poverty lines as defined
and applying it to the distribution of persons by household per capita
monthly consumption expenditure.
The poverty ratio according to the Government of India
definition is at variance with that according to international definition.
India unlike most countries has different poverty lines at sub-national
level in the sense that the poverty ratios are estimated for different
States of the country separately for rural and urban areas. The all India
poverty ratio is obtained as state-population weighted average poverty
ratio, and the all India poverty line is the per capita per month
expenditure that corresponds to the all India poverty ratio.
The methodology for estimation of poverty followed by the
erstwhile Planning Commission has been based on the
recommendations made by experts in the field from time to time. In
December 2005, an Expert Group under the Chairmanship of Prof.
Suresh D. Tendulkar was constituted to review the methodology for
estimation of poverty. The Tendulkar Committee computed poverty
lines and poverty ratios for 2004-05. For comparison they also
computed poverty lines and poverty ratios for 1993-94 with identical
methodology.
The erstwhile Planning Commission periodically estimates
poverty lines and poverty ratios for each of the years for which Large
Sample Surveys on Household Consumer Expenditure have been
SAARC Development Goals : India Country Report – 2017 Page 31
conducted by the National Sample Survey Office (NSSO) of the Ministry
of Statistics and Programme Implementation. These surveys are
normally conducted on quinquennial basis. The last survey on
Consumer Expenditure was conducted in 2011-12 (NSS 68th round).
The Monthly Per Capita Expenditure (MPCE) is calculated based
on Household Expenditure data of NSSO and is computed on the basis
of three different concepts: Uniform Reference Period (URP), Mixed
Reference Period (MRP), and Modified Mixed Reference Period
(MMRP). As per Tendulkar Methodology, the poverty line has been
expressed in terms of MPCE based on Mixed Reference Period.
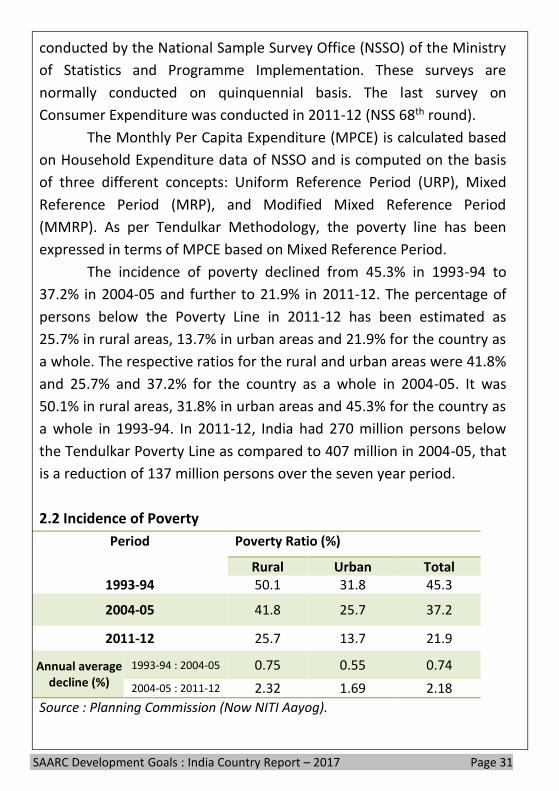
The incidence of poverty declined from 45.3% in 1993-94 to
37.2% in 2004-05 and further to 21.9% in 2011-12. The percentage of
persons below the Poverty Line in 2011-12 has been estimated as
25.7% in rural areas, 13.7% in urban areas and 21.9% for the country as
a whole. The respective ratios for the rural and urban areas were 41.8%
and 25.7% and 37.2% for the country as a whole in 2004-05. It was
50.1% in rural areas, 31.8% in urban areas and 45.3% for the country as
a whole in 1993-94. In 2011-12, India had 270 million persons below
the Tendulkar Poverty Line as compared to 407 million in 2004-05, that
is a reduction of 137 million persons over the seven year period.
2.2 Incidence of Poverty
Period Poverty Ratio (%)
Rural Urban Total 1993-94 50.1 31.8 45.3
2004-05 41.8 25.7 37.2
2011-12 25.7 13.7 21.9
Annual average decline (%)
1993-94 : 2004-05 0.75 0.55 0.74
2004-05 : 2011-12 2.32 1.69 2.18
Source : Planning Commission (Now NITI Aayog).

SAARC Development Goals : India Country Report – 2017 Page 32
During the 11-year period 1993-94 to 2004-05, the average
decline in the poverty ratio was 0.74 percentage points per year. It
accelerated to 2.18 percentage points per year during the 7-year period
2004-05 to 2011-12. The rate of decline in the poverty ratio during the
most recent 7-year period 2004-05 to 2011-12 was about three times of
that experienced in the 11-year period 1993-94 to 2004-05.
The share of the poorest 20% population in terms of the
monthly per capita consumption expenditure in total consumption (i.e.,
consumption accounted for by the poorest one fifth of the population)
in the rural areas declined from 9.6% in 1993-94 to 9.5% in 2004-05 and
declined to 9.1% in 2011-12 (URP). This decline was sharper in the
urban areas where the ratio declined from 8.0% in 1993-94 to 7.3% in
2004-05 and further to 7.1% in 2011-12.
*****

SAARC Development Goals : India Country Report – 2017 Page 33
Goal 3 : Ensure Adequate Nutrition and Dietary
Improvement for the Poor
3.1 Food support programmes
The Government has enacted the National Food Security Act
(NFSA), which came into force w.e.f. July 2013 with a view to make
receipt of food grains under Targeted Public Distribution System (TPDS)
a legal right. The objective of NFSA is to provide for food and nutritional
security in human life cycle approach, by ensuring access to adequate
quantity of quality food at affordable prices to people to live a life with
dignity. The Act provides for coverage of upto 75% of the rural
population and upto 50% of the urban population for receiving
subsidized food grains under TPDS, thus covering about two-third
population of the country. The eligible persons identified by the
States/UTs are entitled to receive 5 kgs of food grains per person per
month at subsidized prices of Rs.3/2/1 per kg for
rice/wheat/coarsegrains respectively. The existing Antyodaya Anna
Yojana (AAY) households, which constitute the poorest of the poor,
receive 35 kgs of food grains per household per month. As on 1st
November, 2016, NFSA has been implemented in all the 36 States/UTs
and they are receiving monthly allocation of food grains as per their
entitlement under NFSA.
The Act also has a special focus on the nutritional support to
women and children. Besides meal to pregnant women and lactating
mothers during pregnancy and six months after the child birth, such
women will also be entitled to receive maternity benefit of not less
than Rs. 6,000. Children upto 14 years of age will be entitled to
nutritious meals as per the prescribed nutritional standards. In case of
non-supply of entitled food grains or meals, the beneficiaries will
receive food security allowance.

SAARC Development Goals : India Country Report – 2017 Page 34
The Integrated Child Development Services (ICDS) Scheme, is a
Centrally Sponsored Scheme of Ministry of Women and Child
Development aiming at holistic development of children below 6 years
of age and pregnant women & lactating mothers by providing a
package of six services comprising (i) Supplementary Nutrition; (ii) Pre-
school Non Formal Education; (iii) Nutrition and Health Education; (iv)
Immunization; (v) Health check-up; and (vi) Referral Services. The
supplementary Nutrition Programme under ICDS has been made as an
entitlement under NFSA. There are 13,49,153 operational AWCs/ mini-
AWCs in September 2016 providing service to more than 10 crore
beneficiaries [Children (6 months to 6 years) and pregnant & lactating
mothers] for supplementary nutrition.
Year ending No. of operational projects
No. of operational AWCs
No. of Supplementary nutrition beneficiaries(in lakhs)
No. of pre-school education beneficiaries (in lakhs)
Achievement during XI Plan
1,079 4,59,868 267.06 (37.85%) 57.41 (19.09%)
31.03.2013 7,025 13,38,732 956.12 353.29
31.03.2014 7,067 13,42,146 1,045.09 370.71
31.03.2015 7,072 13,46,186 1,022.33 365.44
31.03.2016 7,073 13,49,563 1,021.31 350.35
30.09.2016 7,073 13,49,153 1,010.56 345.44
Source: Annual Report 2016-17, Ministry of Women & Child Development
The Mid-Day Meal Scheme launched in 1995 by the Ministry of Human Resource Development with a view to enhance enrollment, retention, attendance and simultaneously improving nutritional levels among students in primary schools, started in 2408 blocks in country. By the year 1997-98 the scheme was introduced in all the blocks of the country. The Scheme presently covers students of class I-VIII of
SAARC Development Goals : India Country Report – 2017 Page 35
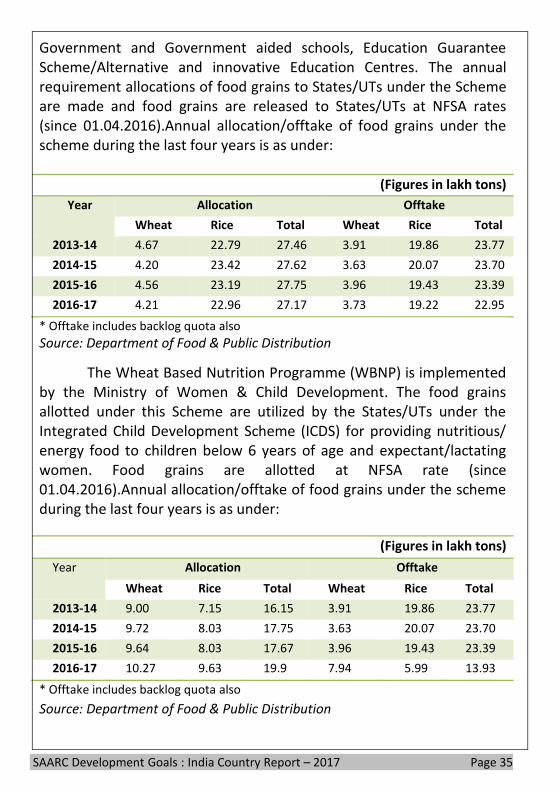
Government and Government aided schools, Education Guarantee Scheme/Alternative and innovative Education Centres. The annual requirement allocations of food grains to States/UTs under the Scheme are made and food grains are released to States/UTs at NFSA rates (since 01.04.2016).Annual allocation/offtake of food grains under the scheme during the last four years is as under:
(Figures in lakh tons)
Year
Allocation Offtake
Wheat Rice Total Wheat Rice Total
2013-14 4.67 22.79 27.46 3.91 19.86 23.77
2014-15 4.20 23.42 27.62 3.63 20.07 23.70
2015-16 4.56 23.19 27.75 3.96 19.43 23.39
2016-17 4.21 22.96 27.17 3.73 19.22 22.95
* Offtake includes backlog quota also
Source: Department of Food & Public Distribution
The Wheat Based Nutrition Programme (WBNP) is implemented by the Ministry of Women & Child Development. The food grains allotted under this Scheme are utilized by the States/UTs under the Integrated Child Development Scheme (ICDS) for providing nutritious/ energy food to children below 6 years of age and expectant/lactating women. Food grains are allotted at NFSA rate (since 01.04.2016).Annual allocation/offtake of food grains under the scheme during the last four years is as under:
(Figures in lakh tons)
Year
Allocation Offtake
Wheat Rice Total Wheat Rice Total
2013-14 9.00 7.15 16.15 3.91 19.86 23.77
2014-15 9.72 8.03 17.75 3.63 20.07 23.70
2015-16 9.64 8.03 17.67 3.96 19.43 23.39
2016-17 10.27 9.63 19.9 7.94 5.99 13.93
* Offtake includes backlog quota also
Source: Department of Food & Public Distribution

SAARC Development Goals : India Country Report – 2017 Page 36
The Rajiv Gandhi Scheme for Empowerment of Adolescent Girls
(RGSEAG) – 'SABLA' launched in 2010 aims at empowering adolescent
girls of 11-18 years by improvement of their nutritional and health
status and upgrading various skills like home skills, life skills and
vocational skills. The requirement of food grains under the scheme for
nutrition is @ 100 grams of grains per beneficiary per day for 300 days
in a year.
The provision of minimum nutritional support to the poor
through subsidized food grains and ensuring price stability in different
states are the twin objectives of the food security system. In fulfilling its
obligation towards distributive justice, the Government incurs food
subsidy. While the economic cost of wheat and rice has continuously
gone up, the issue price has been kept unchanged since 1st July, 2002.
Due to implementation of NFSA, Central Issue Price (CIP) has further
gone down for APL and BPL categories. The Government, therefore,
continues to provide large and increasing amounts of subsidy on food
grains for distribution under the TPDS/NFSA and other nutrition-based
welfare schemes and open market operations.
( in crore)
Year subsidy released
Food Corporation of India States Total
2011-12 59,525.90 12,845.00 72,370.90
2012-13 71,980.00 12,574.00 84,554.00
2013-14 75,500.02 14,240.00 89,740.02
2014-15 91,995.35 21,175.81 1,13,171.16
2015-16 1,12,000.00 22,919.00 1,34,919.00
2016-17* 1,03,334.61 21,000.00 1,24,334.61
* As on 05.01.2017
Source: Annual Report 2016-17, Department of Food & Public Distribution

SAARC Development Goals : India Country Report – 2017 Page 37
3.2 Micro-nutrient supplements
Iodine is an important micronutrient and lack of it in the diet
can lead to Iodine Deficiency Disorders (IDD), which can cause
miscarriages, stillbirths, brain disorders, and retarded psychomotor
development, speech and hearing impairments, and depleted levels of
energy in children. Iodine deficiency is the single most important and
preventable cause of mental retardation worldwide. Iodine deficiency
can be avoided by using salt that has been fortified with iodine. As per
NFHS-3 (2005-06), 76.1% of the households were using iodized salt .
The level has improved to 93.1% as per NFHS-4(2015-16). The use of
adequately iodized salt was higher in urban areas (96.5%) than in rural
areas (91.4%).
*****

SAARC Development Goals : India Country Report – 2017 Page 38
Goal 4 : Ensure a Robust Pro-Poor Growth Process
4.1 Social sector expenditure
The public investment in social infrastructure like education and
health is critical in the development of an economy. The government
has been raising the expenditure on social services by the Centre and
States as a proportion of GDP since 2014-15 and it is 7.4% in 2016-17
(BE) with improvement in both education and health sector.
Trends in Social Services Expenditure by General Government (Central and State Governments Combined)
In crore Item 2011-12 2012-13 2013-14 2014-15 2015-16
(RE) 2016-17
(BE) Total Expenditure 24,21,768 26,94,934 30,00,299 32,85,210 39,74,103 44,48,860
Expenditure on Social Services of which
5,80,868 6,58,320 7,46,391 7,67,622 10,02,591 11,18,094
i. Education 2,77,053 3,12,932 3,48,267 3,53,589 4,23,171 4,74,672 ii. Health 1,10,228 1,25,524 1,39,280 1,48,791 1,91,141 2,21,466 iii. Others 1,93,587 2,19,865 2,58,844 2,65,242 3,88,279 4,21,955
As percentage to GDP
Total Expenditure 27.7 27.1 26.7 26.4 29.1 29.5
Expenditure on Social Services of which
6.6 6.6 6.6 6.2 7.3 7.4
i. Education 3.2 3.1 3.1 2.8 3.1 3.2 ii. Health 1.3 1.3 1.2 1.2 1.4 1.5 iii. Others 2.2 2.2 2.3 2.1 2.8 2.8
As percentage to Total Expenditure
Expenditure on Social Services of which
24.0 24.4 24.9 23.4 25.2 25.1
i. Education 11.4 11.6 11.6 10.8 10.6 10.7 ii. Health 4.6 4.7 4.6 4.5 4.8 5.0 iii. Others 8.0 8.2 8.6 8.1 9.8 9.5
As percentage to Social Services
i. Education 47.7 47.5 46.7 46.1 42.2 42.5
ii. Health 19.0 19.1 18.7 19.4 19.1 19.8
iii. Others 33.3 33.4 34.7 34.6 38.7 37.7
Source: Economic Survey 2016-17

SAARC Development Goals : India Country Report – 2017 Page 39
The Government has increased budgetary allocations for anti-
poverty programmes and employment generation schemes with a view
to supplement the efforts for job creation. There has been highest ever
allocation under Mahatma Gandhi National Rural Employment
Guarantee Act (MGNREGA) during 2017-18. About 5.12 crore
households were provided employment totalling 235.4 crore person
days during 2016-17. Out of this 56% were generated by women, 21%
by SCs and 18% by STs.
4.2 Growth in financial inclusion
The launch of Pradhan Mantri Jan Dhan Yojana (PMJDY) in August
2014 has committed India to an ambitious agenda of financial inclusion
in mission mode. The growth Basic Savings Bank Deposit Account
(BSBD) accounts, introduced specifically for unbanked persons, is a key
parameter for assessing growth in financial inclusion. After the launch
of PMJDY, the number of BSBD accounts rose rapidly from 25.54 crore
in July 2014 to 51.50 crore by December 2016, of which 26.20 crore
were accounts opened under PMJDY. Since then, another 2.56 crore
BSBD accounts have been opened under PMJDY, raising the total to
28.76 crore as on 31.5.2017.
4.3 Income/consumption Inequality
The Human Development Report (HDR) of United Nations
Development Programme (UNDP) estimates the human development
index in terms of three basic capabilities: to live a long and healthy life,
to be educated and knowledgeable, and to enjoy a decent economic
standard of living. The 2016 report presents HDI for India for 2015, as
0.624, ranking it 131 out of 188 countries and the Gender Development
Index (GDI) value as 0.819.
HDR measures inequality in terms of two indicators. The first
indicator is the income Gini coefficient which measures the deviation of

SAARC Development Goals : India Country Report – 2017 Page 40
distribution of income (or consumption) among the individuals within a
country from a perfectly equal distribution. For India, the income Gini
coefficient was 35.2 in 2010-15. The second indicator is the quintile
income ratio, which is a measure of average income of the richest 20
per cent of the population to that of poorest 20 per cent. The quintile
income ratio for India was 5.3 in 2010-15.
4.4 Employment growth
As per the 68th NSS round, about 55% of the rural males, 25 per
cent of the rural females, 56% of the urban males and 16 per cent of
the urban females were in the labour force in usual status (ps+ss).
Between NSS 66th round (2009-10) and 68th round (2011-12), labour
force participation rate (LFPR) in usual status (ps+ss) for rural males and
urban males remained at the same level, decreased by 1 percentage
point for rural females and increased by about 1 percentage point for
urban females.
The worker population ratio (WPR) in usual status (ps+ss) was
about 39 per cent at the all-India level. It was about 40 per cent in rural
areas and 36 per cent in urban areas. The WPR in usual status (ps+ss)
was 54 per cent for rural males, 25 per cent for rural females, 55 per
cent for urban males and 15 per cent for urban females.
The WPR in current daily status (CDS) was about 34 per cent at
the all-India level. The WPR in CDS was about 50 per cent for rural
males, 17 per cent for rural females, 53 per cent for urban males and 13
per cent for urban females. Between 2009-10 and 2011-12, WPR in
usual status (ps+ss) decreased by about 1 percentage point for rural
females, increased by about 1 percentage point for urban females and
remained almost at the same level for males of both rural and urban
areas.

SAARC Development Goals : India Country Report – 2017 Page 41
As per the 5th Annual Employment & Unemployment Survey
2015-16, the LFPR was estimated to be 53 per cent in the rural sector
whereas in the urban sector the LFPR was 43.5 per cent under the
Usual Principal Status (UPS) approach. LFPR for different categories
based on UPS approach is as below
Sector Male Female Transgender Person
Rural 77.3 26.7 51.1 53.0
Urban 69.1 16.2 41.2 43.5
Rural + Urban 75.0 23.7 48.0 50.3
The unemployment rate is estimated to be 5.0 per cent at All
India level under the UPS approach as per the 5th Annual Employment
& Unemployment Survey 2015-16. The unemployment rate (in percent)
for different categories based on UPS approach is given below.
Sector Male Female Transgender Person
Rural 4.2 7.8 2.1 5.1
Urban 3.3 12.1 10.3 4.9
Rural + Urban 4.0 8.7 4.3 5.0
*****

SAARC Development Goals : India Country Report – 2017 Page 42
Goal 5 : Strengthen Connectivity of Poorer Regions and of Poor as
Social Group
5.1 Transport connectivity
India has one of the largest road networks comprising expressways,
national highways, state highways, major district roads, other district
roads, and village Roads. The national highways (NHs) serve as the
arterial network of the country. The Ministry of Road Transport and
Highways (MoRTH), New Delhi has taken up development of NHs under
various phases of National Highways Development Project (NHDP),
Special Accelerated Road Development Programme for the North East
Region (SARDP-NE). MoRTH gives due considerations for expansion of
the National Highways network from time to time keeping in view the
requirements of connectivity, inter-se priority and availability of funds.
NHDP is improving arterial routes of NH Network to international
standards.
The road network of the country consists of National Highways
(NH), State Highways (SH), Other Public Works Departments (OPWD)
Roads, Rural Roads, Urban Roads and Project Roads. The trend in the
progress of road length under different categories is given below. Road Network by Categories (in Kilometres)
Road Category
1950-51 1960-61 1970-71 1980-81 1990-91 2000-01 2013-14 2014-15
National Highways
19,811 (4.95)
23,798 (4.54)
23,838 (2.61)
31,671 (2.13)
33,650 (1.45)
57,737 (1.71)
91,287 (1.69)
97,991 (1.79)
State Highways
^ ^ 56,765 (6.20)
94,359 (6.35)
1,27,311 (5.47)
1,32,100 (3.92)
1,70,818 (3.16)
1,67,109 (3.05)
Other PWD Roads
1,73,723 (43.44)
2,57,125 (49.02)
2,76,833 (30.26)
4,21,895 (28.40)
5,09,435 (21.89)
7,36,001 (21.82)
10,82,267 (20.03)
11,01,178 (20.12)
Rural Roads
2,06,408 (51.61)
1,97,194 (37.6)
3,54,530 (38.75)
6,28,865 (42.34)
12,60,430 (54.15)
19,72,016 (58.46)
33,04,328 (61.16)
33,37,255 (61.00)
Urban Roads
0 (0.00)
46,361 (8.84)
72,120 (7.88)
1,23,120 (8.29)
1,86,799 (8.03)
2,52,001 (7.47)
4,57,467 (8.47)
4,67,106 (8.54)
Project Roads
0 (0.00)
0 (0.00)
1,30,893 (14.31)
1,85,511 (12.49)
2,09,737 (9.01)
2,23,665 (6.63)
2,96,319 (5.49)
3,01,505 (5.50)
Total 3,99,942 5,24,478 9,14,979 14,85,421 23,27,362 33,73,520 54,02,486 54,72,144
Note: Figures within parentheses indicate per cent to total road length in each road category. ^ Included in OPWD roads

SAARC Development Goals : India Country Report – 2017 Page 43
The total road length of the country increased significantly from 3.99
lakh kms in 1951 to 54.72 lakh kms as on 31st March 2015. 61% of total
road network belongs to rural roads.
Source: Ministry of Road Transport and Highways
Sustained economic development and expanding road network have led to rapidly increasing motorized vehicles in India. The total number of registered motor vehicles has increased from about 0.3 million in 1951 to 210 million in 2015. The total registered motor vehicles in the country grew at a Compound Annual Growth Rate of around 10% between 2005 and 2015.
Growth in registered motor vehicles
Source: Ministry of Road Transport and Highways

SAARC Development Goals : India Country Report – 2017 Page 44
5.2 Communications connectivity
The telecom sector has witnessed a substantial increase in the
number of subscribers during the last few years. As on 31st May 2017,
the overall telecom subscriber base has increased to 1204.98 million as
compared to 1058.86 million at the end of financial year 2015-16, an
increase of 146.12 million.
The wireline subscriber base has declined to24.16 million as on
31st May 2017 from 25.22 million subscribers as on 31st March, 2016.
During the same period, wireless subscriber base recorded an increase
of 147.19 million, and also the overall teledensity increased to 93.61.
Source: Telecom Regulatory Authority of India (TRAI)
Source: Telecom Regulatory Authority of India (TRAI)
0
10
20
30
40
Mar-13 Mar-14 Mar-15 Mar-16 May-17
30.21 28.50 26.59 25.22 24.16
Wir
elin
e s
ub
scri
be
rs (
in
mill
ion
s)
Wireline subscribers in last 5 years
0
500
1000
1500
Mar-13 Mar-14 Mar-15 Mar-16 May-17
867.8 904.51 969.89 1033.631180.82
Wir
ele
ss s
ub
scri
be
rs (
in
mill
ion
s)
Wireless subscribers in last 5 years

SAARC Development Goals : India Country Report – 2017 Page 45
Source: Telecom Regulatory Authority of India (TRAI)
5.3 Access to electricity
Government of India has launched the scheme Deendayal Upadhyaya Gram Jyoti Yojana (DDUGJY) for rural electrification subsuming the Rajiv Gandhi Grameen Vidyutikaran Yojana (RGGVY). Out of the 18,452 un-electrified census villages in the country, 13,469 villages have been electrified up to 15th May, 2017. As compared to
2013-14, five times more Villages were electrified in 2016-17 under DDUGJY and 256.81 lakh free electricity connections have been released to BPL households up to 30th April 2017.
5.4 Mass media connectivity
Radio is one of the most popular and affordable means for mass communication, largely owing to its wide coverage, terminal portability, low set up costs and affordability. The radio sector in the country witnessed another expansion with the opening up of Community Radio Stations (CRS) with a huge potential in India for establishment of CRS given the vast landscape of this country, numerous languages, various cultures and diverse social stratification. Community Radio broadcasting serves the purpose of networking of small communities with an objective to focus on the common man’s day-to-day concerns and help them realize local aspirations. CRS are set up with the involvement of various educational institutions and civil society
73.32 75.23 79.38 83.3693.61
0
20
40
60
80
100
Mar-13 Mar-14 Mar-15 Mar-16 May-17
Growth of Teledensity

SAARC Development Goals : India Country Report – 2017 Page 46
organizations. As on March 2016, out of the 237 licenses issued for the setting up of community radio stations, 191 community radio stations have become operational.
The cable and satellite television market in India emerged in the early 1990s. Cable TV services in India are regulated as per the Cable Television Networks (Regulation) Act, 1995 and the regulations, orders and directions issued by TRAI, The DTH services were permitted under the Policy Guidelines on DTH services issued by Government of India on 15.3.2001. The first DTH service provider operationalized its services in 2003. Internet Protocol Television (IPTV) Services in India are regulated as per the 'Guidelines for provisioning of IPTV services' issued by MIB in 2008. The industry has experienced rapid growth, with the number of subscribers increasing from just 0.41 million in 1992 to more than 175 million by the end of 2015. India has a large broadcasting and distribution sector, comprising 892 television channels (as on 30.11.2016), 229 permanent and 830 provisional Multi System Operators (MSOs) registered with the Ministry of Information & Broadcasting, 7 DTH/ satellite TV operators, 2 HITS operators and several IPTV service providers. Ministry has permitted 899 channels in India by 31st December 2016. India has 175 million TV households.
The Print Media is one of the most important pillars of
democratic system in India, which is the largest democracy in the world. As many as 1,10,851 publications (Newspapers & Other periodicals) have been registered in India till 31st March, 2016 witnessing a constant growth of the Print Media. The growth in the number of registered publications as well as their circulation proves that proliferation of audio, visual and digital media have not adversely affected the Print Media. It continues to empower the common man to assert his right and to participate in the strengthening of the democracy. As on 31st March, 2016, there were 1,10,851 registered publications on record as against 1,05,443 at the end of March, 2015. The total circulation of publications increased from 51,05,21,445 copies per publishing day in 2014-15 to 61,02,38,581 copies per publishing day in 2015-16.

SAARC Development Goals : India Country Report – 2017 Page 47
Circulation of registered publications
Source: Report ‘Press in India’, Office of the Registrar of Newspapers for India (RNI)
*****

SAARC Development Goals : India Country Report – 2017 Page 48
Goal 6 : Reduce Social and Institutional Vulnerability of Poor, Women
and Children
6.1 Working Children
As per the Child Labour (Prohibition & Regulation) Act, 1986,
employment of children below the age of 14 years is prohibited in
notified hazardous occupations and processes. The Act also regulates
employment of children in non-hazardous occupations and processes.
There are at present 18 hazardous occupations and 65 processes,
where employment of children is prohibited. Some of the important
prohibited occupations and processes are: carpet weaving, building and
construction work, brick kilns, production of hosiery goods, work as
domestic servants, in tea-shops, road side eateries, mechanized fishing,
beverage industry, warehousing, etc. The Act also regulates the working
conditions of children in other employments which are not prohibited
under the Child Labour (Prohibition & Regulation) Act, 1986.
The total number of working children in the age group of 5-14
years has declined to 43.53 lakh as per the Census 2011 from 1.26
crore(Census 2001). As per the NSSO estimates, the numbers of
working children estimated at 90.75 lakh in 2004-05 have reduced to
49.84 lakh in 2009-10.
6.2 Women in employment
Women form an integral part of the Indian workforce. As per
Census 2011, the total number of female workers in India is 149.8
million and female workers in rural and urban areas are 121.8 and 28.0
million respectively, 35.9 million females are working as cultivators and
another 61.5 million are agricultural labourers. Of the remaining female
workers, 8.5 million are in household Industry and 43.7 million are
classified as other workers.

SAARC Development Goals : India Country Report – 2017 Page 49
As per fifth Annual Employment Unemployment Survey
conducted by Labour Bureau in 2015-16, Female Labour Force
Participation Rate is 23.7% as compared to 25.8% in 2013-14.
6.3 Early marriage
As per SRS, the mean age at marriage for women was 19.3 years
in 1990 which increased to 22.1 years in 2015. The proportion of
females whose age at effective marriage is less than 18 years declined
to 2.2 percent.
6.4 Birth Registration
India is signatory to the United Nations Convention on the
Rights of the Child that has recognized birth registration as one of the
first rights of children. It is the right of every child to have his or her
birth registered and provided with a birth certificate free of charge. A
birth certificate is the first legal document confirming identity of the
individual. In India, the registration of births and deaths is compulsory
under the Registration of Births and Deaths (RBD) Act of 1969. The
number of reported registered births has reached to 23.1 million in
2015 as compared to 8.6 million in 1981. The share of registered births
to total estimated births under SRS is increasing year by year which
indicate significant improvement in birth registration. The level of
registration of births has increased from 84.4 per cent in 2012 to 88.3
per cent in 2015.
6.5 Sex ratio at birth
According to SRS, the sex ratio at birth (number of female per
1000 male) for the country has gone down by 6 point to 900 in 2013-15
from 906 in 2012-14. At national level the sex ratio at birth was 907 in
rural areas and 905 in urban areas during 2012-14 which has decreased

SAARC Development Goals : India Country Report – 2017 Page 50
to 903 in rural areas and 890 in urban areas during 2013-2015. The
prevailing trend of sex ratio is given below:
Year Total Rural Urban
2009-11 906 907 900
2010-12 908 909 904
2011-13 909 910 906
2012-14 906 907 905
2013-15 900 903 890
*******

SAARC Development Goals : India Country Report – 2017 Page 51
Goal 7 : Ensure Access to Affordable Justice
7.1 Average time required in disposal of legal disputes In order to ensure speedy and fair disposal of legal disputes,
various initiative have been undertaken by Government of India
including appointment of Judges in higher judiciary. 86 additional
Judges have been made permanent, 51 new appointed and
appointments of another 170 are being processed. Judges’ sanctioned
strength of the High Courts increased from 906 on 01.06.2014 to 1065
as on 27.4.2016. A Centrally Sponsored Scheme for Development of
Infrastructure facilities for judiciary has been implemented which has
enhanced the availability of judicial infrastructure for subordinate
courts considerably in the recent past. 16,513 Court Halls were
available and 2,447 under construction as on 31.12.2015. eCourts
Mission Mode Project has been taken up for universal computerization
of district and subordinate courts with an objective of providing
designated services to litigants, lawyers and the judiciary. As on 1st
May, 2017, total 60,751 cases were pending as against 61,300 cases as
on 1st March, 2015 in the Supreme Court of India.
7.2 Access to alternate disputes resolution LokAdalat is one of the alternative dispute redressal
mechanisms where disputes/cases pending in the court of law or at
pre-litigation stage are settled/ compromised amicably. LokAdalats
have been given statutory status under the Legal Services Authorities
Act, 1987. Under this Act, an award made by a LokAdalat is deemed to
be a decree of a civil court and is final and binding on all parties and no
appeal lies against thereto before any court. National Level LokAdalats
are held for at regular intervals where on a single day LokAdalats are
held throughout the country, in all the courts right from the Supreme
Court till the Taluk Levels wherein cases are disposed off in huge
numbers.

SAARC Development Goals : India Country Report – 2017 Page 52
Permanent LokAdalat have been set up as permanent bodies
with a Chairman and two members for providing compulsory pre-
litigative mechanism for conciliation and settlement of cases relating to
Public Utility Services like transport, postal, telegraph etc. Further, the
Award of the Permanent LokAdalat is final and binding on all the
parties. The jurisdiction of the Permanent LokAdalats is upto Rs. Ten
Lakhs. The LokAdalat may conduct the proceedings in such a manner as
it considers appropriate, taking into account the circumstances of the
case, wishes of the parties like requests to hear oral statements, speedy
settlement of dispute etc.
Mobile LokAdalats are also organized in various parts of the
country which travel from one location to another to resolve disputes
in order to facilitate the resolution of disputes through this mechanism.
As on 30.06.2017, around 17.46 lakhs LokAdalats have been
organized in the country since its inception, which have settled more
than 20 crore cases so far.
7.3 Access to free legal aid for the poor (marginalized group) Article 39A of the Constitution of India provides for free legal aid
to the poor and weaker sections of the society and ensures justice for
all. Articles 14 and 22(1) of the Constitution also make it obligatory for
the State to ensure equality before law and a legal system which
promotes justice on the basis of equal opportunity to all. In 1987, the
Legal Services Authorities Act was enacted by the Parliament which
came into force in November 1995 to establish a nationwide uniform
network for providing free and competent legal services to the weaker
sections of the society on the basis of equal opportunity. The National
Legal Services Authority (NALSA) has been constituted under the Legal
Services Authority Act, 1987 to monitor and evaluate implementation
of legal aid programmes and to lay down policies and principles for
making legal services available under the Act.

SAARC Development Goals : India Country Report – 2017 Page 53
In every State, a State Legal Services Authority and in every High
Court, a High Court Legal Services Committee has been constituted.
District Legal Services Authorities and Taluk Legal Services Committees
have been constituted in the Districts and most of the Taluks to give
effect to the policies and directions of the NALSA and to provide free
legal services to the people and conduct LokAdalats in the State.
Supreme Court Legal Services Committee has been constituted to
administer and implement the legal services programme in so far as it
relates to Supreme Court of India. The main functions of these
Authorities and Committees are to (i) provide free legal services to the
eligible persons, (ii) organize LokAdalats for amicable settlement of
disputes, and (iii) organize legal awareness camps in the rural areas.
The free legal services include payment of court fee, process fee
and all other charges payable or incurred in connection with any legal
proceedings, providing advocate in legal proceedings, etc. Eligible
persons for getting free legal services include women and children;
members of SC/ST; industrial workmen, victims of mass disaster,
violence, flood, drought, earthquake, industrial disaster; disabled
persons; persons in custody; persons whose annual income does not
exceed `50,000/-; and victims of trafficking in human beings or beggar.
Number of persons benefitted through legal services and advice under legal services authorities Act, 1987, since inception (As on 30.06.2017)
Category Number of Beneficiaries SC 17,07,814 ST 6,94,528 BC 13,22,059 Women 15,91,492 Children 2,24,593 In-custody 7,01,399 General 96,46,736 Total 1,58,88,621
*****

SAARC Development Goals : India Country Report – 2017 Page 54
Goal 8 : Ensure Effective Participation of Poor and Women in Anti-Poverty Policies and Programmes
8.1 Women in Parliament India is the first country where, since independence, women have
the right to vote to elect representatives for the National Parliament as
well as State Assemblies. The women have equal right to contest any
election subject to the fulfilment of other eligibility conditions. So far,
16 General Elections have been held for the LokSabha (Lower House).
Proportion of Seats held by Women in National Parliament
Reference
Year
Number Share (%)
LokSabha RajyaSabha Total
2004 45 of 544 28 of 250 73 of 794 9.2
2007 47 of 544 25 of 250 72 of 794 9.1
2009 59 of 545 21 of 234 80 of 779 10.3
2011 60 of 544 26 of 241 86 of 785 10.9
2014 66 of 544 31 of 241 97 of 785 12.3
Sep 2017 64 of 542 28 of 241 92 of 783 11.7 *2017 figures as on 28.09.2017
The Constitution (73rd Amendment) Act, 1992 that came into
effect in April 1993 has brought about major reform in local governance
in the country. Although the Panchayats have historically been an
integral part of rural life in India, this Act combined with some other
Acts have institutionalised the Panchayati Raj Institutions (PRIs) at the
village, intermediate, and district levels as the third tier of government.
The aim has been to combine social justice with effective local
governance, with an emphasis on reservation of seats for the deprived
classes of population, including of the leadership positions.
Participation of women in the Panchayats was also facilitated by the
Constitution (73rd Amendment) Act, 1992 which mandated one-third

SAARC Development Goals : India Country Report – 2017 Page 55
reservation of seats at all three tiers of Panchayats for women. Since its
inception, Panchayati Raj in India has seen improvement in women’s
political participation. While many faced resistance initially to their
presence in offices of responsibility, over time, acceptance of women
within the Panchayati Raj framework has been increasing. Around 46%
elected representatives of PRIs are women.
8.2 Gender Budget
Gender Budget Statement was first introduced in Budget 2005-
06. In order to make further refinement to the Statement, every year
the Ministries/Departments are requested through the Annual Budget
Circular to highlight the quantum of public expenditure earmarked in
budget for women.
On the basis of the information thus furnished by the
Ministries/Departments, the Gender Budget Statement is prepared.
This Statement indicates, in two parts, the budget provisions for
schemes that are substantially meant for the benefit of women. Part A
details schemes in which 100% provision is for women, Part B reflects
schemes where the allocations for women constitute at least 30% of
the provision. The rationale of Gender Budgeting arises from the
recognition of the fact that the national budget impacts various
sections of the society differently, through the pattern of resource
allocation and priority accorded to competing sectors. Gender
Budgeting in its simplest connotation is 'Gender Analysis' of the budget
aimed at examining the budgetary allocation through a gender lens.
The purpose of gender budgeting is to monitor expenditure and public
service delivery from a gender perspective, as a means of
mainstreaming women's concerns in all activities and improving their
access to public resources. This statement has received an impetus over
the last ten budgets with growing awareness of gender sensitivities.
Gender Budgeting is an evolving area where, with better understanding

SAARC Development Goals : India Country Report – 2017 Page 56
and appreciation of the subject, more and more
Ministries/Departments are reviewing programmes and schemes to
address the quantum of resources that have the budgetary potential to
impact and address the development needs of women. The budgetary
allocations have been increased from around 80,000 crores in RE 2015-
16 to more than 90,000 crores in BE 2016-17.
(In Rupees crores)
Period Plan Non-Plan Total
2015-16(BE) 73,416 5,841.87 79,257.87
2015-16(RE) 75,391.21 5,857.91 81,249.12
2016-17(BE) 84,279.27 6,345.49 90,624.76
Source: India budget (Expenditure Budget Vol. I, 2016-2017)
*****

SAARC Development Goals : India Country Report – 2017 Page 57
Chapter 2 :Health SDGs
Goal 9
Maternal health
Goal 10
Child health
Goal 11
Affordable health care
Goal 12
Improved hygiene and public health

SAARC Development Goals : India Country Report – 2017 Page 58
Chapter 2 : Health Goals
Goal 9 : Maternal Health
9.1 Maternal Mortality Ratio (MMR) The Maternal Mortality Ratio (MMR)is the number of women who
die from any cause related to or aggravated by pregnancy or its
management (excluding accidental or incidental causes) during
pregnancy and childbirth or within 42 days of termination of pregnancy,
irrespective of the duration and site of the pregnancy, per 100,000 live
births.
The national MMR level has come down from 212 per 100,000 live
births in 2007-2009 to 167 per 100,000 live births in 2011-13,
registering a decline of 21.22% over a span of four years.
9.2 Percentage of births covered by skilled birth attendants
Life risk in motherhood is gradually diminishing across the
country mainly due to promotion of reproductive healthcare facilities
through government-run programmes. From 46.6% deliveries attended
by skilled health personnel in 2005-06, the proportion has increased to
81.4% in 2015-16 as per NFHS-4.
0
100
200
300
400
1999-2001 2001-03 2004-06 2007-09 2009-11 2011-13
327 301254
212178 167
Maternal Mortality Ratio

SAARC Development Goals : India Country Report – 2017 Page 59
At the all India level, the coverage of institutional births
increased from 38.7% in 2005-06 to 78.9% in 2015-16 as per NFHS-4.
9.3 Life expectancy Life expectancy in India shows a continuous increasing trend.
From 60.3 years in 1991-95, it has gone up to 67.9 years in 2010-14.
The life expectancy of women in India is more than that for men. It was
60.9 years in 1991-95 for women compared with 59.7 years for men
and rose to 70.0 years in 2011-15 for women as against 66.9 years for
men in the same period.
9.4 Age specific fertility rates of 15 to 24 years girls The Age-Specific Fertility Rate (ASFR) is defined as the number
of live births in a particular age group per thousand female populations in the same age-group in a given year. The ASFR in India shows a declining trend across different age-groups. The ASFR in the age-group 15-19 years was 51.1 in 2000 which has come down to 11.1 in 2015. Similarly, ASFR for the women in the age-group 20-24 years was 218.7 in 2000 which has come down to 173.8 in 2015.
*****

SAARC Development Goals : India Country Report – 2017 Page 60
Goal 10 : Child Health
10.1 Immunisation coverage
Universal immunization of children against the six vaccine-
preventable diseases (namely, tuberculosis, diphtheria, whooping
cough, tetanus, polio, and measles) is crucial to reducing infant and
child mortality. According to the guidelines developed by the World
Health Organization, children are considered fully vaccinated when they
have received a vaccination against tuberculosis (BCG), three doses of
the diphtheria, whooping cough (pertussis), and tetanus (DPT) vaccine;
three doses of the poliomyelitis (polio) vaccine; and one dose of the
measles vaccine by the age of 12 months.
Immunization Programme in India was introduced in 1978 as
Expanded Programme of Immunization (EPI), gained momentum in
1985 and was expanded as Universal Immunization Programme (UIP) to
be implemented in phased manner to cover all districts in the country
by 1989-90. UIP become a part of Child Survival and Safe Motherhood
Programme in 1992. Since, 1997, immunization activities have been an
important component of National Reproductive and Child Health
Programme and is currently one of the key areas under National Health
Mission (NHM) since 2005. Under the Universal Immunization
Programme, Government of India is providing vaccination to prevent 11
vaccine preventable diseases nationally, i.e. Diphtheria, Pertussis,
Tetanus, Polio, Measles, severe form of Childhood Tuberculosis and
Hepatitis B and meningitis & pneumonia caused by Haemophilus
influenza type B; and against Rubella & Rotavirus Diarrhea in selected
states and Japanese Encephalitis in endemic districts.
The proportion of children fully immunized has increased to 62% in
NFHS-4 (2015-16) from 44% in NFHS-3 (2005-06). A significant increase

SAARC Development Goals : India Country Report – 2017 Page 61
in the coverage of individual vaccines viz. BCG, DPT and measles is
visible in NFHS-4 as compared to NFHS-3.
The vaccination coverage is higher in urban areas than rural areas
but the gap has come down significantly. 63.9% children are fully
immunized in urban area whereas the coverage is 61.3% in rural areas
as per NFHS-4.
10.2 Under 5 mortality The Under-Five Mortality Rate (U5MR) is the probability
(expressed as a rate per 1000 live births) of a child born in a specified
year dying before reaching the age of five if subjected to current age-
specific mortality rates. According to SRS 2015, U5MR at national level
stood at 43 in 2015 compared to 49 in 2013.
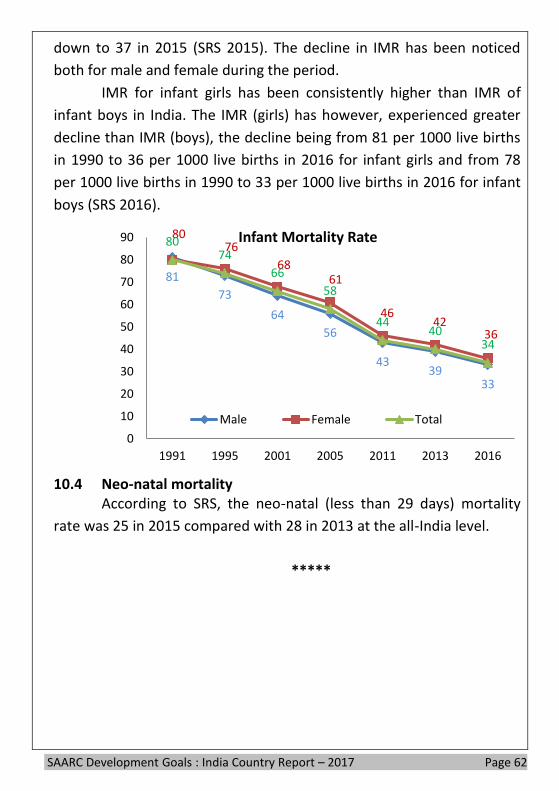
10.3 Infant Mortality The number of infant deaths in less than a year of birth per 1000
live births is referred to as Infant Mortality Rate (IMR). The country has
observed a continuous decline in IMR. From 40 in 2013 it has come
6254 52
42
25
7263
5551
42
78 78
5559
44
92
7378 81
62
0
10
20
30
40
50
60
70
80
90
100
BCG 3 Polio 3 DPT Measles All
% children aged 12-23 months
Trends in Vaccination
NFHS-1 (1992-93) NFHS-2 (1998-99) NFHS-3 (2005-06) NFHS-4 (2015-16)
SAARC Development Goals : India Country Report – 2017 Page 62
down to 37 in 2015 (SRS 2015). The decline in IMR has been noticed
both for male and female during the period.
IMR for infant girls has been consistently higher than IMR of
infant boys in India. The IMR (girls) has however, experienced greater
decline than IMR (boys), the decline being from 81 per 1000 live births
in 1990 to 36 per 1000 live births in 2016 for infant girls and from 78
per 1000 live births in 1990 to 33 per 1000 live births in 2016 for infant
boys (SRS 2016).
10.4 Neo-natal mortality
According to SRS, the neo-natal (less than 29 days) mortality
rate was 25 in 2015 compared with 28 in 2013 at the all-India level.
*****
81
73
64
56
4339
33
8076
6861
4642
36
8074
66
58
4440
34
0
10
20
30
40
50
60
70
80
90
1991 1995 2001 2005 2011 2013 2016
Infant Mortality Rate
Male Female Total

SAARC Development Goals : India Country Report – 2017 Page 63
Goal 11 : Affordable Healthcare
The country has a well-structured 3-tier public health
infrastructure, comprising Community Health Centres, Primary Health
Centres and Sub-Centres spread across rural and semi-urban areas and
tertiary medical care providing multi-speciality hospitals and medical
colleges located almost exclusively in the urban areas. Improvements in
health indicators can be attributed, in part to this network of health
infrastructure. However, the progress has been quite uneven across the
country.
11.1 Out of pocket expenditure on health
The NSS Household Consumer Expenditure Surveys gives the
percentage share in consumer expenditure of item group ‘medical care’
of the miscellaneous goods and services category. This percentage has
increased from 5.3 (1993-94) to 6.9 (2011-12) for rural areas and from
4.6 to 5.5 in urban areas.
11.2 Government expenditure on health
The General Government (Central and State Governments
combined) expenditure on health was 1.5% of the GDP in 2016-17
(budget estimate). The expenditure on health was 5.0% of total
expenditure and the expenditure on health was 19.8% of social services
expenditure in 2016-17(budget estimate) which has been increasing
over the years.

SAARC Development Goals : India Country Report – 2017 Page 64
Source: Economic Survey 2016-17
11.3 Availability of doctors As per the National Health Profile, the population served per allopathic
doctor in India was 1250 whereas there was one AYUSH doctor
available per 1630 persons in 2016.
National Councils Registered Population served per Allopathic
Doctor/AYUSH Doctor/Dental
Surgeon
2014 2016
Allopathic Doctor 1319 1250
AYUSH Doctor 1682 1630
Dental Surgeon 8022 6359
Source: National Health Profile, CBHI, Ministry of Health and Family Welfare
*****
1.3 1.3 1.2 1.2 1.4 1.5
4.6 4.7 4.6 4.5 4.8 5
19 19.1 18.7 19.4 19.1 19.8
2011-12 2012-13 2013-14 2014-15 2015-16 RE 2016-17 BE
Share of Health in General Government Expenditure (%)
In GDP In Total Expenditure In Social Services Expenditurre

SAARC Development Goals : India Country Report – 2017 Page 65
Goal 12 : Improved Hygiene and Public Health
12.1 Access to safe drinking water Revised National Rural drinking water programme (NRDWP)
launched in 2009 is a centrally sponsored scheme to provide adequate
and safe drinking water to the rural population of the country.
The overall proportion of households having access to improved
water sources increased from 68.2% in 1992-93 to 89.9% in 2015-16.
The urban coverage increased from 87.6% to 91.1% and the rural
coverage from 60.9% to 89.3% during the same period.
Proportion of households having access to improved water sources
Year Urban Rural All India
1992-93 87.6% 60.9% 68.2%
1998-99 92.6% 72.3% 77.9% 2005-06 95% 84.5% 87.6% 2015-06 91.1% 89.3% 89.9%
Source: NFHS 1992-93, 1998-99 ,2005-06and 2015-16
The Physical and Financial performance under NRDWP is shown below:
Physical Performance
Status of coverage of rural population* (in %age) in last 3 years
As on Fully covered Partially
covered
Quality Affected
01.04.2014 69.73% 24.96% 5.31%
01.04.2015 71.25% 24.45% 4.30%
01.04.2016 71.13% 23.44% 5.43%
*as per Integrated Management Information System (IMIS)

SAARC Development Goals : India Country Report – 2017 Page 66
12.2 Access to sanitation facility According to Census 2001, 36.4% of the households had access
to latrine which increased to 46.9% in Census 2011. The access to
latrine for rural households increased from 21.9% in 2001 to 30.7% in
2011. For urban households, it increased from 73.7% in 2001 to 81.4%
in 2011. However, as per NSS 69th round 2012, 38.8% rural and 89.6%
urban households had access to improved source of latrine.
Ministry of drinking water and sanitation has been monitoring
the Swachh Bharat Mission Gramin (SBM-G) and as on 29.05.2017, 139
Districts, 1351 Blocks, 92393 Gram Panchayats and 200959 Villages
have been declared Open Defecation Free (ODF).
Further, as per the baseline survey conducted in 2012-13 by the
states, the rural sanitation coverage was 38.55%. Sanitation Coverage
increased to 41.80% on 2nd October 2014 and has further increased to
64.11% as on 29.05.2017. Sanitation Coverage during last 3 years and
current year is as under:-
2014-15 2015-16 2016-17 2017-18
(As on 29.5.2017)
Sanitation
Coverage
44.53 51.57 63.68 64.11
Source: Ministry of Drinking Water and Sanitation
The number of people defecating in open in rural India has reduced
from 550 million at the start of SBM-G (Oct 2014) to 350 million as on
29.05.2017.
12.3 Programmes on communicable diseases The National AIDS Control Programme (NACP) has been
implemented by Government of India as 100% centrally sponsored
scheme through State AIDS Control Societies in the states for
prevention and control of HIV/AIDS in the country. The unique
strengths that contribute to success of NACP in India include prevention
focused policies, evidence driven strategies, community-centric
approaches, designs for scale, dynamic multi-stakeholder response,

SAARC Development Goals : India Country Report – 2017 Page 67
openness for innovation and country stewardship. NACP has evolved
through three phases of implementation and is currently in its fourth
phase (2012-2017) which aims to reduce new infections by 50% (2007
Baseline of NACP-III) and to provide comprehensive care and support to
all persons living with HIV/AIDS and treatment services for all those
who require it.
The Government of India is implementing National Vector Borne
Disease Control Programme in the country for prevention & control of
six vector borne diseases namely Malaria, Japanese Encephalitis,
Dengue, Chikungunya, Kala-azar and Filaria. The States/UTs implement
the programme activities and the technical guidance as well as financial
assistance is provided by Government of India. Diagnostic & treatment
facilities are provided in all government health institutions including
hospitals and further supported under National Health Mission through
ASHAs’. For prevention of mosquitoes breeding in hospitals and other
public places, source reduction through Information Education and
Communication involving communities and health care functionaries
and engineering methods are carried out. In addition, anti larval
activities using chemical, bio-larvicide, larvivorous fish are also carried
out.
12.4 Prevalence of HIV/AIDS, TB, Malaria According to HIV Sentinel Surveillance (HSS) 2014-2015, the
overall HIV prevalence among ANC clinic attendees, considered a proxy
for prevalence among the general population, continues to be low at
0.29% in the country, with an overall declining trend at the national
level.
According to HIV Estimations 2015, the adult (15- 49 years) HIV
prevalence at national level continued its steady decline from the
estimated level of 0.41% in 2001 to 0.26% in 2015. In 2015, adult HIV
prevalence is estimated at 0.30% among males and at 0.22% among
females. The total number of people living with HIV (PLHIV) in India is

SAARC Development Goals : India Country Report – 2017 Page 68
estimated at 21.17 lakhs in 2015 compared with 22.26 lakhs in 2007.
Children (<15 years) account for 6.54%, while 40.5% of total HIV
infections are among females.
India accounts for one fourth of the global TB burden. In 2015,
an estimated 28 lakh cases occurred and 4.8 lakh people died due to
TB. An estimated 1.3 lakh incident multi-drug resistant TB patients
emerge annually in India which includes 79000 multi-drug resistant TB
Patients estimates among notified pulmonary cases. India bears second
highest number of estimated HIV associated TB in the world. An
estimated 1.1 lakh HIV associated TB occurred in 2015 and 37,000
estimated number of patients died among them. The incidence of TB
has reduced from 289 per lakh per year in 2000 to 217 per lakh per year
in 2015 and the mortality due to TB has reduced from 56 per lac per
year in 2000 to 36 per lac per year in 2015 (Source: WHO Global TB
Report, 2016)
Malaria continues to pose a major public health threat in
different parts of the country, particularly due to Plasmodium
falciparum as it is sometimes prone to complications and death, if not
treated early. Malaria cases were contained between 2 to 3 million
cases annually till 2001 afterwards the cases have further started
declining. During 2016, the malaria incidence was around 10.9 lakhs
cases, 7.16 lakhs Pf cases and 331 deaths.
3.03
2.03 2.09 1.821.60
1.1 1.2 1.1
1.18 1.04 1.010.81 0.83 0.722 0.779 0.716
0
200
400
600
800
1000
1200
0.00
0.50
1.00
1.50
2.00
2.50
3.00
3.50
1996 2000 2001 2005 2010 2014 2015 2016
Malaria Situation in the Country
Deaths Total cases (Million) Pf cases (million)

SAARC Development Goals : India Country Report – 2017 Page 69
Chapter 3 :Education Development Goals
Goal 13
Access to primary/community schools for all
children, boys and girls
Goal 14
Completion of primary education cycle
Goal 15
Universal functional literacy
Goal 16
Quality education at primary, secondary and
vocational levels

SAARC Development Goals : India Country Report – 2017 Page 70
Chapter 3 : Education Development Goals Goal 13: Access to Primary/Community Schools for all
Children, Boys and Girls
13.1 Access to Primary Schools by Distance Infrastructure in education system, in terms of distance from
school is one of the important factors affecting access to education
and attendance. Information had been obtained from all the sample
households in the NSS 71st round on distance from the nearest school
providing school education at primary, upper primary and secondary
level irrespective of whether any household member was studying in
that school.
In terms of physical access to primary schooling within less than 1
km, it is observed that there was no significant difference between
rural and urban India, but for upper primary and secondary schools the
gaps between rural and urban areas are quite prominent. More than
12% of rural households in India did not have any secondary schools
within 5 kilometers whereas in urban areas such cases are insignificant
(less than 1%).
Only 66.5% of rural households, compared to 82.9% of urban
households, had a school within a km providing Upper Primary level
classes. For secondary level classes, the proportion was only 36.7% for
rural compared to 72.7% for urban households.
Percentage Distribution of Households by Distance to Schools
Sector Level Distance (d) to nearest school
d < 1 km 1 km ≤ d < 2 km 2 km ≤ d < 5 km d ≥ 5 km Rural Primary 94.1 4.9 0.9 0.1
Upper Primary 66.5 19.0 12.1 2.4 Secondary 36.7 23.6 27.5 12.2
Urban Primary 92.5 6.5 0.8 0.1
Upper Primary 82.9 13.1 3.7 0.2 Secondary 72.7 18.7 8.0 0.7
Source: Key Indicators of Social consumption in India Education, 71st Round NSS, Jan-June, 2014.

SAARC Development Goals : India Country Report – 2017 Page 71
13.2 Enrolment
The enrolment in primary classes (class I-V) was 113.8 million in
2000-01 which increased to 129.12 million in 2015-16. The enrolment
in middle/upper primary classes (class VI-VIII) was 42.8 million in 2000-
01, increased to 67.59 million in 2015-16.
The Gross Enrolment Ratio (GER) at the primary level increased
from 95.7 in 2000-01 to 99.21 in 2015-16. For the middle/upper
primary level, the GER rose from 58.6 in 2000-01 92.81 in 2015-16.
The Net Enrolment Ratio (NER) for primary grade is the
proportion of students of official school age of 6-10 years enrolled in
Grades I-V to the population of children of age group 6-10 years. As per
DISE 2015-16, the national NER is 87.30 at primary level.
Gross Enrolment Ratio
2015-16
Net Enrolment Ratio
2015-16
Girls Boys Total Girls Boys Total
Primary 100.69 97.87 99.21 88.77 85.98 87.30
Upper Primary 97.57 88.72 92.81 78.68 71.35 74.74
Elementary 99.59 94.53 96.91 91.46 86.69 88.94
Secondary 80.97 79.16 80.01 51.93 50.66 51.26
Higher Secondary 56.41 55.95 56.16 32.67 31.97 32.30
Source: U-DISE-School Education In India-2015-16
13.3 Trends in Social Services Expenditure by General Government (Centre and States) as percentage to GDP
The Government has been striving to improve the level of
education of its citizens. There has been increase in the Government
expenditure in education sector over the years.

SAARC Development Goals : India Country Report – 2017 Page 72
(in percentage)
Items 2011-12 2012-13 2013-14 2014-15 2015-16(RE)
2016-17(BE)
Total Expenditure
27.7 27.1 26.7 26.4 29.1 29.5
Expenditure on Social Services
6.6 6.6 6.6 6.2 7.3 7.4
Of which Education
3.2 3.1 3.1 2.8 3.1 3.2
Source: Economic Survey 2016-17
13.4 Gender parity at primary and secondary level Education is one of the most important factor for ensuring
gender equality and empowerment. The Gender Parity Index (GPI) is
the ratio of the number of female students enrolled at primary,
secondary and tertiary levels of education to the corresponding
number of male student in each level. Thus GPI (based on GER) which is
free from the effects of the population structure of the appropriate age
group, provides picture of gender equality in education. During 2005-06
to 2014-15, substantial progress has been achieved towards gender
parity in education.
At present, in elementary and secondary education, the
enrolment is favourable to females as the corresponding GPI has
crossed the limit 1.
*****

SAARC Development Goals : India Country Report – 2017 Page 73
Goal 14 : Completion of Primary Education Cycle
14.1 Retention Rate The enrolment in Grade V (minus repeaters) in a year as a
proportion to enrolment in Grade I four years back is termed as
retention rate at the primary level. As per DISE 2015-16, the retention
rate at primary level has marginally increased whereas at elementary
level the increase is much more significant as compared to 2014-15.
Retention Rates at Primary and Elementary Levels
Year→ 2014-15 2015-16
Level ↓ Boys Girls Total Boys Girls Total
Primary Level
83.30 84.21 83.74 83.66 84.81 84.21
Elementary Level
66.68 68.14 67.38 70.02 71.43 70.70
Source: DISE 2015-16
It has been observed that retention rate in respect of girls is
better than that of boys both at primary and elementary level. As per
DISE 2015-16, the retention rate at secondary level is 57.42% in 2015-
16 as compared to 57.24 in 2014-15 at all India level. For boys, the
retention rate has marginally improved from 57.68% in 2014-15 to
58.12% in 2015-16 whereas for girls it has slightly come down to
56.66% in 2015-16 from 56.76% in 2014-15 at secondary level.
14.2 Drop-out rate With improvement in the number of schools, facilities in schools
and enrolment, the annual dropout rate at primary level has come
down by 1.28 percentage point (from 5.62% in 2011-12 to 4.13% in
2014-15) for all category students. At this level, the dropout rate for
boys and girls decreased by 1.53 percentage (from 5.89% to 4.36%) and

SAARC Development Goals : India Country Report – 2017 Page 74
1.46 (from 5.34% to 3.88%) percentage point respectively during this
period.
Average Annual Drop-Out Rate in School Education
Classes/ Year 2011-12*
2012-13*
2013-14*
2014-15*
Primary Boys 5.89 4.68 4.53 4.36
Girls 5.34 4.66 4.14 3.88
All 5.62 4.67 4.34 4.13
Upper Primary Boys 2.13 2.3 3.09 3.49
Girls 3.2 4.01 4.49 4.6
All 2.65 3.13 3.77 4.03
Secondary Boys NA 14.54 17.93 16.88
Girls NA 14.54 17.79 16.88
All NA 14.54 17.86 17.06
Senior Secondary Boys NA NA 1.48 0.25
Girls NA NA 1.61 NA
All NA NA 1.54 NA
Source: D/o School Education & Literacy *Figures are provisional.
*****
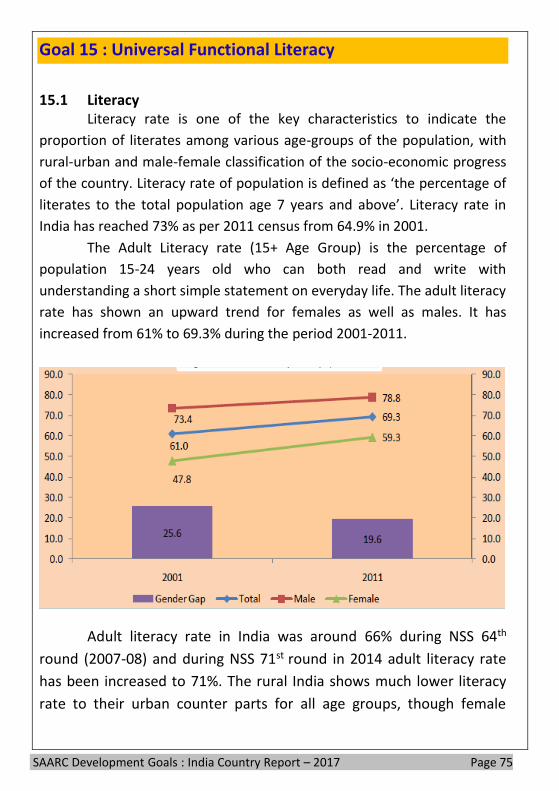
SAARC Development Goals : India Country Report – 2017 Page 75
Goal 15 : Universal Functional Literacy
15.1 Literacy Literacy rate is one of the key characteristics to indicate the
proportion of literates among various age-groups of the population, with
rural-urban and male-female classification of the socio-economic progress
of the country. Literacy rate of population is defined as ‘the percentage of
literates to the total population age 7 years and above’. Literacy rate in
India has reached 73% as per 2011 census from 64.9% in 2001.
The Adult Literacy rate (15+ Age Group) is the percentage of
population 15-24 years old who can both read and write with
understanding a short simple statement on everyday life. The adult literacy
rate has shown an upward trend for females as well as males. It has
increased from 61% to 69.3% during the period 2001-2011.
Adult literacy rate in India was around 66% during NSS 64th
round (2007-08) and during NSS 71st round in 2014 adult literacy rate
has been increased to 71%. The rural India shows much lower literacy
rate to their urban counter parts for all age groups, though female

SAARC Development Goals : India Country Report – 2017 Page 76
literacy rates especially in rural areas has increased markedly for all
ages.
Age Rural Urban Rural + Urban
M F T M F T M F T 2014 (NSS 71st Round)
Age15& above 75.0 53.1 64.1 89.7 77.9 84.0 79.8 60.8 70.5
All ages 72.3 56.8 64.7 83.7 74.8 79.5 75.7 62.0 69.1
2007-08(NSS 64th Round)
Age15& above 71.8 47.5 59.7 88.7 74.6 82.0 76.7 54.9 66.0
All ages 68.4 51.1 60.0 82.2 71.6 77.1 72.1 56.3 64.5
*****

SAARC Development Goals : India Country Report – 2017 Page 77
Goal 16 : Quality Education at Primary, Secondary and Vocational Levels
16.1 Trained Teachers The percentage of professionally trained teachers in all types of
schools is around or more than 70% in recent years. In 2015-16, there
are more than 80% professionally trained teachers.
Percentage of Professionally Trained Teachers
Grade/Year 2014-15 2015-16
Primary only 73.18 75.49
Upper Primary only 76.18 78.18
Secondary only 77.88 78.52
Higher Secondary only 69.73 64.45
Total 73.03 80.31
Source: U-DISE 2015-16
16.2 Student teacher ratio
The pupil (student) teacher ratio has changed from 43 students
per teacher for primary schools in 1990-91 to 23 during 2015-16, in
upper primary schools from 37 in 1990-91 to 17 students per teacher in
2015-16. This ratio stood at 27 and 37 for secondary and senior
secondary schools respectively during 2015-16. Year Primary
Schools Upper Primary Schools
Secondary Senior Secondary Schools
Higher Education
1990-91 43 37 NA 31 NA
2000-01 43 38 31 35 NA
2005-06 46 34 32 34 26
2010-11 43 33 30 34 26#
2013-14* 25 17 26 41 25#
2014-15* 24 17 27 38 24#
2015-16 23 17 27 37 24#
Source: Educational Statistics at a glance 2016, Statistics of School Education,DISE 2015-16. *Figure related to School Education are provisional for Higher Education. #Standalone Institutions have not been taken into account in PTR.

SAARC Development Goals : India Country Report – 2017 Page 78
16.3 Schools with toilets for girls Percentage of schools with Girls toilets have significantly
increased from 37% in 2005-06 to 97.6% in 2015-16, thus facilitating to enhance the enrolment of girls in schools.
Facility Indicators 2005-06 2010-11 2014-15 2015-16
Student-Classroom Ratio 39 31 27 27
% Schools with Drinking Water 83.1 92.7 96.1 96.8
% Schools with Common Toilet 52.4 - - -
% School with Boys’ Toilet - 42.6 95.4* 97.1
% School with Girls’ Toilet 37.4 60.3 87.1* 97.6
% School having Electricity - 43.1 58.9 61.7
% Schools with Computer 10.7 18.7 25.2 26.0
Source: U-DISE, Elementary Education in India 2015-16 * Single toilet in co-educational school is considered as boys’ toilet and multiple toilets for both boys & girls.
********

SAARC Development Goals : India Country Report – 2017 Page 79
Chapter 4 : Environment Goals
Goal 17 Acceptable level of forest cover
Goal 18 Acceptable level of water and soil quality
Goal 19 Acceptable level of air quality
Goal 20 Conservation of bio-diversity
Goal 21 Wetland conservation
Goal 22 Ban on dumping of hazardous waste,
including radio-active waste

SAARC Development Goals : India Country Report – 2017 Page 80
Chapter 4 : Environment Development Goals
Goal 17 : Acceptable Level of Forest Cover
17.1 Forest cover The forest cover includes all lands which have a tree canopy
density of more than ten percent when projected vertically on the
horizontal ground, with a minimum areal extent of one hectare. All the
tree species along with bamboos, fruit bearing trees, coconut, palm
trees etc. and all the areas including forest, private, community or
institutional lands meeting the above defined criteria, have been
termed as forest cover.
The forest cover of the country has been classified on the basis of tree
canopy density into pre-defined classes, viz., very dense forest (VDF),
moderately dense forest (MDF)
and open forest (OF). Scrub,
though shown separately, is not
counted in the forest cover.
As per current
assessment, India State of
Forest Report (ISFR) 2015, total
forest cover of the country is
701,673 km2 which is 21.34% of the geographical area of the country.
In terms of density classes, area covered by VDF is 85,904 km2 (2.61%),
that with MDF is 315,374 km2 (9.59%) and OF is 300,395 km2 (9.14%).
17.2 Extent of community/social forest National Forest Policy (1988) aims at maintaining two third of the
geographical area in hills of the country under forest and tree cover.
The forest cover in the hill districts of the country is 283,015 km2 which

SAARC Development Goals : India Country Report – 2017 Page 81
is 39.99% of the total geographical area of these districts. All districts
of the states of Arunachal Pradesh, Himachal Pradesh, Manipur,
Meghalaya, Mizoram, Nagaland, Sikkim, Tripura and Uttarakhand are
Hill districts.The percentage of forest cover in these 9 States is 62.57%
of their geographical area.
Forest and Tree Cover of India
Class Area (km2) Percentage of Geographical Area
Forest Cover a) Very Dense Forest 85,904 2.61 b) Moderately Dense Forest 3,15,374 9.59 c) Open Forest 3,00395 9.14 Total Forest Cover* 7,01673 21.34 Scrub 41,362 1.26 Non-Forest 25,44,228 77.40 Total Geographical Area 32,87,263 100.00 * Includes 4629 area under mangroves Source: India State of Forest Report 2015.
Source: India State of Forest Report 2015
********
675538
678333
677088
690899
692027
697898
7,01,673
660000
665000
670000
675000
680000
685000
690000
695000
700000
705000
2001 2003 2005 2009 2011 2013 2015
Forest Cover (Sq. Km.)

SAARC Development Goals : India Country Report – 2017 Page 82
Goal 18 : Acceptable Level of Water and Soil Quality
18.1 Chemical fertilizers/ pesticides consumption
The introduction of Green Revolution in the country has been
accompanied by over-exploitation of land and water resources and
excessive usage of fertilizers and pesticides. Leaching due to extensive
use of pesticides and fertilizers is a major source of contamination of
water bodies. The extent of agricultural intensification and
extensificationis characterized by an increase in cropping and irrigation
intensity and the imbalanced use of chemical fertilizers, pesticides and
insecticides. It has also led to land degradation, overexploitation of
underground water resources and increased use of chemical fertilizers,
leading to eutrophication and water pollution in some regions.The
consumption of fertilizer over a period has shown increasing trend.
Consumption of Fertilizers in India in Terms of Nutrients (N, P &K)
(Thousand Tonnes)
Year N P K Total
2000-01 10,920.2 4,214.6 1,567.5 16,702.3
2005-06 12,723.3 5,203.7 2,413.3 20,340.3
2010-11 16,558.2 8,049.7 3,514.3 28,122.2
2011-12 17,300.3 7,914.3 2,525.5 27,740.0
2012-13 16,820.9 6,653.4 2,061.8 25,536.2
2013-14 16,750.1 5,633.5 2,098.9 24,482.4
2014-15 16,945.4 6,098.4 2,532.3 25,576.1
2015-16 17,372.3 6,978.8 2,401.5 26,752.6
Source: Agricultural Statistics at a Glance, 2016, Ministry of Agriculture.
18.2 Contaminated wells/water sources On an average, the combination of rainfall, surface and
groundwater resources have been sufficient for providing adequate
water to the Indian population.
Inland Water resources of the country are classified as rivers
and canals; reservoirs; tanks & ponds; beels, oxbow lakes, derelict

SAARC Development Goals : India Country Report – 2017 Page 83
water; and brackish water. Other than rivers and canals, total water
bodies cover all area of about 7 M.Ha. Among the remaining forms of
the inland water resources, tanks and ponds have maximum area (2.9
M.Ha.) followed by reservoirs (2.1 M.Ha.).
India is blessed with many rivers. Twelve of them are classifled
as major rivers whose total catchment area is 252.8 million heactare
(M.Ha). Of the major rivers, the Ganga - Brahmaputra Meghana system
is the biggest with catchment area of about 110 M.Ha which is more
than 43 percent of the catchment area of all the major rivers in the
country. The other major rivers with catchment area more than 10
M.Ha are Indus (32.1 M.Ha.), Godavari (31.3 M.Ha.), Krishna, (25.9
M.Ha.) and Mahanadi (14.2 M.Ha). The catchment area of medium
rivers is about 25 M.Ha and Subernarekha with 1.9 M.Ha. catchment
area is the largest river among the medium rivers in the country.
As per the assessment of Dynamic ground water resources of
India (as on 31st March 2013), the stage of Ground Water Development
in the Country is 62%. The development of Ground Water in different
areas of the Country has not been uniform. Highly intensive
development of ground water in certain areas in the Country has
resulted in over-exploitation leading to decline in the level of ground
water and sea water intrusion in coastal areas. Out of the total 6584
numbers of assessment units (Block/ Taluks / Mandals/ watershed/
Firka), 1034 units have been categorized as ‘Over-exploited, 253 as
‘Critical’, 681 as ‘Semi- critical’, 4520 as ‘Safe’ and 96 as ‘Saline’.
Water pollution is a serious problem in India as almost 75-80 per
cent of its surface water resources and a growing percentage of its
groundwater reserves are contaminated by biological, toxic, organic
and inorganic pollutants. With uneven distribution of water with space
and time, the management of water resources is a highly complex and
tedious task. Moreover, over-exploitation and pollution hinders the
availability and creates the scarcity and depletion of the resource.

SAARC Development Goals : India Country Report – 2017 Page 84
CPCB in collaboration with concerned State Pollution Control
Boards(SPCBs)/Pollution Control Committees (PCCs) established a
nationwide network of water quality monitoring comprising 2500
stations in 29 States and 6 Union Territories. The monitoring is done on
monthly or quarterly basis in surface waters and on half yearly basis in
case of ground water. The monitoring network covers 445 Rivers, 154
Lakes, 12 Tanks, 78 Ponds, 41 Creeks/Seawater, 25 Canals, 45 Drains,
10 Water Treatment Plant (Raw Water) and 807 Wells. Among the 2500
stations, 1275 are on rivers, 190 on lakes, 45 on drains, 41 on canals, 12
on tanks, 41 on creeks/seawater, 79 on ponds, 10 Water Treatment
Plant (Raw Water) and 807 are groundwater stations.
The water quality monitoring results shows that there is gradual
degradation in water quality. The number of observations having BOD
and coliform density have been increasing.
CPCB has carried out an inventorization of Sewage Treatment
Plants (STPs) located in India in the year 2014-15. There are 816 STPs
having capacity of 23,277 million litres per day in 28 States/UTs of India.
Out of 816 STPs, 522 STPS are operational, 79 STPs are Non-
operational, 145 STPs are under construction and 70 STPs are proposed
for construction.
*****

SAARC Development Goals : India Country Report – 2017 Page 85
Goal 19 : Acceptable Level of Air Quality
19.1 Carbon dioxide emissions CPCB and SPCBs/PCCs monitors the ambient air quality at
680monitoring stations located in 300 cities/towns covering 29 states
and 6 union territories across the country under National Air Quality
Monitoring Programme (NAMP). CPCB has issued directions to non-
attainment cities for implementation of measures to mitigate air
pollution in2016. The Central Pollution Control Board is executing a
nation-wide NAMP covering 342 operating stations spread over 190
cities/towns and industrial areas in 26 States and 5 Union Territories.
Under NAMP, three air pollutants viz., Sulphur Dioxide (SO2), Nitrogen
Dioxide (NO2), and Particulate Matter size less than or equal to 10
micron (PM10), have been identified for regular monitoring at all the
locations. The monitoring of meteorological parameters such as wind
speed, wind direction, relative humidity and temperature was also
integrated with the monitoring of air quality at selected locations. The
monitoring of pollutants is carried out for 24 hours (4-hourly sampling
for gaseous pollutants and 8-hourly sampling for particulate matter)
with twice a week frequency to have at least 104 observations in a
year.
19.2 Particulate matter in the major metropolitan centres The analysis of three major pollutants (adequate data) in
residential / industrial / rural and other area with respect to National
Ambient Air Quality Standards (NAAQS) provides the following
information on the number of million plus cities with low, moderate,
high & critical air quality (2013):

SAARC Development Goals : India Country Report – 2017 Page 86
Category Residential / industrial / rural / commercial areas
Ecologically sensitive area
SO2 NO2 PM10 SO2 NO2 PM10 Low (L) 39 10 0 1 0 0 Moderate (M) 3 24 2 0 1 0 High (H) 0 6 12 0 0 0 Critical (C) 0 2 28 0 0 1 Inadequate data (ID) 1 1 1 0 0 0 Non operational monitoring station
1 1 1 0 0 0
No monitoring station (NS) 0 0 0 1 1 1 Total million plus cities (as per Census 2011)
44 44 44 2 2 2
Source: CPCB
A considerable amount of air pollution results from burning of
fossil fuels. The household sector is the second largest consumer of
energy in India after the industrial sector. National Family Health
Survey-4 (NFHS-4) found that only 43.8 per cent of India's households
use clean fuels for cooking (80.6% in urban and 24.0% in rural areas).
*******

SAARC Development Goals : India Country Report – 2017 Page 87
Goal 20 : Conservation of Bio-Diversity
20.1 Protected areas out of the total land area Total Protected area covered under national parks, wildlife
sanctuaries, etc., constituting around 5% of country’s geographical
area, is increasing over the years. The country is on track in increasing
the protection network for arresting the biodiversity losses and for
maintaining ecological balance.
Area under Protected area (as on July, 2017)
Year National Parks
Wild Life Sanctuaries
Community Reserves
Conservation Reserves
Total Protected Areas
2011 40,074 1,22,616 21 1,801 1,64,512
2012 40,074 1,23,548 21 1,998 1,65,642
2013 40,074 1,24,235 21 2,018 1,66,348
2014 40,333 1,16,254 21 2,037 1,58,645
2015 40,500 1,17,608 47 2,345 1,60,499
2016 40,500 1,18,005 47 2,349 1,60,902
2017 40,500 1,18,918 60 2,547 1,62,025
Source: National Wildlife Database Cell, Wildlife Institute of India
Note: All areas are in km2
20.2 Protected species India is one of the 17 mega diverse countries of the world. With
only 2.4% of the world’s land area, 16.7% of the world’s human
population and 18% livestock, it contributes about 8% of the known
global biodiversity, however, putting enormous demands on our
natural resources. India is home to world’s largest wild tigers
population and has got unique assemblage of globally important
endangered species like Asiatic lion, Asian Elephant, One-horned
Rhinoceros, Gangetic River Dolphin, Snow Leopard, Kashmir Stag,
Dugong, Gharial, Great Indian Bustard, Lion Tailed Macaque etc.

SAARC Development Goals : India Country Report – 2017 Page 88
The National Wildlife Action Plan (2002-2016) was adopted in
2002, emphasizing the people’s participation and their support for
wildlife conservation. India’s conservation planning is based on the
philosophy of identifying and protecting representative wild habitats
across all the ecosystems. A network of 668 Protected Areas (PAs) has
been established, comprising 102 National Parks, 515 Wildlife
Sanctuaries, 47 Conservation Reserves and 4 Community Reserves. 39
Tiger Reserves and 28 Elephant Reserves) have been designated for
species-specific management of tiger and elephant habitats.
*****

SAARC Development Goals : India Country Report – 2017 Page 89
Goal 21 : Wetland Conservation
21.1 Protected wetland/Ramsar sites Wetlands in India are distributed in different geographical
regions, ranging from the Himalaya to the Deccan plateau. The
variability in climatic conditions and topography is responsible for
significant diversity. There are in all 104 identified wetlands under the
National Wetland Conservation & Management Programme.
India is a signatory to the Ramsar Convention and plays an
important role in conservation and wise use of wetlands. On the basis
of the country's initiatives in the field of wetland conservation, India
was nominated as a member of the Standing Committee from 1993-
1996 and from 1999-2002.
*****
SAARC Development Goals : India Country Report – 2017 Page 90
Goal 22 : Ban on Dumping of Hazardous Waste, Including Radioactive Waste 22.1 Solid waste generation and treatment
Total quantity of waste generated in the country (based on
weighment exercise by local bodies) is not reported. However, Ministry
of Urban Development, in its manual on solid waste management (year
2000), has estimated a waste generation of 1,00,000 MT.
During the year 2004-05, CPCB through National Environmental
Engineering Research Institute, Nagpur conducted survey in 59 cities
(35 Metro cities and 24 State Capitals) and estimated 39,031 Tons per
day municipal solid waste (MSW) generation in these 59 cities/towns.
CPCB has reported generation of 50,592 tonnes of MSW per day in the
year 2010-11 in same 59 cities. As per information received from SPCB/
PCC (in between the year 2009-12), 1,27,486 TPD (Tons per day)
municipal solid waste is generated in the Country during 2011-12. Out
of which, 89,334 TPD (70%) of MSW is collected and 15,881 TPD
(12.45%) is processed or treated.
A GIS Based project on National Hazardous Waste Information
System has been developed to provide status of hazardous waste
management in the Country, according to which, more than 40,000
hazardous waste industries generate about 7-8 million tonnes per year.
22.2 Waste treated
As per 2012-13 report of CPCB, municipal areas in the country
generate 1, 33,760 metric tonnes per day of MSW, of which only 91,152
TPD waste is collected and 25,884 TPD treated.

SAARC Development Goals : India Country Report – 2017 Page 91
22.3 Regulatory framework for hazardous waste treatment The growth of e-waste has significant environmental, economic
and social impact. The increase of electrical and electronic products,
consumption rates and higher obsolescence rates lead to higher
generation of e-waste. The increasing obsolescence rate of electronic
products also adds to the huge import of used electronics products. E-
waste (Management and Handling) Rules, 2011 have been notified in
the country from 1st May, 2012. These rules apply to e-waste
generated from IT and telecommunication equipment and consumer
electrical and electronics namely Television Sets (including LCD & LED),
Refrigerators, Washing Machines and Air-conditioners. These rules
empower the concerned state agencies to control, supervise and
regulate relevant activities connected with e-waste management such
as collection, segregation, dismantling and recycling. These rules are
the main instrument to ensure environmentally sound management of
e-waste. Under these rules EPR authorizations have been granted to
128 Producers which are spread in 11 states. 134 collection centres are
set-up in 19 States.
*******