independent research wirecard - bryan, garnier 2016-08 cir_s… · independent research wirecard...
TRANSCRIPT
r r
INDEPENDENT RESEARCH Wirecard 6th September 2016 Ready to reconnect with the fundamentals
TMT Fair Value EUR58 vs. EUR54 (price EUR45.86) BUY-Top Picks
Bloomberg WDI GR
Reuters WDIG.DE
12-month High / Low (EUR) 47.4 / 31.2
Market capitalisation (EURm) 5,667
Enterprise Value (BG estimates EURm) 5,145
Avg. 6m daily volume ('000 shares) 735.8
Free Float 94.0%
3y EPS CAGR 29.9%
Gearing (12/15) -54%
Dividend yields (12/16e) 0.31%
Having been an easy target for opportunistic short-seller funds, in our
view the Wirecard share price should now reconnect with the
fundamentals. There is potential for a significant rebound, which
should accelerate with the covering of still-sizeable short positions.
The PEG is particularly attractive (P/E of 22x vs EPS at +34%!) and
the speculative angle is undeniable (Wirecard has a rare profile in the
payments space). We recommend that investors play this momentum
with a Buy rating and a FV increased from EUR54 to EUR58.
After an impressive collapse (-27% in one month, at end-March)
triggered by a research note from a certain Zatarra, the share price
rebounded. It has at last exceeded its level the day prior to the ‘attack’.
There is potential for a significant rebound, expecially since the rally in
recent months took place without the massive covering of short
positions, auguring positive share price momentum. Furthermore, US
investors (a category representing a significant proportion of the short
positions) are revisiting the investment case. The announcement of the
acquisition of one of the Citi subsidiaries appears to be the proof that
they had been missing to be convinced of the group’s quality.
In our view, it is time for the market to reconnect the company’s share
price with its fundamentals which are the best in the sector. The
publication of the H1 results reassured us that not only has there been no
operational impact from the Zatarra affair but, what’s more, the
EBITDA should come in towards the top end of the company’s 2016
guidance, bang in line with its 2020 plan. For payment companies not
engaged in an overinvestment programme, we advocate evaluating the
shares based on the PEG. This multiple is particularly compelling for
Wirecard over twelve rolling months, with a P/E of 22.2x whereas the
restated EPS growth is expected to be 33.9%.
Given its rare profile in the online payment space (pure-player, present
across all continents, with an in-house bank), Wirecard is the type of
company which, sooner or later, will end up as an acquisition target. In
the first instance, this could take place via the simple purchase of a
minority stake. The management has effectively just confirmed that it is
in discussions with a number of strategic partners regarding a possible
entry into its share capital. In that the speculative attraction of the shares
will be correlated with the-world-wide development of e-commerce, it is
set to see a significant increase.
YE December 12/15 12/16e 12/17e 12/18e
Revenue (EURm) 771.34 1,016 1,344 1,599
EBITA EURm) 197.4 270.7 356.1 432.1
Op.Margin (%) 25.6 26.6 26.5 27.0
Diluted EPS (EUR) 1.33 1.83 2.38 2.90
EV/Sales 6.45x 5.06x 3.75x 3.04x
EV/EBITDA 21.9x 16.8x 12.5x 10.0x
EV/EBITA 25.2x 19.0x 14.2x 11.2x
P/E 34.6x 25.1x 19.3x 15.8x
ROCE 29.5 25.7 28.2 30.9
29.2
34.2
39.2
44.2
49.2
05/03/15 05/06/15 05/09/15 05/12/15 05/03/16 05/06/16 05/09/16
WIRECARD (XET) SXX EUROPE 600
Analyst: Sector Analyst Team:
Richard-Maxime Beaudoux Thomas Coudry
33(0) 1.56.68.75.61 Gregory Ramirez
[email protected] Dorian Terral

Wirecard
2
Simplified Profit & Loss Account (EURm) 2013 2014 2015 2016e 2017e 2018e
Revenues 482 601 771 1,016 1,344 1,599
Change (%) 22.1% 24.8% 28.3% 31.7% 32.3% 18.9%
lfl change (%) 17.6% 21.0% 23.2% 20.3% 21.0% 18.9%
EBITDA 126 173 227 306 403 488
EBIT 98.5 133 173 241 317 386
Adjusted EBIT 109 150 197 271 356 432
Change (%) 16.4% 38.1% 31.2% 37.1% 31.5% 21.4%
Financial results (4.2) (6.7) (7.2) 65.4 (8.6) (7.6)
Pre-Tax profits 94.3 126 166 307 308 378
Tax (11.6) (18.2) (23.0) (34.1) (47.8) (58.6)
Profits from associates 0.0 0.0 0.0 0.0 0.0 0.0
Minority interests 0.0 0.0 0.0 0.0 0.0 0.0
Net profit 82.7 108 143 272 261 319
Restated net profit 91.8 123 164 226 294 359
Change (%) 25.3% 33.9% 33.2% 37.9% 30.0% 22.2%
Cash Flow Statement (EURm)
Cash flow 126 173 228 355 370 449
Change in working capital 2.9 (33.5) (20.7) (74.0) (99.3) (76.9)
Capex, net (51.3) (75.0) (76.8) (91.4) (108) (128)
Financial investments, net (111) (94.3) (158) (277) (41.2) (41.2)
Dividends (12.3) (14.8) (16.1) (16.1) (17.3) (18.5)
Other 27.1 28.3 138 (67.3) 0.0 0.0
Net debt (246) (597) (692) (522) (626) (810)
Free Cash flow 77.6 64.8 130 189 163 244
Balance Sheet (EURm)
Net fixed assets 458 687 1,052 1,626 2,053 2,392
Investments 127 124 227 227 227 227
Deffered tax assets 0.0 0.0 0.0 0.0 0.0 0.0
Cash & equivalents 479 695 1,063 569 673 858
current assets 284 358 451 594 786 934
Other assets 82.2 131 142 187 248 295
Total assets 1,431 1,995 2,936 3,204 3,987 4,706
L & ST Debt 233 98.4 371 47.3 47.3 47.3
Provisions 7.8 10.8 15.7 15.7 15.7 15.7
Deffered tax liabilities 0.0 0.0 0.0 0.0 0.0 0.0
Others liabilities 581 813 1,269 1,671 2,211 2,629
Shareholders' equity 608 1,073 1,281 1,470 1,713 2,014
Total Liabilities 1,431 1,995 2,936 3,204 3,987 4,706
Capital employed 362 476 588 948 1,087 1,204
Ratios
Operating margin 22.60 25.03 25.59 26.65 26.48 27.03
Tax rate 12.29 14.42 13.90 11.14 15.50 15.50
Net margin 17.17 17.96 18.49 26.82 19.39 19.98
ROE (after tax) 13.60 10.06 11.14 18.54 15.22 15.86
ROCE (after tax) 26.72 27.59 29.50 25.65 28.24 30.94
Gearing (40.44) (55.62) (54.06) (35.49) (36.53) (40.23)
Pay out ratio 14.92 13.54 11.25 6.35 7.11 6.18
Number of shares, diluted 112,297 121,841 123,497 123,497 123,497 123,497
Data per Share (EUR)
EPS 0.74 0.89 1.16 2.21 2.11 2.59
Restated EPS 0.82 1.01 1.33 1.83 2.38 2.90
% change 23.0% 23.4% 31.4% 37.9% 30.0% 22.2%
BVPS 5.42 8.81 10.37 11.90 13.87 16.31
Operating cash flows 1.12 1.42 1.84 2.87 2.99 3.64
FCF 0.69 0.53 1.06 1.53 1.32 1.98
Net dividend 0.11 0.12 0.13 0.14 0.15 0.16
Source: Company Data; Bryan, Garnier & Co ests.
Company description
Wirecard is one of the world’s leading
independent providers of outsourcing
and white label solutions for electronic
payment transactions. It has been
supporting companies in accepting
electronic payments from all sales
channels. A global multi-channel
platform bundles international
payment acceptances and methods,
supplemented by fraud prevention
solutions. When it comes to issuing
their own payment instruments in the
form of cards or mobile payment
solutions, Wirecard provides
companies with an end-to-end
infrastructure, including the requisite
licenses for card and account
products.
Wirecard
3
Table of contents
1. Investment Case ........................................................................................................................................... 4
2. Summary - Conclusion ............................................................................................................................... 5
3. Significant potential for a share price rebound ...................................................................................... 6
3.1. DCF: EUR61 ........................................................................................................................ 6
3.2. Peer group comparison: EUR51 ....................................................................................... 8
3.3. Historic forward multiples: EUR60 .................................................................................. 8
3.4. 2016/17e EV/TVP ratio based on PayPal: EUR59 ................................................... 10
4. The star pupil in the sector ..................................................................................................................... 11
4.1. A solid H1 2016 and encouraging for the full year ..................................................... 11
4.2. An opportunistic and well-targeted M&A policy ........................................................ 16
4.3. The 2020 plan: ambitious but realistic ........................................................................... 18
5. The momentum is returning positive.................................................................................................... 22
5.1. History: multiple attacks .................................................................................................. 22
5.2. The future: an undeniable speculative attraction ......................................................... 25
Price Chart and Rating History .................................................................................................................... 28
Bryan Garnier stock rating system............................................................................................................... 29

Wirecard
4
1. Investment Case
The reason for writing now Since the acquisition of a Citi subsidiary in the US, Wirecard has become a global
player (in terms of both acquirer and issuer). This increase in size and international reach
should be reflected in more transactions on its platforms and an automatic increase in
margins (fixed-cost business). Since this acquisition, it seems that US investors have been
revisiting the stock, further testifying to the quality of the group. Furthermore, short
positions on the stock have begun to decline since May although the potential for a
rebound remains very substantial. Lastly, the management has confirmed that it is in
strategic discussion with various partners with a view to their becoming a shareholder.
Valuation Our FV is increased from EUR54 to EUR58. It is derived from the average between a
DCF at EUR61, peer comparison at EUR51, historic multiples at EUR60 and PayPal’s 2016
EV/TVP discounted by 15% to EUR59. For payment players not engaged in an
overinvestment programme, we recommend that investors look at the PEG. Wirecard’s
own PEG is particularly compelling with a P/E of 22.2x compared with EPS growth of
33.9% over twelve rolling months.
Catalysts Main catalysts for the share price: 1/ electronic payment growth, 2/ the development of
e-commerce, 3/mobile payment solution growth, 4/ the growing need for digital security, 5/
the leverage on operating expenses, 6/ acquisitions and partnerships, 7/ acquisition by
another player (the structure of Wirecard’s share capital leaves it open to a bid: freefloat of
93% and 7% held by the management).
Difference from consensus The market is under-estimating: 1/ the growth in the volume of transactions processed by
Wirecard, linked to both market share gains (with existing and new customers alike, with a
focus on medium/large-scale merchants), mobile payment solutions (monetisable since
2015), the synergies between its businesses which are increasingly integrated (processing,
acquiring and issuing), and the company’s external growth (America and the emerging
countries); and 2/ the potential improvement in margins (economies of scale, accretive
acquisitions and the profit opportunity on acquiring via the reduction in interchange fees).
Risks to our investment case The main factors which could potentially invalidate our scenario: 1/ new entrants or
consolidation between several large players, 2/ disruptive technologies in which Wirecard
may not be positioned, 3/ execution risk on a major acquisition.

Wirecard
5
2. Summary - Conclusion After being impacted by the Zatarra research note, leveling incriminatory allegations against
Wirecard (accusing the company of fraud, money laundering and facilitating the evasion of US
restrictions on internet gambling), the share price has rebounded to recently exceed its previous
level (EUR42.62 on 23/02). While the trend in uncovered short positions is downwards (they are
probably now well below 20% vs a peak of 23% although it is difficult to provide precise figures since
the positions below 0.5% are invisible), we estimate that there is still significant upside potential
on the stock. It is moreover reassuring that the share price has regained 47% since 22/03 (the 2016
low) without the massive covering of short positions since this signifies that there is leverage for the
coming months.
Fig. 1: Outstanding short positions on Wirecard shares (01/11/12 - 05/09/16)
Source: shortsell.nl (Nov. 2012 - September 2016)
Wirecard is an atypical player, in view of its positioning in the industry’s fastest-growing segments
(online payments and emerging countries), its in-house bank (Wirecard Bank) and its earnings growth
potential which has yet to be fully priced in. In this high-fixed-cost payments industry, there is a
real race for scale. Wirecard succeeds in this not only by generating strong organic revenue growth
but also by making targeted acquisitions giving the group a presence across all continents. It is thus
both a growth (sales >+20% like-for-like) and a margin story (EBITDA margin >30%).
Lastly, we recommend that investors play the positive momentum on Wirecard shares. The
company should have no problem in achieving its 2016 targets and the 2020 plan looks totally
credible. Finally, its status as a online payment pure-player and the 93% freefloat make it a
target of choice. The management has, moreover, confirmed that it is in strategic discussions with
several partners with a view to their potentially entering the share capital. While the valuation
may look high in absolute terms over 12 rolling months (EV/Sales of 4.4x, EV/EBITDA of 14.6x
and P/E of 22.2x), in reality it appears particularly compelling compared with its three-year historic
average and especially its future earnings growth (growth in restated EPS of +33,9% over 12 rolling
months). We are maintaining our Buy rating and increasing our FV from EUR54 to EUR56
(upside of 26%), derived from a blend of four valuation methods.
More generally, we expect the development of e-commerce (6% of global retailing is e-commerce,
according to McKinsey) and digital security (>60% of the value of fraud world-wide is on the
internet and c.50% in Europe) to take a big step forward and consolidation to continue in
payment services (in both Europe and the US). In our view, this is why there have been so many
IPOs in the upstream, i.e. in H2 2015: three in the US (PayPal, First Data and Square) and one in
Europe (Worldpay). Other IPOs are likely to take place during 2017, this time mainly in
Europe.
Wirecard
6
3. Significant potential for a share price rebound
Our Fair Value on Wirecard is increased from EUR54 to EUR58 (potentiel upside of 26%). It is
derived from an equi-weighted average of a DCF, peer comparison, three-year historic multiples and
PayPal’s EV/TVP multiple discounted at 15%. We have kept the same valuation methodology
since our initiation of coverage on 01/09/15 at a share price of EUR36.78.
Fig. 2: Summary of the various valuation methods (share price at 02/09/16)
EUR Valuation/share Potential on last price
DCF 61.1 33%
Peer comparison 50.7 11%
3 year historical fwd multiples 60.2 31%
EV/TVP 12 rolling months (based on PayPal) 59.3 29%
Equi-weighted average 57.8 26%
Source: Bryan, Garnier & Co ests.
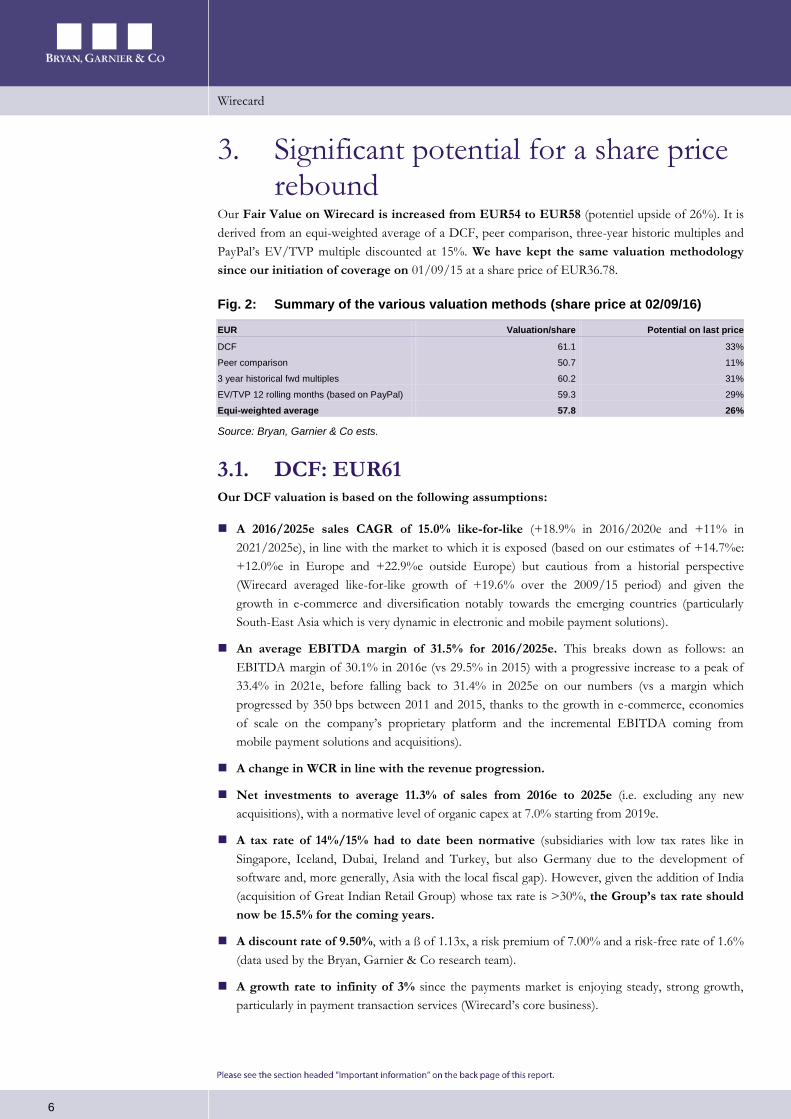
3.1. DCF: EUR61 Our DCF valuation is based on the following assumptions:
A 2016/2025e sales CAGR of 15.0% like-for-like (+18.9% in 2016/2020e and +11% in
2021/2025e), in line with the market to which it is exposed (based on our estimates of +14.7%e:
+12.0%e in Europe and +22.9%e outside Europe) but cautious from a historial perspective
(Wirecard averaged like-for-like growth of +19.6% over the 2009/15 period) and given the
growth in e-commerce and diversification notably towards the emerging countries (particularly
South-East Asia which is very dynamic in electronic and mobile payment solutions).
An average EBITDA margin of 31.5% for 2016/2025e. This breaks down as follows: an
EBITDA margin of 30.1% in 2016e (vs 29.5% in 2015) with a progressive increase to a peak of
33.4% in 2021e, before falling back to 31.4% in 2025e on our numbers (vs a margin which
progressed by 350 bps between 2011 and 2015, thanks to the growth in e-commerce, economies
of scale on the company’s proprietary platform and the incremental EBITDA coming from
mobile payment solutions and acquisitions).
A change in WCR in line with the revenue progression.
Net investments to average 11.3% of sales from 2016e to 2025e (i.e. excluding any new
acquisitions), with a normative level of organic capex at 7.0% starting from 2019e.
A tax rate of 14%/15% had to date been normative (subsidiaries with low tax rates like in
Singapore, Iceland, Dubai, Ireland and Turkey, but also Germany due to the development of
software and, more generally, Asia with the local fiscal gap). However, given the addition of India
(acquisition of Great Indian Retail Group) whose tax rate is >30%, the Group’s tax rate should
now be 15.5% for the coming years.
A discount rate of 9.50%, with a ß of 1.13x, a risk premium of 7.00% and a risk-free rate of 1.6%
(data used by the Bryan, Garnier & Co research team).
A growth rate to infinity of 3% since the payments market is enjoying steady, strong growth,
particularly in payment transaction services (Wirecard’s core business).

Wirecard
7
Fig. 3: Calculation of the discount rate
Inputs %
Risk free rate 1.60
Market risk premium 7.00
ß (x) 1.13
Return on capital 9.50
Source: Bryan, Garnier & Co ests.
Since the group is in a net cash position, the discount rate is equal to the cost of equity.
Fig. 4: Discounted cash flow model
EURm 2016e 2017e 2018e 2019e 2020e 2021e 2022e 2023e 2024e 2025e
Sales 1,015.9 1,344.5 1,598.7 1,880.4 2,197.9 2,527.6 2,856.2 3,170.4 3,455.7 3,697.6
Y/Y change 31.7% 32.3% 18.9% 17.6% 16.9% 15.0% 13.0% 11.0% 9.0% 7.0%
EBITDA 306.3 403.1 488.1 583.7 695.2 844.2 939.7 1027.2 1102.4 1161.1
Margin 30.1% 30.0% 30.5% 31.0% 31.6% 33.4% 32.9% 32.4% 31.9% 31.4%
EBIT 241.3 317.1 385.7 463.3 554.5 682.5 756.9 824.3 881.2 924.4
Margin 23.7% 23.6% 24.1% 24.6% 25.2% 27.0% 26.5% 26.0% 25.5% 25.0%
Tax rate 11.1% 15.5% 15.5% 15.5% 15.5% 15.5% 15.5% 15.5% 15.5% 15.5%
EBIT after tax 214.4 267.9 325.9 391.5 468.5 576.7 639.6 696.5 744.6 781.1
+ Amortisation, depreciation and
provisions
65.0 86.0 102.3 120.3 140.7 161.8 182.8 202.9 221.2 236.6
Cash flow from operations 279.4 354.0 428.3 511.8 609.2 738.4 822.4 899.4 965.8 1,017.8
- Net financial & tangible investments -435.4 -148.7 -169.1 -131.6 -153.9 -176.9 -199.9 -221.9 -241.9 -258.8
- Change in WCR -74.0 -99.3 -76.9 -85.2 -96.0 -97.3 -97.0 -92.8 -84.2 -71.4
Free cash flow -230.0 105.9 182.3 295.0 359.4 464.2 525.4 584.8 639.7 687.5
Discounted free cash flows -223.1 93.9 147.5 218.0 242.5 286.1 295.8 300.6 300.3 294.8
Sum of discounted FCF 1,956.6
+ Discounted terminal value 4,674.8
+ Net cash 2015 692.2
- Minority interests, 2015 0.0
+ Financial fixed assets 2015 227.2
Valuation 7,550.8
Number of shares fully diluted
(millions)
123.5
Value per share (€) 61.1
Source: Bryan, Garnier & Co ests.
Fig. 5: Sensitivity to the discount rate and the growth rate to infinity
EUR WACC
Growth rate to infinity 8.50% 9.00% 9.50% 10.00% 10.50%
2.50% 65.1 60.1 55.8 52.0 48.7
2.75% 68.7 63.1 58.3 54.1 50.5
3.00% 73.0 66.6 61.1 56.5 52.5
3.25% 78.2 70.7 64.5 59.3 54.8
3.50% 84.4 75.6 68.5 62.5 57.5
Source: Bryan, Garnier & Co ests.
Our DCF values the stock at EUR61.1 per share (potential upside of 33%).
Wirecard
8
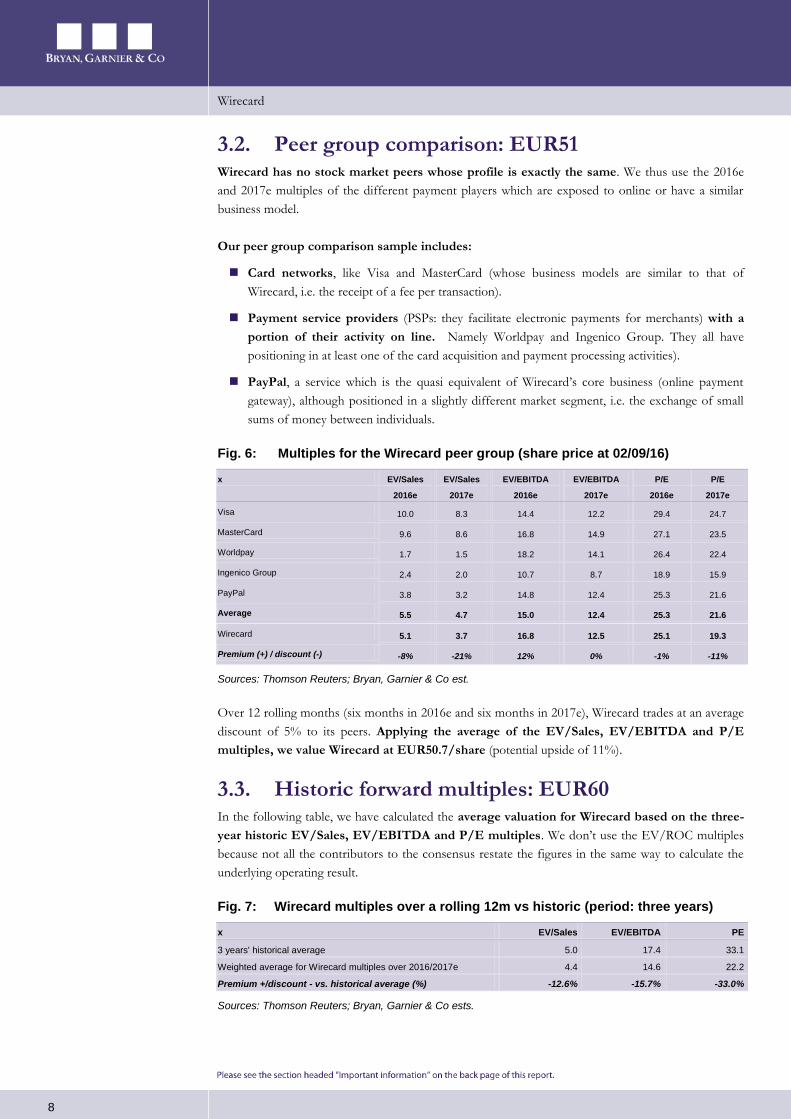
3.2. Peer group comparison: EUR51 Wirecard has no stock market peers whose profile is exactly the same. We thus use the 2016e
and 2017e multiples of the different payment players which are exposed to online or have a similar
business model.
Our peer group comparison sample includes:
Card networks, like Visa and MasterCard (whose business models are similar to that of
Wirecard, i.e. the receipt of a fee per transaction).
Payment service providers (PSPs: they facilitate electronic payments for merchants) with a
portion of their activity on line. Namely Worldpay and Ingenico Group. They all have
positioning in at least one of the card acquisition and payment processing activities).
PayPal, a service which is the quasi equivalent of Wirecard’s core business (online payment
gateway), although positioned in a slightly different market segment, i.e. the exchange of small
sums of money between individuals.
Fig. 6: Multiples for the Wirecard peer group (share price at 02/09/16)
x EV/Sales
2016e
EV/Sales
2017e
EV/EBITDA
2016e
EV/EBITDA
2017e
P/E
2016e
P/E
2017e
Visa 10.0 8.3 14.4 12.2 29.4 24.7
MasterCard 9.6 8.6 16.8 14.9 27.1 23.5
Worldpay 1.7 1.5 18.2 14.1 26.4 22.4
Ingenico Group 2.4 2.0 10.7 8.7 18.9 15.9
PayPal 3.8 3.2 14.8 12.4 25.3 21.6
Average 5.5 4.7 15.0 12.4 25.3 21.6
Wirecard 5.1 3.7 16.8 12.5 25.1 19.3
Premium (+) / discount (-) -8% -21% 12% 0% -1% -11%
Sources: Thomson Reuters; Bryan, Garnier & Co est.
Over 12 rolling months (six months in 2016e and six months in 2017e), Wirecard trades at an average
discount of 5% to its peers. Applying the average of the EV/Sales, EV/EBITDA and P/E
multiples, we value Wirecard at EUR50.7/share (potential upside of 11%).
3.3. Historic forward multiples: EUR60 In the following table, we have calculated the average valuation for Wirecard based on the three-
year historic EV/Sales, EV/EBITDA and P/E multiples. We don’t use the EV/ROC multiples
because not all the contributors to the consensus restate the figures in the same way to calculate the
underlying operating result.
Fig. 7: Wirecard multiples over a rolling 12m vs historic (period: three years)
x EV/Sales EV/EBITDA PE
3 years' historical average 5.0 17.4 33.1
Weighted average for Wirecard multiples over 2016/2017e 4.4 14.6 22.2
Premium +/discount - vs. historical average (%) -12.6% -15.7% -33.0%
Sources: Thomson Reuters; Bryan, Garnier & Co ests.

Wirecard
9
Fig. 8: 3-year historic forward multiples (average from Sept. 2013 to Sept. 2016)
EV/Sales (12m FWD) EV/EBITDA (12m FWD) P/E (12m FWD)
Sources: Thomson Reuters; Bryan, Garnier & Co (3 year historical, average from Sept. 2013 to Sept. 2016).
The stock is trading on 2016 and 2017 multiples which may appear high in absolute terms but
which in reality offer substantial upside potential in view of the historical multiples and especially the
future profitable growth.
The stock trades at an average discount of 20.4% over 12 rolling months relative to the three-
year historic: EV/Sales multiples of respectively 5.1x in 2016e and 3.7x in 2017e (vs a historic of
5.0x), EV/EBITDA multiples of 16.8x and 12.5x (vs a historic at 17.4x) and P/E multiples of 25.1x
and 19.3x (vs a historic of 33.1x). Applying these historic multiples to our Wirecard estimates for the
weighted 2016e and 2017e financial years (6 months in 2016 and 6 months in 2017) values the
company at EUR60.2/share (potential upside of 31%).
Note that, at our new FV of EUR58, the stock would trade at average rolling 12 month
multiples of: 5.7x EV/Sales, 19.0x EV/EBITDA and 28.1x P/E, i.e. only 2.7% above the three-year
historical average (5.0x, 17.4x and 33.1x). We deem this valuation method, which is based on the
historical valuation multiples including the Zatarra affair, to be reliable and even conservative.
Wirecard is experiencing rapid change and will take advantage of new opportunities in the coming
years (e-commerce, mobile payment solutions, etc.), without taking into acocunt the fact that security
issues will be key and our view that the banks are increasingly looking to exit the payments business in
favour of pure players like PSPs.
In the coming years, we believe that the more Wirecard:
1/gains scale, the higher its operating margin will be (leverage effect on the transaction volume
processed by its platforms). PSPs are in a business where size matters due to their mainly fixed
cost structures (c.55% of sales), hence the importance of M&A. Wirecard is looking at targets to
reinforce its operations in geographies it does not yet cover or insufficiently (e.g: America).
2/ increases the mix of its core business (e-commerce) in favour of the emerging countries
(which are seeing very rapid growth in online payments: internet and/or mobile solutions), the
higher its multiples will be.
3/ increases the weight of its banking services in its mix (Wirecard Bank, 28% of H1 sales), the
more the stock’s valuation will approach the multiples of the card networks.
3.00
3.50
4.00
4.50
5.00
5.50
6.00
6.50
7.00
Sep
-13
Mar
-14
Sep
-14
Mar
-15
Sep
-15
Mar
-16
Sep
-16
EV/SALES Average
10.00
12.00
14.00
16.00
18.00
20.00
22.00
24.00
Sep
-13
Mar
-14
Sep
-14
Mar
-15
Sep
-15
Mar
-16
Sep
-16
EV/EBITDA Average
19.00
24.00
29.00
34.00
39.00
44.00
49.00
Sep
-13
Mar
-14
Sep
-14
Mar
-15
Sep
-15
Mar
-16
Sep
-16
PER Average

Wirecard
10
3.4. 2016/17e EV/TVP ratio based on PayPal: EUR59
PayPal and Wirecard have a core business in common: they offer online payment services
enabling payment for purchases, the receipt of payments, and the remittance or receipt of money.
Concretely, the purchaser pays in just a few clicks (Wirecard talks about three phases), the merchant
receives payment for the sale and settles the transaction rapidly since the payment is instantaneous
and automatically notified by email (no need to wait for a cheque or deposit it at the bank). To benefit
from their services, an individual must set up an online account. The transactions are subsequently
carried out without having to re-enter the customer’s bank details.
Main differences: PayPal, a consumer-oriented business (while Wirecard is directed at merchants), is
more of an electronic wallet, i.e. a service perfectly adapted to the exchange of small sums of money
between individuals (whereas Wirecard targets medium/large-scale merchants with substantial
transaction volumes and who are seeking more complex solutions), and which requires a traditional
bank account (not the case for Wirecard). Note also that Wirecard includes PayPal in its offers since it
is agnostic as regards the payment solutions integrated in its platform. In this sense, Wirecard does
not see PayPal as a competitor.
Valuation work: Since PayPal’s services are fairly similar to the Wirecard core business (e-commerce)
with broadly similar fundamentals (growth in sales and profitability) and since the value of the
transaction volume processed (TVP) is a key performance indicator in the sector, we value Wirecard
by applying the PayPal EV/TVP. Using this method and after applying a 15% discount (PayPal is
listed for trading on Nasdaq), we value Wirecard at EUR59.3/share (potential upside of +29%).
Fig. 9: Valuation applying the PayPal EV/TVP
Based on
FY16e
Based on
FY17e
Paypal (USDbn)
EV 45.7 50.3
Transaction volume processed (TVP) 348.3 435.3
EV/TVP 0.13 0.09
Wirecard (EURbn)
Transaction volume processed (TVP) 61.0 82.4
EV 2015e implied 8.0 7.6
+ Net cash 2015e 0.5 0.6
+ Financial assets 2015e 0.2 0.2
= Valuation implied 8.7 8.5
Valuation implied after a 15% discount (PayPal is listed on the Nasdaq) 7.4 7.2
Number of shares fully diluted (in million) 123.5 123.5
Valuation implied after a 15% discount / Wirecard number of shares diluted (EUR) 60.2 58.3
Upside(+) / downside (-) 31.3% 27.1%
Source: Bryan, Garnier & Co ests.
Wirecard
11
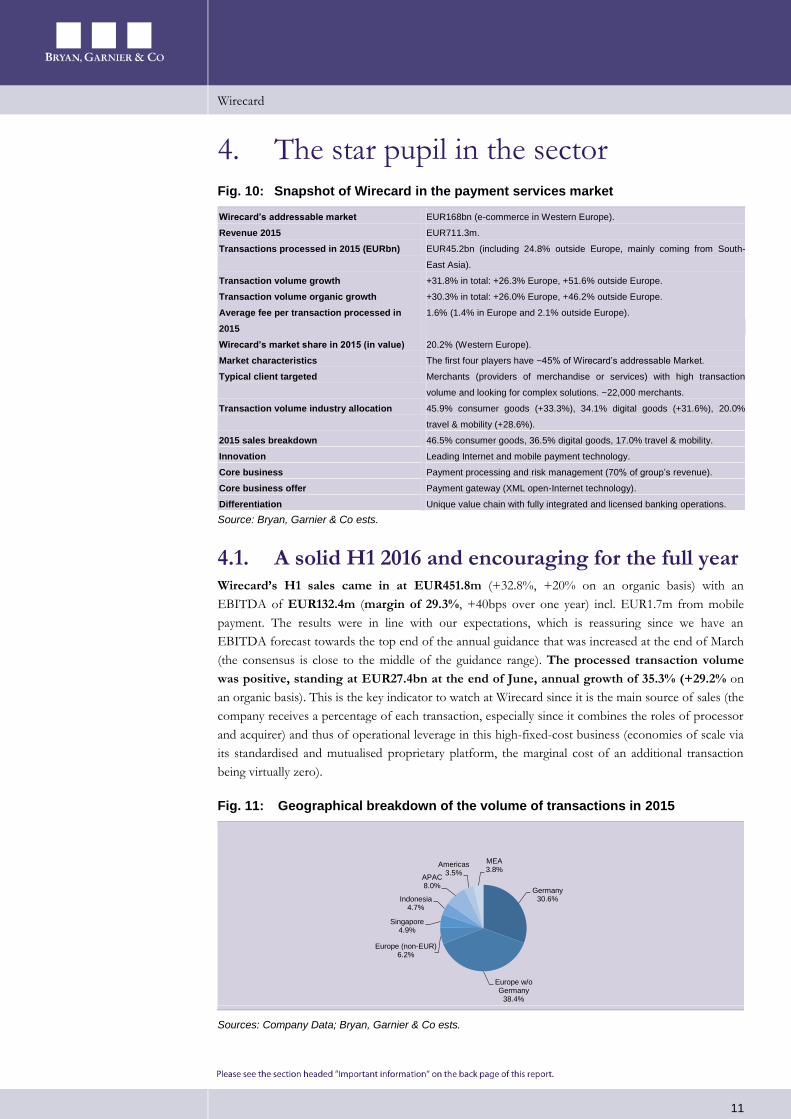
4. The star pupil in the sector Fig. 10: Snapshot of Wirecard in the payment services market
Wirecard’s addressable market EUR168bn (e-commerce in Western Europe).
Revenue 2015 EUR711.3m.
Transactions processed in 2015 (EURbn) EUR45.2bn (including 24.8% outside Europe, mainly coming from South-
East Asia).
Transaction volume growth +31.8% in total: +26.3% Europe, +51.6% outside Europe.
Transaction volume organic growth +30.3% in total: +26.0% Europe, +46.2% outside Europe.
Average fee per transaction processed in
2015
1.6% (1.4% in Europe and 2.1% outside Europe).
Wirecard’s market share in 2015 (in value) 20.2% (Western Europe).
Market characteristics The first four players have ~45% of Wirecard’s addressable Market.
Typical client targeted Merchants (providers of merchandise or services) with high transaction
volume and looking for complex solutions. ~22,000 merchants.
Transaction volume industry allocation 45.9% consumer goods (+33.3%), 34.1% digital goods (+31.6%), 20.0%
travel & mobility (+28.6%).
2015 sales breakdown 46.5% consumer goods, 36.5% digital goods, 17.0% travel & mobility.
Innovation Leading Internet and mobile payment technology.
Core business Payment processing and risk management (70% of group’s revenue).
Core business offer Payment gateway (XML open-Internet technology).
Differentiation Unique value chain with fully integrated and licensed banking operations.
Source: Bryan, Garnier & Co ests.
4.1. A solid H1 2016 and encouraging for the full year Wirecard’s H1 sales came in at EUR451.8m (+32.8%, +20% on an organic basis) with an
EBITDA of EUR132.4m (margin of 29.3%, +40bps over one year) incl. EUR1.7m from mobile
payment. The results were in line with our expectations, which is reassuring since we have an
EBITDA forecast towards the top end of the annual guidance that was increased at the end of March
(the consensus is close to the middle of the guidance range). The processed transaction volume
was positive, standing at EUR27.4bn at the end of June, annual growth of 35.3% (+29.2% on
an organic basis). This is the key indicator to watch at Wirecard since it is the main source of sales (the
company receives a percentage of each transaction, especially since it combines the roles of processor
and acquirer) and thus of operational leverage in this high-fixed-cost business (economies of scale via
its standardised and mutualised proprietary platform, the marginal cost of an additional transaction
being virtually zero).
Fig. 11: Geographical breakdown of the volume of transactions in 2015
Sources: Company Data; Bryan, Garnier & Co ests.
Germany30.6%
Europe w/o Germany
38.4%
Europe (non-EUR)6.2%
Singapore4.9%
Indonesia4.7%
APAC8.0%
Americas3.5%
MEA3.8%

Wirecard
12
For the current financial year, the management is targeting an EBITDA of between
EUR290m and EUR310m, compared with our forecast of EUR306m and the Thomson Reuters
consensus of EUR303m. Note that the middle of the range is based on organic growth of 23%
(described as conservative by the management), a mobile payment solution contribution of EUR5m
(vs BG: EUR5.5m), a EUR16m contribution from the Great Indian Retail Group acquisition (vs BG:
EUR16.5m) and a contribution from Provus Group and MoIP amounting to EUR4m (vs BG:
EUR5.2m).
We are maintaining our forecasts for the 2016 financial year, which are positioned at the top
end of the range and above consensus. We are targeting sales of EUR1,016.3m (+31.7% on the
previous year, +20.3% like-for-like) vs a consensus of EUR1,013.9m, and an EBITDA of
EUR306.3m (margin of 29.9%, +60bps, a level which would constitute a new record for the group) vs
a consensus of EUR303.0m (margin of 29.9%). These figures include the decline of interchange fees,
namely a negative impact of EUR30m on the revenue but neutral on the EPS (less revenue offset by
higher gross margin). As a result, our restated group net income is of EUR225.9m (margin +100bps
to 22.2%, excluding Visa Europe and other exceptional items) vs a consensus of EUR212.2m.
Fig. 12: Treatment of the sale of Visa Europe at Wirecard (0.5% stake)
Main deal Visa Inc has agreed to buy Visa Europe for as much as EUR21.2bn.
The aim is to regain ground lost to rival MasterCard.
Background and deal structure
for Wirecard
Proceeds from Visa Europe sale are based on the membership of Wirecard Bank AG and
Wirecard Card Solutions Ltd.
Closing on June 21, 2016:
- cash component: EUR71.8m,
- preferred stock component : EUR25.6m,
- deferred cash to be paid in three years closing: EUR6.2m.
Balance sheet and P&L effects • Release of the revaluation reserve recorded as of 31st December 2015 (except for the
effects of the preferred stock).
• Increase in cash & cash equivalents in the amount of EUR71.8m.
• Preferred stock classified as „available for sale financial assets“, valued with a discount
and based on market value of Visa Inc A-shares. EUR14.1m recorded in financial and
other assets. Subsequent changes in the valuation will be booked against equity.
• EUR5.7m deferred cash recorded in financial and other assets based on its discounted
value.
• EUR91.7m profit shown in „other financial income.
• Profit of the sale is taxable at 5% for Wirecard Bank in Germany.
Source: Wirecard.
In the past few years, the management has regularly revised up its annual guidance over the
course of the year (one upwards revision already this year, at the end of March). On average, the
company has reported EBITDA 2% above the middle of its initial range. This outperformance was
6% in 2015 and we expect the same magnitude in 2016. Lastly, each year the group has reported a
figure increasingly closer to the top of its initial guidance range, even surpassing the top end for the
first time in 2015. Here too, we expect a similar scenario this year.

Wirecard
13
Fig. 13: Management track record over 2010/15 (EBITDA vs initial guidance)
Year 2010 2011 2012 2013 2014 2015
EURm Init.
Guid.
Rep.
Fig.
Init.
Guid.
Rep.
Fig.
Init.
Guid.
Rep.
Fig.
Init.
Guid.
Rep.
Fig.
Init.
Guid.
Rep.
Fig.
Init.
Guid.
Rep.
Fig.
EBITDA 70-75 73.3 81-89 84.4 103-115 109.2 120-130 126.0 160-175 172.9 205-225 227.2
Mid-point 72.5 73.3 85.0 84.4 109.0 109.2 125.0 126.0 167.5 172.9 215.0 227.2
Reported vs.
mid-point +1.1% -0.7% +0.2% +0.8% +3.2%
+5.7%
Reported vs.
upper range -2.3% -5.2% -5.0% -3.1% -1.2%
+1.0%
Source: Bryan, Garnier & Co.
Fig. 14: Initial guidance 2016 vs. BG estimates
Year 2016
EURm Init. Guid. BG est.
EBITDA 280-300 306.0
Mid-point 290
BG est. vs. mid-point +5.5%
BG vs. upper range +2.0%
Source: Bryan, Garnier & Co ests.
In our view, these remarkable performances are explained by the strategy deployed by the
group since 2009. The group started by signing contracts with merchants with substantial transaction
volumes everywhere in the world (a strategy focused on medium/large-scale merchants) and requiring
complex solutions (e.g. transaction volumes in several different countries, with different currencies,
etc.). Wirecard is aiming to combine the functions of payment services provider and acquirer,
i.e. enable merchants to accept electronic payments on their websites (Wirecard is agnostic as regards
the payment systems it integrates, supporting both cards and alternative payment methods) while
acting as their bank. The bulk of Wirecard’s sales is thus based on commercial relationships with
merchants, who outsource to Wirecard the processing of their payments. Wirecard is focusing on e-
merchants located in Europe (Germany remains its number one country), in South-East Asia
(Singapore, Malaysia, Indonesia, Vietnam and Thailand) and South Africa and, since 2015, Australia-
Pacific/New Zealand. In the fullness of time, it will also address both North and South America
(both are attractive for e-commerce: 12% of retailing is e-commerce in the US and 2% in Brazil).
Fig. 15: Wirecard’s current exposure to B2B and B2C
EURm Payment processing
& Risk management
Acquiring Issuing Call Centre &
Communication
Services
Wirecard’s
exposure
B2B 95%
B2C 5%
Comments
Products & services for
the acceptance ,
implementation and the
downstream processing
of e-payments
Merchants are offered
settlement services for
credit card sales for
online and terminal
payments
Prepaid cards are
issued to private and
business customers.
Mobile payment will
contribute in the future.
Call centre support,
aftersales service to
customers.
100%
Source: Bryan, Garnier & Co. Ests.

Wirecard
14
Fig. 16: Categorisation of merchants and average fees at Wirecard
EURm Small Mid Large
Merchant’s transaction volume per month <1 1-5 >5
Average 2.8% 1.2%
Source: Bryan, Garnier & Co ests.
Fig. 17: Average transaction volume by merchant (in EURm): CAGR +14%
Sources: Company Data; Bryan, Garnier & Co.
In 2015, the average fee received by Wirecard was 1.6% (1.4% in Europe and 2.1% outside
Europe). We expect a continued progressive reduction in the group’s fee (in line with the historic
trend: Wirecard is enjoying more and more success with large merchants where fees are lower) but on
a transaction volume which more than offsets this phenomenon (driven by the e-commerce and
mobile payment solution dynamic, and the growing exposure to emerging countries).
Fig. 18: Average fee for Wirecard (% of the transaction processed)
EUR 2009 2010 2011 2012 2013 2014 2015 2016e 2017e 2018e 2019e 2020e
Revenue (m) 228.5 271.6 324.8 394.6 481.6 601.0 771.3 1,015.9 1,344.5 1,598.7 1,880.4 2,197.9
Y/Y growth (%) 16.1 18.9 19.6 21.5 22.1 24.8 28.3 31.7 32.3 18.9 17.6 16.9
Y/Y organic growth (%) 16.1 18.9 19.6 17.2 17.6 21.0 23.2 20.3 21.0 18.9 17.6 16.9
Transaction processed (bn) 10.6 12.6 15.5 20.8 26.7 34.3 45.2 61.0 82.4 107.1 133.9 160.6
Y/Y growth (%) - 18.9 23.0 34.2 28.4 28.5 31.8 35.0 35.0 30.0 25.0 20.0
Average fee (%) 2.16 2.16 2.10 1.90 1.80 1.75 1.60 1.56 1.53 1.40 1.31 1.28
Source: Bryan, Garnier & Co ests.
The group is benefiting from some ground-breaking developments, namely the growing trend
towards electronic payments, e-commerce and the demand for seamless and secure solutions
(payment platform on the merchant side and purchasing experience on the customer side) irrespective
of the channel or method of payment. It has been able to adapt to behavioural changes
(customers increasingly connected to the internet and increasingly mobile), to the highest security
standards (PCI DSS certification on its international services platform) and to regulation (its
geographical coverage and various partnerships enable the group to offer solutions adapted to each
country). All the above, combined with its cutting-edge technology in e-commerce and m-
commerce (specialist in online payment with economies of scale linked to the processed transaction
volume on its proprietary platform), its development in the banking business via Wirecard Bank
(acquisition and issuance of cards) and its geographical mix oriented towards the emerging markets
(including South-East Asis which is a rapidly-growing region for online payment; it is even the leader
0.961.05
1.19
1.49
1.67
1.81
2.05
0.6
0.8
1
1.2
1.4
1.6
1.8
2
2.2
2009 2010 2011 2012 2013 2014 2015

Wirecard
15
in Singapore, Indonesia and Vietnam) all explain the strong growth in the group’s sales and
gross margin (+20% like-for-like and +350bps respectively over 2011/15).
Overall, for the next few years, Wirecard will continue to generate double-digit growth and a
margin of over 30% even with the recent acquisitions (see below for the drivers).
Fig. 19: Current drivers of the group’s growth and margin
B2C e-commerce in Western countries Market growth: 12% (CAGR 2013-18).
Transaction volume Increase in transaction volume processed with existing and new customers.
Economies of scale Economies of scale from transaction-oriented business model.
Cross-selling Cross-selling effects with existing customers.
Integrated capabilities Competitive advantage from integrated capabilities across online, mobile and POS
channels.
Further growth Driven by technological leadership, experience and global footprint.
Wirecard Bank Expanding issuing and bank services, including mobile services.
Mobile-payments First earnings contributions from m-payments.
Falling interchange fee The interchange fee is a cost of sale which is passed to the merchant. We believe
smaller merchants may not demand that the entire fall is passed on to them. This
will result in an incremental gross profit for Wirecard.
M&A transactions Earnings contributions from M&A transactions.
Source: Bryan, Garnier & Co ests.
Fig. 20: Trend in sales (EURm) and EBITDA margin over 15 years (2006-2020e)
Source: Company Data; Bryan, Garnier & Co ests..
In our view, Wirecard enjoys the best possible positioning in payments, explaining why it has
by far the best fundamentals of all the payment players under our coverage. By way of
illustration, we present below a comparison table of the KPIs of the European payment players,
harmonising the reporting in 2016e.
0%
5%
10%
15%
20%
25%
30%
35%
0
500
1,000
1,500
2,000
2,500
2006 2007 2008 2009 2010 2011 2012 2013 2014 2015 2016e 2017e 2018e 2019e 2020e
Revenue EBITDA margin
Wirecard
16
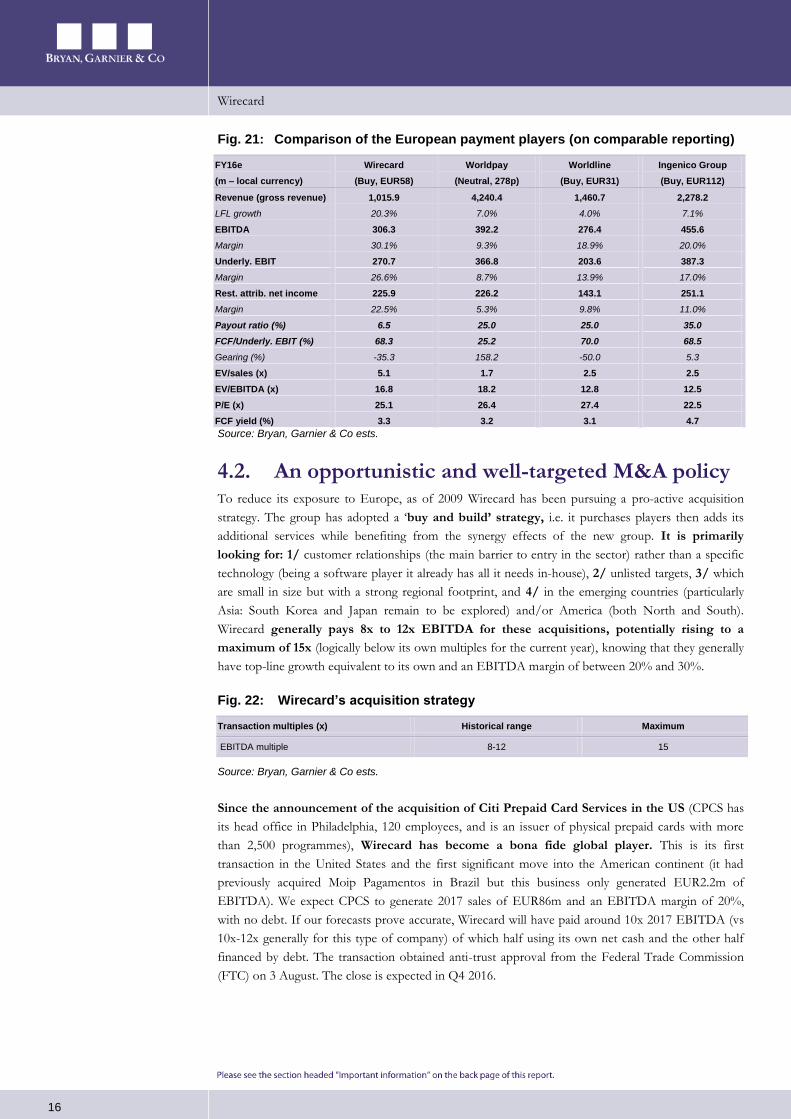
Fig. 21: Comparison of the European payment players (on comparable reporting)
FY16e
(m – local currency)
Wirecard
(Buy, EUR58)
Worldpay
(Neutral, 278p)
Worldline
(Buy, EUR31)
Ingenico Group
(Buy, EUR112)
Revenue (gross revenue) 1,015.9 4,240.4 1,460.7 2,278.2
LFL growth 20.3% 7.0% 4.0% 7.1%
EBITDA 306.3 392.2 276.4 455.6
Margin 30.1% 9.3% 18.9% 20.0%
Underly. EBIT 270.7 366.8 203.6 387.3
Margin 26.6% 8.7% 13.9% 17.0%
Rest. attrib. net income 225.9 226.2 143.1 251.1
Margin 22.5% 5.3% 9.8% 11.0%
Payout ratio (%) 6.5 25.0 25.0 35.0
FCF/Underly. EBIT (%) 68.3 25.2 70.0 68.5
Gearing (%) -35.3 158.2 -50.0 5.3
EV/sales (x) 5.1 1.7 2.5 2.5
EV/EBITDA (x) 16.8 18.2 12.8 12.5
P/E (x) 25.1 26.4 27.4 22.5
FCF yield (%) 3.3 3.2 3.1 4.7
Source: Bryan, Garnier & Co ests.
4.2. An opportunistic and well-targeted M&A policy To reduce its exposure to Europe, as of 2009 Wirecard has been pursuing a pro-active acquisition
strategy. The group has adopted a ‘buy and build’ strategy, i.e. it purchases players then adds its
additional services while benefiting from the synergy effects of the new group. It is primarily
looking for: 1/ customer relationships (the main barrier to entry in the sector) rather than a specific
technology (being a software player it already has all it needs in-house), 2/ unlisted targets, 3/ which
are small in size but with a strong regional footprint, and 4/ in the emerging countries (particularly
Asia: South Korea and Japan remain to be explored) and/or America (both North and South).
Wirecard generally pays 8x to 12x EBITDA for these acquisitions, potentially rising to a
maximum of 15x (logically below its own multiples for the current year), knowing that they generally
have top-line growth equivalent to its own and an EBITDA margin of between 20% and 30%.
Fig. 22: Wirecard’s acquisition strategy
Transaction multiples (x) Historical range Maximum
EBITDA multiple 8-12 15
Source: Bryan, Garnier & Co ests.
Since the announcement of the acquisition of Citi Prepaid Card Services in the US (CPCS has
its head office in Philadelphia, 120 employees, and is an issuer of physical prepaid cards with more
than 2,500 programmes), Wirecard has become a bona fide global player. This is its first
transaction in the United States and the first significant move into the American continent (it had
previously acquired Moip Pagamentos in Brazil but this business only generated EUR2.2m of
EBITDA). We expect CPCS to generate 2017 sales of EUR86m and an EBITDA margin of 20%,
with no debt. If our forecasts prove accurate, Wirecard will have paid around 10x 2017 EBITDA (vs
10x-12x generally for this type of company) of which half using its own net cash and the other half
financed by debt. The transaction obtained anti-trust approval from the Federal Trade Commission
(FTC) on 3 August. The close is expected in Q4 2016.

Wirecard
17
In our view this transaction is sensible in that it gives Wirecard:
- a coverage across all the continents.
- access to a diversified (telecommunication services, IT companies, electronics
manufacturers, life sciences companies, internet, consumer goods and public sector
companies) and top-notch customer portfolio (companies figuring in the Fortune 2000
ranking).
- a complementary offer in card issuer services (Wirecard will enable their dematerialisation
and the target company to benefit from mobile payment solutions and high-value-added data
services, etc.)
- in the medium term, the possibility of expanding its issuer activity to card acquisition
(incremental business).
When we integrated CPCS into our model, for reasons of prudence we only consolidated the
company over its current scope (issuance of physical prepaid cards) and solely as of 2017. Despite
this, the accretion for our EPS already averages 2.3% over 2017/18e (+2.2% and +2.4%
respectively). In the next few years, the organic growth profile of this entity should be of the order of
10%/15% in respect of sales (i.e. excluding any additional growth coming from acquiring and other
value-added online services) and its margin should progressively converge with that of Wirecard
(operational leverage on the technological platforms). It also appears that US investors, who have
been aggressively shorting the stock in recent months, have been revisiting the investment
case since the acquisition of this Citi subsidiary. In addition to being the preferred member of
Visa, and working with MasterCard, this acquisition further bolsters Wirecard’s credibility and that of
its operations, thereby discrediting the gratuitous accusations figuring in the Zatarra report.
Fig. 23: Wirecard is now a global PSP
Source: Company data
For the moment, the group does not cover Chinese e-merchants (as in many industries there, the
market is very closed and remains in the hands of local players) or e-merchants based in the United
States/Canada. There could well be changes at this level, i.e. via a joint-venture with a local player or
the opening of a local office. Whatever happens, on the consumer side, Wirecard enables
Chinese, American and Canadian customers to pay over its online platforms (this customer
base travels a great deal) thanks to its partnerships with local payment solutions (e.g. in Asia with
China Union Pay, Alipay, etc. and similarly in the US).

Wirecard
18
Fig. 24: Breakdown of 2015 sales by geography
Source: Company Data.
4.3. The 2020 plan: ambitious but realistic
Last May saw Wirecard’s 2020 financial targets (excluding acquisitions) presented in London,
setting the following route map:
- A transaction volume which is expected to move from EUR45.2bn in 2015 to more than
EUR160bn in 2020, i.e. a CAGR of +28.8%, of which +25% in Europe and +40% outside
Europe (mainly in India).
- Organic sales of EUR2.1bn, i.e. a CAGR of +22.2% (vs BG: EUR2.2bn with the latest
acquisitions).
- An EBITDA margin of between 30% and 35% (vs BG: 31.6% with the latest acquisitions).
- An EBITDA to FCF conversion rate of more than 65% (vs BG: 56.3%), limiting capex to
7%/8% of sales on average over the period (vs BG: 7.8% on average over 2016/20) and
with a neutral or even negative WCR over the medium term (fee-revenue-based model).
Fig. 25: 2020 strategic plan (excluding acquisitions)
EURbn 2020 financial targets (lfl) CAGR BG est.
Transaction volume 160 +28.8%
Revenues 2.1 +22.2% 2.2
EBITDA margin 30-35% 31.6%
FCF/EBITDA conversion (%) >65 56.3%
Sources: Company Data; Bryan, Garnier & Co est.
The three main assumptions that will help the company to achieve these medium-term
targets are:
1/ the convergence between online, mobile and physical points of sales via the internet technology
(omni-channel offer).
Germany43%
Europe w/o Germany
27%
Other countries30%

Wirecard
19
Fig. 26: The multi-channel offer as seen by Wirecard
Data driven
commerce
• Real-time, data driven retail is the new imperative
• Next generation POS systems must integrate all data-sources across sales channels and back office
systems to deliver a holistic, on-demand insight into retailers’ KPIs
Personalisation • To enable a truly personalized experience POS systems need to maintain a unified customer profile by
facilitating online & offline customer data collection
Two-way communication with consumers’ via web, mobile and social media channels is a must
Empowering shop
associate
• Shoppers may prefer researching products online but brick-and-mortar stores remain the first choice
when making purchases
• Retailers need to adapt a mobile-first approach at the POS – from empowering associates with relevant
information to bringing checkout process to the store aisle.
New payment
schemes
• POS infrastructure cannot remain static for long times. It has to follow constant shifts in payments and
security landscape. Consumers increasingly vote with their digital wallets, and merchants that cannot
adapt will be left behind
New fulfilment
strategies
• POS must be able to support fulfilment and returns in a non-linear buying process, yet many systems fail
to meet these needs from both consumer and merchant perspective
Source: Company Data.
2/ a progressive but steady extension in the payments and services value chain towards associated
added value (+20% targeted by the group by 2020).
Fig. 27: Extension of the value chain in the developed countries (Europe)
Source: Company data
Fig. 28: Extension of the value chain in the emerging countries
Source: Company data

Wirecard
20
3/ the globalisation of payment technologies, principal licensing frameworks, risk management, value-
added services and big data, but also the extension of proprietary platforms and hubs to all the
geographies that will be deemed relevant.
Fig. 29: From the status quo to the 2020 vision
Statut quo Vision 2020
• Leading position in Europe • Addressing all relevant markets with:
• Dominant position in South-East Asia - Global payment technology
• Outsider in Americas: acquisition of Citi Prepaid Card
Services in the US and Moip Pagamentos in Brazil
- Global licensing framework
• Global provision of payment technology - Global risk management
• Global airline & travel licences - Global provision value added services and big data
• Adding relevant global markets - Hubs in all relevant geographies
• Addressing needs of local and global merchants • One global technology platform, one global licensing
framework, global sales and service hubs
Source: Company Data.
Fig. 30: Extension of the proprietary platform at global level
Source: Company data
Lastly, the players all see the multi-channel offer as the future for the payments industry but
don’t all see the route map in the same way. Wirecard believes that the internet technology will
ultimately arrive naturally in stores. And as there is a premium for the first entrant, we understand
rather better why its priority is to expand globally as of today.
Fig. 31: The internet arrives in stores
Source: Company data

Wirecard
21
Within online, the fastest-growing segment will be mobile payment solutions (since starting
from a low base). If we believe that all consumers will in time end up paying for everything with their
mobile phones, Wirecard is the only PSP to be credible currently, in our view, for this type of
solution. We deem it to be the best placed thanks to its initial positioning on prepaid cards. Given
that its cards (white brand or co-branded, or under its own brand) are already dematerialised they are
easy to download to an NFC smartphone. We are believers in the short term since prepaid cards
are less problematic in the event of loss or theft, thereby encouraging their use (unlike debit
cards, they are not linked to a bank account) since the card holder will only lose the amount loaded on
the card. The group has, moreover, already signed several partnerships in this area and its position as
technology provider and PSP for this type of application is set to expand (2015 EBITDA of
EUR3.8m and a BG forecast of EUR5.5m in 2016). It generally deals with processing services, money
loading and payments between users, etc. and also offers TSM and TSH-type (downloading
platforms) software services for the electronic management of loyalty programmes, etc. ‘Boon’, the
company’s first fully-digital mobile payment solution (with associated value-added services) is in this
respect very promising. Mobile payment solutions represent one of the group’s growth drivers
for the second half of its 2020 plan.
Fig. 32: Breakdown of sales and profitability from 2014 to 2020e
EURm 2014 2015 2016e Cons. 2017e Cons. 2018e 2019e 2020e
Sales 601.0 771.4 1,015.9 1,013.9 1,344.5 1,276.4 1,598.7 1,880.4 2,197.9
Y/Y change 24.8% 28.3% 31.7% 31.4% 32.3% 25.9% 18.9% 17.6% 16.9%
Y/Y change (lfl) 21.0% 23.2% 20.3% 21.0% 18.9% 17.6% 16.9%
EBITDA 172.9 227.3 306.3 303.0 403.1 384.0 488.1 583.7 695.2
Margin 28.8% 29.5% 30.1% 29.9% 30.0% 30.1% 30.5% 31.0% 31.6%
EBIT 132.9 172.8 241.3 317.1 385.7 463.3 554.5
Margin 22.1% 22.4% 23.7% 23.6% 24.1% 24.6% 25.2%
Current EBIT 150.4 197.4 270.7 356.1 432.1 517.8 618.2
Margin 25.0% 25.6% 26.6% 26.5% 27.0% 27.5% 28.1%
Attrib. net profit 107.9 142.6 272.5 212.4 260.6 260.1 319.5 385.9 463.0
Margin 18.0% 18.5% 26.8% 20.9% 19.4% 20.4% 20.0% 20.5% 21.1%
Rest. attrib. net profit 123.0 163.8 225.9 293.6 358.7 432.0 516.8
Margin 20.5% 21.2% 22.2% 21.8% 22.4% 23.0% 23.5%
EPS 0.89 1.16 2.17 1.89 2.11 2.08 2.59 3.12 3.75
Rest. EPS (fully diluted) 1.01 1.33 1.83 2.38 2.90 3.50 4.18
Y/Y change 23.4% 31.4% 37.9% 30.0% 22.2% 20.4% 19.6%
P/E
Sources: Bryan, Garnier & Co ests; Thomson Reuters.
When we compare our estimates with those of the consensus, the latter does not appear to have
factored the accounting effect of the sale of Visa Europe to Visa Inc into the 2016 financial
statements (Wirecard had a shareholding of around 0.5%, see chart 12), or the recent acquisition
of Citi Prepaid Card Services into its 2017 forecasts (see our part 4.2).
In this payment industry dominated by the race for scale (organic or acquisition-driven), we
deem the final arbiter in stock valuation to be the PEG ratio. On this metric, Wirecard looks
particularly compelling with P/Es of 25.1x in 2016 and 19.3x in 2017 compared with restated EPS
growth of 37.9% and 30.0% respectively.

Wirecard
22
5. The momentum is returning positive
5.1. History: multiple attacks The first few months of the year were marked by the publication of a hundred-or-so-page
research note levelling accusations at Wirecard (24/02/16), published by an unknown
investment bank named Zatarra Research (for which we know neither the place of incorporation for
the company nor the names of the directors). With no tangible proof, the latter accused Wirecard of
fraud, money laundering and having facilitated evasion of the US restrictions on online gambling.
Lastly, Zatarra valued the company at a share price of zero. Obviously enough to unleash a real
panic amongst investors (these accusations pointing to the risk of licence losses with Visa and
MasterCard), especially since, during this same period, the research house and short seller Muddy
Waters Research had laid into Casino (the major difference being that Muddy Waters is known, its
founder Carson Block signs its research reports, it has a track record and criticises companies from a
real accounting and financial perspective).
The target was all the easier in that Wirecard is a purely online player, making international
acquisitions, and that this is not the first time in its history that it has had to contend with
false rumours. This has tended to happen at key moments in its history, namely transformations in
scale: when it moved from being a small to a medium-sized company (the two first attacks) and lastly
when it became a group with global reach. It is extremely important to stress that the company
has always emerged exonerated and strengthened by these different experiences. Finally, these
destablisation attempts aim to sully its reputation to generate a short-term profit from short selling.
Following multiple discussions with the company and in view of its track record, it seems clear to us
that Zatarra was surfing on the Muddy Waters effect and invented a fiction based on past rumours
regarding the group (the past incidents having always been settled in favour of Wirecard) with the sole
aim of generating a profit with the support of hedge funds. Lastly, 95% of the research report is false
(the context and all the allegations against the company) and 5% true (the individuals and the
companies mentioned do exist). The successful bouts of short-selling in 2008 and 2010 no doubt
inspired Zatarra to see through its strategy:
1/ In 2008, Wirecard was drawn into a legal battle with the director of SDK, a German association of
small shareholders, who accused the company of having falsified its accounting in 2007 and having
hidden illegal activities. Wirecard rapidly denied this and expedited an audit of its financial statements
by Ernst & Young to verify any anomalies. This audit was made public in 2008. The director of SDK
subsequently resigned and was investigated for share price manipulation and trading operations ahead
of the publication of negative reports on a number of listed companies (including Wirecard). He was
fined and served a prison sentence.
2/ In 2010, a report claimed that Wirecard had been cited in a US criminal procedure against a
resident of Florida, who finally pleaded guilty for having set up an unauthorised funds transfer
business. According to the charge, ‘the man allegedly used Wirecard Bank to transfer the money from
a UK company to the United States’. Wirecard then issued a press release stating that ‘the individual
was and is in no way associated with the Wirecard group. The company strongly and categorically
refutes all the allegations raising suspicion regarding the laundering of illegimate funds.’
These two incidents had a highly negative impact on the share price. Two key individuals
behind these attacks served prison terms in Germany and there were no proceedings engaged
against Wirecard.

Wirecard
23
3/ In April 2015, a journalist for the Alphaville blog (hosted by the Financial Times) published the
first episode in a series on Wirecard, entitled the ‘House of Wirecard’, questioning the very existence
of the company, its acquisitions, etc.
4/ In November 2015, a so-called ‘research report’ published by JCap, a research boutique in Hong
Kong, essentially consisted of questioning the group’s acqusitions in Asia (Great Indian Retail Group,
etc.), knowing that this report was far from acceptable in terms of its quality or ethical standards
(biased arguments serving the interests of third parties like competitors, for example). Given the lack
of credibility of this research, there was little impact on the share price.
5/ In February 2016, another unknown company (Zatarra Research) published a this-time-unsigned
report, accusing the company of fraud, money laundering and facilitating evasion of the US
restrictions on online gambling services. This report had a real share price impact since it was more
detailed (some hundred pages) and more complex to address in that it recycled past false rumours
(those of 2008 and 2010, putting senior executives and members of the Board of Directors in a false
context), mixing up the rumours and trying to reconcile the facts to suggest that Wireward had been
behind all this.
As luck would have it, no sooner were these JCap and Zatarra reports published (albeit by unknown
companies) then they were picked up by the Alphaville journalist and thus found themselves on the
Financial Times website and subsequently on the Bloomberg news feed… hence the share price
impact. There is a clear correlation between these publications (the ‘House of Wirecard’ series,
articles on the JCap and Zatarra reports) and the beginning of the build up of short positions in
the stock (this level even reached a peak of c.23% of the capital, coming mainly from US funds). It is
impossible for us to verify all the data in the Zatarra report as this would require a detective and not a
sell-side analyst…What is certain is that this strong correlation merits at least an investigation on the
part of the regulator for share price manipulation. This is moreover what BaFin (the German stock
market regulator) ended up by stating (the 25% intraday share price fall on the day the Zatarra report
was published having attracted its attention).
Fig. 33: Short positions in Wirecard shares (01/11/12 – 05/09/16)
Source: shortsell.nl (Nov. 2012 - July 2016)
When participating in our TMT conference (last March), the Wirecard management told us
that they were not the least concerned about losing clients and expected no operational
impact on the business. We can only note that this seems to be the case since the make-up of the
latest results remains very positive. Moreoever a number of agreements with Visa have since been
announced, only a few days after the publication of the aforementioned first report (2 March:
announcement of the launch of mycard2go, a new prepaid Visa card). The group does not work with
consumers but with a top-notch business customer base and enjoys their full support. Note,
moreover, that Wirecard is the partner of choice for Visa, that it has a very good relationship with

Wirecard
24
MasterCard and has 60 major airlines in its portfolio. Both its customers and some of its
competitors have sent messages of support. The CEO of another PSP even confided to us that he
had been shocked by this whole business because he does not believe the accusations against
Wirecard (who he knows very well and admires its track record) and because this type of incident can
impact any payment or services player. ‘Replace the name Wirecard by our own and that also works!’
It is absolutely vital to identify the individuals hiding behind Zatarra to be able to bring them
to justice so that this situation does not recur in future.
For the past few months the group has not only engaged the services of specialised lawyers and a
large US investigation firm (Kroll) but also provided more transparency in terms of the information in
its slide shows and presentations. It is even officially in discussions with a number of partners with a
view to their potentially entering its share capital and could, in our view, even initiate changes to its
Board of Directors. In the light of the affair mentioned above, and following our discussions with
sector companies, the accusations leveled at Wirecard have provided more of an opportunity to buy
the stock at a cheap price rather than constituted a reason for concern. Lastly, as after the earlier
rumours, in our view the stock is now ready to head higher and reconnect with the concrete,
i.e. its solid fundamentals.
Fig. 34: Historique du cours de Wirecard
Sources: Thomson Reuters
0
5
10
15
20
25
30
35
40
45
50
WIRECARD (XET)

Wirecard
25
5.2. The future: an undeniable speculative attraction In payment services, the most recent transactions were done at a multiple of 15.2x EV/EBITDA
vs 16.8x and 12.5x for Wirecard at the current share price on our 2016 and 2017 numbers.
Fig. 35: Main M&A transactions in payment services
Date Target Acquirer Country EV
(EURm)
EBITDA
multiple (x)
Dec-09 Worldpay Bain Capital/Advent UK 2,030 8.2
Nov-09 Easycash Ingenico Group Germany 284 13.0
Apr-10 Mercury Payment Syst. Sylver Lake USA 726 14.8
Aug-10 DataCash MasterCard UK 520 19.5
Dec-10 Loyalty Partner American Express Germany 496 10.8
Jan-13 Ogone Ingenico Group Belgium 360 29.0
Feb-13 NetSpend Total System Services USA 1,400 14.6
Aug-13 Skrill CVC Capital Partners UK 600 12.0
Jan-14 PayPros Global Payments USA 420 19.1
Mar-14 NETS Bain Capital/Advent/ATP Denmark 2,300 12.4
May-14 Mercury Payment Syst. Vantiv USA 1650 17.7
Oct-14 DIBS NETS Sweden 790 17.9
Oct-14 GlobalCollect Ingenico Group Netherlands 820 16.4
Oct-14 TransFirst Vista Equity Partners USA 1,500 13.2
Mar-15 Skrill Optimal Payments UK 1,100 13.5
May-15 ICBPI Bain Capital/Advent/Clessidra Italy 2,150 11.0
Nov-15 Equens¹ Worldline Netherlands 1,490 11.8
Dec-15 Heartland Payment Syst. Global Payments USA 3,957 18.1
Average 15.2
¹ full price estimated i.e. cash out (Paysquare + transaction and reorganization costs) and buyout of 100% of
the JV (Equens Worldline).
Source: Bryan, Garnier & Co.
It is interesting to note that the transactions involving bank card issuance processing players are
done at 10x-12x, and those for physical merchant acquirers at 12x-15x (transaction multiples
relatively stable over time). On the other hand, there has been real inflation in the multiples paid
for online payment solutions, moving from 13x EBITDA to 15x, to 17x+ and increasingly at
20x+. All the players in the payments industry are looking to reinforce their businesses and in this
segment (with a high proportion of fixed costs) size matters, thus leading to acquisitions.
Fig. 36: Recent acquisition multiples in online payment services.
Conso. date Target Acquirer Country EV
(EURm)
Sales
multiple (x)
EBITDA
multiple (x)
January 2013 Ogone Ingenico Group Belgium 360 8.6 29
March 2014 NETS Capital/Advent/ATP Denmark 2,300 2.9 11
May 2014 Mercury Payment
Systems
Vantiv USA 1,650 7.0 18
October 2014 DIBS Nets Sweden 790 4.5 18
October 2014 GlobalCollect Ingenico Group The Netherlands 820 2.7 16
May 2015 ICBPI Bain
Capital/Advent/Clessidra
Italy 2,150 3.2 11
Source: Bryan, Garnier & Co ests.

Wirecard
26
In our view, Wirecard is the type of company which will sooner or later be acquired. In the
first instance, this could take place via the purchase of a simple minority stake. Wirecard’s
management has effectively confirmed that they are in discussions with several strategic partners
regarding their possible entry into the share capital. The group’s speculative attraction resides, in
particular, in the company’s positioning across the whole online payment value chain and its
atypical profile (supplier of payment services with, in addition, online banking services). It is the
global number two in e-commerce and one of the rare pure online players in the payment
solutions universe. While Worldpay is the leader in terms of market share, its e-commerce activity
only contributes 23% of its sales. Lastly, the player the most similar to Wirecard is the Dutch
company Adyen (in private equity hands).
Fig. 37: Market share of the European e-commerce players in 2015
In % Global market share Market share in Western Europe
Worldpay 6% 20
Wirecard 5% 18
Adyen 4% 15
Ingenico Group (Ogone + GlobalCollect) 3% 10
Top 4 18 63
Source: Bryan, Garnier & Co ests.
Lastly, note that Wirecard has a shareholder structure which leaves it open to a bid since its float
amounts to 93% (the management holding the remaining 7%). This combination of factors makes
it a rare player in the industry and consequently an ideal target.
In our view, the types of players with a potential interest in a technology company providing
online payment services are:
- Direct competitors or physical payment players looking to dispose of a multi-channel offer
or to expand their customer bases.
- Payment card networks or issuing banks looking to enrich their digital content.
- Advertising platforms/social media seeking integrated payment solutions.
- Electronic wallet providers looking to change scale.
- Private equity funds attracted by the high levels of growth and profitability for the online
payment players.
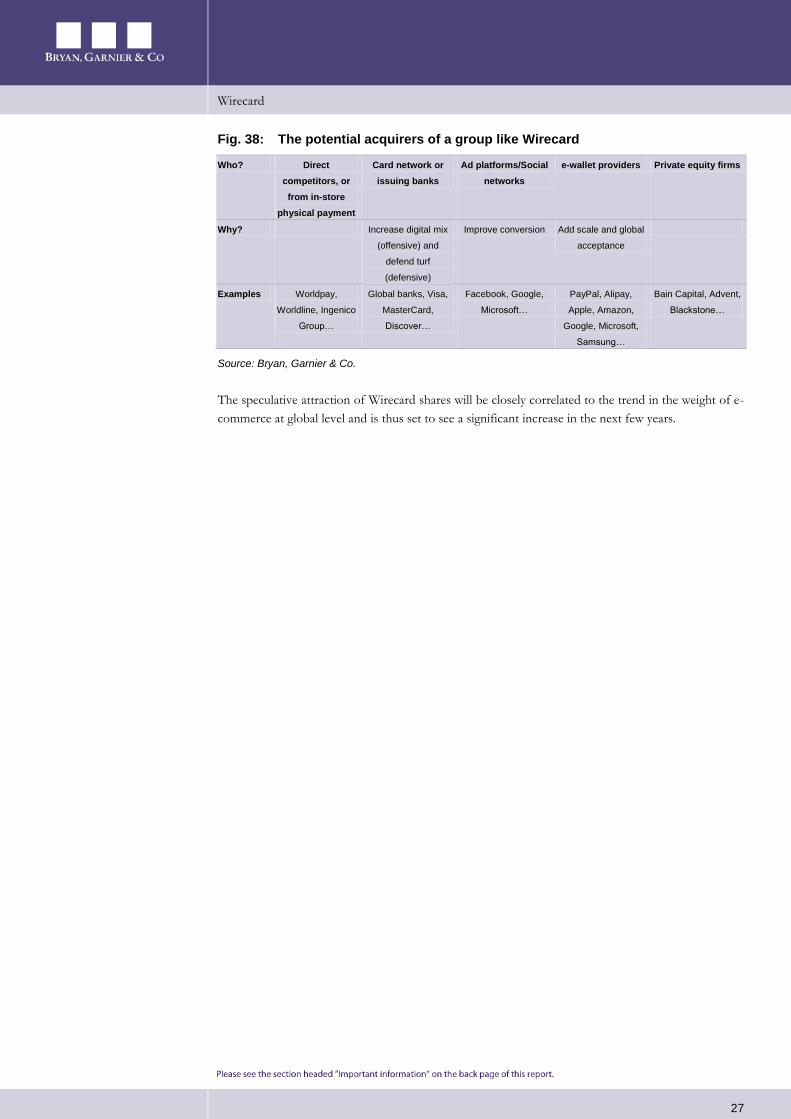
Wirecard
27
Fig. 38: The potential acquirers of a group like Wirecard
Who? Direct
competitors, or
from in-store
physical payment
Card network or
issuing banks
Ad platforms/Social
networks
e-wallet providers Private equity firms
Why? Increase digital mix
(offensive) and
defend turf
(defensive)
Improve conversion Add scale and global
acceptance
Examples Worldpay,
Worldline, Ingenico
Group…
Global banks, Visa,
MasterCard,
Discover…
Facebook, Google,
Microsoft…
PayPal, Alipay,
Apple, Amazon,
Google, Microsoft,
Samsung…
Bain Capital, Advent,
Blackstone…
Source: Bryan, Garnier & Co.
The speculative attraction of Wirecard shares will be closely correlated to the trend in the weight of e-
commerce at global level and is thus set to see a significant increase in the next few years.

Wirecard
28
Price Chart and Rating History
Wirecard
Ratings
Date Ratings Price
01/09/15 BUY EUR36.78
Target Price
Date Target price
06/09/16 EUR58
30/06/16 EUR54
18/11/15 EUR52
05/10/15 EUR51
01/09/15 EUR46
30.0
35.0
40.0
45.0
50.0
55.0
60.0
05/03/15 05/06/15 05/09/15 05/12/15 05/03/16 05/06/16 05/09/16
WIRECARD (XET) Fair Value Achat Neutre Vente

Wirecard
29
Bryan Garnier stock rating system For the purposes of this Report, the Bryan Garnier stock rating system is defined as follows:
Stock rating
BUY Positive opinion for a stock where we expect a favourable performance in absolute terms over a period of 6 months from the publication of a
recommendation. This opinion is based not only on the FV (the potential upside based on valuation), but also takes into account a number of
elements that could include a SWOT analysis, momentum, technical aspects or the sector backdrop. Every subsequent published update on the stock
will feature an introduction outlining the key reasons behind the opinion.
NEUTRAL Opinion recommending not to trade in a stock short-term, neither as a BUYER or a SELLER, due to a specific set of factors. This view is intended to
be temporary. It may reflect different situations, but in particular those where a fair value shows no significant potential or where an upcoming binary
event constitutes a high-risk that is difficult to quantify. Every subsequent published update on the stock will feature an introduction outlining the key
reasons behind the opinion.
SELL Negative opinion for a stock where we expect an unfavourable performance in absolute terms over a period of 6 months from the publication of a
recommendation. This opinion is based not only on the FV (the potential downside based on valuation), but also takes into account a number of
elements that could include a SWOT analysis, momentum, technical aspects or the sector backdrop. Every subsequent published update on the stock
will feature an introduction outlining the key reasons behind the opinion.
Distribution of stock ratings
BUY ratings 55.3% NEUTRAL ratings 33.3% SELL ratings 11.3%
Research Disclosure Legend
1 Bryan Garnier shareholding in Issuer
Bryan Garnier & Co Limited or another company in its group (together, the “Bryan Garnier Group”) has a shareholding that, individually or combined, exceeds 5% of the paid up and issued share capital of a company that is the subject of this Report (the “Issuer”).
No
2 Issuer shareholding in Bryan Garnier
The Issuer has a shareholding that exceeds 5% of the paid up and issued share capital of one or more members of the Bryan Garnier Group.
No
3 Financial interest A member of the Bryan Garnier Group holds one or more financial interests in relation to the Issuer which are significant in relation to this report
No
4 Market maker or liquidity provider
A member of the Bryan Garnier Group is a market maker or liquidity provider in the securities of the Issuer or in any related derivatives.
No
5 Lead/co-lead manager In the past twelve months, a member of the Bryan Garnier Group has been lead manager or co-lead manager of one or more publicly disclosed offers of securities of the Issuer or in any related derivatives.
No
6 Investment banking agreement
A member of the Bryan Garnier Group is or has in the past twelve months been party to an agreement with the Issuer relating to the provision of investment banking services, or has in that period received payment or been promised payment in respect of such services.
No
7 Research agreement A member of the Bryan Garnier Group is party to an agreement with the Issuer relating to the production of this Report.
No
8 Analyst receipt or purchase of shares in Issuer
The investment analyst or another person involved in the preparation of this Report has received or purchased shares of the Issuer prior to a public offering of those shares.
No
9 Remuneration of analyst The remuneration of the investment analyst or other persons involved in the preparation of this Report is tied to investment banking transactions performed by the Bryan Garnier Group.
No
10 Corporate finance client In the past twelve months a member of the Bryan Garnier Group has been remunerated for providing corporate finance services to the issuer or may expect to receive or intend to seek remuneration for corporate finance services from the Issuer in the next six months.
No
11 Analyst has short position The investment analyst or another person involved in the preparation of this Report has a short position in the securities or derivatives of the Issuer.
No
12 Analyst has long position The investment analyst or another person involved in the preparation of this Report has a long position in the securities or derivatives of the Issuer.
No
13 Bryan Garnier executive is an officer
A partner, director, officer, employee or agent of the Bryan Garnier Group, or a member of such person’s household, is a partner, director, officer or an employee of, or adviser to, the Issuer or one of its parents or subsidiaries. The name of such person or persons is disclosed above.
No
14 Analyst disclosure The analyst hereby certifies that neither the views expressed in the research, nor the timing of the publication of the research has been influenced by any knowledge of clients positions and that the views expressed in the report accurately reflect his/her personal views about the investment and issuer to which the report relates and that no part of his/her remuneration was, is or will be, directly or indirectly, related to the specific recommendations or views expressed in the report.
Yes
15 Other disclosures Other specific disclosures: Report sent to Issuer to verify factual accuracy (with the recommendation/rating, price target/spread and summary of conclusions removed).
No
A copy of the Bryan Garnier & Co Limited conflicts policy in relation to the production of research is available at www.bryangarnier.com

London
Beaufort House
15 St. Botolph Street
London EC3A 7BB
Tel: +44 (0) 207 332 2500
Fax: +44 (0) 207 332 2559
Authorised and regulated by the
Financial Conduct Authority (FCA)
Paris
26 Avenue des Champs Elysées
75008 Paris
Tel: +33 (0) 1 56 68 75 00
Fax: +33 (0) 1 56 68 75 01
Regulated by the
Financial Conduct Authority (FCA) and the
Autorité de Contrôle prudential et de
resolution (ACPR)
New York
750 Lexington Avenue
New York, NY 10022
Tel: +1 (0) 212 337 7000
Fax: +1 (0) 212 337 7002
FINRA and SIPC member
Munich
Widenmayerstrasse 29
80538 Munich
Germany
+49 89 2422 62 11
New Delhi
The Imperial Hotel Janpath
New Delhi 110 001
Tel +91 11 4132 6062
+91 98 1111 5119
Fax +91 11 2621 9062
Geneva
rue de Grenus 7
CP 2113
Genève 1, CH 1211
Tel +4122 731 3263
Fax+4122731 3243
Regulated by the FINMA Important information
This document is classified under the FCA Handbook as being investment research (independent research). Bryan Garnier & Co Limited has in place the measures and arrangements required for investment research as set out in the FCA’s Conduct of Business Sourcebook. This report is prepared by Bryan Garnier & Co Limited, registered in England Number 03034095 and its MIFID branch registered in France Number 452 605 512. Bryan Garnier & Co Limited is authorised and regulated by the Financial Conduct Authority (Firm Reference Number 178733) and is a member of the London Stock Exchange. Registered address: Beaufort House 15 St. Botolph Street, London EC3A 7BB, United Kingdom This Report is provided for information purposes only and does not constitute an offer, or a solicitation of an offer, to buy or sell relevant securities, including securities mentioned in this Report and options, warrants or rights to or interests in any such securities. This Report is for general circulation to clients of the Firm and as such is not, and should not be construed as, investment advice or a personal recommendation. No account is taken of the investment objectives, financial situation or particular needs of any person. The information and opinions contained in this Report have been compiled from and are based upon generally available information which the Firm believes to be reliable but the accuracy of which cannot be guaranteed. All components and estimates given are statements of the Firm, or an associated company’s, opinion only and no express representation or warranty is given or should be implied from such statements. All opinions expressed in this Report are subject to change without notice. To the fullest extent permitted by law neither the Firm nor any associated company accept any liability whatsoever for any direct or consequential loss arising from the use of this Report. Information may be available to the Firm and/or associated companies which are not reflected in this Report. The Firm or an associated company may have a consulting relationship with a company which is the subject of this Report. This Report may not be reproduced, distributed or published by you for any purpose except with the Firm’s prior written permission. The Firm reserves all rights in relation to this Report. Past performance information contained in this Report is not an indication of future performance. The information in this report has not been audited or verified by an independent party and should not be seen as an indication of returns which might be received by investors. Similarly, where projections, forecasts, targeted or illustrative returns or related statements or expressions of opinion are given (“Forward Looking Information”) they should not be regarded as a guarantee, prediction or definitive statement of fact or probability. Actual events and circumstances are difficult or impossible to predict and will differ from assumptions. A number of factors, in addition to the risk factors stated in this Report, could cause actual results to differ materially from those in any Forward Looking Information. Disclosures specific to clients in the United Kingdom This Report has not been approved by Bryan Garnier & Co Limited for the purposes of section 21 of the Financial Services and Markets Act 2000 because it is being distributed in the United Kingdom only to persons who have been classified by Bryan Garnier & Co Limited as professional clients or eligible counterparties. Any recipient who is not such a person should return the Report to Bryan Garnier & Co Limited immediately and should not rely on it for any purposes whatsoever. Notice to US investors This research report (the “Report”) was prepared by Bryan Garnier & Co Limited for information purposes only. The Report is intended for distribution in the United States to “Major US Institutional Investors” as defined in SEC Rule 15a-6 and may not be furnished to any other person in the United States. Each Major US Institutional Investor which receives a copy of this Report by its acceptance hereof represents and agrees that it shall not distribute or provide this Report to any other person. Any US person that desires to effect transactions in any security discussed in this Report should call or write to our US affiliated broker, Bryan Garnier Securities, LLC. 750 Lexington Avenue, New York NY 10022. Telephone: 1-212-337-7000. This Report is based on information obtained from sources that Bryan Garnier & Co Limited believes to be reliable and, to the best of its knowledge, contains no misleading, untrue or false statements but which it has not independently verified. Neither Bryan Garnier & Co Limited and/or Bryan Garnier Securities LLC make no guarantee, representation or warranty as to its accuracy or completeness. Expressions of opinion herein are subject to change without notice. This Report is not an offer to buy or sell any security. Bryan Garnier Securities, LLC and/or its affiliate, Bryan Garnier & Co Limited may own more than 1% of the securities of the company(ies) which is (are) the subject matter of this Report, may act as a market maker in the securities of the company(ies) discussed herein, may manage or co-manage a public offering of securities for the subject company(ies), may sell such securities to or buy them from customers on a principal basis and may also perform or seek to perform investment banking services for the company(ies).
Bryan Garnier Securities, LLC and/or Bryan Garnier & Co Limited are unaware of any actual, material conflict of interest of the research analyst who prepared this Report and are
also not aware that the research analyst knew or had reason to know of any actual, material conflict of interest at the time this Report is distributed or made available..