independent research semiconductors - bryan, garnier & co
TRANSCRIPT

r r
INDEPENDENT RESEARCH Semiconductors 21st July 2016 Looking for lost growth
Semiconductors
ARM HOLDINGS Tender to the offer FV 1410p vs.1340p
Bloomberg ARM.LN Reuters ARM.L
Price 1663p High/Low 1675/848.5
Market cap. GBP23,404m Enterprise Val GBP22,420m PE (2016e) 46.3x EV/EBIT (2016e) 47.0x ASML SELL FV EUR81 Bloomberg ASML NA Reuters ASML.AS Price EUR94.52 High/Low 94.52/71.75 Market Cap. EUR40,959m Enterprise Val EUR39,005m PE (2016e) 31.4x EV/EBIT (2016e) 26.5x DIALOG SEMICONDUCTOR BUY FV EUR37
vs. 35 Bloomberg DLG GR Reuters DLGS.DE Price EUR28.85 High/Low 53.269/24.42 Market Cap. EUR2,246m Enterprise Val EUR1,493m PE (2016e) 12.1x EV/EBIT (2016e) 4.4x INFINEON BUY
Top picks FV EUR16 vs. 15
Bloomberg IFX GY Reuters IFXGn.DE Price EUR13.915 High/Low 14.03/8.687 Market Cap. EUR15,754m Enterprise Val EUR15,195m PE (2016e) 17.1x EV/EBIT (2016e) 19.1x MELEXIS SELL FV EUR48
Coverage initiated Bloomberg MELE BB Reuters MLXS.BR Price EUR61 High/Low 61/37.7 Market Cap. EUR2,464m Enterprise Val EUR2,405m PE (2016e) 25.8x EV/EBIT (2016e) 21.6x
SOITEC NEUTRAL FV EUR0.5 vs. 0.45
Bloomberg SOI FP Reuters SOIT.PA Price EUR0.75 High/Low 0.75/0.3838 Market Cap. EUR455m Enterprise Val EUR480m PE (2016e) 15.7x EV/EBIT (2016e) 18.0x
STMICROELECTRONICS NEUTRAL FV EUR6.5 vs. 6.3
Bloomberg STM FP Reuters STM.FR Price EUR5.552 High/Low 7.44/4.608 Market Cap. EUR5,058m Enterprise Val EUR4,376m PE (2016e) 26.5x EV/EBIT (2016e) 16.6x u-blox BUY FV CHF265
Coverage initiated Bloomberg UBXN SW Reuters UBXN.S Price CHF228.5 High/Low 231.1/164 Market Cap. CHF1,555m Enterprise Val CHF1,485m PE (2016e) 33.3x EV/EBIT (2016e) 24.8x
For the semiconductors industry, 2015 and the first half of 2016 probably marked the start of a sluggish cycle. This market context has led to a radical change in the industry. A number of players are focusing on M&A while others are refocusing on their core business. The result is that yesterday's leaders are not necessarily tomorrow's leaders. In this backdrop, we recommend that investors favour specialists (or ultra-specialists) irrespective of their size.
Average growth of 0.6% for the next three years. Whereas the industry has been growing by more than 9% on average over the past 30 years, coming years are set to be sluggish. Growth has evaporated given the lack of momentum in the PC market and with a smartphone market no longer playing the role of catalyst in a sluggish economic backdrop.
The search for critical mass leading nowhere. While many observers consider that the record number of M&A operations seen in 2015 reflect a search for critical mass (and hence operating leverage), we are convinced that in the majority of cases, acquisitions are above all motivated by an aim to deliver short-term growth forecasts. We believe that, for the semiconductors industry, the preconceived idea that size is a success factor is no longer true. In contrast, we are convinced that in today's market focusing on unique expertise and a strong positioning in a small number of verticals is preferable.
In this changing environment, we believe that stock-picking is more essential than ever. We continue to favour players with strong positions in the automotive and industrial sectors. The two segments remain among the most dynamic with average 2015-18e growth rates of 6.8% and 7.5% respectively.
As such, we are initiating coverage of two medium-sized companies that are highly specialised: Melexis (Sell, FV EUR48) specialised in car components and u-blox (Buy, FV CHF265) specialised in positioning chips and connectivity for the automotive and industrial sectors.
Analyst: Sector Analyst Team: Dorian Terral Richard-Maxime Beaudoux 33(0) 1.56.68.75.92 Thomas Coudry [email protected] Gregory Ramirez

Semiconductors
2
Table of contents
1. Darwinism in the industry .............................................................................................................. 3
1.1. Growth at a standstill… .......................................................................................................................... 3
1.1.1. Sluggish economic backdrop to blame ................................................................................... 3
1.1.2. Increasingly strong correlation between global growth/industry growth ........................ 5
1.2. … leading to refocusing… ..................................................................................................................... 7
1.3. …and the rise in cannibalism ................................................................................................................. 9
2. Stock-picking more than necessary ............................................................................................. 12
2.1. The biggest are not necessarily the strongest .................................................................................... 12
2.1.1. The size of a player does not guarantee its success ............................................................ 12
2.1.2. Positioning is a more certain characteristic .......................................................................... 16
2.1.3. The auto and industrial robotisation sectors are strong catalysts .................................... 16
2.1.4. Focus on foundries, observation towers in industry .......................................................... 17
2.2. Opportunities in the universe we cover ............................................................................................. 19
ARM Holdings (Tender to the offer, FV 1410p vs. 1340p) ......................................................... 23
SoftBank leverages Brexit to acquire ARM ................................................................................................... 23
ASML(SELL, EUR81) ........................................................................................................................ 25
Unattactive risk reward profile......................................................................................................................... 25
Dialog Semiconductor (BUY, FV EUR37 vs. EUR35) ................................................................ 27
Low point reached ............................................................................................................................................. 27
Infineon (BUY top Picks, FV EUR16 vs. EUR15) ....................................................................... 29
Under Estimated Potential ............................................................................................................................... 29
Melexis (SELL Coverage initiated, FV EUR48) ............................................................................. 31
Even diamonds have a price ............................................................................................................................ 31
Soitec (NEUTRAL, FV EUR0.50 vs. EUR0.45) ........................................................................... 45
Waiting for FD-SOI orders .............................................................................................................................. 45
STMicroelectronics (NEUTRAL, FV EUR6.5 vs. EUR6.3) ........................................................ 47
The future remains blurred ............................................................................................................................... 47
u-blox (BUY Coverage initiated, FV CHF265) .............................................................................. 49
Not to miss the eCall ......................................................................................................................................... 49
Price Chart and Rating History ......................................................................................................... 62
Bryan Garnier stock rating system .................................................................................................... 63

Semiconductors
3
1. Darwinism in the industry In 2016, the semiconductors industry is more than ever in an extreme situation. While investments in the development of microchips seem to be a bottomless pit, their production requires outsized and expensive production facilities, involving, for example, the construction of fabs of more than three million square metres that house precision tools of less than half a nanometre (two atoms), costing up to USD12bn (e.g. Samsung plant in Pyeongtaek) and requiring 150,000 employees in white rooms. In the end, these tools are destined to become obsolete just two years after their installation while the chips that cost so much to develop become redundant after just a few months. However, players in the sector have managed to become accustomed to this hostile environment.
So far, the real challenges for chipmakers have been the lack of visibility, uncertainty and the cyclical nature of the business, although these factors have been offset by high growth. However, changes in both the environment and the behaviour of players have been noticed recently, thereby meaning the entire industry needs to evolve.
2015 was a sluggish year and the outlook for the next two years also points to a huge lack of momentum. We explain this by the lacklustre global economy prompting a structural change in the industry. The result is reduced volatility, better control of global production capacity and the development of cannibalistic behaviour in order to offset the lack of growth.
1.1. Growth at a standstill…
1.1.1. Sluggish economic backdrop to blame Comparison of historical changes in the semiconductors market and expectations for the sector in coming years, shows that a massive slowdown is on the cards. Indeed, while historical growth levels have often exceeded 25% over the past two decades with average annual growth of 9% over the past 30 years, forecasts for future years are for low single-digit growth.
Fig. 1: Average growth of 0.6% over the next three years
IC market by Component 2009 2010 2011 2012 2013 2014 2015 2016e 2017e 2018e CAGR 15-18e
Discrete Semiconductors 14.2 19.8 21.4 19.1 18.2 20.2 18.6 18.7 19.2 19.7 2.0%
Optoelectronics 17.0 21.7 23.1 26.2 27.6 29.9 33.3 33.9 35.5 36.8 3.4%
Sensors 4.8 6.9 8.0 8.0 8.0 8.5 8.8 9.5 9.8 10.1 4.8%
Integrated Circuits 190.3 249.9 247.1 238.2 251.8 277.3 274.5 265.1 269.1 274.3 0.0%
o/w Analog 32.0 42.3 42.3 39.3 40.1 44.4 45.2 45.7 47.1 48.4 2.3%
o/w Micro (MPU & MCU) 48.3 60.6 65.2 60.2 58.7 62.1 61.3 61.6 62.3 63.3 1.1%
o/w Logic (ASIC, ASSP, …) 65.2 77.4 78.8 81.7 85.9 91.6 90.8 88.5 88.7 89.7 -0.4%
o/w Memories 44.8 69.6 60.7 57.0 67.0 79.2 77.2 69.3 71.1 72.9 -1.9%
Total IC Market 226.3 298.3 299.5 291.6 305.6 335.8 335.2 327.2 333.7 340.9 0.6%
Sources: WSTS; Bryan, Garnier & Co ests.
Changes in both the environment and the behaviour of players have been noticed recently, thereby meaning the entire industry needs to evolve.
Semiconductors
4
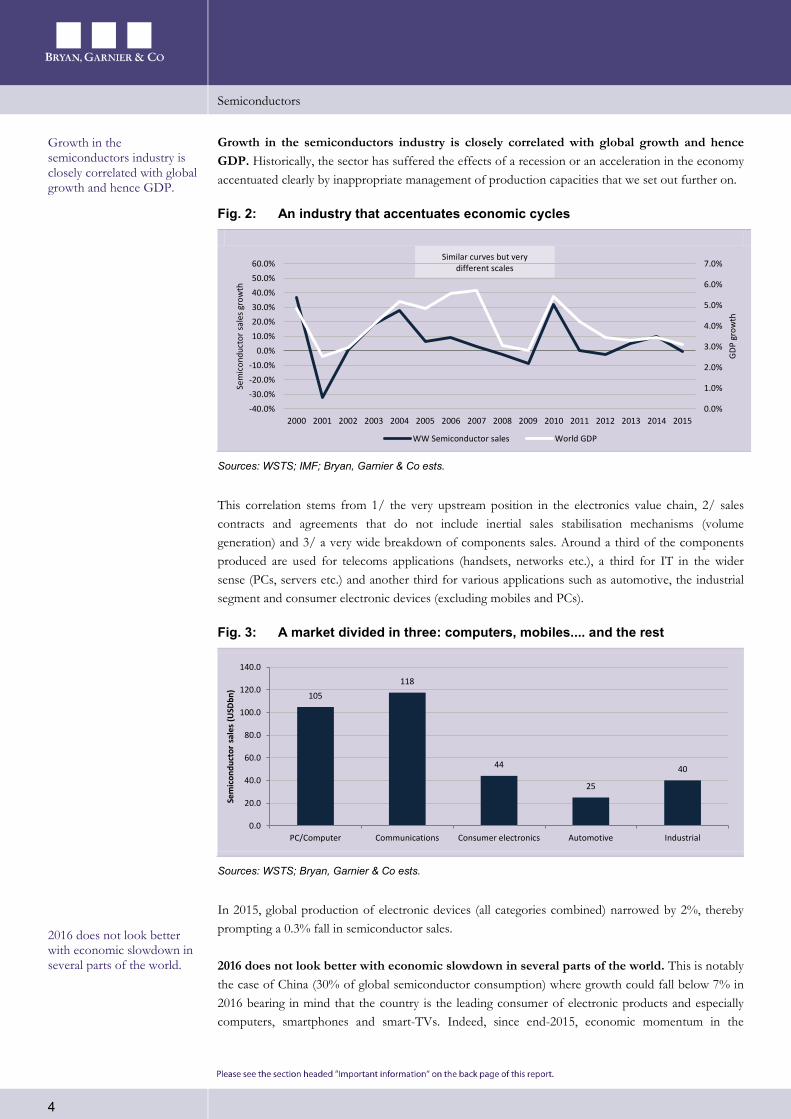
Growth in the semiconductors industry is closely correlated with global growth and hence GDP. Historically, the sector has suffered the effects of a recession or an acceleration in the economy accentuated clearly by inappropriate management of production capacities that we set out further on.
Fig. 2: An industry that accentuates economic cycles
Sources: WSTS; IMF; Bryan, Garnier & Co ests.
This correlation stems from 1/ the very upstream position in the electronics value chain, 2/ sales contracts and agreements that do not include inertial sales stabilisation mechanisms (volume generation) and 3/ a very wide breakdown of components sales. Around a third of the components produced are used for telecoms applications (handsets, networks etc.), a third for IT in the wider sense (PCs, servers etc.) and another third for various applications such as automotive, the industrial segment and consumer electronic devices (excluding mobiles and PCs).
Fig. 3: A market divided in three: computers, mobiles.... and the rest
Sources: WSTS; Bryan, Garnier & Co ests.
In 2015, global production of electronic devices (all categories combined) narrowed by 2%, thereby prompting a 0.3% fall in semiconductor sales.
2016 does not look better with economic slowdown in several parts of the world. This is notably the case of China (30% of global semiconductor consumption) where growth could fall below 7% in 2016 bearing in mind that the country is the leading consumer of electronic products and especially computers, smartphones and smart-TVs. Indeed, since end-2015, economic momentum in the
105
118
44
25
40
0.0
20.0
40.0
60.0
80.0
100.0
120.0
140.0
PC/Computer Communications Consumer electronics Automotive Industrial
Sem
icon
duct
or s
ales
(USD
bn)
Growth in the semiconductors industry is closely correlated with global growth and hence GDP.
2016 does not look better with economic slowdown in several parts of the world.
Similar curves but very different scales
0.0%
1.0%
2.0%
3.0%
4.0%
5.0%
6.0%
7.0%
-40.0%
-30.0%
-20.0%
-10.0%
0.0%
10.0%
20.0%
30.0%
40.0%
50.0%
60.0%
2000 2001 2002 2003 2004 2005 2006 2007 2008 2009 2010 2011 2012 2013 2014 2015
GD
P gr
owth
Sem
icon
duct
or s
ales
gro
wth
WW Semiconductor sales World GDP

Semiconductors
5
country has shown signs of stabilising, notably in view of the various stimulus measures put in place (including repeated interest rate cuts and the devaluation in the renminbi). However, while a hard landing looks increasingly less likely, comparison bases remain difficult for this economy.
In the US (20% of global components consumption), expectations are no more encouraging since certain indicators point to a forthcoming recession and especially a decline in average corporate profitability, a downturn in employment as well as an increase in defaults. Changes in GDP in the country confirm a gradual slowdown with Q4 2015 and Q1 2016 growth of 1.4% and 1.1% compared with 3.9% and 2.0% in Q2 and Q3 2015. US growth therefore remains especially penalised by a strong dollar, in particular in the manufacturing sector whereas consumer spending is generally the growth driver (consumption up 2.2% in Q4 2015 on a quarterly annualised basis vs. 3% in Q3 2015).
In all, for 2016, the IMF forecasts growth of 3.2% or global GDP of USD75.8tn vs. USD73.5tn in 2015. For the semiconductors industry, the bright side of this is that sluggishness has helped reduce volatility.
Fig. 4: Economic hazards are still the main volatility factors in the industry
Sources: WSTS; IMF; Bryan, Garnier & Co ests.
Unfortunately, this clearly comes to the detriment of momentum, since over the long term, current growth forecasts for the industry (if they prove correct) point to a significant slowdown. Again, three-year forecasts suggest average growth of just 0.6% whereas between 1986 and 2015, average growth exceeded 9%.
1.1.2. Increasingly strong correlation between global growth/industry growth
In historical terms, another reason for high volatility in the industry was the mismanagement of global production capacities. In periods of recovery, in order to seize the high growth opportunity, all players were quick to extend their production capacity. However, these concert investments rapidly transformed into surplus production on a global level, prompting pressure on prices and leading the industry into recession.
For the semiconductors industry, the bright side of this is that sluggishness has helped reduce volatility.
In historical terms, another reason for high volatility in the industry was the mismanagement of global production capacities.
-35%
-25%
-15%
-5%
5%
15%
25%
35%
45%
1987
1988
1989
1990
1991
1992
1993
1994
1995
1996
1997
1998
1999
2000
2001
2002
2003
2004
2005
2006
2007
2008
2009
2010
2011
2012
2013
2014
2015
2016
e
2017
e
2018
e
Sem
icon
duct
or s
ales
gro
wth
European sovereign debt crisis impact
Subprime mortgage crisis impact
Avg. historical growth of 9%
Dot-com bubble impact
Asian financial crisis impact
Mexican debt crisis impact
Japanese and U.S. loan crisis impact
Semiconductors
6
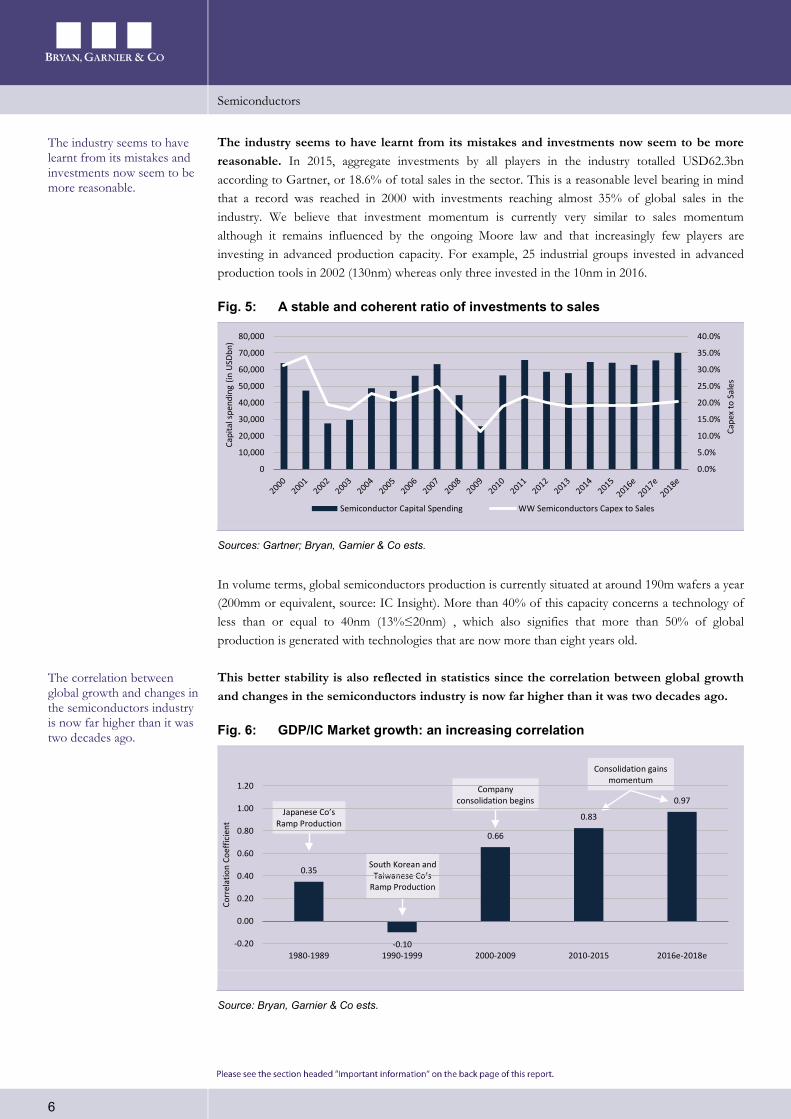
The industry seems to have learnt from its mistakes and investments now seem to be more reasonable. In 2015, aggregate investments by all players in the industry totalled USD62.3bn according to Gartner, or 18.6% of total sales in the sector. This is a reasonable level bearing in mind that a record was reached in 2000 with investments reaching almost 35% of global sales in the industry. We believe that investment momentum is currently very similar to sales momentum although it remains influenced by the ongoing Moore law and that increasingly few players are investing in advanced production capacity. For example, 25 industrial groups invested in advanced production tools in 2002 (130nm) whereas only three invested in the 10nm in 2016.
Fig. 5: A stable and coherent ratio of investments to sales
Sources: Gartner; Bryan, Garnier & Co ests.
In volume terms, global semiconductors production is currently situated at around 190m wafers a year (200mm or equivalent, source: IC Insight). More than 40% of this capacity concerns a technology of less than or equal to 40nm (13% ≤20nm) , which also signifies that more than 50% of global production is generated with technologies that are now more than eight years old.
This better stability is also reflected in statistics since the correlation between global growth and changes in the semiconductors industry is now far higher than it was two decades ago.
Fig. 6: GDP/IC Market growth: an increasing correlation
Source: Bryan, Garnier & Co ests.
0.0%
5.0%
10.0%
15.0%
20.0%
25.0%
30.0%
35.0%
40.0%
0
10,000
20,000
30,000
40,000
50,000
60,000
70,000
80,000
Cape
x to
Sal
es
Capi
tal s
pend
ing
(in U
SDbn
)
Semiconductor Capital Spending WW Semiconductors Capex to Sales
The industry seems to have learnt from its mistakes and investments now seem to be more reasonable.
The correlation between global growth and changes in the semiconductors industry is now far higher than it was two decades ago.
Japanese Co’s Ramp Production
South Korean and Taiwanese Co’s
Ramp Production
Company consolidation begins
Consolidation gains momentum
0.35
-0.10
0.66
0.83
0.97
-0.20
0.00
0.20
0.40
0.60
0.80
1.00
1.20
1980-1989 1990-1999 2000-2009 2010-2015 2016e-2018e
Corr
elat
ion
Coef
ficie
nt

Semiconductors
7
1.2. … leading to refocusing… Whereas the entire industry is only like to post modest growth in coming years, a number of sub-segments are set to perform better than others. These sectors are the same as in 2015, namely the automotive and industrial sectors (see Buying the European Powerhouses).
This does not mean that players active in other market segments will disappear, but we have noted that they are increasingly refocusing on their core businesses. This trend has affected all players, whether large or small and all market segments.
In the quest for efficiency and growth, groups are preferring to sell off sluggish and sometimes fairly unprofitable non-core businesses and are therefore creating an artificially attractive comparison basis (since companies always present figures in terms of same-structure growth). There have been numerous examples of this recently:
Maxim Integrated (US; c. USD10.6bn mkt cap.): In early 2015, Maxim Integrated decided to withdraw from MEMS and touch screen sensors for consumer devices (i.e. smartphones in this case) in order to focus on automotive sensors.
Texas Instruments (US.; c. USD62.6bn mkt cap.): TI also decided to slim down its teams (1,100 staff) in charge of developing mobile chips a few years earlier when the group decided to abandon the smartphone chips segment.
KLA-Tencor (US; c. USD11.6bn mkt cap.): Mid-2015, the US equipment manufacturer announced a realignment plan for its business and decided to cut headcount (around 10%). In fact, it halted investments in EUV.
Qualcomm (US; c. USD80.5bn mkt cap.): Also in mid-2015, the group (specialised in developing processors for smartphones) announced that it intended to reorganise its businesses into two main pillars, chip design and IP licences. After selling off its non-core activities, the group cut its headcount by 15%.
AMD (US; c. USD4.3bn mkt cap.): At the end of 2015, as the no. 2 player in computer processors was struggling in both processors and graphic cards, it decided to focus its efforts on activities considered key and outsource the rest. Around 5% of its employees were made redundant.
NXP Semiconductors (NL; c. USD30.0bn mkt cap.): In May 2015, NXP announced the sale of the RF Power division (which became Ampleon) to Chinese investor Jianguang AM, with its 1,250 employees. A year later in June 2016, NXP announced it was selling off its Discrete Power division (to become Nexperia) to the same Chinese investors explaining that the group preferred to focus its efforts on a lower number of verticals. This refocusing was due to the group's rapid growth following the acquisition of Freescale in 2015.
As a result, all these groups will now be able to report favourable adjusted sales growth figures.
We have noted that they are increasingly refocusing on their core businesses and groups are preferring to sell off sluggish and sometimes fairly unprofitable non-core businesses.
As a result, all these groups will now be able to report favourable adjusted sales growth figures.
Semiconductors
8
In addition to the above examples, we would underscore two others: Intel and STMicroelectronics.
“Intel Corporation […] announced a restructuring initiative to accelerate its evolution from a PC company to one that powers the cloud and billions of smart, connected computing devices.” – Intel Corp., April 19, 2016
Intel's decision to refocus its efforts on a small number of growth segments is symptomatic of the current state of the industry. The group's attempt to focus on the internet of things (IoT) has actually involved abandoning all initiatives in the smartphone chips segments. Historically, semi-conductor players have been used to relying on a strong vertical to finance investments in other high-potential market segments. Most often, this involved hesitant diversifications capitalising on the internal expertise already in place. However, this strategy does not seem to have worked over the past 10 years and it now looks difficult to enter a market segment which already has an ecosystem and well-established players. The group's failure in the smartphones market shows how a player like Intel, which clearly boasts the greatest know-how in terms of design and manufacture of digital chips, has no preferential treatment or legitimacy in another market segment (however similar).
"ST to discontinue the development of new platforms and standard products for set-top-boxes and home gateways" – STMicroelectronics, 27th January 2016
This is another interesting sample since it shows that a technological lead does not necessarily ensure success, that market share losses can be very fast and fatal and that diversification is not always a source of stability or growth. In our view, STMicroelectronics has the largest product portfolio in the industry. However, this does not ensure it the top place in the sector (ST is struggling to maintain its position in Top 10 ranking) and has in contrast, forced it to invest more than its peers in R&D, taking an automatic toll on its margins. Over the last few years, the group focused on a breakthrough technology, FD-SOI, to offer set-top box manufacturers high-quality chips when maintaining an attractive price range. Unfortunately, Broadcom, its main rival in this segment, made the most of the development time for this new platform to gain a higher market share and impose itself as the clear leader. After several quarters of development, the new STMicroelectronics platform for set-top boxes (STB) arrived too late, the division had no hope left and management announced in January 2016 that it would undertake a reorganisation implying the withdrawal from the STB business and the departure of 1,400 staff. This example is a good illustration of the importance of control in a market segment. Although STMicroelectronics ended up offering a high-quality platform, the group did not manage to win sufficient market share to justify further investments in the set-top box chip segment. In addition, although STMicroelectronics is very diversified, it has never benefited from a better stability or far higher growth than its peers.
In a context of rapid market change, it therefore seems important to favour 1/ players with a dominant position in one vertical and/or specific expertise (vs. outsiders), and 2/ players whose expertise is focused in a small number of market segments.
The failure of Intel in smartphones is a proof that legitimacy is not given for free in new segment.
STMicroelectronics never benefited from its large product portfolio.
Semiconductors
9
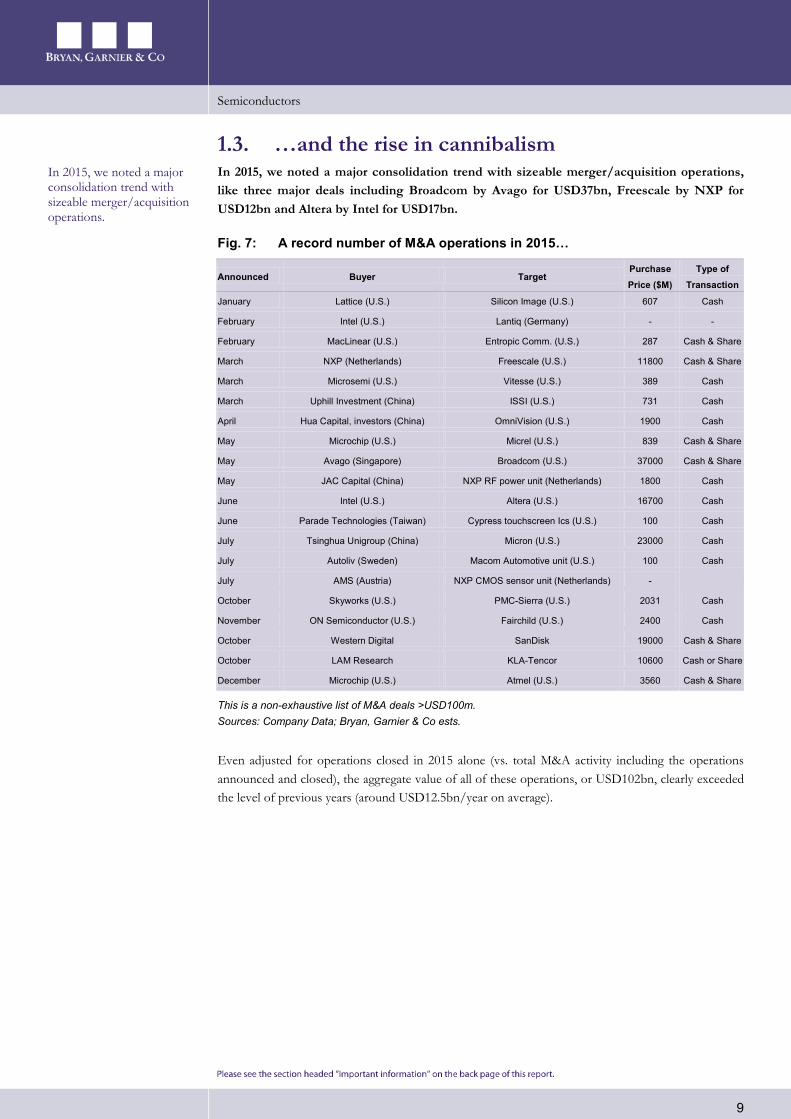
1.3. …and the rise in cannibalism In 2015, we noted a major consolidation trend with sizeable merger/acquisition operations, like three major deals including Broadcom by Avago for USD37bn, Freescale by NXP for USD12bn and Altera by Intel for USD17bn.
Fig. 7: A record number of M&A operations in 2015…
Announced Buyer Target Purchase Price ($M)
Type of Transaction
January Lattice (U.S.) Silicon Image (U.S.) 607 Cash
February Intel (U.S.) Lantiq (Germany) - -
February MacLinear (U.S.) Entropic Comm. (U.S.) 287 Cash & Share
March NXP (Netherlands) Freescale (U.S.) 11800 Cash & Share
March Microsemi (U.S.) Vitesse (U.S.) 389 Cash
March Uphill Investment (China) ISSI (U.S.) 731 Cash
April Hua Capital, investors (China) OmniVision (U.S.) 1900 Cash
May Microchip (U.S.) Micrel (U.S.) 839 Cash & Share
May Avago (Singapore) Broadcom (U.S.) 37000 Cash & Share
May JAC Capital (China) NXP RF power unit (Netherlands) 1800 Cash
June Intel (U.S.) Altera (U.S.) 16700 Cash
June Parade Technologies (Taiwan) Cypress touchscreen Ics (U.S.) 100 Cash
July Tsinghua Unigroup (China) Micron (U.S.) 23000 Cash
July Autoliv (Sweden) Macom Automotive unit (U.S.) 100 Cash
July AMS (Austria) NXP CMOS sensor unit (Netherlands) -
October Skyworks (U.S.) PMC-Sierra (U.S.) 2031 Cash
November ON Semiconductor (U.S.) Fairchild (U.S.) 2400 Cash
October Western Digital SanDisk 19000 Cash & Share
October LAM Research KLA-Tencor 10600 Cash or Share
December Microchip (U.S.) Atmel (U.S.) 3560 Cash & Share
This is a non-exhaustive list of M&A deals >USD100m. Sources: Company Data; Bryan, Garnier & Co ests.
Even adjusted for operations closed in 2015 alone (vs. total M&A activity including the operations announced and closed), the aggregate value of all of these operations, or USD102bn, clearly exceeded the level of previous years (around USD12.5bn/year on average).
In 2015, we noted a major consolidation trend with sizeable merger/acquisition operations.

Semiconductors
10
Fig. 8: …actually masking a growth problem
Source: Company Data; Bryan, Garnier & Co ests.
This has been driven by a particularly beneficial environment for M&A activity with low interest rates and undemanding valuations. However, we believe that the trend is above all a clear reflection of the aim to find the means to boost growth (short-term growth) and acquire and control new key technologies in order to face competition (long-term growth).
This trend has also been confirmed in surveys carried out with leading sector managers. In their view, these numerous operations have been driven by rising R&D costs (cited by 45% of those questioned), extensions in the technological portfolio (41% of answers) and a deterioration in prices forcing companies to find acquisitions opportunities (for 40% of those questions) or to reduce competition by buying out rivals.
As such, the time when several dozen rivals were present in the same market (memory, microchips etc.) has past and it is natural to see a consolidation in a same market segment since differentiation (and hence the reason to exist) is increasingly difficult to maintain on several segments.
7.717.0
9.5 11.516.9
102.4
0
20
40
60
80
100
120
2010 2011 2012 2013 2014 2015
Agg
rega
te v
alue
of M
&A
op.
(in
USD
bn)
We believe that the trend is above all a clear reflection of the aim to find the means to boost growth

Semiconductors
11
As a consequence of the numerous M&A operations in 2015, the Top 10 players achieved an aggregated market share of almost 60%, the highest level so far.
Fig. 9: A concentration trend reflected in market shares
Sources: Gartner/Dataquest; IC Insights; Mentor Graphics; Bryan, Garnier & Co ests.
As a consequence of the numerous M&A operations in 2015, the Top 10 players achieved an aggregated market share of almost 60%, the highest level so far.
The combined market share of the Top 10 companies is 2.5% higher than prior high (1984)
Semiconductors
12
2. Stock-picking more than necessary 2.1. The biggest are not necessarily the strongest When commenting on the semiconductors industry, many observers are persuaded that size is now the main success factor – and by success we understand profitable growth. In our view, recent changes in the industry undermine this preconceived idea and the reasons for success look quite different now.
2.1.1. The size of a player does not guarantee its success For some people, the search for critical mass explains the strong wave of M&A activity seen in 2015. Indeed, the driving force behind consolidation is generally the synergies unlocked by economies of scale and higher volumes. As in many sectors, these economies of scale are also relevant in the semiconductors industry but in a slightly more specific way. Indeed, an integrated manufacturer (IDM) such as Intel or Infineon should be able to make the most of the beneficial effects, but the technologies acquired need to be sufficiently close to the buyer's core business. However, IDMs represent an increasingly low share of the semiconductors industry.
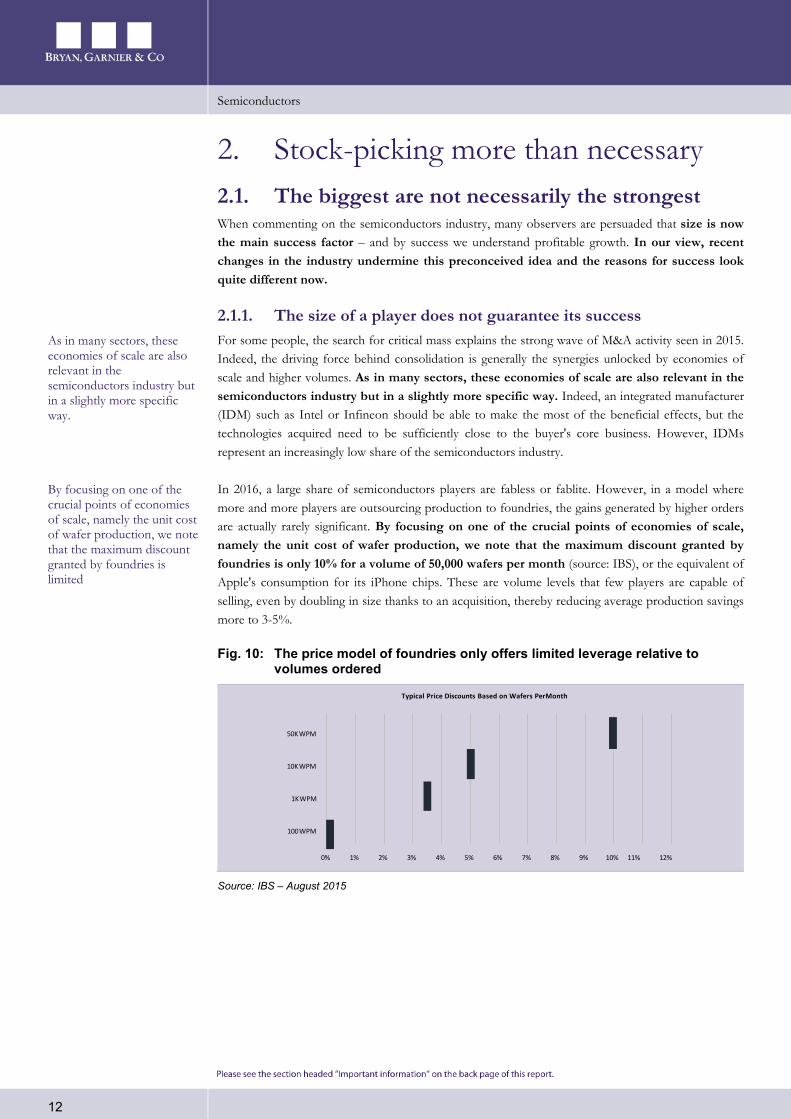
In 2016, a large share of semiconductors players are fabless or fablite. However, in a model where more and more players are outsourcing production to foundries, the gains generated by higher orders are actually rarely significant. By focusing on one of the crucial points of economies of scale, namely the unit cost of wafer production, we note that the maximum discount granted by foundries is only 10% for a volume of 50,000 wafers per month (source: IBS), or the equivalent of Apple's consumption for its iPhone chips. These are volume levels that few players are capable of selling, even by doubling in size thanks to an acquisition, thereby reducing average production savings more to 3-5%.
Fig. 10: The price model of foundries only offers limited leverage relative to volumes ordered
Source: IBS – August 2015
0% 1% 2% 3% 4% 5% 6% 7% 8% 9% 10% 11% 12%
100WPM
1KWPM
10KWPM
50KWPM
Typical Price Discounts Based on Wafers PerMonth
As in many sectors, these economies of scale are also relevant in the semiconductors industry but in a slightly more specific way.
By focusing on one of the crucial points of economies of scale, namely the unit cost of wafer production, we note that the maximum discount granted by foundries is limited

Semiconductors
13
Other synergy sources, namely R&D and marketing do not materialise systematically either as it seems that there is no correlation between revenue, growth, profitability and improvement of margins. First, the relationship between sales generated and growth in a sample of 54 stocks1 in the sector that we monitor actively, is actually insignificant with a low linear regression coefficient (R² = 0.0017).
Fig. 11: No correlation between size and growth
Sources: Thomson Reuters I.B.E.S.; Bryan, Garnier & Co ests.
This chart also highlights the fact that whatever the business model (IDM, fabless, foundry) or the business speciality (components or equipment manufacturing or design), size is not a growth factor.
More interestingly, a similar exercise in profitability also highlights the lack of correlation between the size of groups and their margin levels.
1 Analog Devices, Applied Mats., ARM Holdings, ASM International, ASM Pacific, ASML, Atmel, ams, Broadcom, Cadence Design, CEVA,
Cirrus Logic, Cypress, Dialog, Dolby Laboratories, Elmos, Fairchild, Imagination Technologies, Infineon, Intel, Interdigital, Intersil, Invensense,
KLA Tencor, Kulicke & Soffa, Lam Research, Lattice Semiconductor, Linear Technology, Marvell, Maxim Integrated, MediaTek, Melexis,
Mentor Graphics, Microchip Tech., Micron Technology, Micronas Semicon., Nvidia, NXP Semiconductors, ON Semiconductor, Qualcomm,
Sandisk, Semtech, Skyworks Solutions, SMIC, Soitec, STMicroelectronics Synopsys, Teradyne, Tessera, Texas Instruments, TSMC, u-blox
Holding, UMC, Xilinx
R² = 0.0016
-30%
-20%
-10%
0%
10%
20%
30%
40%
100 1000 10000 100000
5y A
vera
ge s
ales
gro
wth
(CA
GR
11-1
5)
FY15 Sales (in USDm)
IDM Fabless Equipmt Manufacturer Foundry IP & EDA vendor
Other synergy sources, namely R&D and marketing do not materialise systematically either as it seems that there is no correlation between revenue, growth, profitability and improvement of margins.
Semiconductors
14
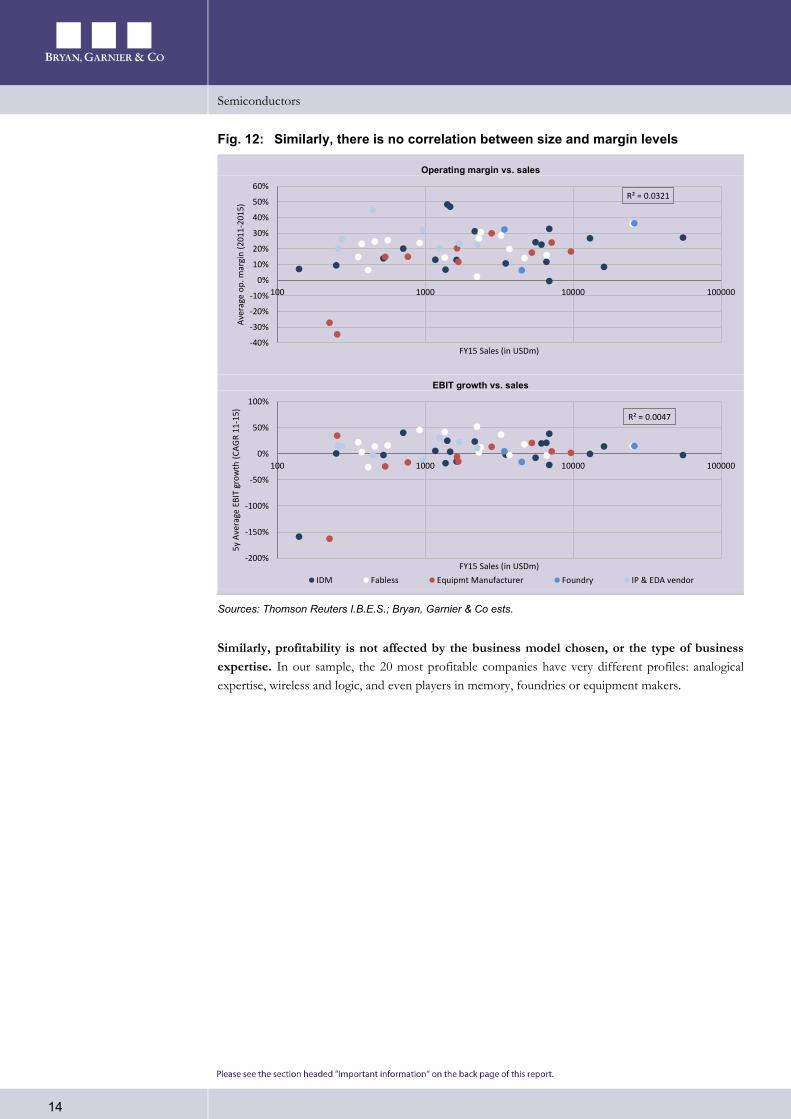
Fig. 12: Similarly, there is no correlation between size and margin levels
Operating margin vs. sales
EBIT growth vs. sales
Sources: Thomson Reuters I.B.E.S.; Bryan, Garnier & Co ests.
Similarly, profitability is not affected by the business model chosen, or the type of business expertise. In our sample, the 20 most profitable companies have very different profiles: analogical expertise, wireless and logic, and even players in memory, foundries or equipment makers.
R² = 0.0321
-40%
-30%
-20%
-10%
0%
10%
20%
30%
40%
50%
60%
100 1000 10000 100000
Ave
rage
op.
mar
gin
(201
1-20
15)
FY15 Sales (in USDm)
R² = 0.0047
-200%
-150%
-100%
-50%
0%
50%
100%
100 1000 10000 100000
5y A
vera
ge E
BIT
grow
th (
CAG
R 11
-15)
FY15 Sales (in USDm)
IDM Fabless Equipmt Manufacturer Foundry IP & EDA vendor

Semiconductors
15
Fig. 13: No differentiation by expertise or business model either
Company 5y avg. EBIT margin Business model - Expertise
Arm Holdings 48% IP Vendor - Logic
Linear Technology 47% IDM - Analog/mixed-signal
Interdigital 45% IP Vendor - Wireless/RF
TSMC 36% Foundry - All
Qualcomm 36% Fabless - Wireless/RF
Broadcom 33% IDM - Analog/mixed-signal
Analog Devices 32% IDM - Analog/mixed-signal
Dolby Laboratories 32% IP Vendor - Mixed-signal
Microchip Tech. 31% IDM - Logic
Xilinx 31% Fabless - Logic
KLA Tencor 30% Equipment Manufacturer
Ceva 27% IP Vendor - Mixed-signal
Skyworks Solutions 29% Fabless - Wireless/RF
Intel 27% IDM - Logic
Texas Instruments 27% IDM - Analog/mixed-signal
Maxim Integrated 27% Fabless - Analog/mixed-signal
Tessera Techs. 26% IP Vendor - Backend
Semtech 25% Fabless - Analog/mixed-signal
Melexis 25% Fabless - Analog/mixed-signal
Sandisk 24% IDM - Memory
Sources: Thomson Reuters I.B.E.S.; Bryan, Garnier & Co ests.
In our view, this provides additional proof that the wave of mergers and acquisitions noted in 2015 was above all driven by the aim for certain players to acquire growth and/or weaken the competition and thereby satisfy demanding expectations from investors who are used to strong growth.
Fig. 14: A similar conclusion: the M&A wave has been due to a lack of growth
Sources: WSTS; Bryan, Garnier & Co ests.
In addition, although we are not questioning these M&A strategies, we have noted that certain groups have seen their product portfolios expand massively via these operations. However, the increase in product and customer portfolios is likely to result in further pressure on the performances of sales teams and distribution networks.
0
50000000
100000000
150000000
200000000
250000000
300000000
350000000
Sem
icon
duct
or s
ales
(in
USD
k)
Asia Pacific Japan Europe Americas
CAGR 2010-2015: 2.8%
CAGR 1986-2010: 10.2%

Semiconductors
16
2.1.2. Positioning is a more certain characteristic Today, we believe that the main factor for success lies more in a group's expertise and leading position in a defined market segment rather than a being among Top 10 worldwide players. This was also noted over 2010-2015 when the market only grew by 2.8% on average whereas companies exposed to the smartphone segment enjoyed robust momentum. Among the best performers (growth in sales between 2010 and 2015), only Lam Research and u-blox do not generate the majority of their sales in the mobile segment.
Fig. 15: Over the past five years, the best growth rates were noted in the mobile/smartphone segment
Rank Company 5y average sales growth Market segment (comment)
1 Dialog Semicon. 36% PMICs for Smartphones
2 Invensense 34% Sensors for Smartphones
3 Cirrus Logic 33% Audio ICs for Smartphones
4 Broadcom 27% Logic ICs for Smartphones & Industry (M&A Avago/Broadcom)
5 Skyworks Solutions 25% Wireless ICs for Smartphones
6 u-blox Holding 25% Positioning/Wireless for Automobile & Industry
7 austriamicrosystems 24% Sensors for Smartphones
8 Lam Research 20% Equipment manufacturer
9 ARM Holdings 19% IP blocks for Application processors
10 Qualcomm 18% Wireless ICs for Smartphones
Sources: Thomson Reuters I.B.E.S.; Bryan, Garnier & Co ests.
As such, with the slowdown in the smartphone market, we expect a change in this ranking over coming years.
2.1.3. The auto and industrial robotisation sectors are strong catalysts Our conviction is that the industrial sector, especially via plant robotisation, and the automotive sector, are the sectors that offer an opportunity to exceed market growth.
On an average three-year growth basis, these segments should post outperformances of between six and seven percentage points relative to the semiconductors market.
Fig. 16: Automotive and industry sectors offer the best opportunities
Sources: WSTS; IHS; Bryan, Garnier & Co ests.
-4.0% -2.0% 0.0% 2.0% 4.0% 6.0% 8.0%
Industrial
Automotive
Total Semiconductor market
Communications
Data processing
Consumer
CAGR 2015-2018e
Today, we believe that the main factor for success lies more in a group's expertise and leading position in a defined market segment rather than a being among Top 10 worldwide players.
Our conviction is that the industrial sector, especially via plant robotisation, and the automotive sector, are the sectors that offer an opportunity to exceed market growth.

Semiconductors
17
This is a point that we already highlighted in our sector note of June 2015 (Buying the European Powerhouses) and still holds today. However, the valuations of a number of sector players still do not reflect these opportunities.
Fig. 17: Overall, automotive/industry players are not overvalued
Auto/Industry players (14) Mkt Cap (EURm) Perf YTD P/E EV/EBIT EV/EBITDA EV/Sales
CY16 CY17 CY16 CY17 CY16 CY17 CY16 CY17
Analog Devices 16,823 9.2% 21.8x 18.9x 15.1x 13.0x 13.0x 11.3x 4.8x 4.4x
Lattice Semiconductor 57,662 11.8% 14.7x 12.4x 15.3x 11.6x 12.6x 9.9x 5.9x 4.7x
Elmos 210 -32.5% 14.4x 11.5x 8.4x 6.4x 3.6x 3.1x 0.8x 0.7x
Infineon 15,754 2.6% 19.1x 16.8x 15.4x 13.1x 8.4x 7.6x 2.2x 2.0x
Linear Technology 10,499 14.4% 24.0x 22.3x 15.7x 14.5x 14.5x 13.1x 7.0x 6.4x
Maxim Integrated Prds. 9,763 0.3% 23.3x 19.2x 16.7x 13.7x 12.0x 11.0x 4.4x 4.2x
Melexis 2,464 16.8% 25.0x 22.7x 19.1x 17.2x 15.6x 14.1x 4.9x 4.5x
NXP Semiconductors 25,622 -3.0% 14.2x 10.9x 13.7x 10.2x 10.0x 7.8x 3.6x 3.0x
ON Semiconductor 3,567 -3.0% 11.3x 9.1x 10.8x 8.5x 6.6x 5.8x 1.3x 1.2x
Renesas 8,706 -9.9% 24.9x 15.0x 7.1x 6.5x 8.5x 5.7x 1.7x 1.2x
STMicroelectronics 5,058 -10.5% 29.8x 15.5x 22.6x 11.0x 5.0x 4.4x 0.7x 0.7x
Texas Instruments 59,225 18.9% 22.0x 20.1x 14.2x 13.1x 11.8x 11.0x 4.9x 4.6x
u-blox 1,434 7.7% 33.7x 27.9x 21.8x 17.9x 14.5x 11.9x 3.2x 2.7x
Xilinx 11,037 3.0% 23.4x 22.4x 15.3x 15.7x 13.9x 14.5x 4.6x 4.6x
Auto/Industry players (14) average 13,921 3% 22.8x 18.4x 17.1x 12.9x 11.0x 9.7x 3.5x 3.2x
All segment IDM/Fabless players (31) average 17,322 5% 20.6x 18.3x 14.8x 11.5x 10.3x 8.7x 2.9x 2.6x
Sources: Thomson Reuters I.B.E.S. as of 19/07/2016; Bryan, Garnier & Co ests.
We have retained two factors from this data:
Groups specialised in chip manufacturing for the automotive and industrial sectors are not better valued than the rest of the industry. Average 2016e EV/EBITDAs of specialists work out to 11.0x close to the industry average 2016e EV/EBITDA of 10.3x (we use EV/EBITDA ratio as the sample is composed of Fabless and IDMs).
Despite a more buoyant environment, the stockmarket performance of these specialists since the beginning of the year has also been very close to the sector performance. The 14 specialised groups only had a performance of 3%, just slightly below the 5% gain made by our sample including 31 IDMs and fabless players.
2.1.4. Focus on foundries, observation towers in industry We consider momentum for foundries particularly interesting to observe since these players are at the heart of the value chain, with exposure to the various market and/or technology sub-segments, and therefore have transversal visibility on the industry's health.
In 2015, the general sluggishness in the industry also upset the usually robust pace of growth of these players (+5pp on average relative to the industry). In 2016, 16/14nm production lines should run at maximum but the focus is now on the roll-out of 10nm production. Note here that investments in 10nm production are currently being stepped up. At GlobalFoundries, Vice-President David Jensen expects a slightly stronger year in 2016 compared with 2015, especially thanks to the constant increase in value in smartphones and new applications in the automotive sector and the internet of things, prompting Mr Jensen to forecast growth of 5-7% for all foundries. This figure is in
Groups specialised in chip manufacturing for the automotive and industrial sectors are not better valued than the rest of the industry.
In 2015, the general sluggishness in the industry also upset the usually robust pace of growth of foundries.

Semiconductors
18
line with the historical outperformance of outsourcers of around 5% as we mentioned previously and growth expected for the industry as a whole (around 0%).
Also, note that foundries are also the main groups that invest in new production technologies (advanced nodes). We estimate that combined investments by these players exceed two-thirds of the annual investments made in advanced nodes. On this point, we expect modest growth in investments that are set to be directed towards 1/ expanding in 28nm production capacities, 2/ additional 16/14nm capacity for larger players (primarily TSMC, Samsung and GlobalFoundries) and 3/ the roll-out of a 10nm production line since Q2 2016. This forecast has been confirmed in messages from the directors of LAM Research, KLA-Tencor, Applied Materials, and ASML, namely the main components makers in the industry.
We would add three things to these observations for 2016. Firstly, the transition to 16/14nm at TSMC, Samsung and GlobalFoundries was not simple and yields have remained low so far. However, in 2016, these yields should pick up considerably in our view, thereby clearly increasing production capacity for these nodes. This could prompt TSMC, Samsung and GlobalFoundries to be more aggressive commercially although TMSC and Samsung both agree in saying that despite increased competition and the arrival of the 10nm, 14/16nm production should be maintained over the long term. This is good news for components markets since it indicates that the tools currently used for this production and which correspond to leading-edge components makers are unlikely to be transferred to 10nm production. Indeed, a number of equipment makers offer the possibility of improving the tools owned by semiconductors manufacturers which may provide a competitive edge, but could also damage sales of future generations of tools.
Secondly, the share of production between 40nm and 20nm remains very high, and we estimate it at around 30% of global production, virtually all of which in 28nm bulk. This production currently carries lower margins than advanced production (≤20nm) for foundries but it should last since it still offers a particularly attractive price/performance ratio for semiconductors manufacturers. In this environment, we have noted that new entrants are positioning themselves, as is the case of SMIC and UMC. We expect this to add further pressure to the foundries already established in this production.
Finally, we have also noted that demand remains high for 200mm production (vs. 300mm for production of digital components) due to radio components in smartphones and IoT, as well as power management chips and components for the automotive sector. For this reason, we consider that the backdrop is currently more beneficial for speciality foundries such as Towerjazz, Magnachip and X-Fab.

Semiconductors
19
2.2. Opportunities in the universe we cover After initiating coverage of Melexis and u-blox, our universe now includes 8 European companies. These groups have very different profiles since they include both IDMs (Infineon and STMicroelectronics), Fabless (Dialog, Melexis et u-blox), IP block seller (ARM Holdings), equipment manufacturer (ASML) and semiconductor materials manufacturer (Soitec). The smallest group is Soitec with a stockmarket capitalisation of close to EUR300m and the largest is ASML with a capitalisation of about EUR40bn.
Fig. 18: BG Semiconductor universe BG Coverage (8) Business model Mkt Cap ARM Holdings IP vendor 23,573 GBPm ASML Equipment manufacturer 40,300 EURm Dialog Semiconductor Fabless 2,246 EURm Infineon IDM 15,754 EURm Melexis Fabless 2,464 EURm Soitec Material 455 EURm STMicroelectronics IDM 5,058 EURm u-blox Fabless 1,555 CHFm
Sources: Thomson Reuters I.B.E.S. as of 19/07/2016; Bryan, Garnier & Co ests.
While the sector shows low average growth for coming years, it still offers robust growth opportunities for well-positioned players. As such, the semiconductors industry still offers growth opportunity for some players and in this respect not taking an interest in the groups' growth profiles and only focusing on the usual valuation multiples such as EV/Sales, EV/EBITDA, EV/EBIT and P/E could prove mistaken. As such, we believe it is interesting to take into account an additional dimension when valuing the shares, namely growth.
Virtually all of the industry players have a positive net cash position, such that using P/E multiples is coherent in our view as long since the impact of financial expenses on net profit is mostly marginal. Nevertheless, it requires to take into account the differences of business model among industry players (IDMs, fabless, IP vendors, equipment manufacturers…) when using EV/EBIT and P/E ratios. Indeed, since fabless groups have no plant, they do not depreciate equipment like IDMs, thereby distorting all comparisons based on EV/EBIT and P/E. As a result, we would underscore the importance of differentiating players by group depending on the business model operated.
On a comparable business model basis, use of PEG therefore remains interesting as it also allows to take into account the growth profile of industry players.
After initiating coverage of Melexis and u-blox, our universe now includes 8 European companies with different profiles.

Semiconductors
20
Fig. 19: PEG ratio's by player category
Fabless
IDM
Equipment manufacturers
EDA and IP Vendors
Sources: Thomson Reuters I.B.E.S. as of 19/07/2016; Bryan, Garnier & Co ests.
Cirrus LogicDialogInvensense
Marvell
MediaTek
Melexis
Nvidia
QorvoQualcomm
Semtech
Skyworks
u-blox
Xilinx
0.0x
10.0x
20.0x
30.0x
40.0x
50.0x
60.0x
-30.0% -25.0% -20.0% -15.0% -10.0% -5.0% 0.0% 5.0% 10.0% 15.0% 20.0% 25.0%
2016
e P/
E ra
tio
3y fwd avg. EPS growth
ams
Analog Devices
BroadcomElmos
Infineon
Intel
Intersil
Linear Tech. Maxim Int.
MicrochipNXPON Semi.
Renesas
STMicroelectronics
Texas Instruments
0.0x
5.0x
10.0x
15.0x
20.0x
25.0x
30.0x
35.0x
-5.0% 0.0% 5.0% 10.0% 15.0% 20.0% 25.0% 30.0% 35.0% 40.0% 45.0%
2016
e P/
E ra
tio
3y fwd avg. EPS growth
ASML
Applied MaterialsKLA-Tencor
Lam ReserachTeradyne
Tokyo Electron
Nikon
ASM International ASM Pacific Tech.
0.0x
5.0x
10.0x
15.0x
20.0x
25.0x
30.0x
35.0x
0.0% 5.0% 10.0% 15.0% 20.0% 25.0%
2016
e P/
E ra
tio
3y fwd avg. EPS growth
ARM Holdings
Imagination Tech.
PDF SolutionsDolby Laboratories
Cadence Design
Mentor Graphics Synopsys
0.0x
10.0x
20.0x
30.0x
40.0x
50.0x
0.0% 2.0% 4.0% 6.0% 8.0% 10.0% 12.0% 14.0% 16.0% 18.0%
2016
e P/
E ra
tio
3y fwd avg. EPS growth
Semiconductors
21
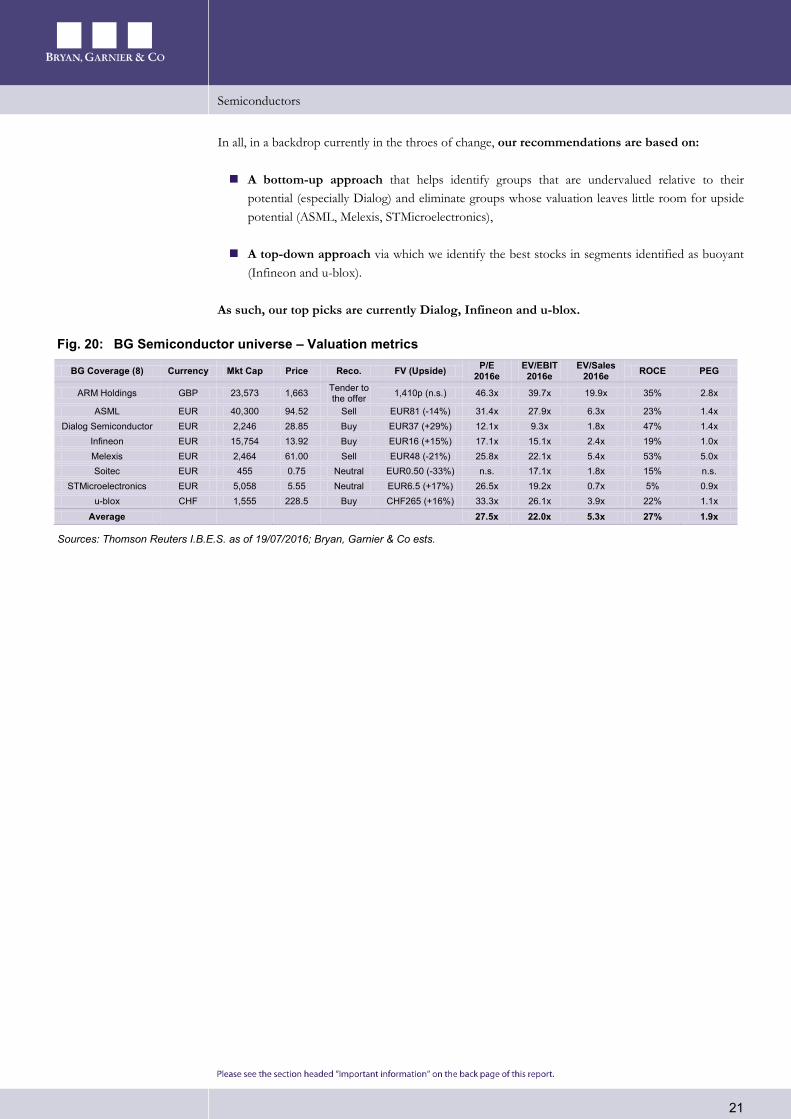
In all, in a backdrop currently in the throes of change, our recommendations are based on:
A bottom-up approach that helps identify groups that are undervalued relative to their potential (especially Dialog) and eliminate groups whose valuation leaves little room for upside potential (ASML, Melexis, STMicroelectronics),
A top-down approach via which we identify the best stocks in segments identified as buoyant (Infineon and u-blox).
As such, our top picks are currently Dialog, Infineon and u-blox.
Fig. 20: BG Semiconductor universe – Valuation metrics
BG Coverage (8) Currency Mkt Cap Price Reco. FV (Upside) P/E 2016e
EV/EBIT 2016e
EV/Sales 2016e ROCE PEG
ARM Holdings GBP 23,573 1,663 Tender to the offer 1,410p (n.s.) 46.3x 39.7x 19.9x 35% 2.8x
ASML EUR 40,300 94.52 Sell EUR81 (-14%) 31.4x 27.9x 6.3x 23% 1.4x Dialog Semiconductor EUR 2,246 28.85 Buy EUR37 (+29%) 12.1x 9.3x 1.8x 47% 1.4x
Infineon EUR 15,754 13.92 Buy EUR16 (+15%) 17.1x 15.1x 2.4x 19% 1.0x Melexis EUR 2,464 61.00 Sell EUR48 (-21%) 25.8x 22.1x 5.4x 53% 5.0x Soitec EUR 455 0.75 Neutral EUR0.50 (-33%) n.s. 17.1x 1.8x 15% n.s.
STMicroelectronics EUR 5,058 5.55 Neutral EUR6.5 (+17%) 26.5x 19.2x 0.7x 5% 0.9x u-blox CHF 1,555 228.5 Buy CHF265 (+16%) 33.3x 26.1x 3.9x 22% 1.1x
Average 27.5x 22.0x 5.3x 27% 1.9x
Sources: Thomson Reuters I.B.E.S. as of 19/07/2016; Bryan, Garnier & Co ests.

Semiconductors
22
Page left blank intentionally

r r
INDEPENDENT RESEARCH UPDATE ARM Holdings 21st July 2016 SoftBank leverages Brexit to acquire ARM
TMT Fair Value 1410p vs. 1340p (price 1,663p) Tender to the offer
Bloomberg ARM.LN Reuters ARM.L 12-month High / Low (p) 1,675 / 848.5 Market capitalisation (GBPm) 23,404 Enterprise Value (BG estimates GBPm) 22,420 Avg. 6m daily volume ('000 shares) 4,680 Free Float 79.4% 3y EPS CAGR 17.9% Gearing (12/15) -36% Dividend yield (12/16e) 0.68%
On 18th June, SoftBank launched the acquisition of ARM for 1,700p per share, valuing ARM at GBP24.3bn. The Japanese group has made the most of a valuation made more affordable by the plunge in the GBP against the JPY, but has above all taken an attractive opportunity to capture profitable growth with 1/ momentum in the internet of things (IoT) and 2/ the rising momentum of ARM architecture in servers and infrastructure. In all, SoftBank is a serious buyer that has the means to pay for ARM in cash while offering historical shareholders a juicy premium (+43%). It has a good track-record in acquisitions and should maintain the group's current profile. We have updated our model, especially for forex, and consequently increased our FV from 1,340p to 1,410p.
SoftBank has invested in capturing the opportunity provided by the Internet of Things. During H1 2016, ARM's share price performance was hampered by the slowdown in the smartphones market. However, ARM still boasts numerous assets and especially 1/moves upscale in processors (32 bits vs. 64 bits), 2/ the multiplication in cores, and 3/ the adoption of ARM's Mali graphics technology, enabling it to increase smartphone revenues (>50% of royalties) by more than 9% a year on average between 2015 and 2018e. In addition to this comes the fresh source of growth harboured in IoT, network equipment and servers. IoT remains a difficult catalyst to materialise but its positive impact was clearly visible in the past two publications and the same is true for network equipment with constant market share gains. Finally, momentum in servers is constantly improving with a stronger ecosystem especially since the arrival of Qualcomm in the list of partners.
In all, SoftBank seems to have the perfect profile as a buyer. In terms of ARM's historical investors, the offer harbours attractive upside (+43% vs. the pre-announcement price) and is paid in cash. Concerning ARM, SoftBank has already stated it would change nothing to the current way of operating. The chip designer is to remain an independent unit with its head offices still in Cambridge and the same management team. SoftBank also stated that it would do everything to provide ARM the means to ramp-up, particularly in human resources with an additional budget to step up the recruitment of engineers.
YE December 12/15 12/16e 12/17e 12/18e Revenue (GBPm) 968.30 1,179 1,385 1,541 EBITA GBPm) 499.8 590.9 717.3 810.6 Op.Margin (%) 51.6 50.1 51.8 52.6 Diluted EPS (p) 30.20 35.94 43.94 49.54 EV/Sales 23.50x 19.02x 15.89x 13.96x EV/EBITDA 42.0x 34.7x 28.2x 24.4x EV/EBITA 45.5x 37.9x 30.7x 26.5x P/E 55.1x 46.3x 37.9x 33.6x ROCE 34.9 40.8 49.6 55.7
806.0
856.0
906.0
956.0
1006.0
1056.0
1106.0
1156.0
1206.0
1256.0
09/01/15 09/04/15 09/07/15 09/10/15 09/01/16 09/04/16 09/07/16
ARM HOLDINGS SXX EUROPE 600
Analyst: Sector Analyst Team: Dorian Terral Richard-Maxime Beaudoux 33(0) 1.56.68.75.92 Thomas Coudry [email protected] Gregory Ramirez

ARM Holdings
24
Simplified Profit & Loss Account (GBPm) 31/12/13 31/12/14 31/12/15 31/12/16e 31/12/17e 31/12/18e Revenues 715 795 968 1,179 1,385 1,541 Change (%) 23.9% 11.3% 21.8% 21.7% 17.5% 11.3% Adjusted EBITDA 445 437 542 646 782 882 Adjusted EBIT 351 400 500 591 717 811 EBIT 153 309 406 477 587 666 Change (%) -26.3% 101% 31.4% 17.4% 23.1% 13.4% Financial results 13.2 11.0 11.8 13.9 15.2 15.4 Pre-Tax profits 163 317 415 486 595 675 Tax (73.4) (68.6) (82.6) (95.5) (110) (124) Net profit 105 255 340 400 501 568 Adjusted net profit 291 343 429 509 623 702 Change (%) 41.7% 17.9% 25.2% 18.7% 22.2% 12.8% Cash Flow Statement (GBPm) Depreciation & amortisation 94.3 36.6 42.3 54.8 64.4 71.7 Change in working capital 33.2 (45.5) (57.0) (24.8) (24.3) (18.4) Operating cash flows 315 342 380 530 652 747 Capex, net (45.3) (30.4) (41.0) (41.3) (48.5) (53.9) Free Cash flow 270 311 339 489 603 693 Acquisition, net (24.8) (12.8) (65.0) 0.0 0.0 0.0 Financial investments, net (3.4) (2.8) 2.6 (5.9) (6.9) (7.7) Dividends (68.9) (86.1) (108) (159) (197) (205) Issuance of shares 5.9 (60.1) (82.8) 0.0 0.0 0.0 Issuance (repayment) of debt (4.4) (7.6) (5.1) 0.0 0.0 0.0 Other 28.8 (57.1) (102) 13.9 15.2 15.4 Net debt (584) (668) (647) (984) (1,398) (1,894) Balance Sheet (GBPm) Tangible fixed assets 33.6 43.4 61.6 38.0 10.3 (20.5) Intangibles assets & goodwill 609 644 743 754 768 784 Investments 149 221 318 322 327 333 Deferred tax assets 72.2 64.8 70.9 70.9 70.9 70.9 Other non-current assets 1.6 1.7 1.4 1.4 1.4 1.4 Cash & equivalents 588 675 658 996 1,410 1,905 Current assets 185 187 267 319 369 407 Total assets 1,638 1,837 2,120 2,501 2,957 3,480 Shareholders' equity 1,311 1,528 1,798 2,152 2,582 3,085 Provisions 45.1 45.6 46.3 46.3 46.3 46.3 Deferred tax liabilities 18.9 32.3 33.8 33.8 33.8 33.8 Current liabilities 259 225 231 258 284 304 L & ST Debt 4.2 6.5 11.3 11.3 11.3 11.3 Total Liabilities 1,638 1,837 2,120 2,501 2,957 3,480 Capital employed 728 860 1,151 1,168 1,183 1,192 Ratios Gross margin 94.79 95.52 96.19 96.32 96.30 96.60 Adjusted operating margin 49.10 50.35 51.62 50.13 51.80 52.60 Tax rate 45.14 21.67 19.91 19.67 18.45 18.36 Adjusted Net margin 40.68 43.10 44.30 43.21 44.97 45.56 ROE (after tax) 7.98 16.71 18.90 18.59 19.40 18.41 ROCE (after tax) 26.98 36.58 34.85 40.76 49.57 55.65 Gearing (44.51) (43.73) (35.99) (45.74) (54.17) (61.38) Pay out ratio 65.09 33.36 31.56 39.47 39.11 35.86 Number of shares, diluted 1,412 1,421 1,418 1,417 1,417 1,417 Data per Share (p) EPS 7.50 18.16 24.10 28.47 35.63 40.41 Restated EPS 20.59 24.12 30.20 35.94 43.94 49.54 % change 39.8% 17.1% 25.2% 19.0% 22.2% 12.8% BVPS 0.93 1.08 1.27 1.52 1.82 2.18 Operating cash flows 0.22 0.24 0.27 0.37 0.46 0.53 FCF 0.19 0.22 0.24 0.34 0.43 0.49 Net dividend 4.88 6.06 7.60 11.24 13.94 14.49
Source: Company Data; Bryan, Garnier & Co ests.
Company description ARM is a UK group specialised in the design of processor architectures and graphic chips. Virtually all semiconductor players are licencees of the group and use the designs developed by ARM to help them design their own chips. ARM has benefited massively from the boom in smartphones, 85% of which use processors based on an ARM architecture. To continue expanding, the group now needs to develop new growth sources including IoT, servers and networking infrastructure. Currently, ARM is the subject of a takeover bid by the Japanese company SoftBank.

r r
INDEPENDENT RESEARCH UPDATE ASML 21st July 2016 Unattactive risk reward profile
TMT Fair Value EUR81 (price EUR94.52) SELL
Bloomberg ASML NA Reuters ASML.AS 12-month High / Low (EUR) 94.5 / 71.8 Market capitalisation (EURm) 40,959 Enterprise Value (BG estimates EURm) 39,005 Avg. 6m daily volume ('000 shares) 1,272 Free Float 58.6% 3y EPS CAGR 21.7% Gearing (12/15) -27% Dividend yield (12/16e) 1.11%
Last April, we downgraded the ASML share to Sell pointing out that risks were present on 1/ the timing for EUV adoption given the current ramp-up in 10nm production and 2/demand for DUV tools for 10nm production in a fairly sluggish backdrop. With a valuation that leaves very little room for disappointment, risk-reward does not look attractive to us and we are maintaining our Sell recommendation.
Demand could weaken. In a backdrop of sluggish growth and where digital players are looking for catalysts in the internet of things (which does not use chips produced with advanced production technologies), we believe that demand for traditional ASML tools could be lower than expected. Investments in 10nm are indeed going ahead at present, but the number of clients capable of offering advanced node production is constantly falling (not to mention demand for components themselves). EUV should provide fresh impetus for the industry with margin widening thanks to a simplification in production. However, with a ramp-up in 10nm production that only started in Q2 2016, we believe that 7nm production (triggering orders for EUV tools) may not start at end-2017 as expected by the market, but with several quarters delay.
Rising uncertainty on future earnings. Although EUV is not used in mass production, ASML's lithography tools are sent to three clients to carry out tests. These tools are not billed on delivery but only when a certain number of contractualised performance targets have been reached. However, neither ASML, nor clients have control over the EUV tool performances and this could result in surprises in sales in coming quarters (one EUV tool is sold at around EUR110m) and on margins since gross margin on these tools is significantly lower than ASML's DUV tools (25-30% vs. 50%).
Valuation that leaves very little room for error. Whereas uncertainty hangs over the share, the valuation leaves no room for disappointment. The share is trading on 2016e P/E of 31x compared with an historical average of 22x and peer comparison of 18x. We fine-tuned our model with no impact on our valuation.
YE December 12/15 12/16e 12/17e 12/18e Revenue (EURm) 6,287 6,487 7,415 8,742 EBITA EURm) 1,565 1,469 2,017 2,666 Op.Margin (%) 24.9 22.7 27.2 30.5 Diluted EPS (EUR) 3.21 3.01 4.24 5.79 EV/Sales 6.15x 6.01x 5.20x 4.32x EV/EBITDA 20.7x 22.0x 16.5x 12.5x EV/EBITA 24.7x 26.5x 19.1x 14.2x P/E 29.5x 31.4x 22.3x 16.3x ROCE 22.9 20.7 27.7 35.4
68.1
73.1
78.1
83.1
88.1
93.1
98.1
103.1
108.1
09/01/15 09/04/15 09/07/15 09/10/15 09/01/16 09/04/16 09/07/16
ASML HOLDING SXX EUROPE 600
Analyst: Sector Analyst Team: Dorian Terral Richard-Maxime Beaudoux 33(0) 1.56.68.75.92 Thomas Coudry [email protected] Gregory Ramirez

ASML
26
Simplified Profit & Loss Account (USDm) 31/12/13 31/12/14 31/12/15 31/12/16e 31/12/17e 31/12/18e Revenues 5,245 5,856 6,287 6,487 7,415 8,742 Change (%) 10.9% 11.6% 7.4% 3.2% 14.3% 17.9% Gross profit 2,177 2,596 2,896 2,828 3,411 4,126 Adjusted EBITDA 1,290 1,547 1,864 1,774 2,337 3,031 Adjusted EBIT 1,048 1,282 1,565 1,469 2,017 2,666 EBIT 1,048 1,282 1,565 1,469 2,017 2,666 Change (%) -9.4% 22.4% 22.1% -6.1% 37.3% 32.2% Financial results (24.5) (8.6) (16.5) (17.0) (19.5) (22.9) Pre-Tax profits 1,023 1,274 1,549 1,452 1,997 2,643 Tax (8.0) (77.0) (161) (186) (240) (291) Net profit 1,015 1,197 1,387 1,266 1,758 2,353 Adjusted net profit 1,015 1,197 1,387 1,266 1,758 2,353 Change (%) -11.4% 17.8% 15.9% -8.7% 38.8% 33.8% Depreciation & amortisation Change in working capital (402) (607) 17.4 (33.3) (155) (222) Operating cash flows 1,054 1,025 2,026 1,538 1,922 2,496 Capex, net (659) (361) (545) (357) (371) (437) Free Cash flow 396 664 1,481 1,181 1,552 2,058 Financial investments, net 290 345 (615) 0.0 0.0 0.0 Dividends (216) (268) (302) (442) (500) (565) Issuance of shares 31.8 39.7 33.2 0.0 0.0 0.0 Issuance (repayment) of debt 368 (4.1) (3.6) 0.0 0.0 0.0 Other (297) (696) (561) (1,065) (600) (700) Net debt (1,936) (1,600) (2,279) (1,953) (2,405) (3,199) Tangible fixed assets Intangibles assets & goodwill 3,085 3,526 3,814 3,799 3,779 3,754 Deferred tax assets 264 188 162 162 162 162 Other non-current assets 46.0 55.3 124 124 124 124 Cash & equivalents 3,011 2,754 3,409 3,083 3,534 4,328 Current assets 3,891 4,232 4,166 4,297 4,910 5,785 Total assets 11,514 12,204 13,295 13,152 14,267 16,008 Shareholders' equity 6,922 7,513 8,389 8,148 8,806 9,894 Provisions 6.8 6.0 4.9 4.9 4.9 4.9 Deferred tax liabilities 384 276 263 263 263 263 Current liabilities 3,126 3,256 3,509 3,607 4,064 4,717 L & ST Debt 1,075 1,154 1,130 1,130 1,130 1,130 Total Liabilities 11,514 12,204 13,295 13,152 14,267 16,008 Capital employed 4,986 5,912 6,110 6,195 6,401 6,695 Ratios Gross margin 41.51 44.33 46.06 43.60 46.00 47.20 Operating margin 19.98 21.90 24.89 22.65 27.20 30.50 Tax rate 0.78 6.05 10.42 12.81 12.00 11.00 Net margin 19.36 20.43 22.06 19.52 23.71 26.91 ROE (after tax) 14.67 15.93 16.54 15.54 19.96 23.78 ROCE (after tax) 20.85 20.38 22.95 20.68 27.73 35.44 Gearing (27.97) (21.30) (27.17) (23.97) (27.31) (32.33) Pay out ratio 22.43 22.28 21.69 34.69 28.29 23.86 Number of shares, diluted 433 440 432 421 414 407 Data per Share (USD) EPS 2.36 2.74 3.23 3.03 4.27 5.82 Restated EPS 2.34 2.72 3.21 3.01 4.24 5.79 % change -12.7% 16.2% 17.9% -6.2% 41.0% 36.4% BVPS 15.97 17.09 19.41 19.37 21.26 24.33 Operating cash flows 2.43 2.33 4.69 3.66 4.64 6.14 FCF 0.91 1.51 3.43 2.81 3.75 5.06 Net dividend 0.53 0.61 0.70 1.05 1.21 1.39
Source: Company Data; Bryan, Garnier & Co ests.
Company description ASML is an equipment maker specialised in lithographic tools for the semiconductors industry. In a growing lithography market, the group has managed to increase its market share over the years, from 30% in 2000 to 80% at present. ASML is the only group to have invested in the EUV technology, enabling a further reduction in the size of transistors making up chip components and solving the cost equation facing the semiconductors industry. As an equipment maker, the group is dependent on investments by semiconductors manufacturers including Intel, Samsung, TSMC, SMIC, SK Hynix, Micron…

r r
INDEPENDENT RESEARCH UPDATE Dialog Semiconductor 21st July 2016 Low point reached
TMT Fair Value EUR37 vs. EUR35 (price EUR28.85) BUY
Bloomberg DLG GR Reuters DLGS.DE 12-month High / Low (EUR) 53.3 / 24.4 Market capitalisation (EURm) 2,246 Enterprise Value (BG estimates EURm) 1,493 Avg. 6m daily volume ('000 shares) 6.90 Free Float 96.0% 3y EPS CAGR 9.5% Gearing (12/15) -54% Dividend yield (12/16e) NM
Dialog is currently in a transition year. The smartphones market is slowing, especially at Apple, and has frozen the group's growth for 2016. However, we remain convinced that the group's momentum should improve and expect sequential growth of more than 50% in H2 2016. Thanks to the R&D programmes currently underway, Dialog should then benefit from market share gains at its main clients as of 2017. With the skies brightening, momentum improving and low valuation multiples (2016e P/E of 12.1x vs 18x for peers), we are making no change to our Buy recommendation. We updated our model, especially on FX, and our FV from EUR35 to EUR37.
Growth should return as of 2017. By maintaining its R&D capex, the group has confirmed its confidence in restoring robust growth as of 2017 (BG ests. +17%). We believe that DLG should reap the benefits of innovation currently in development, and this should be passed onto PMIC prices in future smartphone generations (especially the iPhone). However, the group should also benefit from 1/ an increase in smartphone contents, 2/ongoing positive trends in connectivity and power conversion, 3/ market share gains thanks to a closer collaboration with new Chinese players such as HiSilicon and Spreadtrum and a strengthened partnership with MediaTek, and 4/ marginally, the development of new product lines such as audio chips and PMICs for ARM laptops, televisions, set-top boxes, media sticks and wireless routers. In all, the recovery in business should help the group increase EPS by 9.5% on average over 2015-2018e (i.e. PEG of 1.4x).
In addition to the gradual improvement in business, the group still boasts a solid profile. Although it is having a difficult year (2016e sales down 8%), the group should nevertheless maintain comfortable 2016e underlying EBIT margin of 19.6% enabling it to generate 2016e FCF of USD256m, or a FCF yield of 11.6% including a share buyback programme currently underway for EUR50m. As such, the balance sheet remains very strong and the group had net cash of EUR662m at the end of Q1 2016 (more than 30% of its capitalisation).
YE December 12/15 12/16e 12/17e 12/18e Revenue (USDm) 1,355 1,250 1,467 1,754 EBITA USDm) 317.7 243.0 313.9 384.5 Op.Margin (%) 23.4 19.5 21.4 21.9 Diluted EPS (USD) 3.02 2.38 3.12 3.96 EV/Sales 1.25x 1.19x 0.90x 0.62x EV/EBITDA 4.7x 4.8x 3.4x 2.4x EV/EBITA 5.3x 6.1x 4.2x 2.8x P/E 9.6x 12.1x 9.2x 7.3x ROCE 46.9 39.2 51.7 63.3
23.1
28.1
33.1
38.1
43.1
48.1
53.1
09/01/15 09/04/15 09/07/15 09/10/15 09/01/16 09/04/16 09/07/16
DIALOG SEMICON. SXX EUROPE 600
Analyst: Sector Analyst Team: Dorian Terral Richard-Maxime Beaudoux 33(0) 1.56.68.75.92 Thomas Coudry [email protected] Gregory Ramirez
Dialog Semiconductor
28
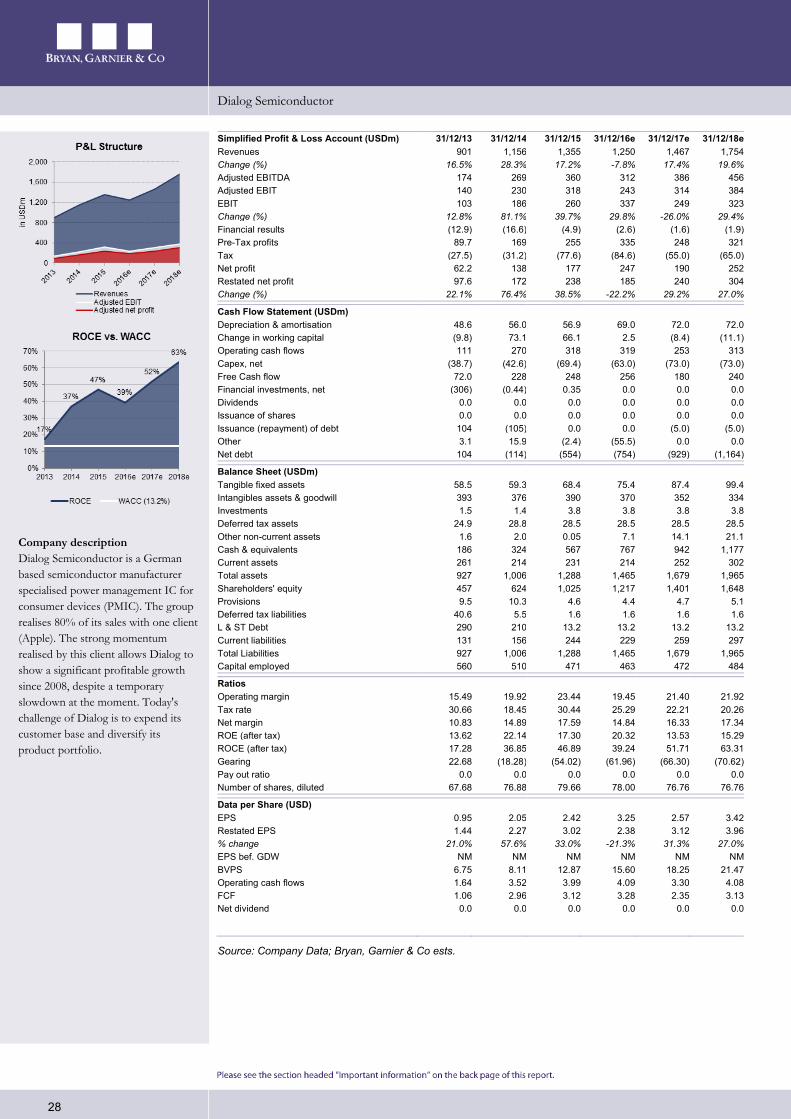
Simplified Profit & Loss Account (USDm) 31/12/13 31/12/14 31/12/15 31/12/16e 31/12/17e 31/12/18e Revenues 901 1,156 1,355 1,250 1,467 1,754 Change (%) 16.5% 28.3% 17.2% -7.8% 17.4% 19.6% Adjusted EBITDA 174 269 360 312 386 456 Adjusted EBIT 140 230 318 243 314 384 EBIT 103 186 260 337 249 323 Change (%) 12.8% 81.1% 39.7% 29.8% -26.0% 29.4% Financial results (12.9) (16.6) (4.9) (2.6) (1.6) (1.9) Pre-Tax profits 89.7 169 255 335 248 321 Tax (27.5) (31.2) (77.6) (84.6) (55.0) (65.0) Net profit 62.2 138 177 247 190 252 Restated net profit 97.6 172 238 185 240 304 Change (%) 22.1% 76.4% 38.5% -22.2% 29.2% 27.0% Cash Flow Statement (USDm) Depreciation & amortisation 48.6 56.0 56.9 69.0 72.0 72.0 Change in working capital (9.8) 73.1 66.1 2.5 (8.4) (11.1) Operating cash flows 111 270 318 319 253 313 Capex, net (38.7) (42.6) (69.4) (63.0) (73.0) (73.0) Free Cash flow 72.0 228 248 256 180 240 Financial investments, net (306) (0.44) 0.35 0.0 0.0 0.0 Dividends 0.0 0.0 0.0 0.0 0.0 0.0 Issuance of shares 0.0 0.0 0.0 0.0 0.0 0.0 Issuance (repayment) of debt 104 (105) 0.0 0.0 (5.0) (5.0) Other 3.1 15.9 (2.4) (55.5) 0.0 0.0 Net debt 104 (114) (554) (754) (929) (1,164) Balance Sheet (USDm) Tangible fixed assets 58.5 59.3 68.4 75.4 87.4 99.4 Intangibles assets & goodwill 393 376 390 370 352 334 Investments 1.5 1.4 3.8 3.8 3.8 3.8 Deferred tax assets 24.9 28.8 28.5 28.5 28.5 28.5 Other non-current assets 1.6 2.0 0.05 7.1 14.1 21.1 Cash & equivalents 186 324 567 767 942 1,177 Current assets 261 214 231 214 252 302 Total assets 927 1,006 1,288 1,465 1,679 1,965 Shareholders' equity 457 624 1,025 1,217 1,401 1,648 Provisions 9.5 10.3 4.6 4.4 4.7 5.1 Deferred tax liabilities 40.6 5.5 1.6 1.6 1.6 1.6 L & ST Debt 290 210 13.2 13.2 13.2 13.2 Current liabilities 131 156 244 229 259 297 Total Liabilities 927 1,006 1,288 1,465 1,679 1,965 Capital employed 560 510 471 463 472 484 Ratios Operating margin 15.49 19.92 23.44 19.45 21.40 21.92 Tax rate 30.66 18.45 30.44 25.29 22.21 20.26 Net margin 10.83 14.89 17.59 14.84 16.33 17.34 ROE (after tax) 13.62 22.14 17.30 20.32 13.53 15.29 ROCE (after tax) 17.28 36.85 46.89 39.24 51.71 63.31 Gearing 22.68 (18.28) (54.02) (61.96) (66.30) (70.62) Pay out ratio 0.0 0.0 0.0 0.0 0.0 0.0 Number of shares, diluted 67.68 76.88 79.66 78.00 76.76 76.76 Data per Share (USD) EPS 0.95 2.05 2.42 3.25 2.57 3.42 Restated EPS 1.44 2.27 3.02 2.38 3.12 3.96 % change 21.0% 57.6% 33.0% -21.3% 31.3% 27.0% EPS bef. GDW NM NM NM NM NM NM BVPS 6.75 8.11 12.87 15.60 18.25 21.47 Operating cash flows 1.64 3.52 3.99 4.09 3.30 4.08 FCF 1.06 2.96 3.12 3.28 2.35 3.13 Net dividend 0.0 0.0 0.0 0.0 0.0 0.0
Source: Company Data; Bryan, Garnier & Co ests.
Company description Dialog Semiconductor is a German based semiconductor manufacturer specialised power management IC for consumer devices (PMIC). The group realises 80% of its sales with one client (Apple). The strong momentum realised by this client allows Dialog to show a significant profitable growth since 2008, despite a temporary slowdown at the moment. Today's challenge of Dialog is to expend its customer base and diversify its product portfolio.

r r
INDEPENDENT RESEARCH UPDATE Infineon 21st July 2016 Under Estimated Potential
TMT Fair Value EUR16 vs. EUR15 (price EUR13.92) BUY-Top Picks
Bloomberg IFX GY Reuters IFXGn.DE 12-month High / Low (EUR) 14.0 / 8.7 Market capitalisation (EURm) 15,754 Enterprise Value (BG estimates EURm) 15,195 Avg. 6m daily volume ('000 shares) 5,558 Free Float 99.5% 3y EPS CAGR 16.8% Gearing (09/15) -5% Dividend yield (09/16e) 1.44%
A year ago, we initiated coverage of Infineon with the conviction that the group could integrate International Rectifier more quickly than expected. This is indeed what happened and prompted the group to surprise the market with enthusiastic full-year guidance in a difficult backdrop (in November 2015). The share price has gained 26% over one year (vs Stoxx 600 -16%), but given the group's strong operating performance over the period, we believe that the share's potential remains intact. We updated our model to integrate changes in FX, as a result our FV is up from EUR15 to EUR16 (upside potential of 15%) and we are reiterating our Buy recommendation.
The share price has suffered recently from the downgrade to FY16 guidance whereas business remains particularly robust. At the Q2 2016 earnings publication in May (FYE 30th September), management reviewed FY 2016 guidance and reduced its estimate for 2016e sales to 12% (median point) vs +13% and 16%, respectively. Some feared that this adjustment reflects certain weaknesses in the backdrop, but management was clear in stating that it was only due to exchange rate adjustments (EUR/USD at 1.15 vs. 1.10). Consequently, Infineon's valuation multiples have plunged significantly, from a peak level of 2016e P/E of 22.6x at end-December 2015 to 17.1x at present (-24%), which is also lower than the one-year average of 18.3x. In the meantime however, the Brexit vote has significantly strengthened the EUR/USD exchange rate to levels close to 1.10.
Growth and margin improvement potential still exists. The group boasts strong expertise in powerful semiconductors and exploits this in other market segments (especially the automotive and industrial sectors). Consequently, IFX outstrips market growth (average five-year growth of +9.5% vs +2.3%) and maintains a competitive edge thanks to the R&D programmes selected (FY 2015 R&D: 12% of sales). Infineon also invests in production technologies and is currently preparing the transition to 300mm production from the 200mm currently used, which is unique for analogue players. The rise in momentum of this production should provide an additional catalyst for margins as of 2017 and accentuate the group's competitive edge.
YE September 09/15 09/16e 09/17e 09/18e Revenue (EURm) 5,795 6,540 7,003 7,432 EBITA EURm) 898.0 1,044 1,195 1,335 Op.Margin (%) 15.5 16.0 17.1 18.0 Diluted EPS (EUR) 0.60 0.81 0.86 0.96 EV/Sales 2.68x 2.32x 2.10x 1.90x EV/EBITDA 9.4x 8.0x 7.0x 6.1x EV/EBITA 17.3x 14.6x 12.3x 10.6x P/E 23.0x 17.1x 16.3x 14.4x ROCE 18.5 16.6 17.0 18.8
7.4
8.4
9.4
10.4
11.4
12.4
13.4
14.4
09/01/15 09/04/15 09/07/15 09/10/15 09/01/16 09/04/16 09/07/16
INFINEON TECHS. (XET) SXX EUROPE 600
Analyst: Sector Analyst Team: Dorian Terral Richard-Maxime Beaudoux 33(0) 1.56.68.75.92 Thomas Coudry [email protected] Gregory Ramirez

Infineon
30
Simplified Profit & Loss Account (EURm) 30/09/13 30/09/14 30/09/15 30/09/16e 30/09/17e 30/09/18e Revenues 3,843 4,320 5,795 6,540 7,003 7,432 Change (%) -1.6% 12.4% 34.1% 12.9% 7.1% 6.1% Adjusted EBITDA 843 1,134 1,658 1,894 2,106 2,302 Adjusted EBIT 377 620 898 1,044 1,195 1,335 EBIT 324 526 555 795 943 1,097 Change (%) -28.8% 62.3% 5.5% 43.3% 18.5% 16.4% Financial results (19.0) (6.0) (34.0) (67.4) (58.1) (54.3) Pre-Tax profits 305 520 521 728 884 1,043 Tax (22.0) (30.0) 102 (43.7) (133) (156) Minority interests (0.07) (0.06) 0.20 (0.06) (0.15) (0.15) Net profit 283 490 622 684 752 886 Restated net profit 297 539 680 918 967 1,089 Change (%) -34.0% 81.4% 26.2% 35.0% 5.3% 12.7% Cash Flow Statement (EURm) Depreciation & amortisation (466) (514) (760) (850) (910) (966) Change in working capital (230) (71.0) (602) (53.6) (50.4) (45.8) Operating cash flows 601 981 817 1,398 1,612 1,807 Capex, net (375) (664) (728) (850) (910) (966) Free Cash flow 226 317 89.0 548 701 840 Financial investments, net 46.0 392 (1,865) 0.0 0.0 0.0 Dividends (129) (129) (202) (225) (225) (225) Issuance of shares 2.0 1.0 11.0 15.0 0.0 0.0 Issuance (repayment) of debt 52.0 4.0 2,398 4.0 0.0 0.0 Other (154) (336) (2,443) (3.0) 0.0 0.0 Net debt (1,983) (2,232) (220) (558) (1,035) (1,651) Balance Sheet (€m) Tangible fixed assets 1,600 1,700 2,093 1,993 1,893 1,793 Intangibles assets & goodwill 170 250 1,738 1,838 1,938 2,038 Investments 34.0 35.0 33.0 33.0 33.0 33.0 Deferred tax assets 325 378 607 607 607 607 Other non-current assets 153 141 155 155 155 155 Current assets 3,096 2,876 3,442 3,616 3,758 3,886 Cash & equivalents 527 1,058 673 986 1,463 2,079 Total assets 5,905 6,438 8,741 9,229 9,847 10,591 Shareholders' equity 3,776 4,158 4,671 5,145 5,672 6,334 Provisions 292 449 498 498 498 498 Deferred tax liabilities 4.0 5.0 147 147 147 147 Current liabilities 1,530 1,640 1,638 1,735 1,826 1,908 L & ST Debt 303 186 1,793 1,768 1,768 1,768 Total Liabilities 5,905 6,438 8,741 9,229 9,847 10,591 Capital employed 3,552 3,286 5,791 5,927 5,977 6,023 Ratios Operating margin 9.81 14.35 15.50 15.96 17.07 17.97 Tax rate 7.21 5.77 (19.62) 6.00 15.00 15.00 Net margin 7.73 12.48 11.73 14.04 13.80 14.65 ROE (after tax) 7.49 11.78 13.32 13.30 13.25 13.99 ROCE (after tax) 9.85 17.78 18.54 16.56 17.00 18.85 Gearing (52.52) (53.68) (4.71) (10.85) (18.25) (26.06) Pay out ratio 43.41 23.93 29.73 24.51 23.26 20.65 Number of shares, diluted 1,081 1,128 1,126 1,129 1,129 1,129 Data per Share (EUR) EPS 0.25 0.48 0.56 0.61 0.67 0.79 Restated EPS 0.26 0.48 0.60 0.81 0.86 0.96 % change -33.7% 82.2% 25.8% 34.5% 5.3% 12.7% BVPS 3.49 3.69 4.15 4.56 5.02 5.61 Operating cash flows 0.56 0.87 0.73 1.24 1.43 1.60 FCF 0.21 0.28 0.08 0.48 0.62 0.74 Net dividend 0.12 0.12 0.18 0.20 0.20 0.20
Source: Company Data; Bryan, Garnier & Co ests.
Company description Infineon is a German semiconductors manufacturer active in the automotive sector, electrical power management especially for industry, and security applications such as bank cards. In early 2015, the group completed the acquisition of International Rectifier, a US rival particularly active in power management. Via this acquisition, the group has consolidated its leading position in this segment. Infineon is also a leader in the automotive segment.

r r
INDEPENDENT RESEARCH Melexis 21st July 2016 Even diamonds have a price
TMT Fair Value EUR48 (price EUR61.00) SELL Coverage initiated
Bloomberg MELE BB Reuters MLXS.BR 12-month High / Low (EUR) 61.0 / 37.7 Market capitalisation (EURm) 2,464 Enterprise Value (BG estimates EURm) 2,405 Avg. 6m daily volume ('000 shares) 38.50 Free Float 35.6% 3y EPS CAGR 5.3% Gearing (12/15) -24% Dividend yields (12/16e) 3.02%
Melexis is a Belgian company specialised in the design of components for the automotive sector. Helped by a buoyant market, the group has a solid track record, managing to maintain average annual sales growth of 21% between 2009 and 2015. However, we believe this momentum will start to slow in coming years. With Melexis’ share trading on 2016e P/E of 25.8x, our EPS estimate of 5.1% points to PEG of 5.0x. In this backdrop, we advise avoiding the share and have adopted a Sell recommendation.
A rare and attractive profile. Melexis is among the groups that seem to have an ideal profile at first sight. It is fabless and specialises in automotive sensors, the most buoyant segment at the moment. It has a solid track record with few disappointments and an impressive growth history. As such, it seems to tick all the right boxes for becoming one of our top picks.
Nevertheless, a slower momentum limits EPS growth to 5.1% on average over the next three years. This is primarily due to a less dynamic top line than in the past with the longer maturity of products sold by Melexis (2015-2018e CAGR in sales of 10%), but also due to a margin slightly under pressure in view of increased R&D capex requirements. In all, we expect average EPS growth of 5.1% between 2015 and 2018e. In addition, we expect a downward revision to consensus estimates. Indeed, our estimates are around 3% lower than those of the market, which is currently forecasting EPS growth of 5.9%, adding a weight to the share's upside.
Our model points to downside potential of 21%. Despite the group's attractive track record and profile, the recent share price performance to reach peaks levels over one year prompts us to avoid the share. With low EPS growth and a share trading on 25.8x 2016e net earnings, Melexis' PEG works out to 5.0x, or the highest among the semiconductor stocks we cover. Moreover, our valuation of EUR48 per share points to downside potential of 21%. As such, we believe there is nothing left to play on the share and advise avoiding it, hence our Sell recommendation.
YE December 12/15 12/16e 12/17e 12/18e Revenue (EURm) 400.14 453.31 494.53 535.98 EBITA EURm) 107.6 111.4 123.1 133.5 Op.Margin (%) 26.9 24.6 24.9 24.9 Diluted EPS (EUR) 2.45 2.37 2.64 2.86 EV/Sales 6.01x 5.31x 4.81x 4.38x EV/EBITDA 18.4x 17.3x 15.3x 14.0x EV/EBITA 22.4x 21.6x 19.3x 17.6x P/E 24.9x 25.8x 23.1x 21.3x ROCE 52.5 46.2 46.0 45.3
7.7
8.7
9.7
10.7
11.7
12.7
13.7
16/01/15 16/04/15 16/07/15 16/10/15 16/01/16 16/04/16 16/07/16
MELEXIS SXX EUROPE 600
Analyst: Sector Analyst Team: Dorian Terral Richard-Maxime Beaudoux 33(0) 1.56.68.75.92 Thomas Coudry [email protected] Gregory Ramirez

Melexis
32
Simplified Profit & Loss Account (CHFm) 31/12/13 31/12/14 31/12/15 31/12/16e 31/12/17e 31/12/18e Revenues 275 332 400 453 495 536 Change (%) 11.5% 20.7% 20.4% 13.2% 9.2% 8.4% Adjusted EBITDA 79.2 111 130 139 155 168 Adjusted EBIT 63.7 89.2 108 111 123 133 EBIT 63.7 89.2 108 111 123 133 Change (%) 14.1% 40.0% 20.7% 3.5% 10.6% 8.4% Financial results (0.50) 2.9 1.9 0.62 2.5 2.7 Pre-Tax profits 63.2 92.1 109 112 126 136 Tax (8.0) (7.1) (10.4) (16.4) (18.8) (20.4) Net profit 55.2 85.0 99.1 95.5 107 116 Adjusted net profit 55.2 85.0 99.1 95.5 107 116 Change (%) 7.2% 53.9% 16.6% -3.6% 11.8% 8.4% Cash Flow Statement (CHFm) Depreciation & amortisation 15.5 22.1 22.8 27.8 32.1 34.8 Change in working capital 0.77 (10.0) (5.0) (13.1) (9.4) (9.4) Operating cash flows 70.8 95.0 115 109 130 141 Capex, net (22.5) (23.7) (40.3) (38.6) (44.5) (48.2) Free Cash flow 48.3 71.3 74.7 70.3 85.0 92.9 Acquisition, net 0.0 0.0 0.0 0.0 0.0 0.0 Financial investments, net 0.82 4.8 0.33 0.0 0.0 0.0 Dividends (28.0) (40.1) (52.1) (74.5) (59.0) (63.9) Issuance (repurchase) of own shares 0.0 0.0 0.0 0.0 0.0 0.0 Issuance (repayment) of debt (14.6) (4.1) (3.0) (0.05) 0.0 0.0 Other 14.5 0.33 (2.7) 4.8 0.0 0.0 Net debt (9.2) (41.4) (58.7) (59.3) (85.4) (114) Balance Sheet (CHFm) Tangible fixed assets 66.3 71.7 90.3 101 114 127 Intangibles assets & goodwill 4.7 4.7 7.4 7.2 7.2 7.2 Investments 0.01 0.01 0.01 0.01 0.01 0.01 Deferred tax assets 14.1 13.2 10.9 9.8 9.8 9.8 Other non-current assets 1.5 0.96 0.01 0.01 0.01 0.01 Cash & equivalents 31.5 59.6 73.9 74.5 101 130 Inventories 44.3 56.4 64.1 66.1 72.1 78.1 Current assets 52.4 50.1 60.2 74.4 79.5 84.7 Total assets 215 257 307 333 383 437 Shareholders' equity 158 201 243 264 312 364 Provisions 0.0 0.0 0.0 0.0 0.0 0.0 Deferred tax liabilities 0.0 0.0 0.0 0.0 0.0 0.0 Current liabilities 33.7 35.2 47.4 52.9 54.7 56.5 L & ST Debt 23.5 20.2 16.8 16.5 16.5 16.5 Total Liabilities 215 257 307 333 383 437 Capital employed 150 162 185 206 228 250 Ratios Gross margin 46.31 48.53 48.01 46.60 46.80 47.00 Adjusted operating margin 23.14 26.83 26.89 24.57 24.90 24.90 Tax rate 12.66 7.70 9.50 14.68 15.00 15.00 Adjusted Net margin 20.05 25.57 24.76 21.09 21.59 21.59 ROE (after tax) 35.03 42.21 40.85 36.20 34.25 31.83 ROCE (after tax) 37.21 50.82 52.51 46.13 45.97 45.29 Gearing (5.85) (20.58) (24.21) (22.48) (27.40) (31.48) Pay out ratio 50.78 47.13 52.56 77.93 55.23 55.23 Number of shares, diluted 40.40 40.40 40.40 40.40 40.40 40.40 Data per Share (CHF) EPS 1.37 2.10 2.45 2.36 2.64 2.86 Restated EPS 1.37 2.10 2.45 2.36 2.64 2.86 % change 9.4% 53.9% 16.6% -3.6% 11.8% 8.4% BVPS 3.90 4.98 6.00 6.53 7.72 9.00 Operating cash flows 1.75 2.35 2.85 2.70 3.21 3.49 FCF 1.20 1.76 1.85 1.74 2.10 2.30 Net dividend 0.69 0.99 1.29 1.84 1.46 1.58
Source: Company Data; Bryan, Garnier & Co ests.
Company description Melexis is a Belgian group specialised in sensor production for the automotive sector. The group operates a fabless model and outsources the majority of its production to XFab, a sister-company foundry. Within its segment of automotive sensors, Melexis remains in the number four positioned behind Bosch Sensortec, Infineon and Allegro.

Melexis
33
Table of contents
1. Investment Case ........................................................................................................................................ 34
2. Group snapshot ........................................................................................................................................ 35
3. Beware of disappointments .................................................................................................................... 36
3.1. Forex effects masking a slowdown ................................................................................ 36
3.2. Competition is changing .................................................................................................. 37
3.3. Macro: a solid group but not insensitive ....................................................................... 37
4. Our scenario .............................................................................................................................................. 40
4.1. A brake on growth ............................................................................................................ 40
4.2. Cash generation intact ...................................................................................................... 41
4.3. Balance sheet strengthening gradually ........................................................................... 42
5. Downside potential for the share .......................................................................................................... 43

Melexis
34
1. Investment Case
The reason for writing now Melexis boasts an outstanding profile and track record and for this reason is particularly well-liked by investors and is currently trading at one-year high levels, which is an attractive performance so soon after the Brexit vote. However, we believe the market is overly optimistic and does not fully price in the change in momentum on the cards (2015-19e CAGR in sales of 10% vs. >20% over the past six years). As such, we are in a situation whereby the share is trading on 2016e P/E of 25.8x whereas average EPS growth expected for the next three years only stands at 5.1%, or a PEG of 5.0x!. In addition, our models point to downside potential. In this backdrop, we have adopted a Sell recommendation.
Valuation Our EUR48 Fair Value stems from a DCF valuation (WACC of 10.0%). On the basis of our estimates, the share is trading on 2016e EV/sales of 5.0x and 2016e P/E of 25.8x.
Catalysts Melexis is active in semiconductors primarily destined for the automotive segment. At present, momentum in the sector is buoyant, but we have noted that competition in Melexis products is strengthening and this could partly limit the group's growth potential. The group's next publication, expected on 27th July, could bring this weakness to light.
Difference from consensus Our estimates show a slight difference relative to the consensus. Our three-year average growth estimate is higher in sales terms (BG ests. 2015-2018e CAGR +10% vs CS +9%) but lower in net profit terms since we have factored in higher R&D investment requirements (as a % of sales). In all, our EPS estimates work out 3% below those of the consensus.
Risks to our investment case Melexis is clearly exposed to the automotive segment and is therefore particularly sensitive to macro-economic momentum, which could have a negative or positive effect on our forecasts.

Melexis
35
2. Group snapshot Melexis is a Belgian group specialised in the design of semiconductor devices destined for the automotive sector (almost 89% of 2015 sales). The remaining 11% is sold via partnerships, primarily for connected objects.
Fig. 1: The automotive segment represents almost 90% of the group's sales Automotive Non-automotive
% o
f sal
es
CAGR 2012/2015: +20% CAGR 2012/2015: +3.3%
Rev
enue
m
omen
tum
Key
pro
duct
s - LIN ASICs - Motor Control Ics
- Position, current & speed Sensors - Pressure Sensors
- Tire Pressure Monitoring System (TPMS)
- RF chips - RFID
- Sensors (Light, temperature, pressure, humidity, motion…)
Key
cus
tom
ers
(exa
mpl
es) - Sensata (Schrader)
- Bosch - Denso
- Continental - Vishay - Delphi
- Samsung - Whirlpool
- Distribution channel
Key
ca
taly
sts - Automotive market momentum
- Adoption of CO2 regulations - Increasing comfort
- Electrification of vehicles
- Internet of Things - Melexis' customer portfolio development
Stro
ng
sens
itivi
ty
to - Automotive production
- Worldwide macro-economic situation - Worldwide macro-economic situation
Source: Bryan, Garnier & Co.
Melexis had adopted a fabless model whereby it operates no plant and focuses on developing and selling chips. This widely-used model in the semiconductors industry has the advantage of offering greater flexibility in operating spending and helping to get through cycle lows more easily. We estimate that around 95% of production is outsourced to X-fab, a European speciality foundry, with the remaining 5% outsourced to other foundries such as TSMC (primarily) and UMC (occasionally). Note importantly that the choice of X-Fab as a foundry is not irrelevant since X-Fab is a sister company to Melexis. The majority shareholder in the foundry is Xtrion, which is also the majority shareholder in Melexis.
In the automotive segment, Melexis has established its expertise in analogue chips and especially in sensors and actuators (micro-machine controlling and moving parts that help control flows for example), which represent more than 85% of the group's overall activity. Thanks to a solid product portfolio, Melexis manages to defend itself in the automotive market against players such as NXP, Bosch Sensortec (which is also a customer), STMicroelectronics and Infineon.
89%
11%
200
250
300
350
400
FY13 FY14 FY15
35
40
45
FY13 FY14 FY15
Melexis is a Belgian group specialised in the design of semiconductor devices destined for the automotive sector
Melexis shareholders
Source: Company
53%
10%1%
36%
Xtrion Fidelity (FMR)
Treasury shares Free float

Melexis
36
3. Beware of disappointments Melexis has an impressive track record. The group has rarely disappointed the market and between 2009 and 2015, its sales rose from EUR129m to EUR400m, namely average annual growth of 21% over the period. As such, the group has a good reputation in European stockmarkets and is seen as being a solid growth stock.
While we are clearly in admiration of the group's historical performances, we believe there is a risk in terms of future growth.
3.1. Forex effects masking a slowdown The group is primarily active in a semiconductors universe destined for the automotive segment and more specifically sensors. In 2015, the auto components market reached USD29.3bn (source IDC) but is divided into five main product categories: powerful semiconductors, sensors, microcontrollers (MCU), ASSPs (Application Specific Standard Product, mainly connectivity and amplificators) and logic semiconductors. Melexis' offer is above all made up of sensors. For example, the group has magnetic sensors that are used for reducing car fuel consumption and gyroscopes/accelerometres for safety applications (ABS, airbag…).
As such, Melexis has historically benefited from trends to equip vehicles with electronic components, allowing it to generate impressive average growth since 2009. However, the group has also won market share thanks to better momentum in automotive sensors than in other components. Thanks to its intelligent positioning, the group has therefore managed to outperform its market for several years, although we think things are beginning to change and a slowdown is starting to take shape.
This slowdown is only visible when the group's sales are adjusted for forex effects. Indeed, between 2011 and 2015, average sales growth adjusted for forex effects worked out to 14.8%. Compared with average growth in the automotive semiconductors segment, the group also posted an outperformance of 8.7pp. However, while the group's 2015 growth stood at more than 20%, adjusted for forex, it only worked out to 9%. Admittedly, this is an excellent performance, but over the same period, market growth ran at around 10.8% according to IDC data.
Fig. 2: Growth driven by a beneficial EUR/USD exchange rate
Sources: IDC; Bryan, Garnier & Co ests.
FY11 FY12 FY13 FY14 FY15
Melexis sales growth +5.1% +7.1% +11.5% +20.7% +20.4%
Melexis sales growth at constantchange
+8.3% +7.0% +13.5% +20.3% +8.5%
Semi Automotive market growth +15.2% +1.0% +3.1% +10.0% +10.8%
0%
5%
10%
15%
20%
25%
Sale
s gr
owth
(in
%)
Melexis has historically benefited from trends to equip vehicles with electronic components, allowing it to generate impressive average growth since 2009.
We think things are beginning to change and a slowdown is starting to take shape. This slowdown is only visible when the group's sales are adjusted for forex effects.

Melexis
37
3.2. Competition is changing Melexis is virtually exclusively exposed to the automotive segment, meaning that the group is still advantageously positioned, with the segment continuing to generate healthy momentum in 2016 and offering attractive prospects for coming years. In addition, the market segment has high entry barriers and the group of players active in this segment has remained virtually the same for 20 years. However, we have noticed changes within the segment that could be disadvantageous for Melexis.
Firstly, we would point out STMicroelectronics' aim to penetrate the automotive sensors segment. Boasting good expertise in consumer sensors and a healthy positioning in the automotive segment via other products, the group is now looking for a new source of fresh growth in automotive sensors. Although it is not really visible as yet, we believe that ST has all the right ingredients (expertise, production ability, commercial network etc.) to become a heavyweight rival and 2016 should be a key year for STMicroelectronics in this segment.
We also see the acquisition of Micronas by Japanese group TDK (announced in December 2015, closed in March 2016 valuing Micronas at almost CHF214m) as a potentially dangerous operation for Melexis since we believe TDK could provide Micronas additional means to extend and strengthen its product portfolio.
3.3. Macro: a solid group but not insensitive With recent negative newsflow in smartphones and PCs, numerous investors have found a safe-haven in Melexis, believing the share to be better positioned (thanks to its automotive exposure) and protected from macro-economic hazards. Just looking at the share's reaction in recent weeks is enough to understand the view of Melexis' solidity that investors have.
Fig. 3: Market sentiment: market impact of the Brexit seems to be limited on Melexis share price evolution
Sources: Bloomberg; Bryan, Garnier & Co ests.
While the overall market always seems to have trouble to get back to pre-Brexit level (Stoxx 600 + 1% over the past two months), Melexis has little suffered from the impact Brexit market (that either before or after the announcement of results). We are not discussing the impact of Brexit on Melexis' business here, but would simply highlight the very positive market sentiment underpinning the share price.
85.00
90.00
95.00
100.00
105.00
110.00
115.00
120.00
125.00
20/0
5
22/0
5
24/0
5
26/0
5
28/0
5
30/0
5
01/0
6
03/0
6
05/0
6
07/0
6
09/0
6
11/0
6
13/0
6
15/0
6
17/0
6
19/0
6
21/0
6
23/0
6
25/0
6
27/0
6
29/0
6
01/0
7
03/0
7
05/0
7
07/0
7
09/0
7
11/0
7
13/0
7
15/0
7
17/0
7
19/0
7
Shar
e pr
ice
(bas
e 10
0)
Melexis STOXX 600
Automotive sensors – market share
Source: Strategic Analytics
Just looking at the share's reaction in recent weeks is enough to understand the view of Melexis' solidity that investors have.
Bosch Sensortec
21.1%
Infineon11.5%
Allegro7.7%
Melexis7.0%
Analog Devices
6.6%
Freescale5.9%
Micronas3.7%
Others36.5%
Pre-Brexit : Melexis +11% vs. Stoxx 600 +2%
Post-Brexit : Melexis +6% vs. Stoxx 600 -2%

Melexis
38
Furthermore, whereas the market still has this sentiment of solidity, Melexis has already proved that it is not immune to the hazards of the global economy. Between 2000 and 2015, the group generated growth of 11% on average whereas the 2000/2015 CAGR in global sales in the industry stood at 3.2%. The group nevertheless suffered harshly from the global recession prompted by the financial crisis in 2008. In semi-conductors, significant sensitivity to the economic backdrop is not surprising, but we would note that Melexis suffered more than the rest of the industry. Between 2007 and 2009, global semiconductor sales fell by 6% on an average annual basis whereas the group saw its sales plummet 21% a year on average.
Fig. 4: Robust growth but sensitive to the economic backdrop
Sources: Melexis; Bryan, Garnier & Co ests.
Over the same period, we noted that despite the fabless model operated by Melexis, the margin was also affected. Between 2000 and 2007, when average growth stood at 13% a year, the group managed to generated average operating margin of 20%. Then from 2007 to 2009, when the global recession seriously upset the group's growth profile, Melexis did not manage to maintain its historical margin level. As such, in 2009, EBIT margin hit a low point of 5%.
Fig. 5: Margins more sensitive to growth than business volumes
Sources: Melexis; Bryan, Garnier & Co ests.
85102
118134
153174
202 204186
129
219 231247
275
332
400
0
50
100
150
200
250
300
350
400
450
FY00 FY01 FY02 FY03 FY04 FY05 FY06 FY07 FY08 FY09 FY10 FY11 FY12 FY13 FY14 FY15
Sale
s (in
EU
Rm)
21%19% 19%
21%19% 20% 21% 20%
16%
5%
26%24% 23% 23%
27% 27%
0%
5%
10%
15%
20%
25%
30%
0
50
100
150
200
250
300
350
400
450
FY00 FY01 FY02 FY03 FY04 FY05 FY06 FY07 FY08 FY09 FY10 FY11 FY12 FY13 FY14 FY15
Ope
ratin
g m
argi
n
Sale
s (in
EU
Rm)
Melexis revenues (lhs) Operating margin (rhs)
The group nevertheless suffered harshly from the global recession prompted by the financial crisis in 2008.
Over the same period, we noted that despite the fabless model operated by Melexis, the margin was also affected.
An average growth of +13%, an EBIT margin stabilized at about 20%
An average growth of +21%, an EBIT margin stabilized at about 25%
CAGR 2000/15: +11%

Melexis
39
As such, although the group has a solid business model, it is not insensitive to macro-economic hazards. At present, we have no reason to think that there is a potential risk for the group's business, but would point out that the share currently benefits from very positive market sentiment that is likely to change rapidly. In this respect, the market situation is very similar to that of Dialog until the acquisition of Atmel in September 2015. Also, we remind that IMF recently revised down its growth forecasts (again). IMF’s projection for global growth are now down to 3.1% from 3.2% for 2016, and to 3.4% from 3.5% for 2017.

Melexis
40
4. Our scenario 4.1. A brake on growth With increased competition in Melexis products (STMicroelectronics is currently entering the segment, Bosch Sensortec is firmly maintaining its positions, Micronas has been acquired by TDK and could see its product portfolio strengthen rapidly), we estimate that the group could no longer be in a position of significant market share gains. In addition, since the beginning of 2016, the evolution of the EUR/USD exchange rate appears to be less favourable compared with 2015. As such, we do not expect the group to outperform significantly its peers and are forecasting average 2015/2018e growth of 10.0%.
With this growth momentum, we estimate that the group can maintain EBIT margin at 25%. Indeed, outsourcing of production has not enabled it to efficiently activate any leverage thanks to additional volumes and we believe the group will not risk cutting R&D and sales investments and these could grow slightly faster than top-line growth. As such, we are forecasting a downturn in margins as of 2016 with 2016e EBIT margin at 25% (vs. 27% in 2015). Our scenario points to average EPS growth of 5.1% over the next three years.
Fig. 6: P&L – Average EPS growth of 5.1% over 2015/2018e [in EURm] 2015 1Q16 2Q16e 3Q16e 4Q16e 2016e 2017e 2018e CAGR 15/18e
Sales 400 109 113 114 116 452 492 533 10.0% Seq. growth 20% 7% 4% 0% 2% 13% 9% 8%
Gross profit 192 49 54 54 54 211 230 251 Gross margin 48% 45% 47% 47% 47% 47% 47% 47%
R&D -57 -15 -17 -18 -19 -69 -74 -80
% of sales -14% -13% -15% -16% -17% -15% -15% -15%
G&A -19 -5 -5 -5 -6 -20 -23 -26
% of sales -5% -4% -4% -5% -5% -5% -5% -5%
S&M -9 -2 -3 -3 -3 -10 -11 -12
% of sales -2% -2% -2% -2% -2% -2% -2% -2%
EBIT 108 28 29 28 26 111 123 133 7.3% Operating margin 27% 25% 26% 24% 23% 25% 25% 25%
Financial result 2 -1 1 1 1 1 2 3
% of sales 0% -1% 1% 1% 1% 0% 1% 1%
Income tax -10 -4 -4 -4 -4 -16 -19 -20
Income tax rate -10% -14% -15% -15% -15% -15% -15% -15%
Net profit 99 23 25 24 23 95 106 115 5.1% Net margin 25% 21% 22% 21% 20% 21% 22% 22%
Dil. EPS 2.45 0.57 0.63 0.60 0.57 2.36 2.63 2.85 5.1% EPS seq. growth 17% 4% 11% -5% -4% -4% 11% 8%
Source: Bryan, Garnier & Co ests.
For the next three years, our EPS estimates are on average 3% lower than the consensus. As such, we estimate there is a risk that the consensus could reduce its figures in coming months.
We are forecasting average 2015/2018e growth of 10.0% and a 25% EBIT margin.
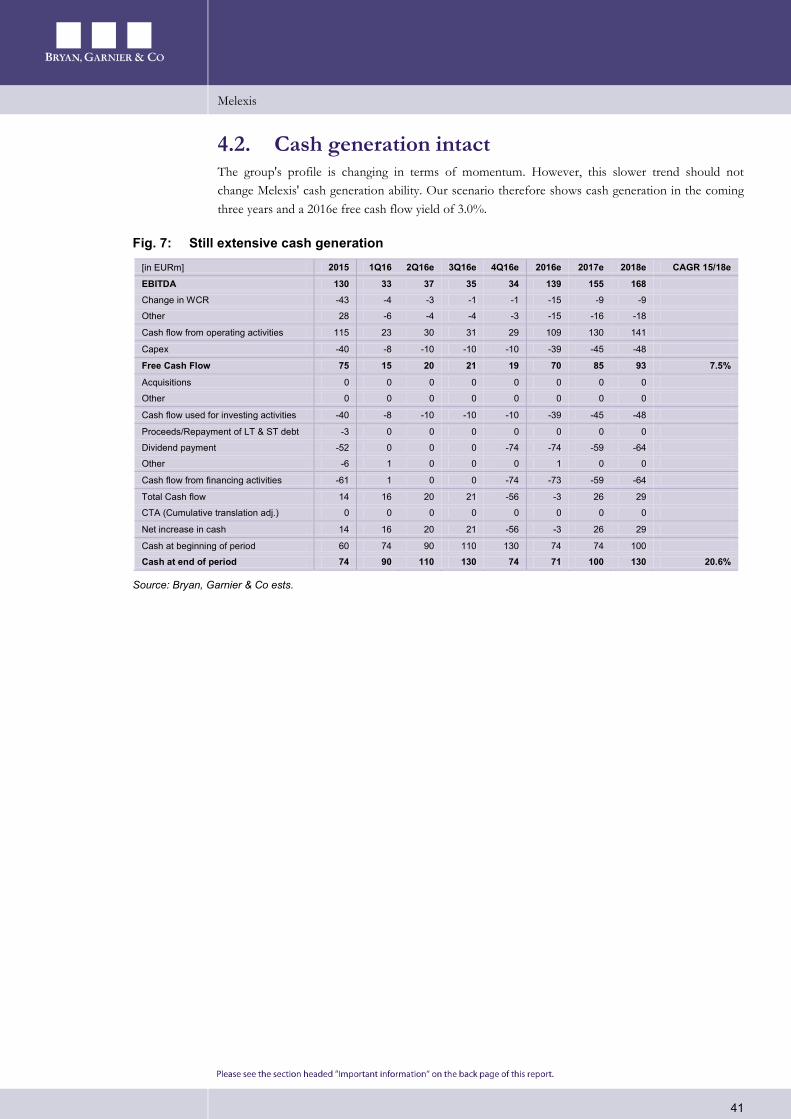
Melexis
41
4.2. Cash generation intact The group's profile is changing in terms of momentum. However, this slower trend should not change Melexis' cash generation ability. Our scenario therefore shows cash generation in the coming three years and a 2016e free cash flow yield of 3.0%.
Fig. 7: Still extensive cash generation
[in EURm] 2015 1Q16 2Q16e 3Q16e 4Q16e 2016e 2017e 2018e CAGR 15/18e
EBITDA 130 33 37 35 34 139 155 168 Change in WCR -43 -4 -3 -1 -1 -15 -9 -9
Other 28 -6 -4 -4 -3 -15 -16 -18
Cash flow from operating activities 115 23 30 31 29 109 130 141
Capex -40 -8 -10 -10 -10 -39 -45 -48
Free Cash Flow 75 15 20 21 19 70 85 93 7.5%
Acquisitions 0 0 0 0 0 0 0 0
Other 0 0 0 0 0 0 0 0
Cash flow used for investing activities -40 -8 -10 -10 -10 -39 -45 -48
Proceeds/Repayment of LT & ST debt -3 0 0 0 0 0 0 0
Dividend payment -52 0 0 0 -74 -74 -59 -64
Other -6 1 0 0 0 1 0 0
Cash flow from financing activities -61 1 0 0 -74 -73 -59 -64
Total Cash flow 14 16 20 21 -56 -3 26 29
CTA (Cumulative translation adj.) 0 0 0 0 0 0 0 0
Net increase in cash 14 16 20 21 -56 -3 26 29
Cash at beginning of period 60 74 90 110 130 74 74 100
Cash at end of period 74 90 110 130 74 71 100 130 20.6%
Source: Bryan, Garnier & Co ests.

Melexis
42
4.3. Balance sheet strengthening gradually With cash generation of more than EUR70m in 2016e, then EUR85m and EUR93m generated in 2017e and 2018e respectively, Melexis' balance sheet continues to strengthen in our model.
At the end of 2015, the group had net cash of EUR59m and this level rises to EUR114m in 2018e in our model. Gearing therefore changes from -24% in 2015 to -31% in 2018e.
Fig. 8: Balance sheet continuing to strengthen [in EURm] 2015 1Q16 2Q16e 3Q16e 4Q16e 2016e 2017e 2018e
Cash and cash equivalents 74 90 110 130 74 74 100 130
Inventories 64 62 64 65 66 66 72 78
Account receivable Trade 51 53 55 55 56 56 61 66
Other 9 18 18 18 18 18 18 18
Total current assets 198 223 247 269 215 215 252 292
Property, plant and equipment 90 93 96 98 101 101 114 127
Intangible fixed assets 7 7 7 7 7 7 7 7
Deferred tax assets 11 10 10 10 10 10 10 10
Total non-current assets 109 110 113 115 118 118 131 144
Total assets 307 333 360 384 333 333 383 437
Account payable Trade 15 18 19 19 20 20 21 23
Current portion of LT debt 7 4 4 4 4 4 4 4
Accured expenses and payroll 7 10 10 10 10 10 10 10
Other 25 22 23 23 23 23 23 23
Current liabilities 54 54 55 56 56 56 58 60
LT debt less current portion 8 11 11 11 11 11 11 11
Deferred tax liabilities 0 0 0 0 0 0 0 0
Other non-current liabilities 2 2 2 2 2 2 2 2
Non-current liabilities 10 13 13 13 13 13 13 13
Total equity 243 266 291 315 264 264 312 364
Total liabilities and Equity 307 333 360 384 333 333 383 437
Source: Bryan, Garnier & Co ests.
Melexis
43
5. Downside potential for the share We generally use at least two valuation methods. However, like u-blox, the specific profile (midcap and fabless highly exposed to the automotive sector) of Melexis makes the composition of a representative sample irrelevant. As such, a peer comparison does not seem relevant.
Our Fair Value of EUR48 therefore stems from a DCF valuation and points to downside risk of 21% relative to the share price. Given the items mentioned above in Chapter 3, we have adopted a Sell recommendation on the share.
Our DCF valuation is based on the following assumptions:
Our base scenario, which includes estimates out to 2018e. Like other semiconductors players that we cover, we have applied a cyclical growth scheme over the normalised period (from 2019e to 2024e). Nevertheless, in view of the fundamental changes affecting Melexis' profile, we have not applied our usual method of reproducing the characteristics of the previous cycle in the normalised period. We have assumed a growth rate of 13.0% (equivalent to the average growth rate over the past five years) at the beginning of the normalised period, or 2019e, which seems more representative of coming years. We have then applied a linear reduction to this rate out to 2024e in order to reach our terminal growth rate of 3.0%. For the 2016/25e period, this scenario points to average growth of 9.1%.
We have assumed average EBIT margin of 24.8% over 2016/25e, i.e. the margin in our 2016/18e scenario and then a linear reduction in this margin in order to reach our long term margin of 24.6% (i.e. average EBIT margin of the past five years).
WCR close to 23% of sales over the entire period, or slightly below the historical level in view of low growth.
Capex equivalent to 8.5% of sales in 2015e, then 9.0% of sales over the rest of the period, close to the historical level.
A corporate tax rate close to 15% corresponding to Melexis' normal average corporate tax rate. The group has a low corporate tax rate thanks to the advantages granted by the Belgian government to companies in technological innovation.
WACC of 10.0%. We have applied beta of 1.2x similar to that applied in our valuation of ASML, Infineon and u-blox, a risk-free rate of 1.6% and a market risk premium of 7%. At end-2015, the group had net cash of EUR59m.

Melexis
44
Fig. 9: WACC of 10.0% WACC
European risk-free interest rate 1.6%
Equity risk premium 7.0%
Beta 1.2
Return expected on equity 10.0%
Interest rate on debt 2.5%
Market capitalisation (EURm) 2,169
Net debt on 31/03/15 (EURm) -59 Enterprise value (EURm) 2,111
WACC 10.0%
Source: Bryan, Garnier & Co. ests.
Fig. 10: DCF, FV of EUR48 or downside risk of 21%
in EURm (FYE 31/12) 2016e 2017e 2018e 2019e 2020e 2021e 2022e 2023e 2024e 2025e
Revenues 453 495 536 605 675 744 808 867 917 958 Change (%) 13.3% 9.1% 8.4% 13.0% 11.5% 10.1% 8.7% 7.3% 5.8% 4.4%
Adjusted EBIT 111 123 133 151 168 185 200 214 227 236 Adjusted operating margin 24.6% 24.9% 24.9% 24.9% 24.9% 24.8% 24.8% 24.7% 24.7% 24.7%
Tax -16 -19 -20 -23 -25 -28 -30 -32 -34 -35
Tax rate 14.7% 15.0% 15.0% 15.0% 15.0% 15.0% 15.0% 15.0% 15.0% 15.0%
Net Operating income after tax 95 104 113 128 143 157 170 182 193 201
Capex, net -39 -45 -48 -54 -61 -67 -73 -78 -83 -86
As a % of sales 8.5% 9.0% 9.0% 9.0% 9.0% 9.0% 9.0% 9.0% 9.0% 9.0%
Depreciation & amortisation 28 32 35 54 61 67 73 78 83 86
As a % of sales 6.1% 6.5% 6.5% 9.0% 9.0% 9.0% 9.0% 9.0% 9.0% 9.0%
WCR 104 113 123 139 155 170 185 199 210 219
As a % of sales 23.0% 22.9% 22.9% 22.9% 22.9% 22.9% 22.9% 22.9% 22.9% 22.9%
Change in working capital -13 -9 -9 -16 -16 -16 -15 -13 -12 -9
Free cash flows 71 83 90 112 127 141 155 169 181 191
Discounted free cash flows 68 72 72 81 83 84 84 83 81 78
Total discounted FCF - 2016e-2025e 787 Discounted Terminal value - 2026e 1,101 Enterprise value 1,888 - Provision (incl. pension plan) 7 WACC
- Fair value minority interests 12 [in EUR] 9.0% 9.5% 10.0% 10.5% 11.0%
- Net debt on 31/12/2016e -59
Op.
mar
gin
23% 53 49 45 42 39
Equity value 1,928 24% 54 50 46 43 40
Nbr of diluted shares (m) 40.400 25% 56 52 48 44 41
Valuation per share (EUR) 48
26% 58 53 49 46 43
Upside vs. current share price -21% 27% 60 55 51 47 44
Source: Bryan, Garnier & Co.

r r
INDEPENDENT RESEARCH UPDATE Soitec 21st July 2016 Waiting for FD-SOI orders
TMT Fair Value EUR0.50 vs. EUR0.45 (price EUR0.75) NEUTRAL
Bloomberg SOI FP Reuters SOIT.PA 12-month High / Low (EUR) 0.8 / 0.4 Market capitalisation (EURm) 455 Enterprise Value (BG estimates EURm) 480 Avg. 6m daily volume ('000 shares) 1,342 Free Float 79.0% 3y EPS CAGR Gearing (03/16) NM Dividend yield (03/17e) NM
Following the two capital increases undertaken by Soitec during Q2 2016, the group is now in a far better position and boasts a stronger balance sheet. Soitec now only focuses on two products, SOI 200mm wafers (RF-SOI et Power-SOI) and SOI 300mm wafers (PD-SOI et FD-SOI). With stable demand for 200mm wafers, Soitec's challenge is now to convert the try with its new product, FD-SOI. While we consider this technology relevant and expect it to break through, we are waiting for further proof of its commercial take-off, which would genuinely boost Soitec's sales. We update our model to integrate changes in FX, as a result our FV is up from EUR0.45 to EUR0.50.
The electronics business now shows profitable growth. At the group's last publication in June, the accent was placed on profitability in the electronics division. Indeed, the group generated gross margin of 29% in its fiscal H2 2016 (FYE 31st March), compared with a bottom of gross margin of -1% in H2 2014. This was possible thanks to far higher volumes (virtually double) and the cost cutting strategy. The Bernin 1 plant that handles 200mm production is now running at full capacity (gross margin of 30-35%), whereas the Bernin 2 fab, handing 300mm wafers was only running at 25% on average over FY 2016. At full capacity, Bernin 2 should also generate gross margin of more than 30%.
The group has now rid itself of loss-making activities (solar and lighting), and its future depends on the success of FD-SOI. With the Bernin 1 fab now full, growth and margin improvement is primarily set to stem from the Bernin 2 plant, which has production capacity of 750k wafers. Some of this output is to be reserved for RF-SOI 300mm (around 200k-250k), and the rest should be allocated to production of FD-SOI wafers. This is an innovative technology enabling performance gains at a constant node, but it is also a new design and chip production method. This means that its success depends on the interest the industry has in adopting these wafers rather than extending the Moore's law. So far, things seem to be taking shape smoothly and the ecosystem is gradually falling into place. However, there is still nothing concrete in terms of orders and for this reason we remain cautious.
YE March 03/16 03/17e 03/18e 03/19e Revenue (EURm) 233.21 253.82 271.75 360.14 EBITA EURm) 22.4 26.6 31.5 36.5 Op.Margin (%) 9.6 10.5 11.6 10.1 Diluted EPS (EUR) -0.02 0.05 0.04 0.05 EV/Sales 2.68x 1.89x 1.63x 1.12x EV/EBITDA 17.2x 11.5x 8.6x 6.4x EV/EBITA 27.9x 18.0x 14.0x 11.1x P/E NS 15.7x 18.6x 16.7x ROCE 15.4 14.0 18.7 21.1
0.3
0.4
0.5
0.6
0.7
0.8
0.9
1.0
1.1
09/01/15 09/04/15 09/07/15 09/10/15 09/01/16 09/04/16 09/07/16
SOITEC SXX EUROPE 600
Analyst: Sector Analyst Team: Dorian Terral Richard-Maxime Beaudoux 33(0) 1.56.68.75.92 Thomas Coudry [email protected] Gregory Ramirez

Soitec
46
Simplified Profit & Loss Account (EURm) 31/03/14 31/03/15 31/03/16 31/03/17e 31/03/18e 31/03/19e Revenues 247 223 233 254 272 360 Change (%) -6.0% -9.8% 4.6% 8.8% 7.1% 32.5% Adjusted EBITDA -% -% -% -% -% -% Depreciation & amortisation 141 209 13.9 15.0 20.0 27.0 Adjusted EBIT (137) (126) 22.4 26.6 31.5 36.5 EBIT (220) (277) (7.0) 26.6 31.5 36.5 Change (%) -% -% -% -% 18.3% 15.9% Financial results (16.7) 19.7 (22.5) (6.3) (6.8) (9.0) Pre-Tax profits (236) (258) (29.6) 20.3 24.7 27.5 Exceptionals NM NM NM NM NM NM Tax 0.06 (0.22) (3.5) 0.0 0.0 0.0 Profits from associates (0.64) (1.4) (0.20) (0.20) (0.20) (0.20) Minority interests 0.33 0.0 0.0 0.0 0.0 0.0 Net profit (237) (258) (71.7) 20.1 24.5 27.3 Restated net profit (186) (108) (3.9) 20.1 24.5 27.3 Change (%) % -% -% -% 22.1% 11.4% Cash Flow Statement (EURm) Operating cash flows (39.1) (0.05) (12.5) 32.7 42.5 43.6 Change in working capital (99.8) 67.9 40.8 (2.5) (2.2) (10.9) Capex, net (44.8) (3.1) 14.8 (40.0) (5.0) (5.0) Financial investments, net (37.8) (15.5) 0.0 0.0 0.0 0.0 Dividends 0.0 0.0 0.0 0.0 0.0 0.0 Issuance of shares 67.9 83.7 0.0 152 0.0 0.0 Issuance of debt 131 23.7 64.7 (61.0) 0.0 0.0 Other (21.4) (102) (37.8) (50.0) 0.0 0.0 Net debt 212 150 170 25.3 (12.2) (50.9) Free Cash flow (184) (3.2) 2.3 (7.3) 37.5 38.6 Balance Sheet (€m) Tangible fixed assets 281 157 121 146 131 109 Intangibles assets & goodwill 35.1 47.4 39.3 39.3 39.3 39.3 Investments 8.9 1.3 1.4 1.4 1.4 1.4 Deferred tax assets 0.0 0.0 0.0 0.0 0.0 0.0 Current assets 186 0.0 0.0 0.0 0.0 0.0 Cash & equivalents 44.7 22.9 49.1 82.7 120 159 Total assets 585 228 210 269 292 308 Shareholders' equity 221 50.0 (7.1) 165 190 217 Provisions 18.4 17.5 30.5 30.5 30.5 30.5 Deferred tax liabilities 0.0 0.0 0.0 0.0 0.0 0.0 L & ST Debt 257 173 219 108 98.6 115 Current liabilities 88.9 153 82.7 86.5 89.7 106 Total Liabilities 585 394 325 390 409 468 Capital employed 433 200 163 190 168 173 Ratios Operating margin NM NM 9.59 10.49 11.59 10.14 Tax rate 0.03 (0.08) (11.83) 0.0 0.0 0.0 Net margin NM NM NM 6.62 9.02 7.58 ROE (after tax) (107) (516) 1,009 12.16 12.91 12.56 ROCE (after tax) (31.71) (62.97) 15.36 13.98 18.73 21.07 Gearing 96.21 300 NM NM (6.45) (23.41) Pay out ratio NM NM NM 0.0 NM 0.0 Number of shares, diluted 149 211 240 419 419 419 Data per Share (EUR) EPS (1.45) (1.23) (0.29) 0.08 0.10 0.11 Restated EPS (1.25) (0.51) (0.02) 0.05 0.04 0.05 % change 12.6% -61.7% -104% 202% -15.6% 11.5% EPS bef. GDW (1.25) (0.51) (0.02) 0.05 0.04 0.05 BVPS 1.48 0.24 (0.03) 0.39 0.45 0.52 Operating cash flows (0.26) (0.00) (0.05) 0.08 0.10 0.10 FCF (1.23) (0.02) 0.01 (0.02) 0.09 0.09 Net dividend 0.0 0.0 0.0 0.0 0.0 0.0
Source: Company Data; Bryan, Garnier & Co ests.
Company description Founded in 1992, and listed on Euronext Paris since 1999, Soitec is a specialist of high-performance semiconductor materials. The company develops proprietary technologies used to produce and sell wafers for the semiconductor industry, more particularly to produce Integrated Circuits . Soitec is the world leader on the SOI market with 80% of market share. Rencently, the group reinforced its balance sheet with two successive capital increases for a total amount of EUR150m. Now, the group's objective is to support the success of its new product, the FD-SOI.
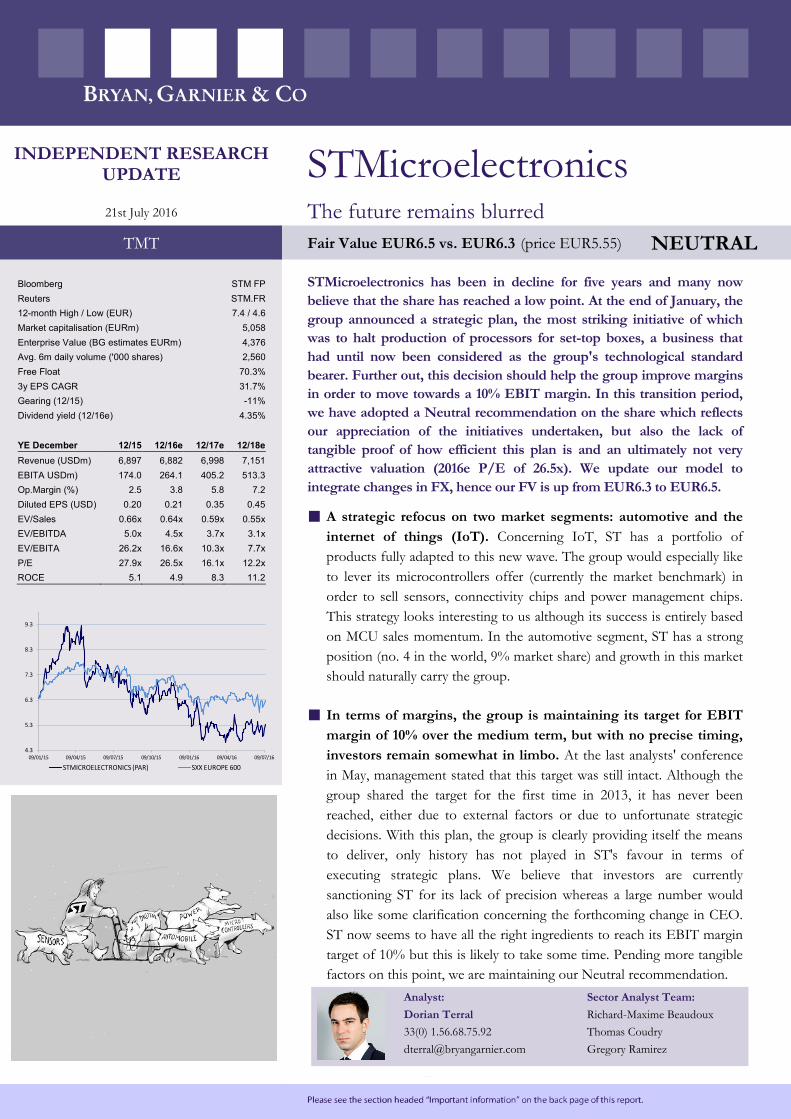
r r
INDEPENDENT RESEARCH UPDATE STMicroelectronics 21st July 2016 The future remains blurred
TMT Fair Value EUR6.5 vs. EUR6.3 (price EUR5.55) NEUTRAL
Bloomberg STM FP Reuters STM.FR 12-month High / Low (EUR) 7.4 / 4.6 Market capitalisation (EURm) 5,058 Enterprise Value (BG estimates EURm) 4,376 Avg. 6m daily volume ('000 shares) 2,560 Free Float 70.3% 3y EPS CAGR 31.7% Gearing (12/15) -11% Dividend yield (12/16e) 4.35%
STMicroelectronics has been in decline for five years and many now believe that the share has reached a low point. At the end of January, the group announced a strategic plan, the most striking initiative of which was to halt production of processors for set-top boxes, a business that had until now been considered as the group's technological standard bearer. Further out, this decision should help the group improve margins in order to move towards a 10% EBIT margin. In this transition period, we have adopted a Neutral recommendation on the share which reflects our appreciation of the initiatives undertaken, but also the lack of tangible proof of how efficient this plan is and an ultimately not very attractive valuation (2016e P/E of 26.5x). We update our model to integrate changes in FX, hence our FV is up from EUR6.3 to EUR6.5.
A strategic refocus on two market segments: automotive and the internet of things (IoT). Concerning IoT, ST has a portfolio of products fully adapted to this new wave. The group would especially like to lever its microcontrollers offer (currently the market benchmark) in order to sell sensors, connectivity chips and power management chips. This strategy looks interesting to us although its success is entirely based on MCU sales momentum. In the automotive segment, ST has a strong position (no. 4 in the world, 9% market share) and growth in this market should naturally carry the group.
In terms of margins, the group is maintaining its target for EBIT margin of 10% over the medium term, but with no precise timing, investors remain somewhat in limbo. At the last analysts' conference in May, management stated that this target was still intact. Although the group shared the target for the first time in 2013, it has never been reached, either due to external factors or due to unfortunate strategic decisions. With this plan, the group is clearly providing itself the means to deliver, only history has not played in ST's favour in terms of executing strategic plans. We believe that investors are currently sanctioning ST for its lack of precision whereas a large number would also like some clarification concerning the forthcoming change in CEO. ST now seems to have all the right ingredients to reach its EBIT margin target of 10% but this is likely to take some time. Pending more tangible factors on this point, we are maintaining our Neutral recommendation.
YE December 12/15 12/16e 12/17e 12/18e Revenue (USDm) 6,897 6,882 6,998 7,151 EBITA USDm) 174.0 264.1 405.2 513.3 Op.Margin (%) 2.5 3.8 5.8 7.2 Diluted EPS (USD) 0.20 0.21 0.35 0.45 EV/Sales 0.66x 0.64x 0.59x 0.55x EV/EBITDA 5.0x 4.5x 3.7x 3.1x EV/EBITA 26.2x 16.6x 10.3x 7.7x P/E 27.9x 26.5x 16.1x 12.2x ROCE 5.1 4.9 8.3 11.2
4.3
5.3
6.3
7.3
8.3
9.3
09/01/15 09/04/15 09/07/15 09/10/15 09/01/16 09/04/16 09/07/16
STMICROELECTRONICS (PAR) SXX EUROPE 600
Analyst: Sector Analyst Team: Dorian Terral Richard-Maxime Beaudoux 33(0) 1.56.68.75.92 Thomas Coudry [email protected] Gregory Ramirez

STMicroelectronics
48
Simplified Profit & Loss Account (USDm) 31/12/13 31/12/14 31/12/15 31/12/16e 31/12/17e 31/12/18e Revenues 8,082 7,404 6,897 6,882 6,998 7,151 Change (%) -4.8% -8.4% -6.8% -0.2% 1.7% 2.2% EBITDA -% -% -% -% -% -% Depreciation & amortisation 910 812 736 716 728 744 Adjusted EBIT (409) 182 174 264 405 513 EBIT (465) 168 109 264 405 513 Change (%) -% -% -4.2% 51.7% 53.6% 26.7% Financial results (5.0) (19.2) (22.0) (16.5) (16.8) (17.2) Pre-Tax profits (470) 149 87.0 248 388 496 Tax (37.0) 23.0 21.0 (66.3) (86.7) (103) Profits from associates (122) (43.0) 2.0 3.1 3.2 3.2 Minority interests 129 (0.60) (6.0) 0.0 0.0 0.0 Net profit (500) 128 104 184 305 397 Restated net profit (573) 143 175 184 305 397 Change (%) -% -% 22.4% 5.4% 65.3% 30.1% Cash Flow Statement (USDm) Operating cash flows 333 791 846 900 1,033 1,140 Change in working capital 33.0 (76.0) (122) 12.8 (30.1) (39.4) Capex, net (531) (505) (467) (516) (525) (536) Financial investments, net 96.0 (341) 0.0 0.0 0.0 0.0 Dividends (350) (357) (350) (211) (265) (349) Issuance of shares 0.0 1.0 0.0 0.0 0.0 0.0 Issuance (repayment) of debt (34.0) 774 0.0 0.0 0.0 0.0 Other (17.0) (168) (13.0) 2.0 0.0 0.0 Net debt (741) (546) (494) (682) (895) (1,110) Free Cash flow (165) 210 257 397 478 564 Balance Sheet (USDm) Tangible fixed assets 3,156 2,647 2,321 2,121 1,918 1,711 Intangibles assets & goodwill 307 275 242 242 242 242 Investments 676 649 516 516 516 516 Deferred tax assets 227 386 436 436 436 436 Current assets 2,913 2,700 2,570 2,565 2,606 2,661 Cash & equivalents 1,894 2,351 2,106 2,294 2,507 2,722 Total assets 9,173 9,008 8,191 8,174 8,225 8,288 Shareholders' equity 5,717 5,055 4,693 4,667 4,706 4,754 Provisions 524 574 509 509 509 509 Deferred tax liabilities 11.0 10.0 12.0 12.0 12.0 12.0 L & ST Debt 1,153 1,805 1,612 1,612 1,612 1,612 Current liabilities 1,768 1,564 1,365 1,372 1,384 1,400 Total Liabilities 9,173 9,008 8,191 8,174 8,225 8,288 Capital employed 4,976 4,509 4,199 3,985 3,812 3,644 Ratios Operating margin (5.06) 2.45 2.52 3.84 5.79 7.18 Tax rate 6.25 21.80 0.30 (26.45) (22.15) (20.61) Net margin (7.09) 1.92 2.54 2.68 4.36 5.54 ROE (after tax) (8.75) 2.54 2.22 3.95 6.48 8.34 ROCE (after tax) (8.87) 4.65 5.14 4.85 8.26 11.17 Gearing (12.96) (10.80) (10.53) (14.61) (19.01) (23.35) Pay out ratio NM 287 336 115 87.47 86.98 Number of shares, diluted 890 882 873 879 884 884 Data per Share (USD) EPS (0.56) 0.14 0.12 0.21 0.35 0.45 Restated EPS (0.64) 0.16 0.20 0.21 0.35 0.45 % change -% -% 23.7% 5.6% 64.4% 31.6% EPS bef. GDW (0.64) 0.16 0.20 0.21 0.35 0.45 BVPS 6.43 5.73 5.37 5.31 5.33 5.38 Operating cash flows 0.37 0.90 0.97 1.02 1.17 1.29 FCF (0.19) 0.24 0.29 0.45 0.54 0.64 Net dividend 0.40 0.40 0.40 0.24 0.30 0.39
Source: Company Data; Bryan, Garnier & Co ests.
Company description STMicroelectronics is a Franco-Italian manufacturer of semiconductors. The group has a broad product portfolio that spans from power management components to integrated circuits for industrial sector, automotive and consumer applications. Declining for several years, the group currently executes a transformation plan to restore growth and positive margins.
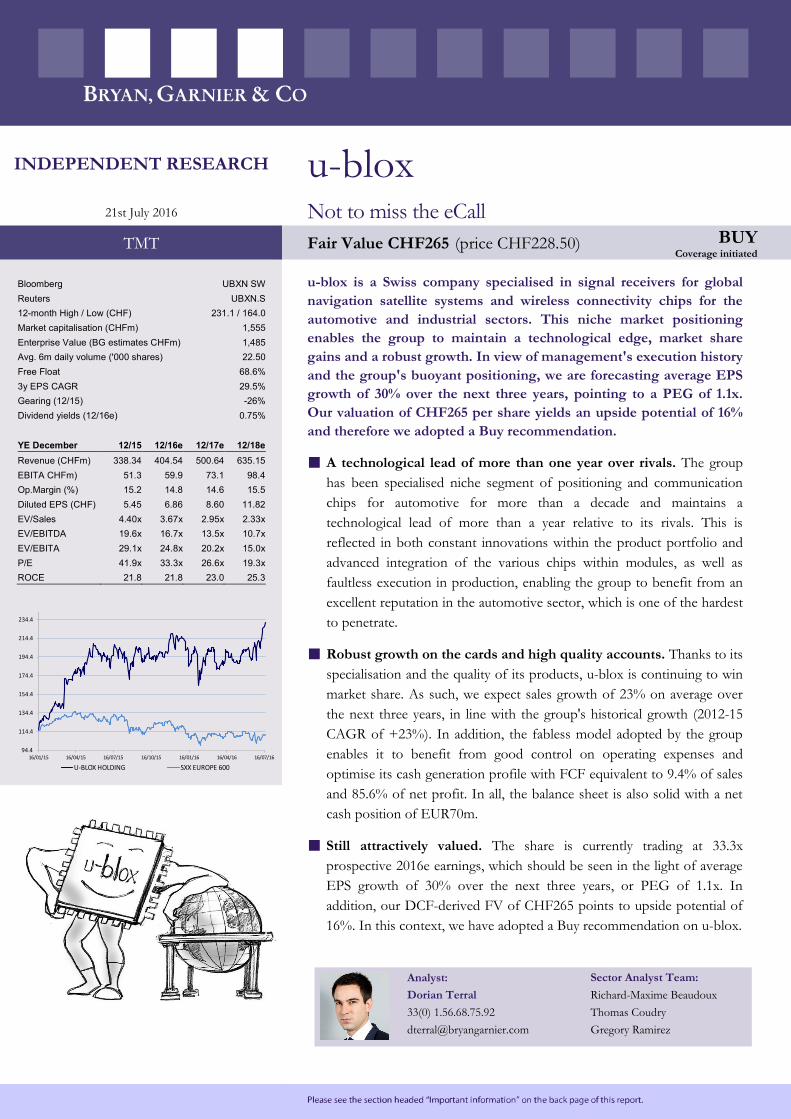
r r
INDEPENDENT RESEARCH u-blox 21st July 2016 Not to miss the eCall
TMT Fair Value CHF265 (price CHF228.50) BUY Coverage initiated
Bloomberg UBXN SW Reuters UBXN.S 12-month High / Low (CHF) 231.1 / 164.0 Market capitalisation (CHFm) 1,555 Enterprise Value (BG estimates CHFm) 1,485 Avg. 6m daily volume ('000 shares) 22.50 Free Float 68.6% 3y EPS CAGR 29.5% Gearing (12/15) -26% Dividend yields (12/16e) 0.75%
u-blox is a Swiss company specialised in signal receivers for global navigation satellite systems and wireless connectivity chips for the automotive and industrial sectors. This niche market positioning enables the group to maintain a technological edge, market share gains and a robust growth. In view of management's execution history and the group's buoyant positioning, we are forecasting average EPS growth of 30% over the next three years, pointing to a PEG of 1.1x. Our valuation of CHF265 per share yields an upside potential of 16% and therefore we adopted a Buy recommendation.
A technological lead of more than one year over rivals. The group has been specialised niche segment of positioning and communication chips for automotive for more than a decade and maintains a technological lead of more than a year relative to its rivals. This is reflected in both constant innovations within the product portfolio and advanced integration of the various chips within modules, as well as faultless execution in production, enabling the group to benefit from an excellent reputation in the automotive sector, which is one of the hardest to penetrate.
Robust growth on the cards and high quality accounts. Thanks to its specialisation and the quality of its products, u-blox is continuing to win market share. As such, we expect sales growth of 23% on average over the next three years, in line with the group's historical growth (2012-15 CAGR of +23%). In addition, the fabless model adopted by the group enables it to benefit from good control on operating expenses and optimise its cash generation profile with FCF equivalent to 9.4% of sales and 85.6% of net profit. In all, the balance sheet is also solid with a net cash position of EUR70m.
Still attractively valued. The share is currently trading at 33.3x prospective 2016e earnings, which should be seen in the light of average EPS growth of 30% over the next three years, or PEG of 1.1x. In addition, our DCF-derived FV of CHF265 points to upside potential of 16%. In this context, we have adopted a Buy recommendation on u-blox.
YE December 12/15 12/16e 12/17e 12/18e Revenue (CHFm) 338.34 404.54 500.64 635.15 EBITA CHFm) 51.3 59.9 73.1 98.4 Op.Margin (%) 15.2 14.8 14.6 15.5 Diluted EPS (CHF) 5.45 6.86 8.60 11.82 EV/Sales 4.40x 3.67x 2.95x 2.33x EV/EBITDA 19.6x 16.7x 13.5x 10.7x EV/EBITA 29.1x 24.8x 20.2x 15.0x P/E 41.9x 33.3x 26.6x 19.3x ROCE 21.8 21.8 23.0 25.3
94.4
114.4
134.4
154.4
174.4
194.4
214.4
234.4
16/01/15 16/04/15 16/07/15 16/10/15 16/01/16 16/04/16 16/07/16
U-BLOX HOLDING SXX EUROPE 600
Analyst: Sector Analyst Team: Dorian Terral Richard-Maxime Beaudoux 33(0) 1.56.68.75.92 Thomas Coudry [email protected] Gregory Ramirez

u-blox
50
Simplified Profit & Loss Account (CHFm) 31/12/13 31/12/14 31/12/15 31/12/16e 31/12/17e 31/12/18e Revenues 220 270 338 405 501 635 Change (%) 27.0% 22.9% 25.3% 19.6% 23.8% 26.9% Adjusted EBITDA 46.2 58.6 76.0 89.0 110 138 Adjusted EBIT 30.1 39.1 51.3 59.9 73.1 98.4 EBIT 30.1 39.1 51.3 59.9 73.1 98.4 Change (%) 30.4% 30.0% 31.3% 16.7% 22.1% 34.7% Financial results (1.2) 3.9 (3.7) 0.40 1.5 4.1 Pre-Tax profits 28.9 43.0 47.6 60.3 74.6 103 Tax (4.2) (8.6) (10.5) (13.6) (16.0) (22.1) Net profit 24.6 34.4 37.1 46.7 58.6 80.5 Adjusted net profit 24.6 34.4 37.1 46.7 58.6 80.5 Change (%) 43.2% 39.6% 7.9% 25.9% 25.4% 37.5% Cash Flow Statement (CHFm) Depreciation & amortisation 16.1 19.5 24.7 29.1 36.5 39.4 Change in working capital (6.6) (2.1) (4.9) (7.6) (11.1) (15.5) Operating cash flows 38.5 53.7 74.7 67.8 82.5 100 Capex, net (33.7) (33.6) (42.9) (50.6) (62.6) (79.4) Free Cash flow 4.8 20.1 31.7 17.2 20.0 20.9 Acquisition, net 0.0 (37.6) (0.36) 0.0 0.0 0.0 Financial investments, net 0.05 5.8 9.9 0.0 0.0 0.0 Dividends (6.4) (8.5) (10.7) (11.7) (14.6) (20.1) Issuance (repurchase) of own shares 4.9 3.6 5.3 0.0 0.0 0.0 Issuance (repayment) of debt (3.3) 19.9 40.0 0.0 0.0 0.0 Other 2.7 (24.4) (50.5) 0.0 0.0 0.0 Net debt (60.6) (39.4) (64.8) (70.3) (75.6) (76.4) Balance Sheet (CHFm) Tangible fixed assets 13.8 14.8 14.7 (4.3) (28.3) (51.8) Intangibles assets & goodwill 82.4 128 145 185 235 299 Investments 1.2 0.58 0.68 0.68 0.68 0.68 Deferred tax assets 6.8 4.8 6.9 6.9 6.9 6.9 Other non-current assets 0.0 0.0 0.0 0.0 0.0 0.0 Cash & equivalents 60.6 59.4 124 130 135 136 Inventories 22.7 33.3 37.4 44.7 55.3 70.1 Current assets 39.1 60.4 58.4 68.7 83.7 105 Total assets 227 302 387 431 488 565 Shareholders' equity 180 213 248 283 325 382 Provisions 6.1 13.4 17.9 21.4 26.5 33.7 Deferred tax liabilities 4.6 5.8 6.1 6.1 6.1 6.1 Current liabilities 35.4 49.7 55.2 61.7 71.1 84.3 L & ST Debt 0.0 20.0 59.3 59.3 59.3 59.3 Total Liabilities 227 302 387 431 488 565 Capital employed 120 173 184 213 250 305 Ratios Gross margin 46.02 45.45 45.82 44.80 44.60 44.50 Adjusted operating margin 13.67 14.47 15.16 14.80 14.60 15.50 Tax rate 14.64 19.94 22.08 22.50 21.50 21.50 Adjusted Net margin 11.21 12.74 10.96 11.55 11.70 12.68 ROE (after tax) 13.66 16.16 14.94 16.51 18.00 21.10 ROCE (after tax) 21.40 18.03 21.77 21.82 22.98 25.32 Gearing (33.56) (18.50) (26.08) (24.85) (23.25) (20.02) Pay out ratio 25.15 23.65 27.61 23.97 23.97 23.97 Number of shares, diluted 6.57 6.81 6.81 6.81 6.81 6.81 Data per Share (CHF) EPS 3.86 5.27 5.68 7.15 8.97 12.33 Restated EPS 3.75 5.05 5.45 6.86 8.60 11.82 % change 37.9% 34.6% 7.9% 25.9% 25.4% 37.5% BVPS 27.48 31.26 36.46 41.55 47.78 56.04 Operating cash flows 5.86 7.88 10.96 9.96 12.12 14.73 FCF 0.73 2.95 4.66 2.53 2.93 3.07 Net dividend 0.97 1.25 1.57 1.71 2.15 2.96
Source: Company Data; Bryan, Garnier & Co ests.
Company description u-blox is a swiss company, provider of wireless and positioning semiconductors and modules for the automotive, industrial and consumer markets. The group holds a strong position in the positioning market, alongside with big names such as Qualcomm and Broadcomm and continues to gain market shares. The strong momentum allowed to group to generate an average EPS growth of 22% over the 5 last years.
u-blox
51
Table of contents
1. Investment Case ........................................................................................................................................ 52
2. Group snapshot ........................................................................................................................................ 53
2.1. A niche player: positioning & wireless .......................................................................... 53
2.2. An M&A culture ............................................................................................................... 54
3. No slowdown in sight .............................................................................................................................. 55
3.1. eCall, an underestimated catalyst .................................................................................... 55
3.2. The group is also providing itself the means to grow ................................................ 57
4. Our scenario .............................................................................................................................................. 58
4.1. P&L: 30% average growth in 2015/18e EPS............................................................... 58
4.2. The group aims to maintain a positive FCF ................................................................. 59
5. Upside potential of 16% .......................................................................................................................... 60
Bryan Garnier stock rating system............................................................................................................... 62

u-blox
52
1. Investment Case
The reason for writing now u-blox is little known to investors although it is a very interesting player in our view. We believe that 1/ consensus expectations are overly cautious in view of market prospects and the group's historical performances and 2/ its still-attractive valuation is an opportunity to grasp (our FV points to an upside potential of 16%). We are initiating u-blox with a Buy recommendation
Valuation Our Fair Value of CHF265 stems from a DCF valuation (WACC of 10.0%). Based on our estimates, the share is trading on 2016e EV/EBIT of 24.8x and 2016e P/E of 33.3x. These are ratios that must be put in relation to a strong growth in EPS (CAGR 2015/2018e on EPS of 30%) externalizing a PEG of 1.1x.
Catalysts u-blox is active in a rapidly expanding niche market. Growth is driven by changes in vehicle production volumes and the constantly rising adoption of communication and positioning systems (CAGR 2015/2018e de 9.4%). It also benefits from opportunities created by regulations obliging carmakers to equip their models with eCall systems as of 2018, volumes of which are estimated at 20m units out to 2020, or a 2015/2018e CAGR of 55% in these products.
Difference from consensus At present, the consensus has factored in average sales growth of 19.6% over 2015/2018e showing a slowdown relative to the performance of +22.5% reached over the past three years. We believe the group is capable of fully benefiting from market opportunities (see Catalysts) and its positioning to generate growth equivalent to its historical levels at least. As such, our EPS estimates are on average 7.9% ahead of the consensus figures.
Risks to our investment case Despite u-blox business being particularly robust thanks to a high diversification (customer base + geography), the group is active in a market that is particularly sensitive to macro-economic momentum and this could have a positive or negative impact on our estimates. Given the attractive growth levels boasted by the group's market, other players with larger R&D capabilities could destabilise u-blox' dominant position and take a negative toll on 1/ volumes and 2/ prices.

u-blox
53
2. Group snapshot 2.1. A niche player: positioning & wireless u-blox is a Swiss group that primarily manufactures chips and modules for connectivity and satellite positioning. The group was created at the end of the 1990s, with the aim of capturing the emerging opportunity in the global navigation satellite system (GNSS) signal receivers market. During the 2000s, the group therefore managed to benefit from its advantage as the first-entrant to become the market leader whereas this type of chip consumption was in full swing. Strengthened by this success, the group then developed a 2G/3G connectivity module business functioning alongside positioning chips. Today, the flagship application of u-blox modules is management of company vehicle fleets and the black boxes distributed by insurance companies in a number of countries.
The company's sales are divided into two segments: Positioning & Wireless Modules and Wireless Services, although virtually all sales in the Wireless Services segment are booked as intra-group transactions and its weight in consolidated sales stands at only 0.1%. By market, u-blox is primarily exposed to the industrial segment (58% of 2015 sales), the automotive sector (27% of sales) and to a lesser extent the consumer electronics market (15% of sales).
Fig. 1: The automotive market is more dominant than it looks in figures
Industry Consumer Automotive
% o
f sal
es
Rev
enue
m
omen
tum
CAGR 2012/2015: +23%
CAGR 2012/2015: +28%
CAGR 2012/2015: +29%
Key
pro
duct
s - GNSS and wireless modules for vehicle tracking (fleet management)
- GNSS chips for Marine - GNSS and wireless modules for
Agriculture
- GNSS chips for cameras - GNSS and wireless module for
people tracking - GNSS chips for personal nav devices
- GNSS modules for navigation systems
- GNSS and wireless modules for anti-theft systems
- Wireless chips for safety features
Key
cu
stom
ers
(exa
mpl
es)
- CalAmp - Huawei
- Raymarine - Ingenico
- Samsung - Fujitsu - Sony
- TomTom
- Bosch - Harman Becker
- Coagent
Key
ca
taly
sts - Macroeconomic environment
- Automobile sales - Industrial momentum
- Consumer market momentum - Design win in flagship products
- Macroeconomic environment - Automobile production
- Design win in high volume models
Com
petit
ors
- IP: Qualcomm (incl. CSR), Broadcom - Chips: Qualcomm (incl. CSR), Broadcom, MediaTek, STMicroelectronics
- Modules: Trimble and Asian local assemblers for GNSS ; Telit, Cinterion, Sierra, SIM and Asian assemblers for Wireless
Source: Bryan, Garnier & Co.
58%15%
27%
0
50
100
150
200
FY13 FY14 FY150
25
50
75
100
FY13 FY14 FY150
25
50
75
100
FY13 FY14 FY15
The group was created at the end of the 1990s, with the aim of capturing the emerging opportunity in the global navigation satellite system (GNSS) signal receivers market.
u-blox
54
However, in addition to these official figures, we would add that sales of electronic modules for vehicle positioning are recorded in the Industry category. If we include sales of vehicle positioning modules in the automotive sector, we estimate that more than 75% of the group's sales are exposed to the automotive market.
Like Melexis and Dialog in Europe, nVidia and Qualcomm in the US, u-blox operates a fabless model (i.e. with no plant) outsourcing its production and focusing on developing chips and modules. Front-end manufacturing (wafer-level production) is outsourced to GlobalFoundries and TSMC, while the back end (IC packaging and testing) is operated by Amkor and assembly of the end modules is undertaken by Flextronics and Inventec.
In view of its niche market positioning, u-blox is fairly well protected from price wars and hence the price pressure generally noted in the semi-conductors industry. According to the latest market survey by ABI Research in December 2015, Qualcomm is still the dominant player in positioning with its IZat platform, while Broadcom, recently acquired by Avago, is the market no. 2 with its HULA technology. u-blox took the no. 3 spot in 2015 thanks to its technological lead, leaving MediaTek in fourth place. The Asian group suffered from an ageing product catalogue although the group enjoyed significant design wins, especially with Fitbit. STMicroelectronics and its TESEO platform completes this Top 5.
2.2. An M&A culture Cellular expertise built on M&A activity. Since the company was created in 1997, the group
has built its expertise organically. However, following its flotation on the Swiss SIX stockmarket in 2007, the group has made a series of small acquisitions in order to step up its expansion. The first acquisition was made in 2009 and concerned Italian group NeonSeven (for CHF28.6m). The acquisition helped provide the group cellular expertise, especially in 2G/3G modules. In 2011, the group strengthened this know-how by acquiring Fusion Wireless (CHF1m) specialised in CDMA modules. The following year, Cognovo (CHF15.8m) and 4M Wireless (CHF8.6m) were targeted by the group thereby further rounding out the group's cellular know-how, but this time in 4G/LTE. In 2014, M&A activity resumed with the acquisition of connectBlue (CHF25m) and antcor (CHF6.3m), specialised respectively in Bluetooth/Wi-Fi and Wi-Fi intellectual property, providing the group short-range radio link technologies. These acquisitions were then bolstered in 2015 by the addition of Lesswire.
Historical know-how also strengthened by strategic acquisitions. In order to ensure that innovation is maintained at a buoyant pace, the group has also been quick to acquire small players established in its historical core business of positioning. In 2009, the group acquired Geotate (CHF8.3m), specialised in GPS technology software, and then in 2010, Air Semi assets were purchased for an undisclosed amount. Finally, in 2012, u-blox bought Finnish group Fastrax (CHF15.7m), whose know-how in antennas rounded out the group's expertise in modules.
For of all of these acquisitions, the group's track record in terms of integration has been particularly good. So far, u-blox has not needed to book impairment charges and the few adjustments the group has had to make to goodwill have always been due to forex.
If we include sales of vehicle positioning modules in the automotive sector, we estimate that more than 75% of the group's sales are exposed to the automotive market.
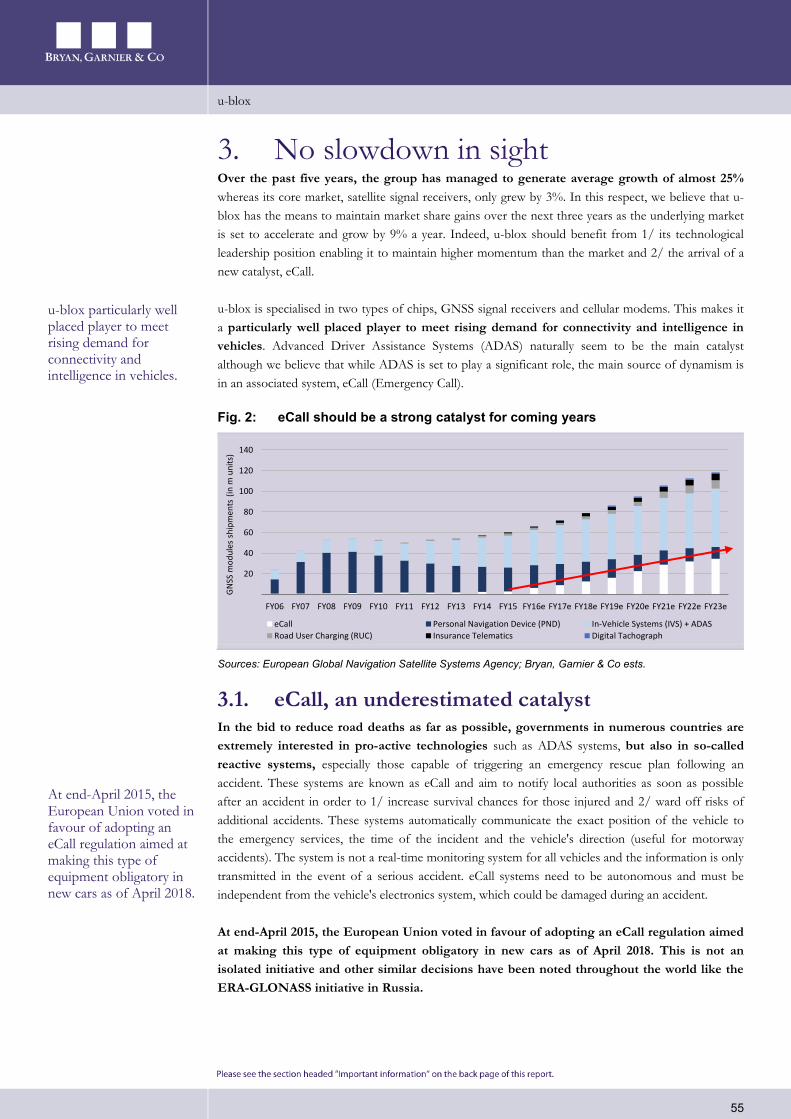
u-blox
55
3. No slowdown in sight Over the past five years, the group has managed to generate average growth of almost 25% whereas its core market, satellite signal receivers, only grew by 3%. In this respect, we believe that u-blox has the means to maintain market share gains over the next three years as the underlying market is set to accelerate and grow by 9% a year. Indeed, u-blox should benefit from 1/ its technological leadership position enabling it to maintain higher momentum than the market and 2/ the arrival of a new catalyst, eCall.
u-blox is specialised in two types of chips, GNSS signal receivers and cellular modems. This makes it a particularly well placed player to meet rising demand for connectivity and intelligence in vehicles. Advanced Driver Assistance Systems (ADAS) naturally seem to be the main catalyst although we believe that while ADAS is set to play a significant role, the main source of dynamism is in an associated system, eCall (Emergency Call).
Fig. 2: eCall should be a strong catalyst for coming years
Sources: European Global Navigation Satellite Systems Agency; Bryan, Garnier & Co ests.
3.1. eCall, an underestimated catalyst In the bid to reduce road deaths as far as possible, governments in numerous countries are extremely interested in pro-active technologies such as ADAS systems, but also in so-called reactive systems, especially those capable of triggering an emergency rescue plan following an accident. These systems are known as eCall and aim to notify local authorities as soon as possible after an accident in order to 1/ increase survival chances for those injured and 2/ ward off risks of additional accidents. These systems automatically communicate the exact position of the vehicle to the emergency services, the time of the incident and the vehicle's direction (useful for motorway accidents). The system is not a real-time monitoring system for all vehicles and the information is only transmitted in the event of a serious accident. eCall systems need to be autonomous and must be independent from the vehicle's electronics system, which could be damaged during an accident.
At end-April 2015, the European Union voted in favour of adopting an eCall regulation aimed at making this type of equipment obligatory in new cars as of April 2018. This is not an isolated initiative and other similar decisions have been noted throughout the world like the ERA-GLONASS initiative in Russia.
20
40
60
80
100
120
140
FY06 FY07 FY08 FY09 FY10 FY11 FY12 FY13 FY14 FY15 FY16e FY17e FY18e FY19e FY20e FY21e FY22e FY23e
GN
SS m
odul
es s
hipm
ents
(in
m u
nits
)
eCall Personal Navigation Device (PND) In-Vehicle Systems (IVS) + ADASRoad User Charging (RUC) Insurance Telematics Digital Tachograph
u-blox particularly well placed player to meet rising demand for connectivity and intelligence in vehicles.
At end-April 2015, the European Union voted in favour of adopting an eCall regulation aimed at making this type of equipment obligatory in new cars as of April 2018.

u-blox
56
Fig. 3: Average growth in demand of 9% in coming years in the automotive segment thanks to ADAS systems (+10%) and eCall (+62%)
Application CAGR 2012/2015 CAGR 2015/2018e
Personal Navigation Device (PND) -6.4% -6.1%
In-Vehicle Systems (IVS) + ADAS +12.1% +9.9%
Road User Charging (RUC) +20.9% +9.3%
Insurance Telematics n.s. n.s.
eCall +18.6% +61.8%
Digital Tachograph n.s. n.s.
Total shipments +4.2% +9.4%
Sources: European Global Navigation Satellite Systems Agency; Bryan, Garnier & Co ests.
As such, while growth in volumes of GNSS signal receivers is only estimated at 9% on average, segments in which u-blox is positioned offer particularly encouraging prospects. According to the European Global Navigation Satellite Systems Agency (EGNSSA), the global market in eCall equipment represented around EUR0.7bn in 2015 and the agency is expecting it to multiply in size by 8.6x by 2020 to EUR6bn, with average growth of 43% over the period. We would nevertheless note that these value estimates are based on estimated selling prices of eCall devices (and not those of the chips used). The devices could embed other components and have a different price trend to the components they include.
Another way of estimating more precisely the opportunity created by eCall systems is to focus on estimated volumes of vehicle sales in Europe, or around 18m by 2020. By this date, all vehicles on the market should have an embedded eCall system and the EGNSSA anticipates eCall system volumes of 23m units (vs. around 3m units in 2015). Bearing in mind that Europe is not the only region to put this type of initiative in place, the EGNSSA forecast seems coherent (18m units for Europe and 5m units for the rest of the world).
As such, based on average selling prices for an u-blox GNSS+LTE module of just above CHF10 in 2015, to which we have applied a 4% annual decline out to 2020e (bearing in mind that ASPs have remained virtually stable at u-blox for the past five years), we forecast an incremental market opportunity of around USD190m out to 2020.
Fig. 4: An incremental opportunity of around USD190m out to 2020e 2014 2015 2016e 2017e 2018e 2019e 2020e Volumes of eCall Systems 2.5 3.0 6.3 9.0 12.7 16.2 22.5 ASP (in USD) 10.94 10.40 9.98 9.53 9.15 8.79 8.43
Market size 27.4 31.2 62.9 85.8 116.2 142.3 189.8 u-blox market share 30% 30% 30% 30% 30% 30% 30%
u-blox opportunity 8.2 9.4 18.9 25.7 34.9 42.7 56.9 yoy change 14.1% 101.5% 36.4% 35.5% 22.5% 33.3%
Sources: European Global Navigation Satellite Systems Agency; Bryan, Garnier & Co ests.
We estimate that the group currently generates less than CHF10m in eCall system modules and are forecasting sales of around CHF35m out to 2018, or 6.5% of total group sales (around 30% market share).
We forecast an incremental market opportunity of around USD190m out to 2020.

u-blox
57
3.2. The group is also providing itself the means to grow
Beyond eCall systems, we believe the group is capable of maintaining strong growth in other segments in which it is positioned, in particular thanks to market share gains. Indeed, while u-blox has managed to win market share in the past, this success has stemmed from both its R&D and its proximity with clients. Since it is a specialist and precursor in the niche market of GNSS and wireless modules for the automotive sector, the group has managed to create solid positions up against major names such as Qualcomm, Broadcom, MediaTek and STMicroelectronics and we believe that it is capable of maintaining this momentum.
In terms of R&D, CHF65m was invested in new system development in 2015, or 19% of sales (vs 18% on average between 2010 and 2014). This is a high proportion for the industry and is a reminder of the R&D investment levels seen at STMicroelectronics (as a percentage of sales), but the group makes up for this by:
1/ very well controlled general, sales and marketing expenses (sales & marketing: 8% of sales, general & administrative expenses: 4%)
2/ a high gross margin since u-blox benefits from high entry barriers in the automotive market (and hence constant pressure on prices) and outsources production to major foundries enabling it to pool fixed costs for fabs as far as possible while maintaining significant room to manoeuvre in volumes.
This technological lead is found in u-blox's product portfolio. A recent example is the new NEO-M8U positioning model, which is an untethered dead reckoning navigation system. The module works by using data generated by a positioning chip and an inertial sensor (gyro/accelerometer) enabling it to 1/ improve positioning accuracy, 2/ position objects in dense areas, tunnels or other environments that deteriorate satellite signals and 3/ significantly improve positioning reactivity (especially during clear accelerations). The innovation in this model lies above all in its ability to function autonomously, thereby enabling a fully independent positioning (vs. a positioning that requires and uses information stemming from other car components in order to gather speed data supplied by the car itself).
For clients, another major advantage of u-blox systems is that they are interoperable between generations. As such, a motherboard compatible with a 2G/3G & GPS u-blox module in generation N will also be compatible with a 3G/4G & GPS/GLONASS u-blox module in generation N+1. This is a significant competitive advantage since it enables systems engineers not to have to rethink and redesign the electronics cards in order to evolve their systems but to just change the wireless and GNSS module.
Finally, the group's proximity with its clients is also a clear commercial asset. In an environment where only major clients count, u-blox is a supplier, which in view of its size, cannot allow itself to categorise its clients. As such, if clients such as CalAmp, Raymarine, Ingenico and Coagent can be categorised as small for a player such as Qualcomm (relative to Apple for example), they ultimately have access to more sales and technical resources at u-blox.
A technological lead is found in u-blox's product portfolio.
For clients, another major advantage of u-blox systems is that they are interoperable between generations.
Finally, the group's proximity with its clients is also a clear commercial asset.

u-blox
58
4. Our scenario 4.1. P&L: 30% average growth in 2015/18e EPS In view of its practices, u-blox has built up genuine recognition within the industry. With high-quality products, client-focused sales practices and a spotlight on technological innovation, we believe the group has all the keys necessary for continuing to grow above its market. Our model points to average 2015/18e sales growth of 23% based on stable ASP thanks to favourable mix effect (like change in ASP over the past five years at u-blox).
We are also forecasting a slight margin widening (16% EBIT margin in 2018e vs. 15% in 2015). Indeed, we believe that the group should be capable of making the most of additional volumes, especially in terms of operating expenses, to gradually improve its margin rate.
Fig. 5: Forecast for average growth in 2015/18e EPS of 30% [in CHFm] 2015 1H16e 2H16e 2016e 2017e 2018e CAGR 15/18e Sales 338 194 210 405 501 635 23.4%
Seq. growth 25% 10% 8% 20% 24% 27%
Gross profit 155 87 94 181 223 283 Gross margin 46% 45% 45% 45% 45% 45%
R&D -65 -36 -43 -75 -91 -111 % of sales -19% -19% -21% -19% -18% -18%
G&A -14 -8 -10 -17 -21 -26 % of sales -4% -4% -5% -4% -4% -4%
S&M -28 -16 -17 -33 -43 -52 % of sales -8% -8% -8% -8% -9% -8%
EBIT 51 29 35 60 73 98 24.3% Operating margin 15% 15% 15% 15% 15% 16%
Financial result -4 0 1 0 2 4 % of sales -1% 0% 0% 0% 0% 1%
Income Tax -11 -7 -8 -14 -16 -22 Income tax rate -22% -23% -23% -23% -22% -22%
Net Profit 37 22 24 47 59 81 29.5% Net margin 11% 12% 12% 12% 12% 13%
Dil. EPS 5.45 3.29 3.57 6.86 8.60 11.82 29.5% EPS seq. growth 8% 1% 8% 26% 25% 38%
Source: Bryan, Garnier & Co ests.

u-blox
59
4.2. The group aims to maintain a positive FCF While the group aims to maximize R&D efforts, we note that u-blox focuses on maintaining a positive FCF. In our model, the cash generation is limited (FCF Yield 2016th 1.2%) but the group keeps a comfortable net cash position of EUR76m estimated for 2018e (2018e gearing of -20%).
Fig. 6: Fragile cash generation… [in CHFm] 2015 1H16e 2H16e 2016e 2017e 2018e CAGR 15/18e EBITDA 76 15 16 89 110 138 Change in WCR -5 -4 -4 -8 -11 -15 Other 4 21 23 -14 -16 -22
Cash flow from operating activities 75 32 36 68 83 100
Capex -43 -24 -26 -51 -63 -79
Free Cash Flow 32 8 9 17 20 21 -13.0% Acquisitions 0 0 0 0 0 0 Other 10 0 0 0 0 0
Cash flow used for investing activities -33 -24 -26 -51 -63 -79
Proceeds of LT & ST debt 60 0 0 0 0 0 Repayment of LT & ST debt -20 0 0 0 0 0 Dividend payment -11 -6 -6 -12 -15 -20 Other -16 0 0 0 0 0
Cash flow from financing activities 34 -6 -6 -12 -15 -20
Total Cash flow 75 2 3 6 5 1 CTA (Cumulative translation adj.) 0 0 0 0 0 0
Net increase in cash 75 2 3 6 5 1
Cash at beginning of period 38 112 115 112 118 123 Cash at end of period 112 115 118 118 123 124 3.3%
Source: Bryan, Garnier & Co ests.
Fig. 7: … but the group keeps a net cash position over the next three years
[in CHFm] 2015 1H16e 2H16e 2016e 2017e 2018e Cash and cash equivalents 112 115 118 118 123 124 Trade accounts receivables 44 48 52 52 65 82 Inventories 37 41 45 45 55 70 Other 26 27 28 28 31 34
Total current assets 220 231 243 243 274 310
Property, plant and equipment 15 6 -4 -4 -28 -52 Goodwill 57 57 57 57 57 57 Other intangible assets 88 107 128 128 179 242 Other 8 8 8 8 8 8
Total non-current assets 167 177 189 189 215 255
Total assets 387 409 431 431 488 565 Trade accounts payables 24 27 29 29 36 45 Current borrowings 0 0 0 0 0 0 Provisions 0 0 0 0 0 0 Other 31 32 33 33 35 38
Current liabilities 55 59 62 62 71 83
Borrowings 59 59 59 59 59 59 Provisions 6 6 7 7 9 11 Net pension liability 12 13 15 15 18 23 Other 6 6 6 6 7 7
Non-current liabilities 83 85 87 87 92 100
Total equity 248 265 283 283 325 382
Total liabilities and Shareholders' equity 387 409 431 431 488 565
Source: Bryan, Garnier & Co ests.
Note that u-blox goal is to maximize R&D but always to maintain a positive FCF.

u-blox
60
5. Upside potential of 16% We generally use at least two valuation methods. However, like Melexis, the specific profile of u-blox (midcap and fabless with outstanding growth) makes the composition of a representative sample irrelevant. As such, a peer comparison does not seem relevant.
Our Fair Value of CHF265 therefore stems from a DCF valuation and shows upside potential of 16% relative to the current share price. In view of 1/ the upside potential shown in our valuation and 2/ positive momentum that we expect for the share, we are adopting a Buy recommendation.
Our DCF valuation is based on the following assumptions:
Our base scenario, which includes estimates out to 2018e. Like other semiconductors players that we cover, we have applied a cyclical growth scheme over the normalised period (from 2019e to 2024e). However, given u-blox' outstanding growth profile in recent years, we have not applied our usual method of reproducing the characteristics of the previous cycle in the normalised period. We have assumed a growth rate of 25.0% (equivalent to the average growth rate over the past five years) at the beginning of the normalised period, or 2019e, which seems more representative of coming years. We have then applied a linear reduction to this rate out to 2024e in order to reach our terminal growth rate of 3.0%. For the 2016/25e period, this scenario points to average growth of 17.5%.
We have assumed average underlying EBIT margin of 15.3% over 2016/25e, i.e. the margin in our 2016/18e scenario and then a linear reduction in this margin in order to reach our long term margin of 14.7% (i.e. average EBIT margin of the past five years).
WCR moving in line with sales growth and maintained at a level of close to 7.5% of sales over the entire period, i.e. equivalent to the historical five-year average at u-blox.
Capex equivalent to 11.5% of sales over the entire period, i.e. equivalent to the historical five-year average at u-blox.
A corporate tax rate close to 23% corresponding to u-blox' normalised tax rate given that the group's head offices are located in Thalwil in the canton of Zurich in Switzerland (or 8.5% of federal tax to which communal tax of 14.5% is added).
WACC of 10.0%. We have applied beta of 1.2x, or similar to the level used in the valuation of ASML, Infineon and Melexis, a risk-free rate of 1.6% and a market risk premium of 7%. On closing in 2015, the group had net cash of CHF65m. Interest rates on borrowing are therefore not part of the WACC calculation.

u-blox
61
Fig. 8: WACC of 10.0%
WACC European risk-free interest rate 1.6% Equity risk premium 7.0% Beta 1.2
Return expected on equity 10.0% Interest rate on debt 2.5%
Market Capitalization (CHFm) 1,478 Net debt on 31/12/15 (CHFm) -65 Entreprise value (CHFm) 1,413
WACC 10.0%
Source: Bryan, Garnier & Co. ests.
Fig. 9: DCF, FV of CHF265 or upside potential of 16%
in CHFm (FYE 31/12) 2016e 2017e 2018e 2019 2020 2021 2022 2023 2024 2025 Revenues 405 501 635 794 968 1,149 1,328 1,493 1,632 1,733 Change (%) 19.6% 23.8% 26.9% 25.0% 21.9% 18.7% 15.6% 12.4% 9.3% 6.1%
Adjusted EBIT 60 73 98 127 154 181 208 231 251 264 Adjusted operating margin 14.8% 14.6% 15.5% 16.0% 15.9% 15.7% 15.6% 15.5% 15.4% 15.2%
Tax -14 -16 -22 -29 -35 -41 -47 -52 -56 -59 Tax rate 22.5% 21.5% 21.5% 22.5% 22.5% 22.5% 22.5% 22.5% 22.5% 22.5%
Net Operating income after tax 46 57 76 98 119 140 161 179 194 205 Capex, net -51 -63 -79 -91 -111 -132 -153 -172 -188 -199 As a % of sales 12.5% 12.5% 12.5% 11.5% 11.5% 11.5% 11.5% 11.5% 11.5% 11.5%
Depreciation & amortisation 29 37 39 91 111 132 153 172 188 199 As a % of sales 7.2% 7.3% 6.2% 11.5% 11.5% 11.5% 11.5% 11.5% 11.5% 11.5%
WCR 24 35 51 60 73 86 100 112 122 130 As a % of sales 6.0% 7.0% 8.0% 7.5% 7.5% 7.5% 7.5% 7.5% 7.5% 7.5%
Change in working capital -8 -11 -15 -9 -13 -14 -13 -12 -10 -8
Free cash flows 17 20 21 90 106 127 147 167 184 197 Discounted free cash flows 17 17 17 65 70 76 80 83 83 81 Total discounted FCF - 2016e-2025e 588 Discounted Terminal value - 2026e+ 1,149 WACC
Enterprise value 1,737 [in CHF] 9.0% 9.5% 10.0% 10.5% 11.0%
- Net debt on 31/12/2016e -70
Op.
mar
gin
13% 283 259 238 220 204
Equity value 1,808 14% 301 274 252 232 215
Nbr of diluted shares (m) 6.810 15% 318 289 265 245 227
Valuation per share (CHF) 265 16% 335 305 279 257 238
Upside vs. current share price 16% 17% 352 320 293 270 249
Source: Bryan, Garnier & Co.

Semiconductors
62
Price Chart and Rating History ARM Holdings
Ratings Date Ratings Price 18/07/16 Tender to the offer 1189p 07/12/15 BUY 1310p
Target Price Date Target price 05/04/16 1340p 07/12/15 1310p
ASML
Ratings Date Ratings Price 05/04/16 SELL EUR9.49 21/01/16 BUY EUR73.8 08/09/15 NEUTRAL EUR82.88
Target Price Date Target price 05/04/16 EUR81 21/01/16 EUR85 15/10/15 EUR76 08/09/15 EUR77
DIALOG SEMICONDUCTORS
Ratings Date Ratings Price 09/03/16 BUY EUR31.93 22/09/15 NEUTRAL EUR37.38 11/06/15 BUY EUR48598
Target Price Date Target price 05/05/16 EUR35 05/04/16 EUR39 09/03/16 EUR40 14/01/16 EUR38 12/01/16 EUR34 16/12/15 EUR37 15/12/15 Under review 22/09/15 EUR39 11/06/15 EUR57
INFINEON
Ratings Date Ratings Price 11/06/15 BUY EUR48.598
Target Price Date Target price 27/11/15 EUR15 11/06/15 EUR14
SOITEC
Ratings Date Ratings Price 23/12/14 NEUTRAL EUR0.96 22/12/14 Under review EUR2.11 12/11/14 BUY EUR1.93
Target Price Date Target price 07/06/16 EUR0.45 10/03/16 EUR0.5 11/02/16 EUR0.65 19/11/15 EUR0.8 06/08/15 EUR0.7 29/05/15 EUR0.75 24/03/15 EUR1.1 20/01/15 EUR0.95 23/12/14 EUR0.85 22/12/14 Under review 12/11/14 EUR2.6
STMicroelectronics
Ratings Date Ratings Price 28/01/16 NEUTRAL EUR6.28 30/10/15 SELL EUR6.2 26/02/15 NEUTRAL EUR7.86
Target Price Date Target price 05/04/16 EUR6.3 28/01/16 EUR7 30/10/15 EUR6.8 24/07/15 EUR7.2 04/05/15 EUR7.8 24/03/15 EUR9 04/03/15 EUR8 26/02/15 EUR7.6
806.0
906.0
1006.0
1106.0
1206.0
1306.0
1406.0
09/01/15 09/04/15 09/07/15 09/10/15 09/01/16 09/04/16 09/07/16
ARM HOLDINGS Fair Value Achat Neutre Vente
68.1
73.1
78.1
83.1
88.1
93.1
98.1
103.1
108.1
09/01/15 09/04/15 09/07/15 09/10/15 09/01/16 09/04/16 09/07/16
ASML HOLDING Fair Value Achat Neutre Vente
23.1
28.1
33.1
38.1
43.1
48.1
53.1
58.1
63.1
09/01/15 09/04/15 09/07/15 09/10/15 09/01/16 09/04/16 09/07/16
DIALOG SEMICON. Fair Value Achat Neutre Vente
7.4
8.4
9.4
10.4
11.4
12.4
13.4
14.4
15.4
09/01/15 09/04/15 09/07/15 09/10/15 09/01/16 09/04/16 09/07/16
INFINEON TECHS. (XET) Fair Value Achat Neutre Vente
0.3
0.4
0.5
0.6
0.7
0.8
0.9
1.0
1.1
1.2
09/01/15 09/04/15 09/07/15 09/10/15 09/01/16 09/04/16 09/07/16
SOITEC Fair Value Achat Neutre Vente
4.3
5.3
6.3
7.3
8.3
9.3
10.3
09/01/15 09/04/15 09/07/15 09/10/15 09/01/16 09/04/16 09/07/16
STMICROELECTRONICS (PAR) Fair Value Achat Neutre Vente

Semiconductors
63
Bryan Garnier stock rating system For the purposes of this Report, the Bryan Garnier stock rating system is defined as follows: Stock rating
BUY Positive opinion for a stock where we expect a favourable performance in absolute terms over a period of 6 months from the publication of a recommendation. This opinion is based not only on the FV (the potential upside based on valuation), but also takes into account a number of elements that could include a SWOT analysis, momentum, technical aspects or the sector backdrop. Every subsequent published update on the stock will feature an introduction outlining the key reasons behind the opinion.
NEUTRAL Opinion recommending not to trade in a stock short-term, neither as a BUYER or a SELLER, due to a specific set of factors. This view is intended to be temporary. It may reflect different situations, but in particular those where a fair value shows no significant potential or where an upcoming binary event constitutes a high-risk that is difficult to quantify. Every subsequent published update on the stock will feature an introduction outlining the key reasons behind the opinion.
SELL Negative opinion for a stock where we expect an unfavourable performance in absolute terms over a period of 6 months from the publication of a recommendation. This opinion is based not only on the FV (the potential downside based on valuation), but also takes into account a number of elements that could include a SWOT analysis, momentum, technical aspects or the sector backdrop. Every subsequent published update on the stock will feature an introduction outlining the key reasons behind the opinion.
Distribution of stock ratings
BUY ratings 55.8% NEUTRAL ratings 34% SELL ratings 10.2%
Research Disclosure Legend 1 Bryan Garnier shareholding
in Issuer Bryan Garnier & Co Limited or another company in its group (together, the “Bryan Garnier Group”) has a shareholding that, individually or combined, exceeds 5% of the paid up and issued share capital of a company that is the subject of this Report (the “Issuer”).
No
2 Issuer shareholding in Bryan Garnier
The Issuer has a shareholding that exceeds 5% of the paid up and issued share capital of one or more members of the Bryan Garnier Group.
No
3 Financial interest A member of the Bryan Garnier Group holds one or more financial interests in relation to the Issuer which are significant in relation to this report
No
4 Market maker or liquidity provider
A member of the Bryan Garnier Group is a market maker or liquidity provider in the securities of the Issuer or in any related derivatives.
No
5 Lead/co-lead manager In the past twelve months, a member of the Bryan Garnier Group has been lead manager or co-lead manager of one or more publicly disclosed offers of securities of the Issuer or in any related derivatives.
No
6 Investment banking agreement
A member of the Bryan Garnier Group is or has in the past twelve months been party to an agreement with the Issuer relating to the provision of investment banking services, or has in that period received payment or been promised payment in respect of such services.
No
7 Research agreement A member of the Bryan Garnier Group is party to an agreement with the Issuer relating to the production of this Report.
No
8 Analyst receipt or purchase of shares in Issuer
The investment analyst or another person involved in the preparation of this Report has received or purchased shares of the Issuer prior to a public offering of those shares.
No
9 Remuneration of analyst The remuneration of the investment analyst or other persons involved in the preparation of this Report is tied to investment banking transactions performed by the Bryan Garnier Group.
No
10 Corporate finance client In the past twelve months a member of the Bryan Garnier Group has been remunerated for providing corporate finance services to the issuer or may expect to receive or intend to seek remuneration for corporate finance services from the Issuer in the next six months.
No
11 Analyst has short position The investment analyst or another person involved in the preparation of this Report has a short position in the securities or derivatives of the Issuer.
No
12 Analyst has long position The investment analyst or another person involved in the preparation of this Report has a long position in the securities or derivatives of the Issuer.
No
13 Bryan Garnier executive is an officer
A partner, director, officer, employee or agent of the Bryan Garnier Group, or a member of such person’s household, is a partner, director, officer or an employee of, or adviser to, the Issuer or one of its parents or subsidiaries. The name of such person or persons is disclosed above.
No
14 Analyst disclosure The analyst hereby certifies that neither the views expressed in the research, nor the timing of the publication of the research has been influenced by any knowledge of clients positions and that the views expressed in the report accurately reflect his/her personal views about the investment and issuer to which the report relates and that no part of his/her remuneration was, is or will be, directly or indirectly, related to the specific recommendations or views expressed in the report.
Yes
15 Other disclosures Other specific disclosures: Report sent to Issuer to verify factual accuracy (with the recommendation/rating, price target/spread and summary of conclusions removed).
No
A copy of the Bryan Garnier & Co Limited conflicts policy in relation to the production of research is available at www.bryangarnier.com

London
Beaufort House
15 St. Botolph Street
London EC3A 7BB
Tel: +44 (0) 207 332 2500
Fax: +44 (0) 207 332 2559
Authorised and regulated by the
Financial Conduct Authority (FCA)
Paris
26 Avenue des Champs Elysées
75008 Paris
Tel: +33 (0) 1 56 68 75 00
Fax: +33 (0) 1 56 68 75 01
Regulated by the
Financial Conduct Authority (FCA) and the
Autorité de Contrôle prudential et de
resolution (ACPR)
New York
750 Lexington Avenue
New York, NY 10022
Tel: +1 (0) 212 337 7000
Fax: +1 (0) 212 337 7002
FINRA and SIPC member
Munich
Widenmayerstrasse 29
80538 Munich
Germany
+49 89 2422 62 11
New Delhi The Imperial Hotel Janpath New Delhi 110 001 Tel +91 11 4132 6062 +91 98 1111 5119 Fax +91 11 2621 9062 Geneva rue de Grenus 7 CP 2113 Genève 1, CH 1211 Tel +4122 731 3263 Fax+4122731 3243 Regulated by the FINMA
Important information This document is classified under the FCA Handbook as being investment research (independent research). Bryan Garnier & Co Limited has in place the measures and arrangements required for investment research as set out in the FCA’s Conduct of Business Sourcebook. This report is prepared by Bryan Garnier & Co Limited, registered in England Number 03034095 and its MIFID branch registered in France Number 452 605 512. Bryan Garnier & Co Limited is authorised and regulated by the Financial Conduct Authority (Firm Reference Number 178733) and is a member of the London Stock Exchange. Registered address: Beaufort House 15 St. Botolph Street, London EC3A 7BB, United Kingdom This Report is provided for information purposes only and does not constitute an offer, or a solicitation of an offer, to buy or sell relevant securities, including securities mentioned in this Report and options, warrants or rights to or interests in any such securities. This Report is for general circulation to clients of the Firm and as such is not, and should not be construed as, investment advice or a personal recommendation. No account is taken of the investment objectives, financial situation or particular needs of any person. The information and opinions contained in this Report have been compiled from and are based upon generally available information which the Firm believes to be reliable but the accuracy of which cannot be guaranteed. All components and estimates given are statements of the Firm, or an associated company’s, opinion only and no express representation or warranty is given or should be implied from such statements. All opinions expressed in this Report are subject to change without notice. To the fullest extent permitted by law neither the Firm nor any associated company accept any liability whatsoever for any direct or consequential loss arising from the use of this Report. Information may be available to the Firm and/or associated companies which are not reflected in this Report. The Firm or an associated company may have a consulting relationship with a company which is the subject of this Report. This Report may not be reproduced, distributed or published by you for any purpose except with the Firm’s prior written permission. The Firm reserves all rights in relation to this Report. Past performance information contained in this Report is not an indication of future performance. The information in this report has not been audited or verified by an independent party and should not be seen as an indication of returns which might be received by investors. Similarly, where projections, forecasts, targeted or illustrative returns or related statements or expressions of opinion are given (“Forward Looking Information”) they should not be regarded as a guarantee, prediction or definitive statement of fact or probability. Actual events and circumstances are difficult or impossible to predict and will differ from assumptions. A number of factors, in addition to the risk factors stated in this Report, could cause actual results to differ materially from those in any Forward Looking Information. Disclosures specific to clients in the United Kingdom This Report has not been approved by Bryan Garnier & Co Limited for the purposes of section 21 of the Financial Services and Markets Act 2000 because it is being distributed in the United Kingdom only to persons who have been classified by Bryan Garnier & Co Limited as professional clients or eligible counterparties. Any recipient who is not such a person should return the Report to Bryan Garnier & Co Limited immediately and should not rely on it for any purposes whatsoever. Notice to US investors This research report (the “Report”) was prepared by Bryan Garnier & Co Limited for information purposes only. The Report is intended for distribution in the United States to “Major US Institutional Investors” as defined in SEC Rule 15a-6 and may not be furnished to any other person in the United States. Each Major US Institutional Investor which receives a copy of this Report by its acceptance hereof represents and agrees that it shall not distribute or provide this Report to any other person. Any US person that desires to effect transactions in any security discussed in this Report should call or write to our US affiliated broker, Bryan Garnier Securities, LLC. 750 Lexington Avenue, New York NY 10022. Telephone: 1-212-337-7000. This Report is based on information obtained from sources that Bryan Garnier & Co Limited believes to be reliable and, to the best of its knowledge, contains no misleading, untrue or false statements but which it has not independently verified. Neither Bryan Garnier & Co Limited and/or Bryan Garnier Securities LLC make no guarantee, representation or warranty as to its accuracy or completeness. Expressions of opinion herein are subject to change without notice. This Report is not an offer to buy or sell any security. Bryan Garnier Securities, LLC and/or its affiliate, Bryan Garnier & Co Limited may own more than 1% of the securities of the company(ies) which is (are) the subject matter of this Report, may act as a market maker in the securities of the company(ies) discussed herein, may manage or co-manage a public offering of securities for the subject company(ies), may sell such securities to or buy them from customers on a principal basis and may also perform or seek to perform investment banking services for the company(ies). Bryan Garnier Securities, LLC and/or Bryan Garnier & Co Limited are unaware of any actual, material conflict of interest of the research analyst who prepared this Report and are also not aware that the research analyst knew or had reason to know of any actual, material conflict of interest at the time this Report is distributed or made available..