independent domestications of cultivated tree peonies...
TRANSCRIPT
Independent domestications of cultivated tree peoniesfrom different wild peony species
JUN-HUI YUAN,*† AMANDINE CORNILLE,‡§¶ TATIANA GIRAUD,‡§¶ FANG-YUN CHENG† and
YONG-HONG HU*1
*Shanghai Chenshan Plant Science Research Center, Chinese Academy of Sciences, Shanghai Chenshan Botanical Garden, 3888
Chenhua Road, Shanghai 201602, China, †Landscape Architecture College, Beijing Forestry University, No. 35 Tsinghua East
Road, Haidian District, Beijing 100083, China, ‡Universit�e Paris-Sud, Ecologie, Syst�ematique et Evolution, UMR8079, 91405
Orsay, France, §CNRS, Ecologie, Syst�ematique et Evolution, UMR8079, 91405 Orsay, France, ¶AgroParisTech, Orsay, France2
Abstract
An understanding of plant domestication history provides insights into general mech-
anisms of plant adaptation and diversification and can guide breeding programmes
that aim to improve cultivated species. Cultivated tree peonies (genus Paeonia L.) are
among the most popular ornamental plants in the world; yet, the history of their
domestication is still unresolved. Here, we explored whether the domestication in
China of historically cultivated peonies, that is, the common and flare cultivated tree
peonies, was a single event or whether independent domestications occurred. We
used 14 nuclear microsatellite markers and a comprehensive set of 553 tree peonies
collected across China, including common tree peonies, flare tree peonies and the
wild species or subspecies that are potential contributors to the cultivated tree
peonies, that is, Paeonia rockii ssp. rockii, P. rockii ssp. atava, P. jishanensis and
P. decomposita. Assignment methods, a principal component analysis and approxi-
mate Bayesian computations provided clear evidence for independent domestications
of these common tree and flare tree peonies from two distinct and allopatric wild spe-
cies, P. jishanensis and P. rockii ssp. atava, respectively. This study provides the first
example of independent domestications of cultivated trees from distinct species and
locations. This work also yields crucial insight into the history of domestication of
one of the most popular woody ornamental plants. The cultivated peonies represent
an interesting case of parallel and convergent evolution. The information obtained in
this study will be valuable both for improving current tree peony breeding strategies
and for understanding the mechanisms of domestication, diversification and adapta-
tion in plants.
Keywords: annual grass, convergence, East Asia, hybridization, ornamental cultivated tree,
Paeonia suffruticosa
Received 30 April 2013; revision received 14 October 2013; accepted 16 October 2013
Introduction
An understanding of plant domestication can provide
insight into the history of human civilization (Diamond
2002) and into general mechanisms of biological adapt-
ation; it can also guide modern breeding programmes
aimed at the further improvement of crop species (Gross
& Olsen 2010; Miller & Gross 2011). The most fundamen-
tal and debated questions regarding the evolution of cul-
tivated plants concern their geographic origins, whether
domestication took place once or multiple times for a
given crop and whether genetic bottlenecks occurred dur-
ing their evolution (Diamond 2002; Gross & Olsen 2010).
A single origin of crops from one geographic area
and from a single progenitor was initially considered
Correspondence: Fang-Yun Cheng, Fax: XXXXX;
E-mail:[email protected]; Yong-Hong Hu, Fax: XXXXXXX;
E-mail: [email protected] and Jun-hui Yuan,
Fax: XXXXXXX; E-mail: [email protected] 3
1
2
3
4
5
6
7
8
9
10
11
12
13
14
15
16
17
18
19
20
21
22
23
24
25
26
27
28
29
30
31
32
33
34
35
36
37
38
39
40
41
42
43
44
45
46
47
48
49
50
51
52
53
54
© 2013 John Wiley & Sons Ltd
Molecular Ecology (2013) doi: 10.1111/mec.12567
ME
C1
25
67
Dispa
tch:
31.10.13
CE:M
anim
ekalai
JournalCode
ManuscriptNo.
No.
ofpa
ges:
14PE:Pun
itha
-

the default domestication scenario for most crop species
(Gl�emin & Bataillon 2009). However, for several annual
crops, accumulating molecular evidence now suggests
that multiple domestications from distinct locations and
from wild contributors occurred. Confirmation of multi-
ple independent geographic origins has been made for
barley (Morrell & Clegg 2007), Asian rice (Londo et al.
2006) and the common bean (Phaseolus vulgaris; Bitocchi
et al. 2012, 2013). Independent domestication from dif-
ferent species was also reported for two species of
domesticated cotton (Gossypium hirsutum and G. barva-
dense L.; Westengen et al. 2005), two domesticated rice
species from Asia and Africa (Oryza sativa and O. glab-
errima Steud.; Londo et al. 2006) and beans (Phaseolus L.;
Chacon et al. 2005). The occurrence of strong genetic
bottlenecks during the process of domestication has
been documented for most annual propagated seed
crops (Tenaillon et al. 2004; Hyten et al. 2006; Liu &
Burke 2006; Haudry et al. 2007). In contrast, for peren-
nial tree crops, the investigation of these questions is
still in its infancy (e.g. Besnard & Berville 2000; Breton
et al. 2006; Myles et al. 2010; Cornille et al. 2012; Besnard
et al. 2013).
Trees are fascinating models for studying domestica-
tion because their peculiar life history traits permit
unique domestication processes (Gross & Olsen 20114 ;
Cornille et al. 2012). Whereas the domestication history
of some trees cultivated for food purposes has recently
been elucidated (Gross & Olsen 2011; Cornille et al.
2012; Besnard et al. 2013; Delplancke et al. 2013; Roullier
et al. 2013; Wincker 2013), the domestication of orna-
mental plants for aesthetic purposes, such as the rose
(Iwata et al. 2000)5 , has not received much attention. Cul-
tivated tree peonies (genus Paeonia L.) are among the
most popular ornamental plants worldwide and have
been used as ornamental and traditional medicinal
plants for over 1600 years in China, their centre of ori-
gin (Foster & Yue 1992; Li 2011). Although tree peonies
display a rich ethnobotanical history that is deeply
embedded in the Chinese culture, the history of the
domestication of cultivated tree peonies remains unre-
solved (Cheng 2007; Li 20066 ; Zhou 2007; Zhang et al.
2011)7 . The most important traits that have changed dur-
ing domestication are the number and size of the flow-
ers and the number and colours of the petals.
Historically cultivated tree peonies include (i) the com-
mon tree peonies (CTPs), Paeonia suffruticosa Andrews,
comprising 700–800 local varieties distributed through-
out temperate regions in the world (Li 2011) and (ii) the
flare tree peonies (FTPs), comprising 200–300 varieties
that are less extensively commercialized (Wang 1998;
Cheng et al. 2005; Li 2005, 2011; Cheng 2007). Flare tree
peonies are widely cultivated in the middle Gansu
Province and present scattered distributions elsewhere
in northwestern China (e.g. Ningxia, Qinghai and
Shaanxi) and in some provinces of northern China
(Wang 1998; Cheng et al. 2005; Cheng 2007; Li 2011).
These two cultivated tree peonies differ in ecology (e.g.
the flare tree peonies have greater ecological plasticity
and a higher degree of resistance to environmental
stress) and in morphology, with all flare tree peonies
presenting reddish-purple flares at the bases of the pet-
als that allow for easy identification (Cheng et al. 2005)
(Fig. 1). These marked differences led to the as yet
untested hypothesis that independent domestications of
these two groups of cultivated peonies occurred (Li
1998, 2005; Wang 1998; Cheng 2007).
China is pinpointed as the likely geographic origin of
cultivated tree peonies because it hosts the richest tree
peony resources in the world; these resources include
endemic wild species and greater than 1000 varieties.
Tree peonies were introduced to Japan during the Tang
dynasty (724–749), and more than 200 varieties of Japa-
nese tree peonies have been developed. Beginning in
the 1780s, some common tree peonies were introduced
into western countries, such as England and France
(Cheng 2007; Li 2011). Almost 110 varieties of tree peo-
nies are currently grown in Europe (Cheng 2007). In the
1880s, a wild tree peony species, P. delavayi, was intro-
duced into France, where nearly 13 cultivars designated
P. 9 lemoinei have been obtained by hybridizing P. dela-
vayi and P. suffruticosa (Wister 1995; Cheng 2007).
American tree peony cultivars were developed later by
further hybridizing P. 9 lemoinei with Japanese culti-
vars (Cheng 2007; Li 2011). The creation of these recent
cultivars has been well documented (Cheng 2007);
therefore, we focused in this work on the domestication
history of the historically cultivated peonies: the com-
mon and flare tree peonies in China.
Historical records and morphological comparisons
suggest that CTP and FTP cultivars originated indepen-
dently from different wild species in China. Cultivated
CTPs are likely to have originated from the wild species
Paeonia jishanensis T. Hong & W.Z. Zhao (Rehder 1920;
Li 2005), while one of the two subspecies of P. rockii
S.G. Haw & Lauener, T. Hong & J.J. Li ex D.Y. Hong
(P. rockii ssp. atava and P. rockii ssp. rockii) growing in
the central southern region of Gansu Province (Fig. 1) is
the likely progenitor of FTPs (Cheng et al. 2005; Li
2011). Molecular phylogenetic analysis suggests that
another wild species, P. decomposita Hand. Mazz., which
is distributed in Sichuan Province (Fig. 1), may also
have been involved to a lesser extent in the domestica-
tion of FTPs (Zhou 2007). This hypothesis remains con-
troversial, however, because P. decomposita displays a
restricted distribution in remote mountain areas in
northwestern Sichuan province and is therefore unlikely
to have been easily transplanted in the past (Li 2011). It
© 2013 John Wiley & Sons Ltd
2 J . - H. YUAN ET AL.
1
2
3
4
5
6
7
8
9
10
11
12
13
14
15
16
17
18
19
20
21
22
23
24
25
26
27
28
29
30
31
32
33
34
35
36
37
38
39
40
41
42
43
44
45
46
47
48
49
50
51
52
53
54
has also been proposed based on morphological fea-
tures and gene sequences that recent wild-to-crop and
crop-to-crop (i.e. FTPs to CTPs and conversely) hybrid-
izations and introgressions have been major forces in
the breeding of cultivated tree peonies (Cheng 2007;
Zhou 2007; Li 2011). The available phylogenies of culti-
vated and wild tree peony species are, however, not
resolved well enough to provide a basis for elucidation
of the domestication history of the CTP and FTP culti-
vars (Zhou 2007; Zhao et al. 2008; Zhang et al. 2011).
Here, we explored the domestication history of com-
mon and flare tree cultivated peonies in their centre of
origin using 14 nuclear microsatellite loci and a compre-
hensive set of 553 trees collected throughout China
(Fig. 1). This set included 103 flare tree peony varieties,
72 common tree peony varieties (e.g. P. suffruticosa) and
the main potential contributors to their evolution,
P. rockii ssp. rockii, P. rockii ssp. atava, P. jishanensis and
P. decomposita (Fig. 1), that are all diploid (Hong 2010)
and allogamous (Cheng et al. 2005; Cheng 2007) and
grow in allopatry (Fig. 1). The specific objectives of this
study were to test (i) whether the four wild species or
subspecies, the FTPs and the CTPs all form distinct
genetic clusters; (ii) whether recent wild-to-crop and
crop-to-crop hybridizations contributed to the genomes
of the FTP and CTP cultivars; (iii) whether the FTP and
CTP cultivars have been domesticated independently
from distinct wild species or subspecies and (iv)
whether footprints of genetic bottlenecks expected dur-
ing domestication can be detected.
Materials and methods
Sample collection and DNA extraction
Leaf material was carefully collected from domesti-
cated varieties and wild species to accurately represent
the genetic, morphologic and geographic diversity of
cultivated and wild tree peonies. The choice of varie-
ties and species was made based on interviews with
horticulturalists, botanists and local peony experts, on
field surveys and on an examination of the literature
Gansu province
Sichuan province
Hubei province
Henan provinceShaanxi province
Shanxi province
Lanzhou
Xian
Louyang
Yanan
Lingxia
Lingtao
Tianshui35° N
31° N
Kilometers
0 200
38° N
110° E105° E
P. rockii ssp. rockii
P. jishanensisP. decomposita
Common tree peony (CTP)
P. rockii ssp. atavaFlare tree peony (FTP)
100
N
e
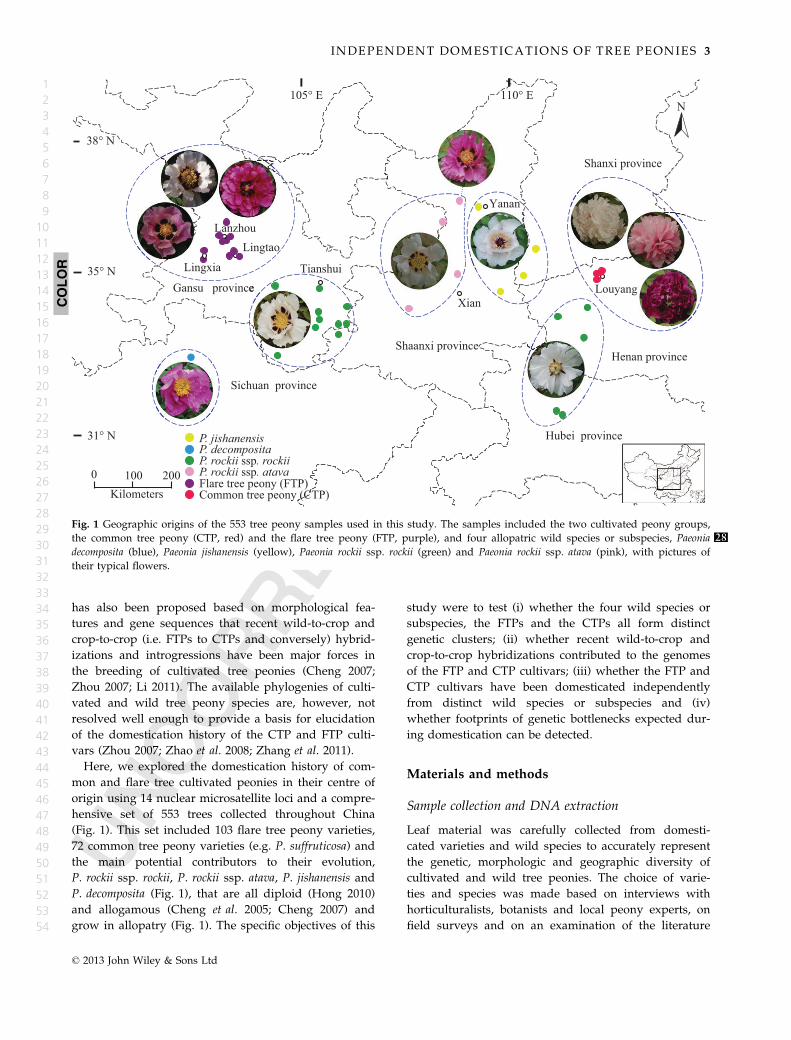
Fig. 1 Geographic origins of the 553 tree peony samples used in this study. The samples included the two cultivated peony groups,28the common tree peony (CTP, red) and the flare tree peony (FTP, purple), and four allopatric wild species or subspecies, Paeonia
decomposita (blue), Paeonia jishanensis (yellow), Paeonia rockii ssp. rockii (green) and Paeonia rockii ssp. atava (pink), with pictures of
their typical flowers.
COLOR
© 2013 John Wiley & Sons Ltd
INDEPENDENT DOMESTICATIONS OF TREE PEONIES 3
1
2
3
4
5
6
7
8
9
10
11
12
13
14
15
16
17
18
19
20
21
22
23
24
25
26
27
28
29
30
31
32
33
34
35
36
37
38
39
40
41
42
43
44
45
46
47
48
49
50
51
52
53
54
(Li 1998, 2005, 2011; Cheng et al. 2005). Our sampling
covered all extant sites of Paeonia rockii ssp. rockii,
P. rockii ssp. atava and P. jishanensis according to the
records in the literature and specimens available in
most herbariums worldwide (Fig. 1; Table S1, Support-
ing information). We sampled a single population of
P. decomposita because this species was not likely to
have contributed to the cultivated tree peonies (Li
2011). A minimum distance of 20 m was kept between
sampled wild individuals.
Most wild tree peonies, including P. rockii (ssp. rockii
and ssp. atava) and P. decomposita, can only reproduce
sexually, but P. jishanensis can also propagate asexually
by stolons. Cultivated peony varieties are often propa-
gated clonally by grafting, division or layering, although
breeders sometimes use seeds. To avoid the inclusion of
clones in the data set, we sampled a single tree per vari-
ety. A total of 103 FTP varieties of P. rockii propagated
commercially, including 49 traditional and 54 modern
varieties, all of great ornamental value, were collected
(Fig. 1, Table S1, Supporting information). A total of 72
CTPs representing varieties of P. suffruticosa, including
28 traditional and 44 commercial modern varieties, were
sampled (Cheng et al. 2005; Li 2005).
DNA was extracted from the collected leaves using
an improved cetyltrimethylammonium bromide (CTAB)
method (Yuan et al. 2010) and examined by electropho-
resis on a 1% agarose gel in TAE buffer. The DNA was
then diluted to a concentration of 5–10 ng/lL for subse-
quent polymerase chain reaction (PCR) amplification.
Microsatellite loci and PCR amplification
We used 14 polymorphic microsatellite loci (Table S2,
Supporting information) that were previously shown to
be independent and to not belong to the chloroplast gen-
ome of Paeonia (Yuan et al. 2012). The PCR conditions
were as described by Yuan et al. (2012). Positive and nega-
tive controls were systematically run. The PCR products
were examined on an ABI PRISM X3730XL DNA analyser
with GeneScan 600LIZ size standards (Applied Biosys-
tems, Foster City, CA, USA). Each chromatogram was
read using GeneMapper 4.0 (Applied Biosystems). The
genotyping results are presented in Table S3 (Supporting
information). Samples with uncertain alleles were double
checked by repeating the PCR amplifications.
Analysis of genetic diversity within each wild peonyspecies or subspecies and within cultivated tree peonies
Although our sampling was designed to avoid clones
within cultivated peonies, footprints of clonality could
still be present if some varieties differing by only a few
mutations have been propagated by grafting. In wild
species, siblings can be collected unintentionally in the
field. Because these features could result in spurious
genetic structure due to the presence of closely related
individuals in the data set, we checked for the existence
of clonal genotypes using GENCLONE 2.0 (Arnaud-
Haond & Belkhir 2007) 8and estimated relatedness
between pairs of individuals within each species by
calculating the rxy of Lynch & Ritland (1999) using
RE-RAT (Schwacke & Rosel 2005).
We tested for the occurrence of null alleles with
MICRO-CHECKER 2.2.3 (Van Oosterhout et al. 2004).
Allelic richness (AR) and private allele (AP) frequencies
for a sample size of four were calculated with ADZE
(Szpiech et al. 2008). Observed (Ho) and expected (HE)
heterozygosities and Weir & Cockerham F-statistics
were estimated using GenALEx 6.5 (Peakall & Smouse
2012). Inbreeding coefficient (FIS), deviation from the
Hardy–Weinberg equilibrium, genotypic linkage dis-
equilibrium and the significance of differences between
FST values were assessed using exact tests conducted
with GENEPOP 4.0 (Rousset 2008).
We tested for the occurrence of a recent genetic bot-
tleneck in cultivated and wild tree peonies using the
method implemented in BOTTLENECK (Cornuet &
Luikart 1996; Piry et al. 1999), which is based on the
detection of significant heterozygosity excess relative to
equilibrium expectations. Heterozygosity excess is an
ephemeral pattern that can only be detected within the
first several generations after a decline of population
size; it initially occurs because allelic diversity is lost
faster than heterozygosity, resulting in the appearance
of greater heterozygosity than expected based on the
number of alleles in the population (Cornuet & Luikart
1996). We used all three available models for microsat-
ellite evolution, that is, infinite allele (IAM), stepwise-
mutation (SMM) or two-phase (TPM) models, which
yielded different results (Table S4, Supporting informa-
tion). We report only the results obtained under the
TPM model, with the setting values of 10% SMM, 90%
IAM and 10% variance, because the TPM model has
been reported to be the most conservative and powerful
model available (Cornuet & Luikart 1996; Luikart et al.
1998). Models were run for 10,000 replicates. The recent
occurrence of a genetic bottleneck was further investi-
gated using the Garza–Williamson index (M, an empiri-
cal value of the ratio of number of alleles to range in
allele size). This index, analysed here using Arlequin
3.5 (Excoffier & Lischer 2010), is expected to be lower
than the critical Mc value of 0.68, a value obtained by
simulations based on the empirical data, in bottlenecked
populations (Garza & Willamson 2001) 9. The method
implemented in BOTTLENECK has low power unless
the decline is greater than 90% (Cornuet & Luikart
1996); this approach is most powerful when genetic
© 2013 John Wiley & Sons Ltd
4 J . - H. YUAN ET AL.
1
2
3
4
5
6
7
8
9
10
11
12
13
14
15
16
17
18
19
20
21
22
23
24
25
26
27
28
29
30
31
32
33
34
35
36
37
38
39
40
41
42
43
44
45
46
47
48
49
50
51
52
53
54

bottlenecks are severe and recent (Williamson-Natesan
2005). The Garza–Williamson index method is more
likely to correctly detect genetic bottlenecks if the bot-
tleneck lasted several generations or if the population
made a rapid demographic recovery (Williamson-Nate-
san 2005).
Genetic differentiation among wild species andcultivated tree peonies
STRUCTURE 2.3.2 (Pritchard et al. 2000; Falush et al.
2003) was used to infer species delimitation and the
contribution of wild species or subspecies to the culti-
vated peony genome. Analyses were run without prior
information. STRUCTURE performs model-based clus-
tering, in which Markov chain Monte Carlo (MCMC)
simulations are used to identify K distinct clusters. The
algorithm attempts to minimize deviations from
Hardy–Weinberg and linkage equilibrium within clus-
ters. Ten independent runs were conducted for each
K. Each run was pursued for 2,000,000 MCMC interac-
tions using the following conditions: an initial burn-in
of 200,000, an admixture model, correlated allelic fre-
quencies and the same a for all samples. STRUCTURE
was run with the full data set (N = 553) and with the
pruned data set (N = 323) that excluded clonal and
related individuals (i.e. rxy > 0.5). STRUCTURE was run
for K ranging from one to eight for species delimitation
analyses. The DK statistic, which is designed to identify
the number of clusters above which an additional
increase in likelihood is weaker, was calculated follow-
ing the method of Evanno et al. (2005). For analyses of
wild species contribution to the cultivated peony gen-
ome, STRUCTURE was run at K = 2 on data sets
including either CTPs or FTPs and each of the four wild
peony species by pairs. The P. rockii ssp. rockii and
P. rockii ssp. atava structure had been previously well
studied (Yuan et al. 2012); we focus here instead on the
species history.
Principal component analysis (PCA) was performed
with allele frequencies calculated from the full and
pruned data sets using the Multivariate Statistical Pack-
age (MVSP) version 3.13b (Kovach Computing Services,
Anglesey, Wales, UK).
Approximate Bayesian inference
Using approximate Bayesian computation (ABC), we
investigated whether domestication of the cultivated
common tree peonies and flare tree peonies was a single
event or whether there have been independent domesti-
cations. Population structure does not strongly affect
ABC results (St Onge et al. 2012); thus, we did not take
into account intraspecies structure to avoid useless
complex scenarios including higher numbers of parame-
ters (divergence times and effective population sizes).
Models were constructed based on an FST matrix, histor-
ical records and previous phylogenetic studies of the
domestication history of tree peonies. We excluded
P. decomposita from the ABC analyses because it
appeared to be the most genetically divergent species
based on our microsatellite data and because we had a
low sampling size (N = 11). Historical records and pre-
vious phylogenetic studies pointed to P. jishanensis as
the wild progenitor of CTP cultivars, whereas FTP culti-
vars were suggested to have originated either from
P. rockii ssp. rockii or atava or P. ishanensis. The three
models tested here were therefore designed to distin-
guish between (a) single domestication of CTPs and
FTPs from one wild peony species, P. jishanensis (model
a, Fig. 2); (b) independent domestications of FTPs from
P. rockii ssp. atava and of CTPs from P. jishanensis
(model b, Fig. 2) and (c) independent domestications
of FTPs from P. rockii ssp. rockii and of CTPs from P. ji-
shanensis (model c, Fig. 2). For all models, we assumed
five distinct groups, as indicated by STRUCTURE analy-
ses: the three wild species or subspecies, P. rockii ssp.
rockii (PRR), P. rockii ssp. atava (PRA) and P. jishanensis
(PJ), and two cultivated peony groups, the CTPs and
FTPs. We used ABCtoolbox (Wegmann et al. 2010) with
fastsimcoal (Excoffier & Foll 2011) to compare the three
scenarios (Fig. 2). Because the juvenile period of Paeonia
lasts 4–6 years, we assumed a generation time of
5 years. We estimated the effective size of each group
(NX) and the divergence times between groups X and Y
(TX-Y). We assumed a uniform prior distribution for NX
[600; 4.105] and TX-Y [1; 5.104]. Our priors were large
because no reliable historical data were available.
For all models, microsatellite data sets were simu-
lated for 14 loci (Pdel02-2, Pdel05, Pdel06, Pdel07,
Pdel20, Pdel22, Pdel9b, Pdel33, Pdel35, Jx02-2, Jx05-2,
Jx17 and Jx29) that carry perfect repeats (Wang et al.
2008; Yuan et al. 2010, 2012). We generated 106 genetic
data sets from coalescent simulations using model
parameters drawn from prior distributions under the
three previously specified scenarios. For each simula-
tion, we calculated 31 summary statistics. Within each
group, we computed H, the mean heterozygosity across
loci. We also calculated FST (Weir & Cockerham 1984)
and genetic distances (dl)2 (Goldstein et al. 1995)
between pairs of groups. Following Wegmann et al.
(2009, 2010), 10we used the R package ‘PLS’ (i.e. partial
least squares, Mevik & Wehrens 2007) to find the
appropriate number of PLS components to use (8, in
our case). The same set of 31 summary statistics was
also calculated on the observed data set, was PLS-tran-
sformed and then was used to calculate the Euclidean
distance to each simulation.
© 2013 John Wiley & Sons Ltd
INDEPENDENT DOMESTICATIONS OF TREE PEONIES 5
1
2
3
4
5
6
7
8
9
10
11
12
13
14
15
16
17
18
19
20
21
22
23
24
25
26
27
28
29
30
31
32
33
34
35
36
37
38
39
40
41
42
43
44
45
46
47
48
49
50
51
52
53
54
We assumed a generalized stepwise model of micro-
satellite evolution (Estoup et al. 2002). The mutation rate
was allowed to vary across loci, with locus-specific
mutation rates drawn from a gamma distribution (a, a/
l), in which l is the mutation rate per generation and a
is a shape parameter. We assumed a uniform prior distri-
bution for l [0.001, 0.01] and a uniform distribution for a
[1, 30].
We compared the three models by calculating their
Bayes factors (Wegmann et al. 2010) by estimating their
relative posterior probabilities based on the 1% of simu-
lated data sets that most closely matched the observed
data, that is, 1000 simulated data sets. Once the best model
had been chosen, we estimated demographic parameters
under this scenario using a general linear model (ABC-
GLM) post-sampling regression adjustment for the 1000
retained simulations (Leuenberger & Wegmann 2010;
Wegmann et al. 2010). We report the mode and 95% confi-
dence interval for each model parameter estimate.
The performance of the method for discriminating
between competing historical models was assessed by
analysing test data sets (called pseudo-observed data
sets) that were simulated with the same number of loci
and individuals as the observed data sets. We simu-
lated 1000 such data sets for each competing model
using parameter values drawn from the same prior dis-
tributions as for the original analyses. We determined
the relative posterior probabilities of competing models
for each pseudo-observed data set using the model
choice procedure described above (Wegmann et al.
2010). Confidence in model choice was then estimated
based on the percentage of times that a given scenario
did not have the highest posterior probability of the
competing scenarios when it was actually the true sce-
nario (type I error) and on the percentage of times that
a given scenario had the highest posterior probability
when it was not the true scenario (type II error).
Results
Genetic diversity in cultivated common and flare treepeonies
Eight pairs of samples were assigned to clonal groups by
GENCLONE: one pair each in CTPs, FTPs and Paeonia
jishanensis and five pairs in P. rockii ssp. rockii. The per-
centage of pairs with pairwise relatedness (rxy) greater
than 0.5 (i.e. full-siblings) was 1.1% in CTPs (N = 27
pairs), 0.72% in FTPs (N = 38), 13.55% in P. jishanensis
(N = 63), 9.1% in P. decomposita (N = 5), 2.85% in P. rockii
ssp. rockii (N = 1075) and 11.86% in P. rockii ssp. atava
(N = 217). To avoid biases, STRUCTURE analyses were
then conducted both on the full (N = 553) and pruned
data set (N = 323), that is, keeping a single individual per
pair of related individuals and per pair of clone mates.
Tests for linkage disequilibrium with the Bonferroni
correction showed no significant linkage disequilibrium.
No locus pair deviated significantly from equilibrium in
more than six or seven of 30 total sampled sites, sug-
gesting that all loci were physically unlinked.
Moderate genetic diversity was found in the cultivated
common (HO = 0.61) and flare (HO = 0.58) tree peonies
(Table 1). The four wild species or subspecies showed
significantly lower genetic diversity compared to FTPs
and CTPs (Wilcoxon-sign-rank [WSR] tests on HO
between FTPs/CTPs and each wild species or subspecies,
TPJ-PRR
Present
(b)(a)
TPJ-CTP/
TPJ-FTP
PJ CTP FTP PRA PRR PJ CTP FTP PRA PRR PJ CTP PRA FTP PRR
TPJ-PRA
TPJ-PRR
Present
TPJ-CTP/
TPRA-FTP
TPJ-PRA
Time (c)
TPJ-PRR
Present
TPJ-CTP/
TPRR-FTP
TPJ-PRA
TimeTime
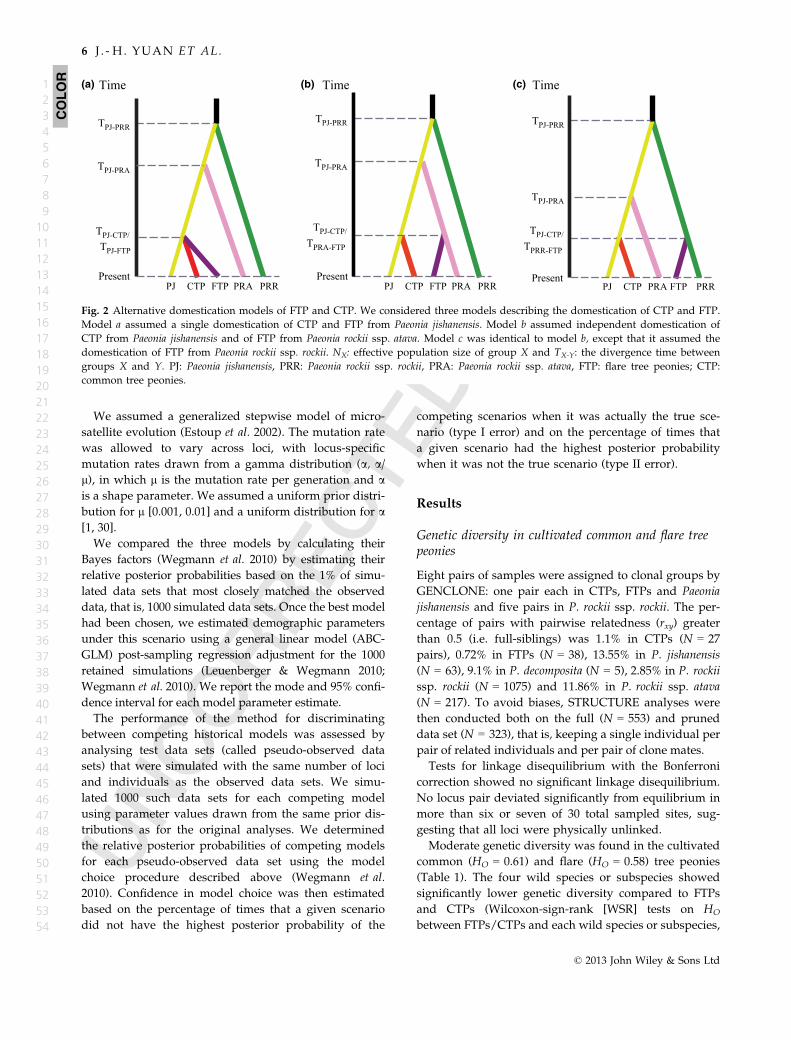
Fig. 2 Alternative domestication models of FTP and CTP. We considered three models describing the domestication of CTP and FTP.
Model a assumed a single domestication of CTP and FTP from Paeonia jishanensis. Model b assumed independent domestication of
CTP from Paeonia jishanensis and of FTP from Paeonia rockii ssp. atava. Model c was identical to model b, except that it assumed the
domestication of FTP from Paeonia rockii ssp. rockii. NX: effective population size of group X and TX-Y: the divergence time between
groups X and Y. PJ: Paeonia jishanensis, PRR: Paeonia rockii ssp. rockii, PRA: Paeonia rockii ssp. atava, FTP: flare tree peonies; CTP:
common tree peonies.
COLOR
© 2013 John Wiley & Sons Ltd
6 J . - H. YUAN ET AL.
1
2
3
4
5
6
7
8
9
10
11
12
13
14
15
16
17
18
19
20
21
22
23
24
25
26
27
28
29
30
31
32
33
34
35
36
37
38
39
40
41
42
43
44
45
46
47
48
49
50
51
52
53
54

all P < 0.05) (Table 1). Allelic richness (AR) was found to
be significantly higher in cultivated CTPs and FTPs than
in wild species or subspecies (Table 1; CTPs: AR = 2.54,
WSR, P ≤ 0.003; FTPs: AR = 2.53, WSR, P ≤ 0.002). FTPs,
CTPs and wild peonies all displayed significant FIS(Tables 1 and S4, Supporting information), indicating
heterozygote deficiency. Null alleles were identified in
some populations of wild and cultivated common and
flare tree peonies. The presence of these alleles and a
Whalund effect may explain the observed deviations
from Hardy–Weinberg equilibrium (Tables 1 and S4,
Supporting information).
The BOTTLENECK analysis showed no significant het-
erozygosity excess in the cultivated common and flare
tree peonies but revealed significant heterozygosity
excess in some populations of wild peonies, namely
P. jishanensis, P. rockii ssp. atava and P. rockii ssp. rockii
(Table S4, Supporting information). The Garza–William-
son index was lower than the threshold value (i.e.
Mc = 0.68) in cultivated peonies (CTPs: Mc = 0.28 �
0.12, FTPs: Mc = 0.26 � 0.26) and in all populations of
wild tree peonies (Table S4, Supporting information).
Together, these results suggest that the wild tree peonies
P. jishanensis, P. rockii ssp. atava and P. rockii ssp. rockii
have suffered from demographic bottlenecks, while culti-
vated common and flare tree peonies have not.
Common and flare tree peonies form well-separatedgenetic clusters
The STRUCTURE results obtained with the full data set
(N = 553) (Fig. 3 and S1, Supporting information) and
those obtained with the pruned data set (N = 323) (Fig.
S2, Supporting information) were highly similar; we
therefore used the full data set for further analyses. The
DK value was the greatest at K = 4 (Fig. S3, Supporting
information; DK = 918, Pr|ln L = �13923). However, at
K = 4, the CTPs remained clustered with P. jishanensis
(Fig. 3 and S1, Supporting information). At K = 5, most
taxonomic species or subspecies (e.g. P. jishanensis,
P. rockii ssp. rockii and P. rockii ssp. atava), except
P. decomposita, which mingled within P. rockii ssp. rockii,
were assigned to distinct clusters in the main mode (i.e.
the clustering solution found in 90% of the simulation rep-
licates). In addition, a genetic structure appeared within
P. rockii ssp. rockii. No additional well-delimited clusters
corresponding to subdivisions of previous clusters were
detected beyond K = 5, except for a structure within
P. rockii ssp. atava and P. rockii ssp. rockii (Fig. 3 and Fig.
S1, Supporting information). Albeit intraspecies structure
was found, K = 5 appeared to be the clustering solution
that was most relevant to our questions aimed at deter-
mining the genetic differentiation of tree peony species.
At K ≥ 3, the cultivated CTPs and FTPs were clearly
assigned to different clusters, while the cultivated FTPs
and wild P. rockii ssp. atava were clustered together
(Fig. 3 and Fig. S1, Supporting information). At K = 4,
the CTPs and P. jishanensis remained assigned to the
same cluster. This result is in agreement with the PCA
results (Fig. 4), which show that the CTPs were distinct
from the FTPs, with the CTPs lying very close to
P. jishanensis and the FTPs appearing mingled within
P. rockii ssp. atava (Fig. 3). These results support the
hypothesis of independent origins of the two groups of
cultivars from distinct wild peony species.
Genetic differentiation (FST) between each cultivated
and each wild peony species or subspecies was signifi-
cant (P < 0.001). Paeonia decomposita appeared to be the
most differentiated from the other species (Table 2).
The lowest differentiation was found between the culti-
vated FTPs and wild P. rockii ssp. atava (FST = 0.05), in
agreement with the STRUCTURE and PCA plots
(Fig. 3,4 and S1; Supporting information). The CTPs
appeared closer to the FTPs (FST = 0.07), P. rockii ssp.
rockii (FST = 0.09) and P. rockii ssp. atava (FST = 0.11)
than to P. jishanensis (FST = 0.12) (Table 2).
Rare wild-to-crop and crop-to-crop hybridizationsduring recent cultivated tree peony history
The recent contribution of each wild tree peony species
to common or flare tree peonies was further investi-
gated by running STRUCTURE at K = 2 by pairs of spe-
cies, including CTPs or FTPs and each wild species or
subspecies (Fig. S4 and Tables S4, S5 and S6, Support-
ing information).
Table 1 Genetic polymorphism within the cultivated common
and flare tree peonies and the four wild peony species or sub-
species
N HO HE FIS AR AP PNA
Paeonia
jishanensis
31 0.40 0.52 0.27*** 2.19 0.74 0.07
Paeonia
decomposita
11 0.36 0.33 �0.12*** 1.57 0.27 0.02
Paeonia rockii
ssp. rockii
275 0.50 0.72 0.31*** 2.51 1.03 0.13
Paeonia rockii
ssp. atava
61 0.45 0.58 0.25*** 2.31 0.46 0.08
FTP 103 0.58 0.66 0.14*** 2.53 0.44 0.05
CTP 72 0.61 0.66 0.08*** 2.54 0.60 0.03
N: sample size; HO and HE: observed and expected heterozyg-
osities, respectively; FIS: inbreeding coefficient; AR and AP: alle-
lic richness and private allelic richness, respectively, averaged
across loci estimated by rarefaction using a standardized sam-
ple size of four; PNA: proportion of null alleles; FTP: flare tree
peony, CTP: common tree peony.
***P-value < 0.0001.
© 2013 John Wiley & Sons Ltd
INDEPENDENT DOMESTICATIONS OF TREE PEONIES 7
1
2
3
4
5
6
7
8
9
10
11
12
13
14
15
16
17
18
19
20
21
22
23
24
25
26
27
28
29
30
31
32
33
34
35
36
37
38
39
40
41
42
43
44
45
46
47
48
49
50
51
52
53
54

At K = 2, all pairs of species were separated into two
well-delimited clusters, except the pair that included
the cultivated FTPs and P. rockii ssp. atava (Fig. S4b,
Supporting information); this pair showed a substruc-
ture within P. rockii ssp. atava. Further increasing K
failed to separate the FTPs and P. rockii ssp. atava (Fig.
S4b, Supporting information).
Some rare footprints of introgression were detected
between cultivated and wild species (admixed individu-
als in Fig. S4a and S4b and Tables S5 and S6, Supporting
K = 2
K = 3
K = 4
K = 5
K = 6
K = 7
K = 8
P. jish
anensis
P.decomposit
a
P. rock
i ssp
. rock
iii
P. rock
ii ssp
. atava
Flare t
ree peo
ny
(FTP)
Common tree
peony
(CTP)
Fig. 3 Proportions of ancestry of cultivated common tree peonies, flare tree peonies and the four wild tree peony species or subspe-
cies genotypes (N = 553) obtained using K = 2 to K = 8 ancestral gene pools (‘clusters’) inferred with STRUCTURE. Each individual
is represented by a vertical bar partitioned into K segments representing the amount of ancestry of its genome in K clusters. Where
several clustering solutions (‘modes’) were represented within replicate runs, the proportion of simulations represented by each
mode is given in Fig. S1.
PC
2 (
7.3
1%
)
PC 1 ( 9.14%)
–2
–4
–6
–8
0
2
4
6
8
–2–4–6–8 1086420–10
P. rockii ssp. rockiiP. jishanensis Common tree peony (CTP)P. rockii ssp. atava Flare tree peony (FTP) P. decomposita
Fig. 4 The first two axes of a principal component analysis representing the microsatellite data obtained from two cultivated groups,
the common tree peony (CTP, red) and the flare tree peony (FTP, purple), and from the four allopatric wild species or subspecies,
Paeonia decomposita (blue), Paeonia jishanensis (yellow), Paeonia rockii ssp. rockii (green) and Paeonia rockii ssp. atava (pink).
COLOR
COLOR
© 2013 John Wiley & Sons Ltd
8 J . - H. YUAN ET AL.
1
2
3
4
5
6
7
8
9
10
11
12
13
14
15
16
17
18
19
20
21
22
23
24
25
26
27
28
29
30
31
32
33
34
35
36
37
38
39
40
41
42
43
44
45
46
47
48
49
50
51
52
53
54
information) and also between the two cultivated groups,
CTPs and FTPs (admixed individuals in Fig. S4c and
Tables S5 and S6, Supporting information).
Modelling the domestication history of common andflare tree peonies
We used ABC to statistically determine which of the
three models (Fig. 2) assuming alternative domestica-
tion histories of the cultivated CTPs and FTPs was the
most likely. The relative posterior probabilities (P) cal-
culated for each model provided the strongest statistical
support for model b, suggesting that FTPs and CTPs
were domesticated independently (Bayes factor for
model b = 18.4, Table 3). The model that assumed a sin-
gle domestication event of FTPs/CTPs from P. jishanen-
sis had the lowest relative posterior probability
(Table 3). For model b, we obtained estimates of effec-
tive population sizes of 16,737 [95% confidence interval:
608–242,674] for NPJ, 53,047 [4639–252,751] for NPRR,
44,977 [4638–254,751] for NPRA, 53,046 [8,654–363,703]
for NFTP and 32,874 [4639–367,723] for NCTP. Using a
generation time of 5 years, P. jishanensis and P. rockii
ssp. rockii diverged 220,297 years ago (TPJ-PRR, [96,538–
247,518]), P. jishanensis and P. rockii ssp. atava diverged
139,574 years ago (TPJ-PRA, [39,300–224,806]) and CTPs
and FTPs diverged independently from P. jishanensis
and P. rockii ssp. atava 74,931 and 35,168 years ago,
respectively (TPJ-CTP/TPRA-FTP, [14,978–177,337] and [2514
–118,057], respectively). The estimated mutation rate
per generation was l = 0.001 [1e�3–3e�3]. We used 1000
pseudo-observed data sets to check the coverage prop-
erty of the marginal posterior distributions estimated
with our approach. As seen from the histograms of the
posterior quantiles, the marginal posterior distributions
were slightly overestimated on average (Fig. S5, Sup-
porting information). These estimations should there-
fore be regarded with caution, particularly the
divergence time estimations that presented biased pos-
terior distributions. However, the observed values fell
within the simulated data (P = 0.35), suggesting that
the assumed model is capable of reproducing the
observed summary statistics (the 8 PLS components, in
our case).
We checked that the power of the analysis was suffi-
cient to discriminate between the competing models.
For model b against the other two models, the type I
error rate was 0.22 and the mean type II error rate was
0.20. Overall, ABC analyses provided strong support for
the independent domestication of CTPs and FTPs from
P. jishanensis and P. rockii ssp. atava, respectively.
Discussion
Independent domestications of the common and flaretree peonies: a model of parallel and convergentevolution
In combination, the STRUCTURE and ABC analyses
presented here provide strong support for the hypothe-
sis of independent domestications of cultivated com-
mon and flare tree peony varieties in China from
different wild peony species, Paeonia jishanensis and
P. rockii ssp. atava, respectively. These findings are con-
sistent with the morphological features of the cultivated
groups (CTPs and FTPs) (Rehder 1920; Li 2005; Cheng
2007). The CTPs are dwarf shrubs less than one metre
in height; they are typically characterized by the pres-
ence of nine (often less than 15) leaflets per compound
leaf and red carpels and filaments, characteristics that
are very similar to those of wild P. jishanensis (Li 2005,
2011). The cultivated FTPs are taller than one metre,
usually have more than 15 leaflets per compound leaf
and display the yellowish or white carpels and
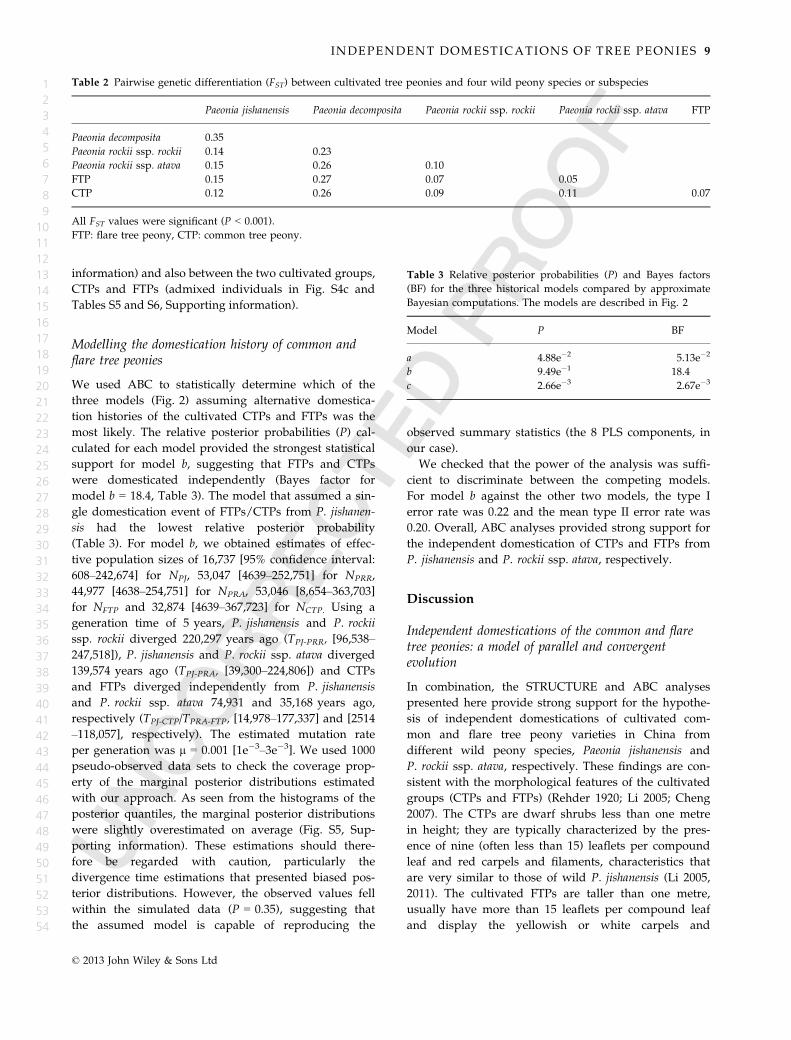
Table 2 Pairwise genetic differentiation (FST) between cultivated tree peonies and four wild peony species or subspecies
Paeonia jishanensis Paeonia decomposita Paeonia rockii ssp. rockii Paeonia rockii ssp. atava FTP
Paeonia decomposita 0.35
Paeonia rockii ssp. rockii 0.14 0.23
Paeonia rockii ssp. atava 0.15 0.26 0.10
FTP 0.15 0.27 0.07 0.05
CTP 0.12 0.26 0.09 0.11 0.07
All FST values were significant (P < 0.001).
FTP: flare tree peony, CTP: common tree peony.
Table 3 Relative posterior probabilities (P) and Bayes factors
(BF) for the three historical models compared by approximate
Bayesian computations. The models are described in Fig. 2
Model P BF
a 4.88e�2 5.13e�2
b 9.49e�1 18.4
c 2.66e�3 2.67e�3
© 2013 John Wiley & Sons Ltd
INDEPENDENT DOMESTICATIONS OF TREE PEONIES 9
1
2
3
4
5
6
7
8
9
10
11
12
13
14
15
16
17
18
19
20
21
22
23
24
25
26
27
28
29
30
31
32
33
34
35
36
37
38
39
40
41
42
43
44
45
46
47
48
49
50
51
52
53
54
filaments typically found in P. rockii ssp. atava (Cheng
et al. 2005; Li 2005; Cheng 2007). The allopatric distribu-
tions of the two wild contributors, P. jishanensis and
P. rockii ssp. atava, across China also point to indepen-
dent geographical domestications of cultivated tree peo-
nies. Together with the cultivated olive (Besnard &
Berville 2000; Breton et al. 2006; Besnard et al. 2013), this
study is one of the rare existing examples of docu-
mented independent geographical domestications in
perennial tree crops. Our results do not clearly define
the contribution of P. decomposita to flare tree peony
domestication because of the low numbers of samples
of this species in our survey. To answer this question,
further sampling that includes a subspecies studied by
Zhou (2007), that is, P. decomposita ssp. rotundiloba from
Maoxian County in Sichuan province, is needed.
The STRUCTURE results obtained in this study sup-
port a more recent domestication of FTPs than CTPs by
indicating little differentiation between FTPs and its
wild progenitor, P. rockii ssp. atava, in contrast to the
clear differentiation that was found between CTPs and
P. jishanensis. Although the ABC estimations of diver-
gence time sensus stricto of CTPs and FTPs from their
respective progenitors should be regarded with caution,
the estimated divergence time between P. rockii ssp.
atava and FTPs was half the time of CTPs from P. jishan-
ensis. Together, the genetic findings are in accordance
with historical clues suggesting that domestication of
FTPs may be more recent than domestication of CTPs.
Traditional CTP cultivars were referred to as ‘the king of
flowers’ in the Tang Dynasty (approximately 627–850)
(Li 2005, 2011), while the FTPs were developed later dur-
ing the Ming to the Qing Dynasties (around 1398–1797)
(Cheng et al. 2005; Li 2011).
Despite their independent domestications, FTP and
CTP cultivars share a common domestication syndrome
with respect to the number and size of flowers (multiple
vs. single in wild species) and the number and colours
of the petals (colourful, e.g., patchy white, pink, purple
and red vs. mostly white in wild species or subspecies).
Cultivated tree peonies thus represent an interesting
case of parallel and convergent evolution, with similar
phenotypes in the two groups despite their independent
domestication from different locations and different spe-
cies. The relatively recent domestication of tree peonies
and the fact that they display a strong syndrome with
respect to a few traits provides a good model for study-
ing the genes and processes involved in adaptation
(Hohenlohe et al. 2010). In addition, this study suggests
that future studies targeting the genes involved in the
marked domestication syndrome are warranted.
In contrast to previous suggestions (Zhou 2007), we
show here that hybridizations have not been a major
force in shaping the genomics of cultivated tree peonies.
The low level of gene flow between CTPs and FTPs and
between cultivated and wild tree peonies contrasts with
the pattern found in other cultivated fruit tree crops,
which experience frequent wild-to-crop gene flow and
vice versa (Duputie et al. 2007; Miller & Gross 2011;
Cornille et al. 2012, 2013; Delplancke et al. 2012).
Although tree peonies are outcrossing species, they can
be vegetatively propagated, more easily than fruit trees
that require grafting. Early propagation by clonality
may have prevented introgression between wild and
cultivated peonies. The lack of widespread clonal struc-
ture found is due to our sampling scheme, which was
designed to avoid the use of multiple samples from a
given variety.
Moderate but higher genetic diversity in cultivatedpeonies than in wild peony species: implications for theconservations of genetic resources and future breedingprogrammes
As a human-mediated evolutionary process, domestica-
tion impacts contemporary patterns of genetic variation
in cultivated populations. The moderate level of genetic
diversity estimated in cultivated and wild tree peony
species in this study is consistent with findings from
previous studies (Pei et al. 1995; Zou et al. 1999; Meng
& Zheng 2004; Yuan et al. 2010, 2011, 2012; Zhang et al.
2011). No clear footprints of recent genetic bottlenecks
were detected in cultivated peonies in this study. In
particular, the genetic diversity of the cultivated CTPs
and FTPs appeared higher than the diversity of their
wild progenitors, P. jishanensis and P. rockii ssp. atava.
This unexpected result is not due to introgression in
cultivated tree peonies as introgression events were
found to be rare, nor is it due to undersampling,
because we have well covered the present-day distribu-
tion of these wild peony species. Genetic bottlenecks
are expected to occur during domestication, and the
allelic diversity in domesticated species is expected to
be a subset of that found in their wild progenitors
(Gross & Olsen 2010). Footprints of bottlenecks have
been reported in several annual seed-propagated crops,
such as maize, wheat, soybean and sunflower (Tenaillon
et al. 2004; Hyten et al. 2006; Liu & Burke 2006; Haudry
et al. 2007). Long generation times and overlapping gen-
erations in trees can reduce the occurrence of domesti-
cation bottlenecks (Austerlitz et al. 2000). The particular
breeding system of cultivated trees may also limit the
loss of genetic diversity due to selection; as with apples
(Cornille et al. 2012), many cultivated tree peonies have
been selected from seedlings derived from open pollina-
tion in gardens.
In contrast to the lack of recent genetic bottlenecks in
cultivated tree peonies, a bottleneck footprint has
© 2013 John Wiley & Sons Ltd
10 J . - H . YUAN ET AL.
1
2
3
4
5
6
7
8
9
10
11
12
13
14
15
16
17
18
19
20
21
22
23
24
25
26
27
28
29
30
31
32
33
34
35
36
37
38
39
40
41
42
43
44
45
46
47
48
49
50
51
52
53
54
occurred in a few populations of wild tree peonies. The
lower diversity of wild tree peony species or subspe-
cies, such as P. rockii ssp. atava and P. jishanensis, com-
pared to cultivated peonies is likely due to their
distribution decreasing in extent during recent decades
because of habitat change caused by natural factors and
human overexploitation (Li 2005; Hong 2010; Yuan et al.
2011, 2012). Several wild peony species have been listed
as rare and endangered taxa in the Red Book of Chinese
Plant Species (Fu 1992). In contrast, the diversity in
domestic cultivars is maintained by vegetative propaga-
tion that occurs as part of agricultural activity. Continu-
ous habitat destruction and fragmentation in wild tree
peonies is expected to result in smaller and more iso-
lated populations, raising the inbreeding coefficient at
the species level and further increasing the risk of pop-
ulation extinction, as reported for P. rockii (Cheng 2007;
Yuan et al. 2011, 2012). Given the low genetic diversity
and fragmentation of wild populations, more efficient
and stringent conservation policies should be estab-
lished for wild tree peonies to maintain their genetic
variation as a resource for future breeding programmes.
Conclusion
This study provides the first example of the indepen-
dent domestications of perennial tree crops and illus-
trates the complexity of the process of domestication of
such crops, which can involve contributions to the
genetic makeup of cultivated tree genomes from multi-
ple species, populations and locations (Myles et al. 2010;
Cornille et al. 2012; Besnard et al. 2013). The results of
this study also provide crucial insights into the domes-
tication history of some of the most famous ornamental
trees, the peonies, that are valuable for improving cur-
rent tree peony breeding strategies. Future research
requires extending the investigation of the origin of the
worldwide peony gene pool far from its centre of origin
in China.
The parallel and convergent evolution of cultivated
tree peonies represents an interesting case study for
understanding the mechanisms of domestication, diver-
sification and adaptation in plants. Future studies focus-
ing on adaptive genetic variation in tree peonies will
likely yield important insights into the processes of evo-
lution. It would be interesting for instance to determine
whether the same genes, or even the same mutations,
are involved in the traits shared by the FTPs and CTPs.
Acknowledgements
We thank Myriam Heuertz and two referees for comments on
a previous version of this manuscript. We also deeply thank
Mr. Jiajue Li, Mr. Xingyun Cheng, Mrs. Yialing Tian, Dr. Jia
Wang, Mr. Jianhong Wang and others for their help with the
sample collections. We thank Dr. Shi-Liang Zhou for kindly
providing the experimental platform. This study was funded
by the National Natural Science Foundation of China (No.
31171984 and 31070617) and Technologies R&D Program of
Shanghai (10391901200).
References
Arnaud-Haond S, Belkhir K (2007) GENCLONE: a computer
program to analyze genotypic data, test for clonality and
describe spatial clonal organization. Molecular Ecology Notes,
7, 15–17.
Austerlitz F, Mariette S, Machon N, Gouyon PH, Godelle B
(2000) Effects of colonization processes on genetic diversity:
Differences between annual plants and tree species. Genetics,
154, 1309–1321.
Besnard G, Berville A (2000) Multiple origins for Mediterranean
olive (Olea europaea L-ssp europaea) based upon mitochondrial
DNA polymorphisms. Comptes Rendus De l’Academie Des
Sciences Serie Iii-Sciences De La Vie-Life Sciences, 323, 173–181.
Besnard G, Khadari B, Navascues M et al. (2013) The complex
history of the olive tree: from Late Quaternary diversification
of Mediterranean lineages to primary domestication in the
northern Levant. Proceedings Biological sciences/The Royal Soci-
ety, 280, 2012–2833.
Bitocchi E, Nanni L, Bellucci E et al. (2012) Mesoamerican ori-
gin of the common bean (Phaseolus vulgaris L.) is revealed by
sequence data. Proceedings of the National Academy of Sciences,
USA, 109, E788–E796.
Bitocchi E, Bellucci E, Giardini A et al. (2013) Molecular analy-
sis of the parallel domestication of the common bean (Phaseo-
lus vulgaris) in Mesoamerica and the Andes. New Phytologist,
197, 300–313.
Blackman BK, Scascitelli M, Kane NC et al. (2011) Sunflower
domestication alleles support single domestication center in
eastern North America. Proceedings of the National Academy of
Sciences, USA, 108, 14360–14365. 11
Breton C, Medail F, Pinatel C, Berville A (2006) From olive tree
to oleaster: origin and domestication of Olea europaea L. in
the Mediterranean basin. Cahiers Agricultures, 15, 329–336.
Chacon MI, Pickersgill B, Debouck DG (2005) Domestication
patterns in common bean (Phaseolus vulgaris L.) and the ori-
gin of the Mesoamerican and Andean cultivated races. Theo-
retical and Applied Genetics, 110, 432–444.
Cheng FY (2007) Advances in the breeding of tree peonies and
a cultivar system for the cultivar group. International Journal
of Plant Breeding, 1, 89–104.
Cheng FY, Li JJ, Chen DZ, Zhang ZS (2005) Chinese Flare Tree
Peonies. Chinese forestry publishing house, Beijing.
Cornille A, Gladieux P, Smulders MJ et al. (2012) New insight
into the history of domesticated apple: secondary contribu-
tion of the European wild apple to the genome of cultivated
varieties. PLoS Genetics, 8, e1002703.
Cornille A, Giraud T, Bellard C et al. (2013) Postglacial recolon-
ization history of the European crabapple (Malus sylvestris
Mill.), a wild contributor to the domesticated apple. Molecu-
lar Ecology, 22, 2249–2263.
Cornuet JM, Luikart G (1996) Description and power analysis
of two tests for detecting recent population bottlenecks from
allele frequency data. Genetics, 144, 2001–2014.
© 2013 John Wiley & Sons Ltd
INDEPENDENT DOMESTICATIONS OF TREE PEONIES 11
1
2
3
4
5
6
7
8
9
10
11
12
13
14
15
16
17
18
19
20
21
22
23
24
25
26
27
28
29
30
31
32
33
34
35
36
37
38
39
40
41
42
43
44
45
46
47
48
49
50
51
52
53
54

Delplancke M, Alvarez N, Esp�ındola A et al. (2012) Gene flow
among wild and domesticated almond species: insights from
chloroplast and nuclear markers. Evolutionary Applications, 5,
317–329.
Delplancke M, Alvarez N, Benoit L et al. (2013) Evolutionary
history of almond tree domestication in the Mediterranean
basin. Molecular Ecology, 22, 1092–1104.12
Diamond J (2002) Evolution, consequences and future of plant
and animal domestication. Nature, 418, 700–707.
Duputie A, David P, Debain C, McKey D (2007) Natural
hybridization between a clonally propagated crop, cassava
(Manihot esculenta Crantz) and a wild relative in French
Guiana. Molecular Ecology, 16, 3025–3038.
Estoup A, Jarne P, Cornuet JM (2002) Homoplasy and muta-
tion model at microsatellite loci and their consequences for
population genetics analysis. Molecular Ecology, 11,
1591–1604.
Evanno G, Regnaut S, Goudet J (2005) Detecting the number of
clusters of individuals using the software STRUCTURE: a
simulation study. Molecular Ecology, 14, 2611–2620.
Excoffier L, Foll M (2011) Fastsimcoal: a continuous-time coa-
lescent simulator of genomic diversity under arbitrarily com-
plex evolutionary scenarios. Bioinformatics, 27, 1332–1334.
Excoffier L, Lischer HEL (2010) Arlequin suite ver 3.5: a new
series of programs to perform population genetics analyses
under Linux and Windows. Molecular Ecology Resources, 10,
564–567.
Falush D, Stephens M, Pritchard JK (2003) Inference of popula-
tion structure using multilocus genotype data: linked loci
and correlated allele frequencies. Genetics, 164, 1567–1587.
Flowers JM, Molina J, Rubinstein S, Huang P, Schaal BA, Puru-
gganan MD (2012) Natural selection in gene-dense regions
shapes the genomic pattern of polymorphism in wild and
domesticated rice. Molecular Biology and Evolution, 29,
675–687.13
Foster S, Yue CX (1992) Herbal Emissaries: Bringing Chinese
Herbs to the West. Healing Arts Press, Rochester, Vermont.
Fu LG (1992) Chinese red Data Book: Rare and Endangered Plants.
Science Press, Beijing.
Gl�emin S, Bataillon T (2009) A comparative view of the evolu-
tion of grasses under domestication. New Phytologist, 183,
273–290.
Goldstein DB, Linares AR, Cavallisforza LL, Feldman MW
(1995) Genetic absolute dating based on microsatellites and
the origin of modern Humans. Proceedings of the National
Academy of Sciences, USA, 92, 6723–6727.
Gross BL, Olsen KM (2010) Genetic perspectives on crop
domestication. Trends in Plant Science, 15, 529–537.
Haudry A, Cenci A, Ravel C et al. (2007) Grinding up wheat: a
massive loss of nucleotide diversity since domestication.
Molecular Biology and Evolution, 24, 1506–1517.
He Z, Zhai W, Wen H et al. (2011) Two evolutionary histories
in the genome of rice: the roles of domestication genes. PLoS
Genetics, 7, e1002100.14
Hohenlohe PA, Bassham S, Etter PD, Stiffler N, Johnson EA,
et al. (2010) Population genomics of parallel adaptation in
threespine stickleback using sequenced RAD tags. PLoS
Genetics, 6, e1000862.
Hong DY (2010) Peonies of the World, Taxonomy and Phytogeogra-
phy. Royal Botanical Gardens Kew, London; Missouri Botani-
cal Garden, St. Louis.
Hufford MB, Xu X, Heerwaarden J et al. (2012) Comparative
population genomics of maize domestication and improve-
ment. Nature Genetics, 44, 808–811. 15
Hyten DL, Song Q, Zhu Y et al. (2006) Impacts of genetic bot-
tlenecks on soybean genome diversity. Proceedings of the
National Academy of Sciences, USA, 103, 16666–16671.
Kiani M, Zamani Z, Khalighi A, Fatahi R, Byrne DH (2010)
Microsatellite analysis of Iranian Damask rose (Rosa damasce-
na Mill.) germplasm. Plant Breeding, 129, 551–557. 16
Leuenberger C, Wegmann D (2010) Bayesian computation and
model selection without likelihoods. Genetics, 184, 243–252.
Li JJ (1998) Study on the origin of peonies in China. Journal of
Beijing Forestry University, 20, 22–26.
Li JJ (2005) Chinese Tree Peony (Xibei, Xinan, Jiangnan Volume).
China Forestry Publishing House, Beijing.
Li JJ (2011) Tree Peony of China. Encyclopedia of China Publish-
ing House, Beijing.
Li YH, Li W, Zhang C et al. (2010) Genetic diversity in domes-
ticated soybean (Glycine max) and its wild progenitor (Glycine
soja) for simple sequence repeat and single-nucleotide poly-
morphism loci. New Phytologist, 188, 242–253. 17
Liu A, Burke JM (2006) Patterns of nucleotide diversity in wild
and cultivated sunflower. Genetics, 173, 321–330.
Londo JP, Chiang YC, Hung KH, Chiang TY, Schaal BA (2006)
Phylogeography of Asian wild rice, Oryza rufipogon, reveals
multiple independent domestications of cultivated rice,
Oryza sativa. Proceedings of the National Academy of Sciences,
USA, 103, 9578–9583.
Luikart GL, Allendof FW, Cornuet JM, Sherwin WB (1998) Dis-
tortion of allele frequency distributions provides a test for
recent population bottlenecks. Journal of Heredity, 89,
238–247.
Lynch M, Ritland K (1999) Estimation of pairwise relatedness
with molecular markers. Genetics, 152, 1753–1766.
Matsuoka Y, Vigouroux Y, Goodman MM, Sanchez GJ, Buckler
E, Doebley J (2002) A single domestication for maize shown
by multilocus microsatellite genotyping. Proceedings of the
National Academy of Sciences, USA, 99, 6080–6084. 18
Meng L, Zheng GS (2004) Phylogenetic relationship analysis
among Chinese wild species and cultivars of Paeonia sect.
Moutan using RAPD markers. Scientia Silvae Sinicae, 40,
110–115.
Mevik BH, Wehrens R (2007) The pls package: principal com-
ponent and partial least squares regression in R. Journal of
Statistical Software, 18, ?????–?????. 19
Miller AJ, Gross BL (2011) From forest to field: perennial fruit
crop domestication. American Journal of Botany, 98,
1389–1414.
Molina J, Sikora M, Garud N et al. (2011) Reply to Ge and
Sang: a single origin of domesticated rice. Proceedings of the
National Academy of Sciences, USA, 108, E756–E756. 20;2120;21
Morrell PL, Clegg MT (2007) Genetic evidence for a second
domestication of barley (Hordeum vulgare) east of the Fertile
Crescent. Proceedings of the National Academy of Sciences, USA,
104, 3289–3294.
Morrell PL, Buckler ES, Ross-Ibarra J (2011) Crop genomics:
advances and applications. Nature Reviews Genetics, 13,
85–96. 22
Myles S, Boyko AR, Browna PJ et al. (2010) Genetic structure
and domestication history of the grape. Proceedings of the
National Academy of Sciences, USA, 108, 3530–3535.
© 2013 John Wiley & Sons Ltd
12 J . - H . YUAN ET AL.
1
2
3
4
5
6
7
8
9
10
11
12
13
14
15
16
17
18
19
20
21
22
23
24
25
26
27
28
29
30
31
32
33
34
35
36
37
38
39
40
41
42
43
44
45
46
47
48
49
50
51
52
53
54
Peakall R, Smouse PE (2012) GenAlEx 6.5: genetic analysis in
Excel. Population genetic software for teaching and research-
an update. Bioinformatics, 28, 2537–2539.
Pei YL, Zou Y, Yin Z, Wang XQ, Zhang ZX, Hong DY (1995)
Preliminary report of RAPD analysis in Paeonia suffruticosa
subsp. spontanea and Paeonia rockii. Acta Phototaxonomica Sini-
ca, 33, 350–356.
Piry S, Luikart G, Cornuet JM (1999) BOTTLENECK: a com-
puter program for detecting recent reductions in the effective
population size using allele frequency data. Journal of Hered-
ity, 90, 502–503.
Pritchard JK, Stephens M, Donnelly P (2000) Inference of popu-
lation structure using multilocus genotype data. Genetics,
155, 945–959.
Rehder A (1920) Paeonia suffruticosa var. spontanea. Journal of the
Arnold Arboretum, 1, 193–194.
Roullier C, Benoit L, McKey DB, Lebot V (2013) Historical col-
lections reveal patterns of diffusion of sweet potato in Ocea-
nia obscured by modern plant movements and
recombination. Proceedings of the National Academy of Sciences,
USA, 110, 2205–2210.
Rousset F (2008) genepop’007: a complete re-implementation of
the genepop software for Windows and Linux. Molecular
Ecology Resource, 8, 103–106.
Schwacke L, Rosel P (2005) RE-RAT: relatedness estimation
and rarefaction analysis tool, url: http://people.musc.edu/
~schwaclh/.
St Onge KR, Palme AE, Wright SI, Lascoux M (2012) Impact of
sampling schemes on demographic inference: an empirical
study in two species with different mating systems and demo-
graphic histories. G3: Genes, Genomes, Genetics, 2, 803–814.
Szpiech ZA, Jakobsson M, Rosenberg NA (2008) ADZE: a rare-
faction approach for counting alleles private to combinations
of populations. Bioinformatics, 24, 2498–2504.
Tellier F, Tapia J, Faugeron S, Destombe C, Valero M (2011) The
Lessonia nigrescens species complex (Laminariales, Phaeophy-
ceae) shows strict parapatry and complete reproductive isolation
in a secondary contact zone. Journal of Phycology, 47, 894–903.23
Tenaillon MI, U’Ren J, Tenaillon O, Gaut BS (2004) Selection
versus demography: a multilocus investigation of the domes-
tication process in maize. Molecular Biology and Evolution, 21,
1214–1225.
Tian F, Stevens NM, Buckler ES (2009) Tracking footprints of
maize domestication and evidence for a massive selective
sweep on chromosome 10. Proceedings of the National Academy
of Sciences, USA, 106, 9979–9986.24
Van Oosterhout C, Hutchinson WF, Wills DPM, Shipley P
(2004) Micro-checker: software for identifying and correcting
genotyping errors in microsatellite data. Molecular Ecology
Notes, 4, 535–538.
Wang LY (1998) Chinese Tree Peony. Chinese Forestry Publish-
ing House, Beijing.
Wang JX, Xia T, Zhang JM, Zhou SL (2008) Isolation and char-
acterization of fourteen microsatellites from a tree peony
(Paeonia suffruticosa). Conservation Genetics, 10, 1029–1031.
Wegmann D, Leuenberger C, Excoffier L (2009) Efficient approx-
imate Bayesian computation coupled with Markov Chain
Monte Carlo without likelihood. Genetics, 182, 1207–1218.
Wegmann D, Leuenberger C, Neuenschwander S, Excoffier L
(2010) ABCtoolbox: a versatile toolkit for approximate Bayes-
ian computations. BMC Bioinformatics, 11, 116.
Weir BS, Cockerham CC (1984) Covariances of relatives stem-
ming from a population undergoing mixed self and random
mating. International Biometric Society, 40, 157–164.
Westengen O, Huaman Z, Heun M (2005) Genetic diversity and
geographic pattern in early South American cotton domestica-
tion. Theoretical and Applied Genetics, 110, 392–402.
Williamson-Natesan EG (2005) Comparison of methods for
detecting bottlenecks from microsatellite loci. Conservation
Genetics, 6, 551–562.
Wills DM, Burke JM (2006) Chloroplast DNA variation con-
firms a single origin of domesticated sunflower (Helianthus
annuus L.). Journal of Heredity, 97, 403–408. 25
Wincker P (2013) Genomics and fruit crop selection. Nature
Genetics, 45, 9–10.
Wister JC (1995) The Peonies (2nd printing). American Peony
Society, Hopkins, Minnesota, pp. 140–173.
Yang CC, Kawahara Y, Mizuno H, Wu J, Matsumoto T, Itoh T
(2012) Independent domestication of Asian rice followed by
gene flow from japonica to indica. Molecular Biology and Evolu-
tion, 29, 1471–1479. 26
Yuan JH, Cheng FY, Zhou SL (2010) Hybrid origin of Paeonia
9yananensis revealed by microsatellite markers, chloroplast
gene sequences, and morphological characteristics. Interna-
tional Journal of Plant Sciences, 171, 409–420.
Yuan JH, Cheng FY, Zhou SL (2011) The phylogeographic struc-
ture and conservation genetics of the endangered tree peony,
Paeonia rockii (Paeoniaceae), inferred from chloroplast gene
sequences. Conservation Genetics, 12, 1539–1549.
Yuan JH, Cheng FY, Zhou SL (2012) Genetic structure of the
tree Peony (Paeonia rockii) and the Qinling Mountains as a
geographic barrier driving the fragmentation of a large pop-
ulation. PLoS ONE, 7, e34955.
Zhang JM, Liu J, Sun HL, Yu J, Wang JX, Zhou SL (2011)
Nuclear and chloroplast SSR markers in Paeonia delavayi
(Paeoniaceae) and cross-species amplification in P. ludlowii.
American Journal of Botany, 98, e346–e348.
Zhao X, Zhou ZQ, Pan KY, Hong DY, Li MY (2008) Phyloge-
netic analysis of Paeonia sect. Moutan (Paeoniaceae) based on
multiple DNA fragments and morphological data. Journal of
Systematic Evolution, 46, 1–10.
Zhou ZQ (2007) Study on the origin of cultivated tree Peonies,
Postdoc thesis, Institute of Botany of Chinese Academic of
Sciences, ???????. 27
Zou YP, Cai ML, Wang ZP (1999) Systematic studies on Paeonia
Sect. Moutan DC. based on RAPD analysis. Acta Phtotaxono-
mica Sinica, 37, 220–227.
J.Y. and F.C. conceived and designed the experiments
and provided samples; J.Y., F.C. and Y.H. obtained
funding; J.Y. performed the experiments; J.Y. and A.C.
analysed the data and contributed analysis tools; J.Y.,
A.C., T.G. and Y.F. wrote the article.
Data accessibility
Sampling locations and microsatellite genotypes are depos-
ited in the DRYAD repository, doi:10.5061/dryad.vk43j.
© 2013 John Wiley & Sons Ltd
INDEPENDENT DOMESTICATIONS OF TREE PEONIES 13
1
2
3
4
5
6
7
8
9
10
11
12
13
14
15
16
17
18
19
20
21
22
23
24
25
26
27
28
29
30
31
32
33
34
35
36
37
38
39
40
41
42
43
44
45
46
47
48
49
50
51
52
53
54

Supporting information
Additional supporting information may be found in the online ver-
sion of this article.
Fig. S1 The proportions of ancestry of genotypes of cultivated
common tree peonies, flare tree peonies and the four wild tree
peony species, Paeonia jishanensis, Paeonia rockii ssp. atava, Paeo-
nia rockii ssp. rockii and Paeonia decomposita (N = 553) from
K = 2 to K = 8 ancestral gene pools (‘clusters’) inferred with
the STRUCTURE program using the full data set. Each individ-
ual is represented by a vertical bar partitioned into K segments
representing the amount of ancestry of its genome in K clus-
ters. For cases in which several clustering solutions (‘modes’)
were represented within replicate runs, the proportion of simu-
lations represented by each mode is given.
Fig. S2 The proportions of ancestry of genotypes of cultivated
common tree peonies, flare tree peonies and the four wild tree
peony species, Paeonia jishanensis, Paeonia rockii ssp. atava, Paeo-
nia rockii ssp. rockii and Paeonia decomposita (N = 323) from
K = 2 to K = 8 ancestral gene pools (‘clusters’) inferred with
the STRUCTURE program using the pruned data set (i.e.
excluding clonal and related individuals). Each individual is
represented by a vertical bar partitioned into K segments rep-
resenting the amount of ancestry of its genome in K clusters.
Where several clustering solutions (‘modes’) were represented
within replicate runs, the proportion of simulations repre-
sented by each mode is given.
Fig. S3 Bayesian inference of the number of ancestral gene
pools (‘clusters’, DK) from cultivated common tree peonies,
flare tree peonies and the four wild tree peony species or sub-
species, Paeonia jishanensis, Paeonia rockii ssp. atava, Paeonia rock-
ii ssp. rockii and Paeonia decomposita (N = 553).
Fig. S4 The proportions of ancestry in two ancestral gene pools
inferred with the STRUCTURE program and based on the full
data sets for (a) the common tree peony (red, N = 72, left) and
(b) the flare tree peony (purple, N = 103, left) and each of four
wild tree peony species (right) and (c) for the common tree
peony (red, left) and the flare tree peony (purple, right). Details
are provided in Tables S6 and S7.
Fig. S5 Distribution of the posterior quantiles based on 1000
pseudo-observed data sets. P-values were computed with a
Kolmogorov–Smirnov test of uniformity of the posterior quan-
tile distribution.
Table S1 Description of the cultivated common tree peony,
flare tree peony and wild tree peony accessions analysed with
their geographic origins, providers, latitudes (N), longitudes
(E), altitudes and sampling sizes.
Table S2 Repeat motifs, annealing temperatures (Ta), primer
sequences and range of alleles detected for each of the 14 mi-
crosatellite loci.
Table S3 The genotypes of the 553 accessions at 14 microsatel-
lite loci.
Table S4 Genetic polymorphism within the cultivated common
and flare peonies and the four wild peony species or subspe-
cies at the population level.
Table S5 Mean membership coefficient and the a value at
K = 2 between (a) cultivated common tree peonies and (b) flare
tree peonies (Genepool 1) and each of the four wild tree peony
species or subspecies and (c) between the cultivated common
tree peonies and flare tree peonies determined using the
STRUCTURE program.
Table S6 The mean proportions of assignment to each of the
two ancestral gene pools in pairwise comparisons (K = 2)
including common tree peonies as Genepool 1 and each of the
four wild tree peony species or subspecies or flare tree peonies
as Genepool 2.
Table S7 The mean proportions of assignment to each of the
two ancestral gene pools in pairwise comparisons (K = 2)
including flare tree peonies as Genepool 1 and each of the four
wild tree peony species or subspecies or common tree peonies
as Genepool 2.
© 2013 John Wiley & Sons Ltd
14 J . - H . YUAN ET AL.
1
2
3
4
5
6
7
8
9
10
11
12
13
14
15
16
17
18
19
20
21
22
23
24
25
26
27
28
29
30
31
32
33
34
35
36
37
38
39
40
41
42
43
44
45
46
47
48
49
50
51
52
53
54

Author Query Form
Journal: MEC
Article: 12567
Dear Author,During the copy-editing of your paper, the following queries arose. Please respond to these by markingup your proofs with the necessary changes/additions. Please write your answers on the query sheet ifthere is insufficient space on the page proofs. Please write clearly and follow the conventions shown onthe attached corrections sheet. If returning the proof by fax do not write too close to the paper’s edge.Please remember that illegible mark-ups may delay publication.
Many thanks for your assistance.
Query reference Query Remarks
1 AUTHOR: Please identify and encircle the forename and surname of all
authors.
2 AUTHOR: Please provide full address details for affiliation “¶”.
3 AUTHOR: Please provide fax number for all corresponding authors.
4 AUTHOR: Gross & Olsen 2011 has not been included in the Reference List,
please supply full publication details.
5 AUTHOR: Iwata et al. 2000 has not been included in the Reference List,
please supply full publication details.
6 AUTHOR: Li 2006 has not been included in the Reference List, please supply
full publication details.
7 AUTHOR: Zhang et al. 2009 has been changed to Zhang et al. 2011 so that
this citation matches the Reference List. Please confirm that this is correct.
8 AUTHOR: Arnaud-Haond & Belkhir 2006 has been changed to Arnaud-
Haond and Belkhir 2007 so that this citation matches the Reference List.
Please confirm that this is correct.
9 AUTHOR: Garza & Willamson 2001 has not been included in the Reference
List, please supply full publication details.
10 AUTHOR: Wegmann (2009 and 2010) has been changed to Wegmann et al.
(2009, 2010) so that this citation matches the Reference List. Please confirm
that this is correct.
11 AUTHOR: Blackman et al. (2011) has not been cited in the text. Please indi-
cate where it should be cited; or delete from the Reference List.
12 AUTHOR: Please check author name “I Joly H” for reference Delplancke
et al. (2013).
13 AUTHOR: Flowers et al. (2012) has not been cited in the text. Please indicate
where it should be cited; or delete from the Reference List.

14 AUTHOR: He et al. (2011) has not been cited in the text. Please indicate
where it should be cited; or delete from the Reference List.
15 AUTHOR: Hufford et al. (2012) has not been cited in the text. Please indicate
where it should be cited; or delete from the Reference List.
16 AUTHOR: Kiani et al. (2010) has not been cited in the text. Please indicate
where it should be cited; or delete from the Reference List.
17 AUTHOR: Li et al. (2010) has not been cited in the text. Please indicate
where it should be cited; or delete from the Reference List.
18 AUTHOR: Matsuoka et al. (2002) has not been cited in the text. Please indi-
cate where it should be cited; or delete from the Reference List.
19 AUTHOR: Please provide the page range for reference Mevik and Wehrens
(2007).
20 AUTHOR: Please check page range for reference Molina et al. (2011).
21 AUTHOR: Molina et al. (2011) has not been cited in the text. Please indicate
where it should be cited; or delete from the Reference List.
22 AUTHOR: Morrell et al. (2011) has not been cited in the text. Please indicate
where it should be cited; or delete from the Reference List.
23 AUTHOR: Tellier et al. (2011) has not been cited in the text. Please indicate
where it should be cited; or delete from the Reference List.
24 AUTHOR: Tian et al. (2009) has not been cited in the text. Please indicate
where it should be cited; or delete from the Reference List.
25 AUTHOR: Wills and Burke (2006) has not been cited in the text. Please indi-
cate where it should be cited; or delete from the Reference List.
26 AUTHOR: Yang et al. (2012) has not been cited in the text. Please indicate
where it should be cited; or delete from the Reference List.
27 AUTHOR: Please provide the publisher Location for reference Zhou (2007).
28 AUTHOR: If you would like the figures in your article to appear as colour in
print, please promptly post or courier the completed hard copy of the Colour
Work Agreement Form (including payment information) to this mailing
address: Customer Services (OPI) John Wiley & Sons Ltd European Distribu-
tion CentreNew Era Estate, Oldlands Way Bognor Regis West Sussex PO22
9NQ The form and charge information can be found online at: http://onlineli-
brary.wiley.com/journal/10.1111/(ISSN)1365-294X/homepage/ForAuthors.htm.l

USING e-ANNOTATION TOOLS FOR ELECTRONIC PROOF CORRECTION
Required software to e-Annotate PDFs: Adobe Acrobat Professional or Adobe Reader (version 8.0 or
above). (Note that this document uses screenshots from Adobe Reader X)
The latest version of Acrobat Reader can be downloaded for free at: http://get.adobe.com/reader/
Once you have Acrobat Reader open on your computer, click on the Comment tab at the right of the toolbar:
1. Replace (Ins) Tool Î for replacing text.
Strikes a line through text and opens up a text
box where replacement text can be entered.
How to use it
‚ Highlight a word or sentence.
‚ Click on the Replace (Ins) icon in the Annotations
section.
‚ Type the replacement text into the blue box that
appears.
This will open up a panel down the right side of the document. The majority of
tools you will use for annotating your proof will be in the Annotations section,
rkevwtgf"qrrqukvg0"YgÓxg"rkemgf"qwv"uqog"qh"vjgug"vqqnu"dgnqy<
2. Strikethrough (Del) Tool Î for deleting text.
Strikes a red line through text that is to be
deleted.
How to use it
‚ Highlight a word or sentence.
‚ Click on the Strikethrough (Del) icon in the
Annotations section.
3. Add note to text Tool Î for highlighting a section
to be changed to bold or italic.
Highlights text in yellow and opens up a text
box where comments can be entered.
How to use it
‚ Highlight the relevant section of text.
‚ Click on the Add note to text icon in the
Annotations section.
‚ Type instruction on what should be changed
regarding the text into the yellow box that
appears.
4. Add sticky note Tool Î for making notes at
specific points in the text.
Marks a point in the proof where a comment
needs to be highlighted.
How to use it
‚ Click on the Add sticky note icon in the
Annotations section.
‚ Click at the point in the proof where the comment
should be inserted.
‚ Type the comment into the yellow box that
appears.

USING e-ANNOTATION TOOLS FOR ELECTRONIC PROOF CORRECTION
For further information on how to annotate proofs, click on the Help menu to reveal a list of further options:
5. Attach File Tool Î for inserting large amounts of
text or replacement figures.
Inserts an icon linking to the attached file in the
appropriate pace in the text.
How to use it
‚ Click on the Attach File icon in the Annotations
section.
‚ Enkem"qp"vjg"rtqqh"vq"yjgtg"{qwÓf"nkmg"vjg"cvvcejgf"file to be linked.
‚ Select the file to be attached from your computer
or network.
‚ Select the colour and type of icon that will appear
in the proof. Click OK.
6. Add stamp Tool Î for approving a proof if no
corrections are required.
Inserts a selected stamp onto an appropriate
place in the proof.
How to use it
‚ Click on the Add stamp icon in the Annotations
section.
‚ Select the stamp you want to use. (The Approved
stamp is usually available directly in the menu that
appears).
‚ Enkem"qp"vjg"rtqqh"yjgtg"{qwÓf"nkmg"vjg"uvcor"vq"appear. (Where a proof is to be approved as it is,
this would normally be on the first page).
7. Drawing Markups Tools Î for drawing shapes, lines and freeform
annotations on proofs and commenting on these marks.
Allows shapes, lines and freeform annotations to be drawn on proofs and for
comment to be made on these marks..
How to use it
‚ Click on one of the shapes in the Drawing
Markups section.
‚ Click on the proof at the relevant point and
draw the selected shape with the cursor.
‚ To add a comment to the drawn shape,
move the cursor over the shape until an
arrowhead appears.
‚ Double click on the shape and type any
text in the red box that appears.