increasing investment to improve basic education outcomes
TRANSCRIPT

Increasing Investment to Improve Basic Education Outcomes in the Philippines
This note is part of a series outlining analysis and results from the Philippines Public Expenditure Tracking and Quantitative Service Delivery Study conducted by the Department of Education and the World Bank with the support of the Australian Government through the Australia-World Bank Philippines Development Trust Fund.
IntroductionOver the last decade, the Government of the Philippines has embarked on an ambitious education reform program to ensure that all Filipinos have the opportunity to obtain the skills that they need to play a full and productive role in society. The government has backed up these reforms, particularly over the last five years, with substantial increases in investment in the sector. As a result, access to basic education has increased, particularly for the poorest households, and the overall learning environment has improved.
While these improvements have halted a long-term decline in education sector outcomes, significant challenges remain. In particular, the share of national income devoted to basic education has only recently returned to the levels of the early 2000s, and spending per student in the Philippines is still low compared to spending in other middle-income countries. These relatively low levels of spending per student are likely to have limited the scope of the improvements in education outcomes over the last decade. High school completion rates remain low compared with other countries in the region, and enrollment gaps among different socioeconomic groups persist. Stakeholders frequently express concerns about the quality of the education provided and about the level and breadth of skills that children possess when they leave school.
The purpose of this note is to investigate whether the recent increases in the financing for basic education have improved education outcomes and to identify any factors that may be constraining the effectiveness of public spending. It concludes that further increases in public spending will be needed if the government’s ambitious goals for the education sector for the next five years are to be achieved. However, increased investment will not be enough on its own. It will also be necessary to ensure that these resources are used effectively.
WWW.WORLDBANK.ORG/PH 1
Philippines Education Note JUNE 2016 | NO. 1
Pub
lic D
iscl
osur
e A
utho
rized
Pub
lic D
iscl
osur
e A
utho
rized
Pub
lic D
iscl
osur
e A
utho
rized
Pub
lic D
iscl
osur
e A
utho
rized
2 WWW.WORLDBANK.ORG/PH
Increasing Investment to Improve Basic Education Outcomes in the Philippines
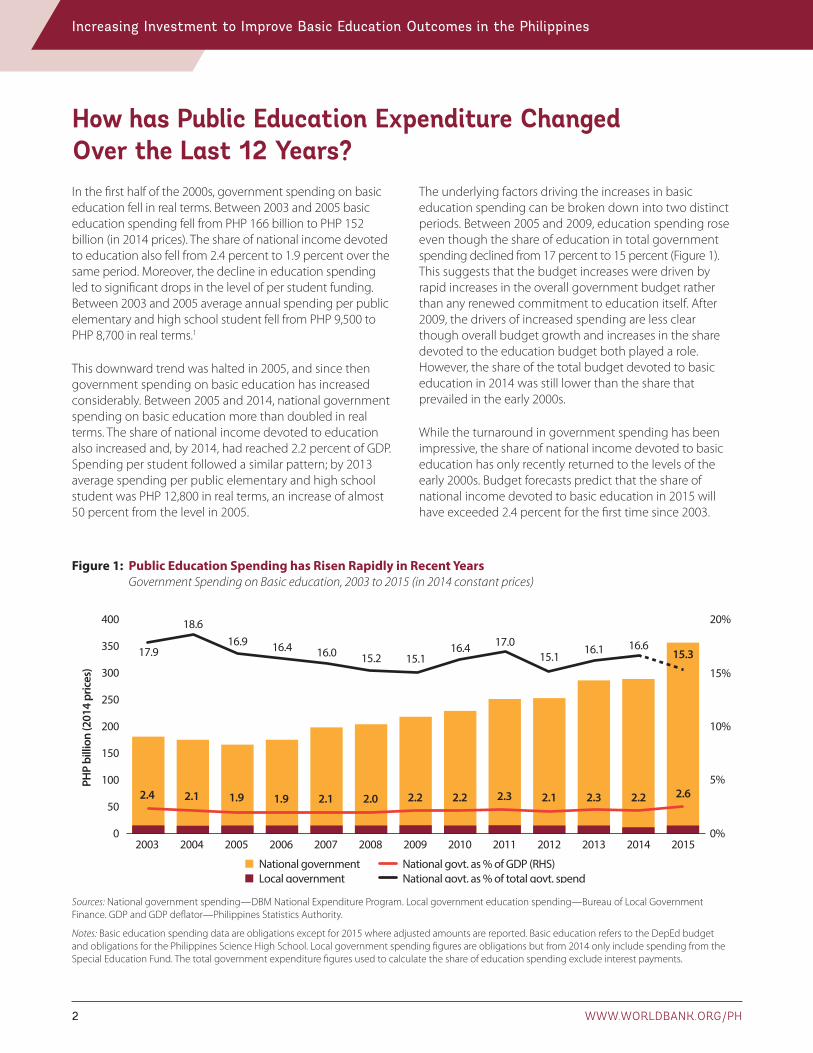
Figure 1: Public Education Spending has Risen Rapidly in Recent Years Government Spending on Basic education, 2003 to 2015 (in 2014 constant prices)
20%
15%
10%
5%
0%
400
350
300
250
200
150
100
50
02003 2004 2005 2006 2007 2008 2009 2010 2011 2012 2013 2014 2015
2.4 2.1 1.9 1.9 2.1 2.0 2.2 2.2 2.3 2.1 2.3 2.2 2.6
17.9
PHP
billi
on (2
014
pric
es)
18.616.9 16.4 16.0 15.2 15.1
16.4 17.015.1
16.1 16.615.3
National govt. as % of GDP (RHS)National govt. as % of total govt. spend
National governmentLocal government
Sources: National government spending—DBM National Expenditure Program. Local government education spending—Bureau of Local Government Finance. GDP and GDP deflator—Philippines Statistics Authority.
Notes: Basic education spending data are obligations except for 2015 where adjusted amounts are reported. Basic education refers to the DepEd budget and obligations for the Philippines Science High School. Local government spending figures are obligations but from 2014 only include spending from the Special Education Fund. The total government expenditure figures used to calculate the share of education spending exclude interest payments.
How has Public Education Expenditure Changed Over the Last 12 Years?In the first half of the 2000s, government spending on basic education fell in real terms. Between 2003 and 2005 basic education spending fell from PHP 166 billion to PHP 152 billion (in 2014 prices). The share of national income devoted to education also fell from 2.4 percent to 1.9 percent over the same period. Moreover, the decline in education spending led to significant drops in the level of per student funding. Between 2003 and 2005 average annual spending per public elementary and high school student fell from PHP 9,500 to PHP 8,700 in real terms.1
This downward trend was halted in 2005, and since then government spending on basic education has increased considerably. Between 2005 and 2014, national government spending on basic education more than doubled in real terms. The share of national income devoted to education also increased and, by 2014, had reached 2.2 percent of GDP. Spending per student followed a similar pattern; by 2013 average spending per public elementary and high school student was PHP 12,800 in real terms, an increase of almost 50 percent from the level in 2005.
The underlying factors driving the increases in basic education spending can be broken down into two distinct periods. Between 2005 and 2009, education spending rose even though the share of education in total government spending declined from 17 percent to 15 percent (Figure 1). This suggests that the budget increases were driven by rapid increases in the overall government budget rather than any renewed commitment to education itself. After 2009, the drivers of increased spending are less clear though overall budget growth and increases in the share devoted to the education budget both played a role. However, the share of the total budget devoted to basic education in 2014 was still lower than the share that prevailed in the early 2000s.
While the turnaround in government spending has been impressive, the share of national income devoted to basic education has only recently returned to the levels of the early 2000s. Budget forecasts predict that the share of national income devoted to basic education in 2015 will have exceeded 2.4 percent for the first time since 2003.
PHILIPPINES EDUCATION NOTE 3
Spending by local governments makes up only a small proportion of overall basic education spending in the Philippines and has not changed much in recent times (Figure 1).2 Local government spending mostly comes from the Special Education Fund (SEF), which is financed from a 1 percent surcharge on property taxes.3 Since 2003, local governments have contributed an annual average of PHP 16 billion in basic education funding, but since central government spending has increased rapidly over the same period, local government funding as a share of total education spending has declined rapidly. Between 2003 and 2014 the share of local government spending in total public education spending fell from 9 percent to 5 percent.
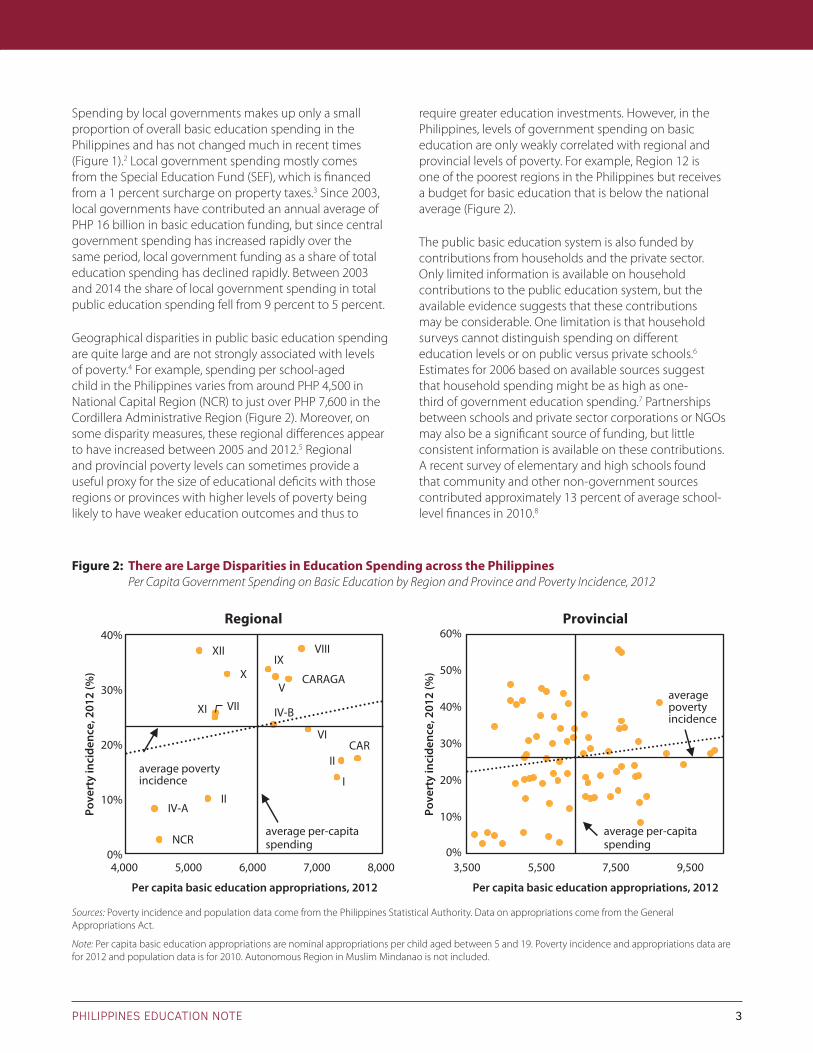
Geographical disparities in public basic education spending are quite large and are not strongly associated with levels of poverty.4 For example, spending per school-aged child in the Philippines varies from around PHP 4,500 in National Capital Region (NCR) to just over PHP 7,600 in the Cordillera Administrative Region (Figure 2). Moreover, on some disparity measures, these regional differences appear to have increased between 2005 and 2012.5 Regional and provincial poverty levels can sometimes provide a useful proxy for the size of educational deficits with those regions or provinces with higher levels of poverty being likely to have weaker education outcomes and thus to
require greater education investments. However, in the Philippines, levels of government spending on basic education are only weakly correlated with regional and provincial levels of poverty. For example, Region 12 is one of the poorest regions in the Philippines but receives a budget for basic education that is below the national average (Figure 2).
The public basic education system is also funded by contributions from households and the private sector. Only limited information is available on household contributions to the public education system, but the available evidence suggests that these contributions may be considerable. One limitation is that household surveys cannot distinguish spending on different education levels or on public versus private schools.6 Estimates for 2006 based on available sources suggest that household spending might be as high as one-third of government education spending.7 Partnerships between schools and private sector corporations or NGOs may also be a significant source of funding, but little consistent information is available on these contributions. A recent survey of elementary and high schools found that community and other non-government sources contributed approximately 13 percent of average school-level finances in 2010.8
Figure 2: There are Large Disparities in Education Spending across the Philippines Per Capita Government Spending on Basic Education by Region and Province and Poverty Incidence, 2012
Regional Provincial
I
II
IIIV-A
IV-B
V
VI
VIIIIX
X
XII
CARAGA
CAR
NCR0%
10%
20%
30%
40%
4,000
Pove
rty
inci
denc
e, 2
012
(%)
average povertyincidence
10%
0%
20%
30%
40%
50%
60%
3,500 5,500 7,500 9,500
averagepovertyincidence
5,000 6,000 7,000 8,000
Per capita basic education appropriations, 2012
average per-capitaspending
average per-capitaspending
VIIXI
Pove
rty
inci
denc
e, 2
012
(%)
Per capita basic education appropriations, 2012
Sources: Poverty incidence and population data come from the Philippines Statistical Authority. Data on appropriations come from the General Appropriations Act.
Note: Per capita basic education appropriations are nominal appropriations per child aged between 5 and 19. Poverty incidence and appropriations data are for 2012 and population data is for 2010. Autonomous Region in Muslim Mindanao is not included.
4 WWW.WORLDBANK.ORG/PH
Increasing Investment to Improve Basic Education Outcomes in the Philippines
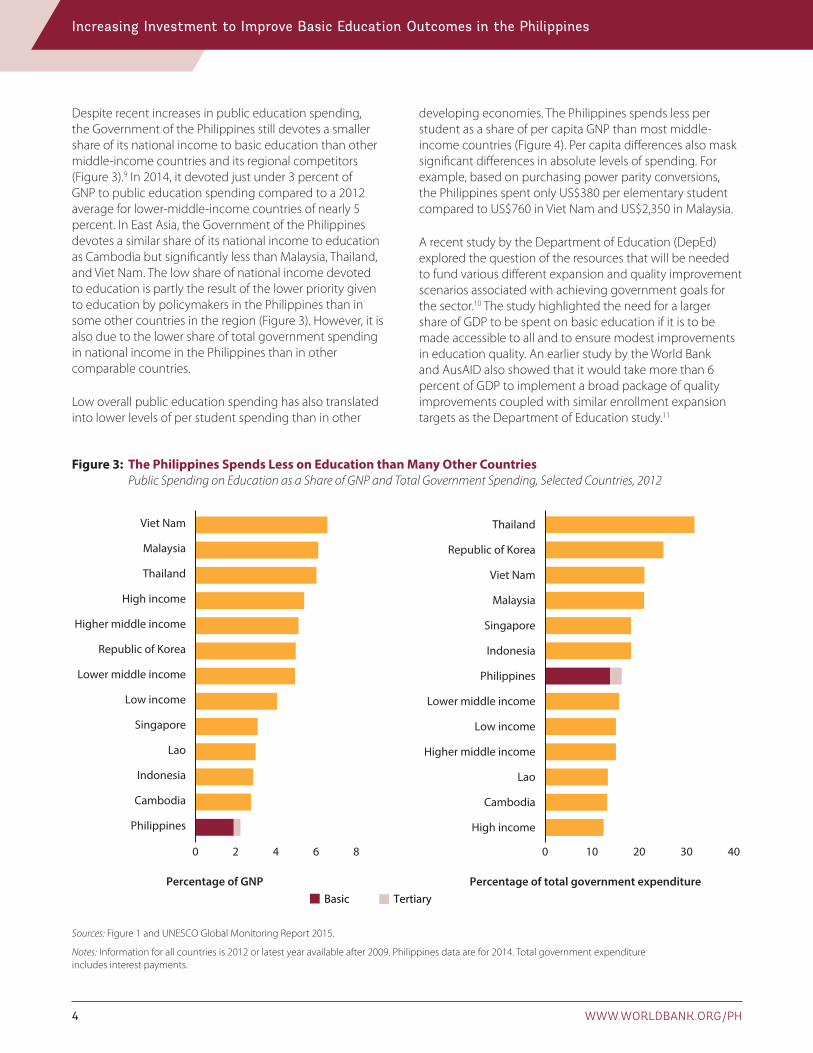
Despite recent increases in public education spending, the Government of the Philippines still devotes a smaller share of its national income to basic education than other middle-income countries and its regional competitors (Figure 3).9 In 2014, it devoted just under 3 percent of GNP to public education spending compared to a 2012 average for lower-middle-income countries of nearly 5 percent. In East Asia, the Government of the Philippines devotes a similar share of its national income to education as Cambodia but significantly less than Malaysia, Thailand, and Viet Nam. The low share of national income devoted to education is partly the result of the lower priority given to education by policymakers in the Philippines than in some other countries in the region (Figure 3). However, it is also due to the lower share of total government spending in national income in the Philippines than in other comparable countries.
Low overall public education spending has also translated into lower levels of per student spending than in other
Figure 3: The Philippines Spends Less on Education than Many Other Countries Public Spending on Education as a Share of GNP and Total Government Spending, Selected Countries, 2012
0 2 4 6 8
Philippines
Cambodia
Indonesia
Lao
Singapore
Low income
Lower middle income
Republic of Korea
Higher middle income
High income
Thailand
Malaysia
Viet Nam
Percentage of GNPBasic Tertiary
0 10 20 30 40
High income
Cambodia
Lao
Higher middle income
Low income
Lower middle income
Philippines
Indonesia
Singapore
Malaysia
Viet Nam
Republic of Korea
Thailand
Percentage of total government expenditure
Sources: Figure 1 and UNESCO Global Monitoring Report 2015.
Notes: Information for all countries is 2012 or latest year available after 2009. Philippines data are for 2014. Total government expenditure includes interest payments.
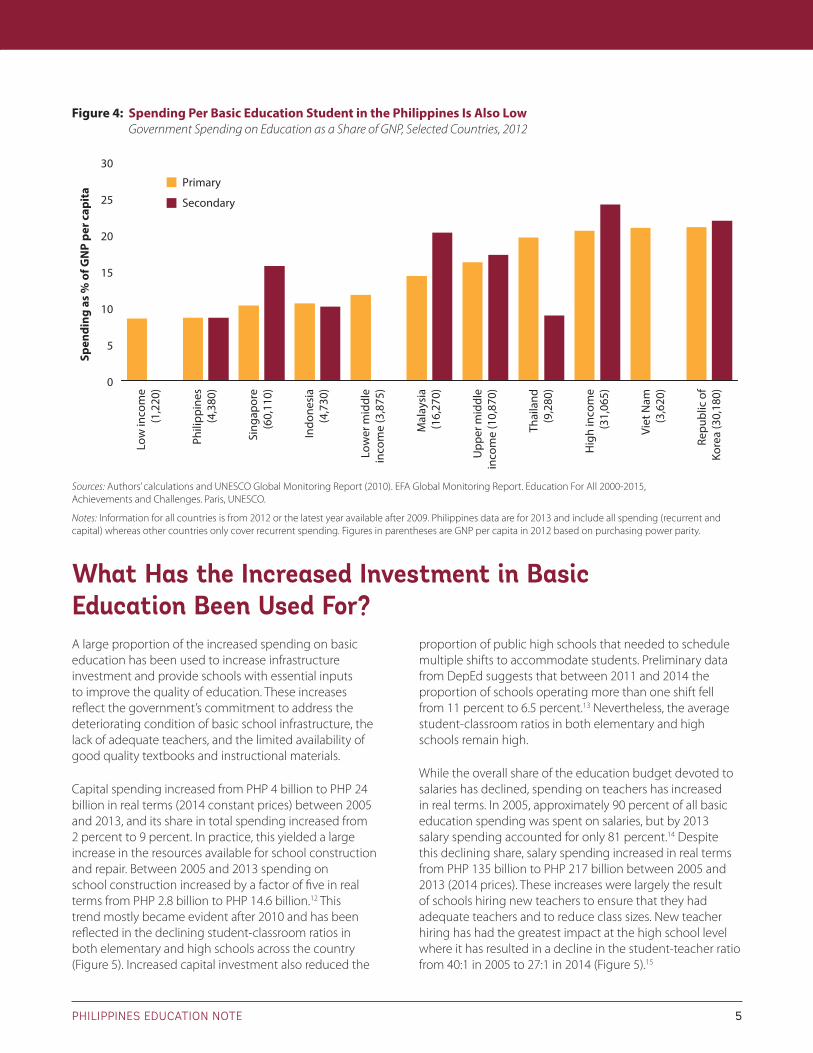
developing economies. The Philippines spends less per student as a share of per capita GNP than most middle-income countries (Figure 4). Per capita differences also mask significant differences in absolute levels of spending. For example, based on purchasing power parity conversions, the Philippines spent only US$380 per elementary student compared to US$760 in Viet Nam and US$2,350 in Malaysia.
A recent study by the Department of Education (DepEd) explored the question of the resources that will be needed to fund various different expansion and quality improvement scenarios associated with achieving government goals for the sector.10 The study highlighted the need for a larger share of GDP to be spent on basic education if it is to be made accessible to all and to ensure modest improvements in education quality. An earlier study by the World Bank and AusAID also showed that it would take more than 6 percent of GDP to implement a broad package of quality improvements coupled with similar enrollment expansion targets as the Department of Education study.11
PHILIPPINES EDUCATION NOTE 5
What Has the Increased Investment in Basic Education Been Used For?
Figure 4: Spending Per Basic Education Student in the Philippines Is Also Low Government Spending on Education as a Share of GNP, Selected Countries, 2012
0
5
10
15
20
25
30
Low
inco
me
(1,2
20)
Phili
ppin
es(4
,380
)
Sing
apor
e(6
0,11
0)
Indo
nesi
a(4
,730
)
Low
er m
iddl
ein
com
e (3
,875
)
Mal
aysi
a(1
6,27
0)
Upp
er m
iddl
ein
com
e (1
0,87
0)
Thai
land
(9,2
80)
Hig
h in
com
e(3
1,06
5)
Viet
Nam
(3,6
20)
Repu
blic
of
Kore
a (3
0,18
0)
Spen
ding
as
% o
f GN
P pe
r cap
ita
Primary
Secondary
Sources: Authors’ calculations and UNESCO Global Monitoring Report (2010). EFA Global Monitoring Report. Education For All 2000-2015, Achievements and Challenges. Paris, UNESCO.
Notes: Information for all countries is from 2012 or the latest year available after 2009. Philippines data are for 2013 and include all spending (recurrent and capital) whereas other countries only cover recurrent spending. Figures in parentheses are GNP per capita in 2012 based on purchasing power parity.
A large proportion of the increased spending on basic education has been used to increase infrastructure investment and provide schools with essential inputs to improve the quality of education. These increases reflect the government’s commitment to address the deteriorating condition of basic school infrastructure, the lack of adequate teachers, and the limited availability of good quality textbooks and instructional materials.
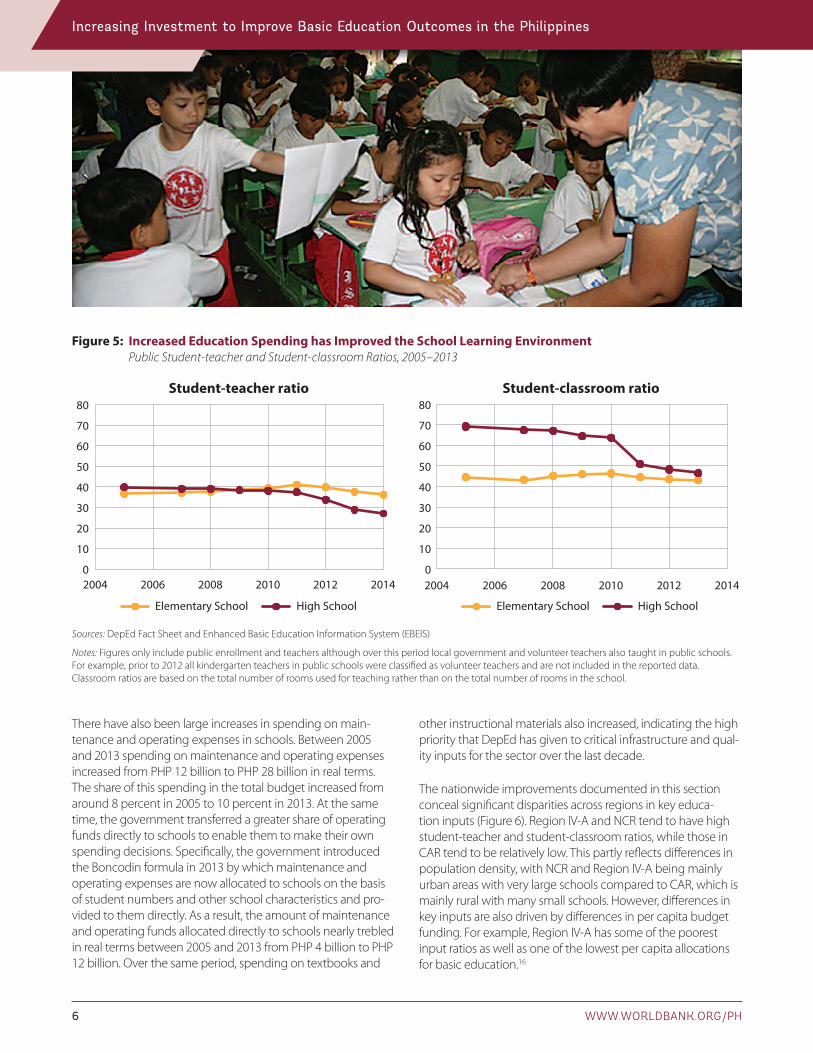
Capital spending increased from PHP 4 billion to PHP 24 billion in real terms (2014 constant prices) between 2005 and 2013, and its share in total spending increased from 2 percent to 9 percent. In practice, this yielded a large increase in the resources available for school construction and repair. Between 2005 and 2013 spending on school construction increased by a factor of five in real terms from PHP 2.8 billion to PHP 14.6 billion.12 This trend mostly became evident after 2010 and has been reflected in the declining student-classroom ratios in both elementary and high schools across the country (Figure 5). Increased capital investment also reduced the
proportion of public high schools that needed to schedule multiple shifts to accommodate students. Preliminary data from DepEd suggests that between 2011 and 2014 the proportion of schools operating more than one shift fell from 11 percent to 6.5 percent.13 Nevertheless, the average student-classroom ratios in both elementary and high schools remain high.
While the overall share of the education budget devoted to salaries has declined, spending on teachers has increased in real terms. In 2005, approximately 90 percent of all basic education spending was spent on salaries, but by 2013 salary spending accounted for only 81 percent.14 Despite this declining share, salary spending increased in real terms from PHP 135 billion to PHP 217 billion between 2005 and 2013 (2014 prices). These increases were largely the result of schools hiring new teachers to ensure that they had adequate teachers and to reduce class sizes. New teacher hiring has had the greatest impact at the high school level where it has resulted in a decline in the student-teacher ratio from 40:1 in 2005 to 27:1 in 2014 (Figure 5).15
6 WWW.WORLDBANK.ORG/PH
Increasing Investment to Improve Basic Education Outcomes in the Philippines
There have also been large increases in spending on main-tenance and operating expenses in schools. Between 2005 and 2013 spending on maintenance and operating expenses increased from PHP 12 billion to PHP 28 billion in real terms. The share of this spending in the total budget increased from around 8 percent in 2005 to 10 percent in 2013. At the same time, the government transferred a greater share of operating funds directly to schools to enable them to make their own spending decisions. Specifically, the government introduced the Boncodin formula in 2013 by which maintenance and operating expenses are now allocated to schools on the basis of student numbers and other school characteristics and pro-vided to them directly. As a result, the amount of maintenance and operating funds allocated directly to schools nearly trebled in real terms between 2005 and 2013 from PHP 4 billion to PHP 12 billion. Over the same period, spending on textbooks and
other instructional materials also increased, indicating the high priority that DepEd has given to critical infrastructure and qual-ity inputs for the sector over the last decade.
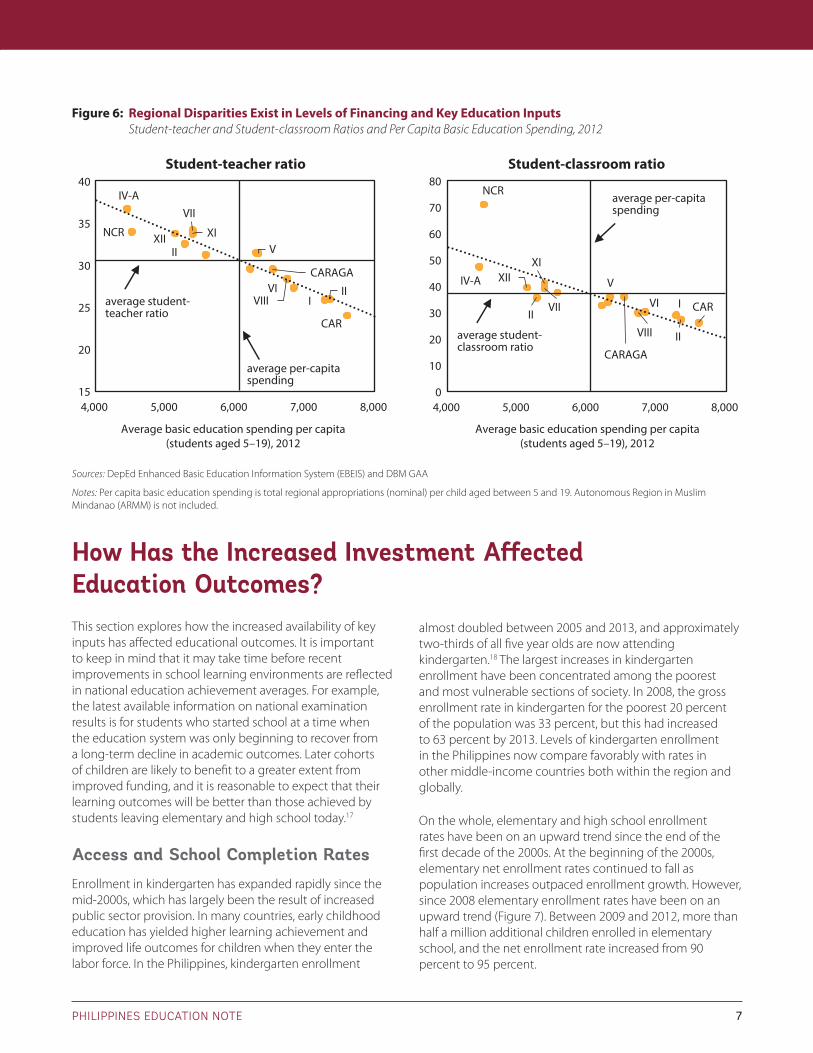
The nationwide improvements documented in this section conceal significant disparities across regions in key educa-tion inputs (Figure 6). Region IV-A and NCR tend to have high student-teacher and student-classroom ratios, while those in CAR tend to be relatively low. This partly reflects differences in population density, with NCR and Region IV-A being mainly urban areas with very large schools compared to CAR, which is mainly rural with many small schools. However, differences in key inputs are also driven by differences in per capita budget funding. For example, Region IV-A has some of the poorest input ratios as well as one of the lowest per capita allocations for basic education.16
Figure 5: Increased Education Spending has Improved the School Learning Environment Public Student-teacher and Student-classroom Ratios, 2005–2013
Student-teacher ratio Student-classroom ratio
0
10
20
30
40
50
60
70
80
2004 2006 2008 2010 2012 2014
Elementary School High SchoolElementary School High School
0
10
20
30
40
50
60
70
80
2004 2006 2008 2010 2012 2014
Sources: DepEd Fact Sheet and Enhanced Basic Education Information System (EBEIS)
Notes: Figures only include public enrollment and teachers although over this period local government and volunteer teachers also taught in public schools. For example, prior to 2012 all kindergarten teachers in public schools were classified as volunteer teachers and are not included in the reported data. Classroom ratios are based on the total number of rooms used for teaching rather than on the total number of rooms in the school.
PHILIPPINES EDUCATION NOTE 7
Figure 6: Regional Disparities Exist in Levels of Financing and Key Education Inputs Student-teacher and Student-classroom Ratios and Per Capita Basic Education Spending, 2012
IV-A
IV-A
CARAGA
CARAGA
CAR
NCR
NCR
average student-teacher ratio
average student-classroom ratio
average per-capitaspending
average per-capitaspending
Student-teacher ratio Student-classroom ratio
III
II V
VI
VII
VIII
XIXII
15
20
25
30
35
40
4,000 5,000 6,000 7,000 8,000
Average basic education spending per capita(students aged 5–19), 2012
I
II
V
VIVII
VIII
XIXII
CAR
4,000 5,000 6,000 7,000 8,000
Average basic education spending per capita(students aged 5–19), 2012
II
0
10
20
30
40
50
60
70
80
Sources: DepEd Enhanced Basic Education Information System (EBEIS) and DBM GAA
Notes: Per capita basic education spending is total regional appropriations (nominal) per child aged between 5 and 19. Autonomous Region in Muslim Mindanao (ARMM) is not included.
How Has the Increased Investment Affected Education Outcomes? This section explores how the increased availability of key inputs has affected educational outcomes. It is important to keep in mind that it may take time before recent improvements in school learning environments are reflected in national education achievement averages. For example, the latest available information on national examination results is for students who started school at a time when the education system was only beginning to recover from a long-term decline in academic outcomes. Later cohorts of children are likely to benefit to a greater extent from improved funding, and it is reasonable to expect that their learning outcomes will be better than those achieved by students leaving elementary and high school today.17
Access and School Completion RatesEnrollment in kindergarten has expanded rapidly since the mid-2000s, which has largely been the result of increased public sector provision. In many countries, early childhood education has yielded higher learning achievement and improved life outcomes for children when they enter the labor force. In the Philippines, kindergarten enrollment
almost doubled between 2005 and 2013, and approximately two-thirds of all five year olds are now attending kindergarten.18 The largest increases in kindergarten enrollment have been concentrated among the poorest and most vulnerable sections of society. In 2008, the gross enrollment rate in kindergarten for the poorest 20 percent of the population was 33 percent, but this had increased to 63 percent by 2013. Levels of kindergarten enrollment in the Philippines now compare favorably with rates in other middle-income countries both within the region and globally.
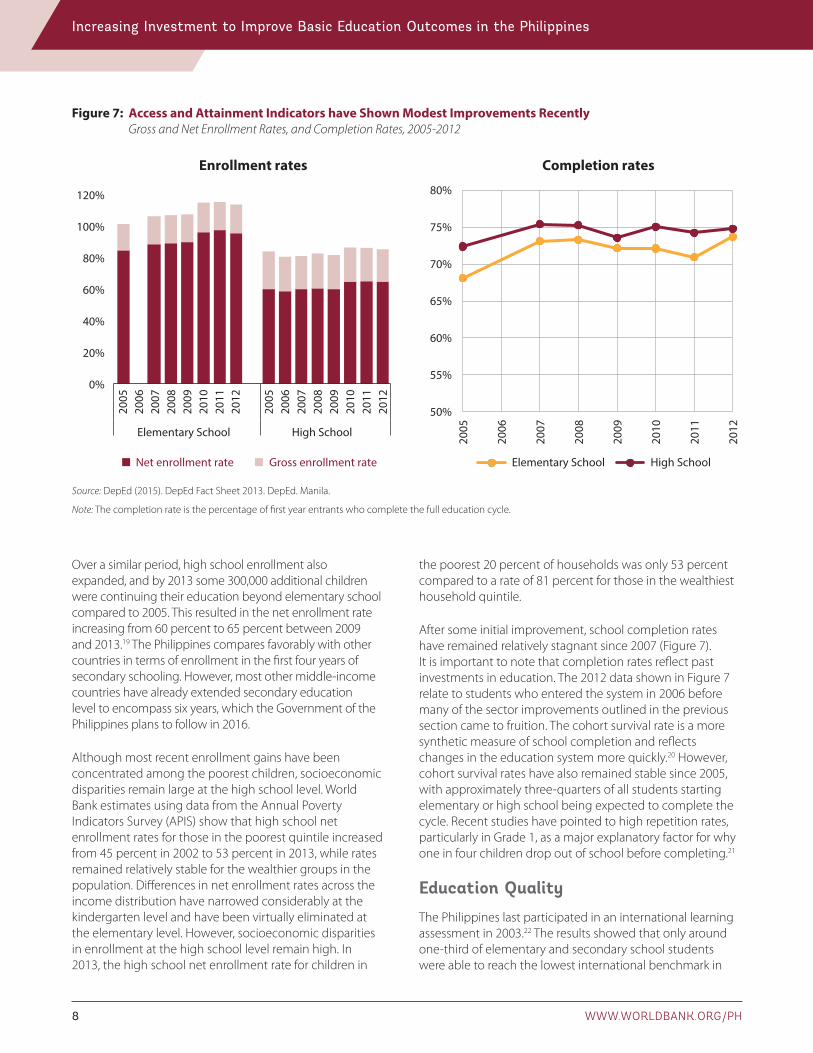
On the whole, elementary and high school enrollment rates have been on an upward trend since the end of the first decade of the 2000s. At the beginning of the 2000s, elementary net enrollment rates continued to fall as population increases outpaced enrollment growth. However, since 2008 elementary enrollment rates have been on an upward trend (Figure 7). Between 2009 and 2012, more than half a million additional children enrolled in elementary school, and the net enrollment rate increased from 90 percent to 95 percent.
8 WWW.WORLDBANK.ORG/PH
Increasing Investment to Improve Basic Education Outcomes in the Philippines
Over a similar period, high school enrollment also expanded, and by 2013 some 300,000 additional children were continuing their education beyond elementary school compared to 2005. This resulted in the net enrollment rate increasing from 60 percent to 65 percent between 2009 and 2013.19 The Philippines compares favorably with other countries in terms of enrollment in the first four years of secondary schooling. However, most other middle-income countries have already extended secondary education level to encompass six years, which the Government of the Philippines plans to follow in 2016.
Although most recent enrollment gains have been concentrated among the poorest children, socioeconomic disparities remain large at the high school level. World Bank estimates using data from the Annual Poverty Indicators Survey (APIS) show that high school net enrollment rates for those in the poorest quintile increased from 45 percent in 2002 to 53 percent in 2013, while rates remained relatively stable for the wealthier groups in the population. Differences in net enrollment rates across the income distribution have narrowed considerably at the kindergarten level and have been virtually eliminated at the elementary level. However, socioeconomic disparities in enrollment at the high school level remain high. In 2013, the high school net enrollment rate for children in
the poorest 20 percent of households was only 53 percent compared to a rate of 81 percent for those in the wealthiest household quintile.
After some initial improvement, school completion rates have remained relatively stagnant since 2007 (Figure 7). It is important to note that completion rates reflect past investments in education. The 2012 data shown in Figure 7 relate to students who entered the system in 2006 before many of the sector improvements outlined in the previous section came to fruition. The cohort survival rate is a more synthetic measure of school completion and reflects changes in the education system more quickly.20 However, cohort survival rates have also remained stable since 2005, with approximately three-quarters of all students starting elementary or high school being expected to complete the cycle. Recent studies have pointed to high repetition rates, particularly in Grade 1, as a major explanatory factor for why one in four children drop out of school before completing.21
Education QualityThe Philippines last participated in an international learning assessment in 2003.22 The results showed that only around one-third of elementary and secondary school students were able to reach the lowest international benchmark in
Figure 7: Access and Attainment Indicators have Shown Modest Improvements Recently Gross and Net Enrollment Rates, and Completion Rates, 2005-2012
Enrollment rates Completion rates
0%
20%
40%
60%
80%
100%
120%
2005
2006
2007
2008
2009
2010
2011
2012
2005
2006
2007
2008
2009
2010
2011
2012
Elementary School High School
50%
55%
60%
65%
70%
75%
80%
2005
2006
2007
2008
2009
2010
2011
2012
Elementary School High SchoolNet enrollment rate Gross enrollment rate
Source: DepEd (2015). DepEd Fact Sheet 2013. DepEd. Manila.
Note: The completion rate is the percentage of first year entrants who complete the full education cycle.
PHILIPPINES EDUCATION NOTE 9
mathematics. Differences among socioeconomic groups were also stark. In secondary school, only 23 percent of the poorest children achieved the lowest benchmark compared to 60 percent of the wealthiest children.
Since 2003, national examination scores have improved but it is unclear whether these improvements have changed the overall picture on learning significantly. Average scores on the national achievement test rose significantly between 2006 and 2008, reaching a high of 69 percent, but have remained stagnant since.23 However, it is not clear how comparable these achievement tests are from year to year which makes these increases difficult to interpret. High school achievement results have remained relatively stable over the last 10 years, although overall scores are only slightly above 50 percent. While issues of comparability make it difficult to make strong statements about trends, the national achievement scores do not suggest that there
has been any significant improvement in overall learning achievement in recent times.
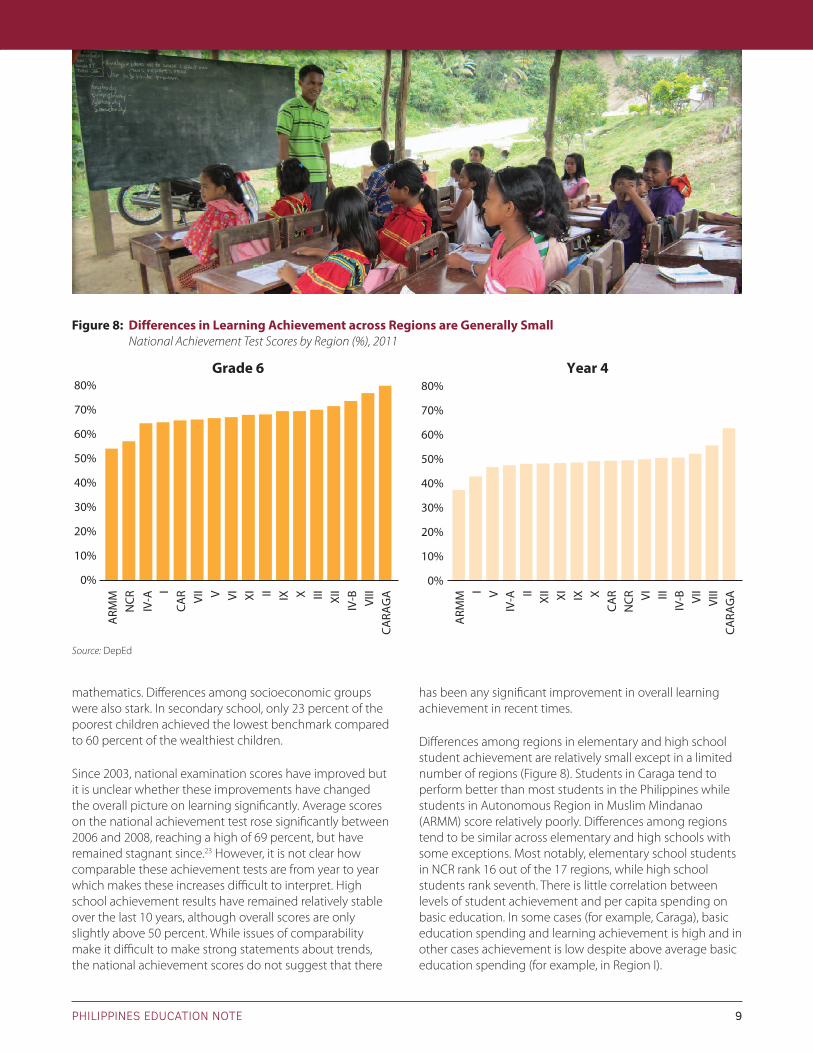
Differences among regions in elementary and high school student achievement are relatively small except in a limited number of regions (Figure 8). Students in Caraga tend to perform better than most students in the Philippines while students in Autonomous Region in Muslim Mindanao (ARMM) score relatively poorly. Differences among regions tend to be similar across elementary and high schools with some exceptions. Most notably, elementary school students in NCR rank 16 out of the 17 regions, while high school students rank seventh. There is little correlation between levels of student achievement and per capita spending on basic education. In some cases (for example, Caraga), basic education spending and learning achievement is high and in other cases achievement is low despite above average basic education spending (for example, in Region I).
Figure 8: Differences in Learning Achievement across Regions are Generally Small National Achievement Test Scores by Region (%), 2011
Grade 6 Year 4
0%
10%
20%
30%
40%
50%
60%
70%
80%
ARM
MN
CR
ICA
R VII V VI XI II IX X III XII
IV-B
IV-A
IV-A VI
IICA
RAG
A
0%
10%
20%
30%
40%
50%
60%
70%
80%
ARM
M I V II XII XI IX X
CAR
NCR VI III
IV-B VI
IVI
IICA
RAG
A
Source: DepEd
10 WWW.WORLDBANK.ORG/PH
Increasing Investment to Improve Basic Education Outcomes in the Philippines
How Does the Public Financial Management System Affect the Link between Spending and Education Outcomes? Whether the public financial and resource management systems allocate resources effectively is a vital element in translating increases in public sector investment into improved education outcomes. These systems transform sector objectives and policies into budget allocations that are used to finance the inputs and programs necessary to deliver good quality education services. The overall level of funding, the level of administration or agency using resources, and the management and governance arrangements for these resources are key determinants of education outcomes. A number of recent studies have pointed to weaknesses in these systems in the Philippines that may limit the overall impact of the recent increases in sector spending.
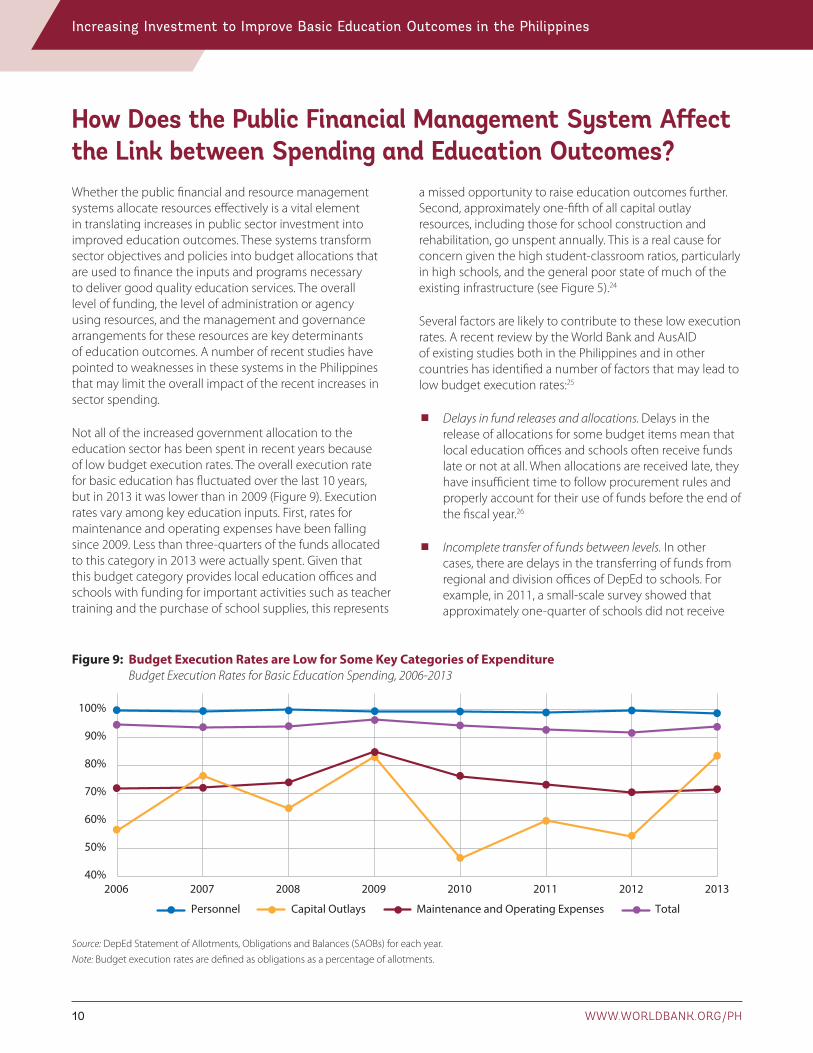
Not all of the increased government allocation to the education sector has been spent in recent years because of low budget execution rates. The overall execution rate for basic education has fluctuated over the last 10 years, but in 2013 it was lower than in 2009 (Figure 9). Execution rates vary among key education inputs. First, rates for maintenance and operating expenses have been falling since 2009. Less than three-quarters of the funds allocated to this category in 2013 were actually spent. Given that this budget category provides local education offices and schools with funding for important activities such as teacher training and the purchase of school supplies, this represents
Figure 9: Budget Execution Rates are Low for Some Key Categories of Expenditure Budget Execution Rates for Basic Education Spending, 2006-2013
40%
50%
60%
70%
80%
90%
100%
2006 2007 2008 2009 2010 2011 2012 2013
Capital OutlaysPersonnel Maintenance and Operating Expenses Total
Source: DepEd Statement of Allotments, Obligations and Balances (SAOBs) for each year.Note: Budget execution rates are defined as obligations as a percentage of allotments.
a missed opportunity to raise education outcomes further. Second, approximately one-fifth of all capital outlay resources, including those for school construction and rehabilitation, go unspent annually. This is a real cause for concern given the high student-classroom ratios, particularly in high schools, and the general poor state of much of the existing infrastructure (see Figure 5).24
Several factors are likely to contribute to these low execution rates. A recent review by the World Bank and AusAID of existing studies both in the Philippines and in other countries has identified a number of factors that may lead to low budget execution rates:25
¾ Delays in fund releases and allocations. Delays in the release of allocations for some budget items mean that local education offices and schools often receive funds late or not at all. When allocations are received late, they have insufficient time to follow procurement rules and properly account for their use of funds before the end of the fiscal year.26
¾ Incomplete transfer of funds between levels. In other cases, there are delays in the transferring of funds from regional and division offices of DepEd to schools. For example, in 2011, a small-scale survey showed that approximately one-quarter of schools did not receive
PHILIPPINES EDUCATION NOTE 11
any resources for maintenance and other operating expenses (MOOE) despite increases in overall school allocations.27
¾ Difficulties at the school level in reporting on self-managed funds. Schools frequently find it difficult to account for how they have used the monthly funds that they receive to cover their maintenance and operating expenses. This is particularly the case for schools in remote areas and with no dedicated accounting staff. When they are unable to produce these reports, the DepEd division office must withhold any subsequent funds, which are often left unspent.
¾ Inadequate coordination between implementing units. A significant part of the basic education budget for school construction and repair is implemented through the Department of Public Works and Highways (DPWH). This has significantly increased the workload of the agency and has emphasized the need for close collaboration with DepEd. In some cases, the absence of this necessary coordination has led to differences in budgeted and actual funding needs, which have in turn led to project delays and poor budget execution.
Inefficient and ineffective spending can compound low execution rates to further weaken the impact of increased education spending on outcomes. A recent public expenditure review by the World Bank and AusAID also highlighted some potential areas of inefficiency in government education spending that included:28
¾ Complexity and lack of transparency in administrative procedures for fund allocation. Fund flows in the education system are complex, and key staff are frequently unaware of the rules used to allocate resources. For example, school principals are typically unaware of the formula that determines how their maintenance and operating expenses are allocated. This limits accountability and prevents schools from being able to plan effectively.
¾ Rigid norms for the allocation, release, and use of resources. School principals frequently complain about the restrictions imposed on the use of their operating funds. The prohibition on using these funds for laptops, LCD projectors, and other instructional equipment because they are classified as capital goods unnecessarily restricts school autonomy. Rules for authorizing new classroom construction are inflexible and frequently do not adequately identify the needs of schools in remote and mountainous regions. These rules may be a significant factor in the regional inequalities in student-classroom ratios documented in Section 3.
¾ A lack of vertical coordination between national and local government education spending. There is relatively little coordination between central and local government funding of basic education. While relatively little is known about this, there is significant potential for duplication and wastage of resources due to this lack of effective coordination, which is likely to be another factor driving regional inequalities in spending and ultimately in education outcomes.
¾ School governance. How schools manage their financial and human resources has been shown to be a key determinant of the effectiveness of public spending. Schools that are managed and governed well tend to make better decisions and have better student outcomes. Evidence suggests that, while some elements of effective school-based management are in place in schools in the Philippines (such as school improvement planning), others are still lacking (such as community participation and autonomy).29
Summary The Government of the Philippines has made significant efforts to increase public investment in education to expand access and raise education quality. This note has shown that recent increases have led to modest improvements in key education inputs and outcomes. However, it has also found that additional investment will be needed to build on these recent gains, particularly in schools and locations serving poor and disadvantaged communities. Moreover, recent studies have raised concerns about the effectiveness of existing systems to allocate and manage the increased resources. In particular, the World Bank’s recent public education expenditure review concluded that merely increasing allocations to the sector is unlikely to produce significant improvements in outcomes.
These findings suggest that tackling spending ineffi-ciencies has the potential to raise education outcomes both by using existing resources better and by ensuring that further funding increases are used effectively. While recent studies have highlighted many of the potential constraints to more efficient resource use, more detailed analytical work is needed to explore the main drivers of efficiency and inequality and to identify the changes that will be needed to increase the effectiveness of public education investments.
12 WWW.WORLDBANK.ORG/PH
Increasing Investment to Improve Basic Education Outcomes in the Philippines
Endnotes1 Per student spending includes kindergarten.
2 Local governments support the delivery of basic education services by establishing and funding local school boards.
3 National guidelines require that SEF funds be used for school maintenance and operating expenditures, construction, and sports. Some local governments also use their general funds to provide additional financial support to local school boards.
4 Assistance from development partners is not generally included in the spending data used to construct regional aggregates.
5 The standard deviation of per capita regional spending increased from 783 to 1,833 between 2005 and 2013.
6 In 2012/2013, 91 percent of elementary school students attended government primary schools and 80 percent attended government high schools.
7 World Bank and AusAID (2010). “Philippines Basic Education Public Expenditure Review.” World Bank and AusAID, Manila.
8 World Bank and AusAID (2013). “School-based Management in the Philippines: An Empirical Investigation.” World Bank and AusAID, Manila.
9 GNP is significantly larger than GDP in the Philippines, but country rankings remain unchanged if spending as a proportion of GDP is used, with the exception of Cambodia, which then moves below the Philippines. It is preferable to use GNP because it allows the inclusion of the averages for country income groupings in Figure 3.
10 DepEd (2013). “Medium-term Expenditure Framework for Basic Education 2014-2020: Enrollment Projections and Cost Simulations under Alternative Scenarios.” Department of Education, Manila.
11 World Bank and AusAID (2010). “Philippines Basic Education Public Expenditure Review.” World Bank and AusAID, Manila.
12 These are appropriations and exclude an additional PHP 14 billion of school construction funds included in the Department of Public Works and Highways (DPWH) budget for 2013.
13 Approximately 3 percent of all public elementary schools organize their schedules around multiple shifts, and this has not changed much in recent years.
14 According to UNESCO statistics, the proportion of the total basic education budget in the Philippines devoted to salaries is similar to those in other neighboring countries.
15 Student-teacher ratios at the elementary level remained stable because increases in the number of teachers were offset by increases in student numbers during the same period.
16 While differences between regions in student-teacher and student-classroom ratios are wide, they have largely narrowed over the last 10 years. In particular, inequalities in student-teacher ratios at the high school level and student-classroom ratios at the elementary level have declined relatively rapidly since 2006.
17 Previous analysis conducted by the World Bank and AusAID in 2010 showed that adequate funding of teachers and classrooms is a key determinant of achievement in the Philippines context. See World Bank and AusAID (2010), “Philippines Basic Education Public Expenditure Review.” World Bank and AusAID, Manila.
18 These are the author’s calculations using household data from the Annual Poverty Indicators Survey (APIS) for both the “kindergarten” and “preparatory” categories. Calculations by the authors using DepEd kindergarten enrollment figures and UNESCO’s population estimates show that the overall gross kindergarten enrollment rate increased from 52 percent in 2009 to 99 percent in 2013.
19 Net enrollment rates estimated by the authors using APIS household data suggest a more moderate increase in high school net enrollment from 66 percent in 2008 to 68 percent in 2013.
20 The cohort survival rate is the percentage of a cohort of students in the first grade in a given school year that is expected to survive to the last grade.
21 World Bank and AusAID (2010). “Philippines Basic Education Public Expenditure Review.” World Bank and AusAID, Manila.
22 See, for example, Mullis, I., Martin, M., Gonzalez, E. and S. Chrostowski (2004). “TIMSS 2003 International Mathematics Report.” International Study Center, Boston College, Lynch School of Education, Boston.
23 There have been some notable increases in achievement in some subjects. For example, average scores in grade 6 elementary science and English scores increased by 8 and 5 percentage points respectively between 2007 and 2012.
24 The execution rates in Figure 9 may be underestimated because capital allocations can be carried over from one year to the following year. However, they provide a good measure of what proportion of an appropriation tends to be used in a single year.
25 World Bank and AusAID (2010). “Philippines Basic Education Public Expenditure Review.” World Bank and AusAID, Manila.
26 This appears to be a particular issue with centralized lump sum releases such as the School-based Management Grants.
27 World Bank and AusAID (2013). “School-based Management in the Philippines: An Empirical Investigation.” World Bank and AusAID, Manila.
28 World Bank and AusAID (2010). “Philippines Basic Education Public Expenditure Review.” World Bank and AusAID, Manila.
29 World Bank and AusAID (2013). “School-based Management in the Philippines: An Empirical Investigation.” World Bank and AusAID, Manila.