increasing brand awareness as a micro-enterprise via...
TRANSCRIPT

Increasing Brand Awareness as a Micro-enterprise via Social Media:
A Case Study of MixWell AB
Kristel Eismann [19890116] Magdalena Heinonen [19920927] Jessica Nguyen [19920621]
School of Business, Society and Engineering Tutor: Sikander Khan Examiner: Eva Maaninen-Olsson Date: 2016-01-08 E-post: [email protected]
Bachelor Thesis in Business Administration Course code: FOA214 15 ECTS

ii
ABSTRACT
Date: 8th of January 2016 Level: Bachelor Thesis in Business Administration Institution: The School of Business, Society and Engineering Authors: Kristel Eismann
Magdalena Heinonen Jessica Nguyen
Title: Increasing Brand Awareness as a Micro-enterprise via Social Media: A Case Study of MixWell AB
Tutor: Sikander Khan Keywords: Brand awareness, brand loyalty, social media, social network sites
Purpose: The aim of this study is to investigate the important aspects of increasing the awareness of a micro-enterprise’s brand through social media, which social media platforms they should focus on and what functions are mostly demanded.
Research Questions: 1. How can a micro-enterprise, with niche products, increase its brand awareness with the help of social media?
2. Which social media platforms tend to be the most effective in marketing for a micro-enterprise in order for them to increase their brand awareness?
Method: In order to achieve the aim of this thesis, various former studies were reviewed. The primary data was collected through an email interview with the CEO of MixWell AB and a questionnaire, which was distributed via social media platforms. The collected data was later analyzed and discussed in order for the authors to draw conclusions from the gathered material.
Conclusion: The research findings showed that choosing social media platforms
and maintaining social media presence is not an easy task but if a company succeeds in managing it, it can be a very effective marketing tool. The study revealed that Facebook is the most frequently used social media platform among the respondents followed by Instagram. Since Facebook and Instagram differ in their functions, both were seen as suitable choices of social media platforms for a micro-enterprise, especially considering the functions preferred discovered through the conducted questionnaire in this thesis. The customers expect to see regular posts and updates, which should have clear a purpose and message from the company to the customers. Moreover, the functions people seem to value are the possibility of leaving feedback through social media followed by the distribution of pictures and demonstrations of products.

iii
ACKNOWLEDGEMENT
First and foremost, we would like to thank our tutor Sikander Khan who has helped and encouraged us during the whole process of writing this thesis. His valued opinions and suggestions helped us to improve the quality of our work as well as our way of thinking. Furthermore, we would also like to give a special thanks to MixWell AB and Thomas Berggren who were very helpful in collaborating with us for this study, and found time in their busy schedules to answer our questions. We also want to thank our fellow opponents and classmates who gave us constructive critique and feedback, helping us to improve our thesis. Also, a special thanks to all the people who set aside some time to answer our questionnaire as well as helping us to get the word out. Last but not least, we would like to thank our family and friends, and each other, from the bottom of our hearts for the support during this time. It has been a stressful 10 weeks but without all of you, none of this would have been possible.
Thank you.

iv
TABLE OF CONTENTS
ACKNOWLEDGEMENT............................................................................................................................iii
LIST OF FIGURES.........................................................................................................................................v
LIST OF TABLES............................................................................................................................................v
LIST OF ABBREVIATIONS........................................................................................................................v
GLOSSARY......................................................................................................................................................vi
1 INTRODUCTION.........................................................................................................................................11.1 Background ...................................................................................................................................1
1.1.1 Background on MixWell AB...........................................................................................................................................11.2 Problem Discussion ......................................................................................................................2 1.3 Purpose ..........................................................................................................................................2 1.4 Research Questions ......................................................................................................................2 1.5 Limitations ....................................................................................................................................2
2 LITERATURE REVIEW............................................................................................................................32.1 Brands ...........................................................................................................................................3
2.1.1 Brand Strategy......................................................................................................................................................................42.2 Brand Equity ................................................................................................................................4
2.2.1 Brand Loyalty.......................................................................................................................................................................52.2.2 Brand Awareness.................................................................................................................................................................6
2.3 Social Media ..................................................................................................................................9 2.3.1 Definition of “Social Media” and “Social Network Sites”....................................................................................92.3.2 Social Brand Value...........................................................................................................................................................102.3.3 Social Media Marketing..................................................................................................................................................11
2.4 The Consumer’s Decision-Making Process .............................................................................12
3 METHODOLOGY.....................................................................................................................................133.1 Research Approach ....................................................................................................................13 3.2 Research Method ........................................................................................................................14
3.2.1 Qualitative and Quantitative Research.......................................................................................................................143.2.2 The Choice of Method.....................................................................................................................................................14
3.3 Data Collection ...........................................................................................................................14 3.3.1 Primary Data.......................................................................................................................................................................15
3.4 Research Sample ........................................................................................................................16 3.5 Reliability ....................................................................................................................................16 3.6 Validity ........................................................................................................................................17 3.7 Ethics ...........................................................................................................................................17
4 EMPIRICAL FINDINGS.........................................................................................................................184.1 Primary Data Results .................................................................................................................18
4.1.1 Questionnaire Conducted by the Authors..................................................................................................................184.1.2 Interview with the CEO of MixWell...........................................................................................................................21
5 ANALYSIS & DISCUSSION..................................................................................................................235.1 Strength and Strategies on Brand Awareness and Brand Loyalty .......................................23 5.2 Brand Awareness Through Social Media ................................................................................24
6 CONCLUSIONS.........................................................................................................................................286.1 Conclusions of the Thesis ..........................................................................................................28 6.2 Suggestions to MixWell AB .......................................................................................................29 6.3 Future Research .........................................................................................................................31
REFERENCE LIST......................................................................................................................................32 APPENDICES
APPENDIX 1: Questionnaire 1 APPENDIX 2: Questions for the Interview with the CEO of MixWell APPENDIX 3: Tables of the Data Results from Questionnaire 1

v
LIST OF FIGURES Fig. 1: Brand Equity.............................................................................................................................................................4Fig. 2: The Five Levels of Brand Loyalty.....................................................................................................................6Fig. 3: The Levels of Brand Awareness.........................................................................................................................7Fig. 4: Consumer’s Decision-Making Process..........................................................................................................12Fig. 5: Most Frequently Used SNS...............................................................................................................................19Fig. 6: Most Preferred Functions on SNS..................................................................................................................19Fig. 7: Weekly Activity on SNS....................................................................................................................................20Fig. 8: Expected Number of Updates on a Company’s FB-page........................................................................20Fig. 9: Amount of People Recognizing the MixWell Brand................................................................................21
LIST OF TABLES Table 1: The relationship between the theories and questions in the questionnaire. ..............................15 Table 2: Gender .......................................................................................................................................36 Table 3: Age of the respondents. ............................................................................................................36 Table 4: Character of language preferred for a company on SNS. .........................................................36 Table 5: “The more likes/followers a company has, the more do I trust their brand.” ...........................36 Table 6: “Social media helps me to build a relationship with the company.” ........................................36 Table 7: “Thanks to marketing through social media, I recognize companies’ brands when I visit a
store.” ............................................................................................................................................36 Table 8: “I participate in company-arranged contests on different social media platforms.” ................36 Table 9: Reason for buying gluten-free products ...................................................................................37 Table 10: Number of months being a customer of MixWell ..................................................................37 Table 11: MixWell's Competitors ...........................................................................................................37
LIST OF ABBREVIATIONS
N/A N.d SM SMM SNS WOM
No Answer No Date Social Media Social Media Marketing Social Network Sites Word of Mouth

vi
GLOSSARY
Celiac Disease Common hypersensitivity regarding food products that contain gluten.
(Web.MD, 2014)
Customer-Brand Relationship The relationship a brand has with its customers.
(Ismail, Boyd and Muth, 2012)
Micro-enterprise A small business with a staff base of ten people or less and a smaller amount of capital.
(Investopedia)
Niche Product A good or service made and marketed for a segment with specific needs.
(BusinessDictionary)
Regression Analysis Statistical process to determine the relationships among internal and external variables.
(Investopedia)
User Generated Content Different contents of media that users themselves create on social media platforms.
(FinancialTimes)
Word of Mouth
The recommendations given either in text or orally by a gratified customer to potential customers. It is argued to be the most effective tool of promotion.
(BusinessDictionary)

1
1 INTRODUCTION
This section gives an overview of the background of the thesis and the problem discussion. The purpose of this study is described and the research questions are introduced. It ends with a short explanation of the arisen limitations related to this study.
1.1 Background
Different companies, brands, and products approach consumers via TV commercials, newspaper ads, and social media. These companies may use different marketing strategies and methods, but their goal is one of the same - to be noticed among the various offerings and more importantly, to be the customers’ first choice of brand. Many companies hold a strong brand and consumers tend to choose the brand they can recall, recognize and are familiar with (Moisescu, 2009, p. 109). Brands that can evoke emotions and feelings in the customers have a greater chance to be more successful. Thus, increasing the brand awareness is an important aspect when it comes to marketing. Marketing managers have various strategies on how to create and increase their brand awareness. In today’s business world the role of social media channels and network overall has been the center of attention. A previous study showed that social network sites (SNS) work like an extension of a firm’s own website and that the pages within their SNS contribute to the increasing of brand awareness (Barreda, Bilgihan, Khaldoon and Fevzi, 2015, p. 7). An average of 35% of a person’s friends on popular SNS are able to follow or read their updates and postings (Bernstein, Bakshy, Burke and Karrer, 2013 cited in Barreda et al., 2015), which makes SNS a great tool to use. Some companies have been very successful with viral marketing while others have failed miserably. Hence, it is crucial to have the right branding fundamentals while being active on SNS (Barwise and Meehan, 2010 cited in Barreda et al., 2015). Some marketing departments spend a lot of resources on social media without getting any benefits and many companies are even doing more harm than good through their activities, e.g. posting the wrong posts on SNS can result in a bad word of mouth-activity. Choosing the right brand increasing activity is not as straightforward as some might think. “In order to create brand awareness in SNS, brands need to provide a virtually interactive environment” (Barreda et al., 2015, p. 8).
1.1.1 Background on MixWell AB MixWell AB, which reported to have a turnover of 10 265 000 SEK in 2014, is a company with five employees, small capital resources and is therefore considered to be a micro-enterprise (www.allabolag.se). Their business idea is to produce gluten-free food products with superior taste that are not only consumed by people with celiac disease, but also by people who choose it for its taste and quality (MixWell, 2008). The micro-enterprise first started out as a family business and later developed into the limited company they are today with customers in six different countries. They are currently distributing their products through both industrial customers such as bakeries, retail chains, and pharmacies as well as directly to individual customers through their own webshop (MixWell, 2008). Today the micro-enterprise is present on both Facebook and their own website with only one person
2
being in charge of all of the company’s social media activities, while multi-tasking with other responsibilities within the company as well. They also have a YouTube-account and a blog but both of these have been inactive for a longer period of time. MixWell AB recognizes there is a problem regarding the strength of their brand and lack of brand awareness. Since the company is currently present on social media the authors argue that it could be the right and suitable tool for them to use in order to minimize this issue.
1.2 Problem Discussion
It can be assumed that many powerful brands have a strong and resourceful marketing department behind them. At the same time there are smaller companies, e.g. MixWell AB, who do not have a marketing department and might be suffering from the limited resources available. These companies could be facing a problem on how to increase their brand awareness with their limited amount of resources and employees. How can they create, and effectively, increase their brand awareness in a manner suitable for them? Using social media could be a good place to start. Considering the limitations, as previously mentioned, these micro-enterprises might benefit from knowing where to place their focus, which social media platforms and channels to use, and what important factors to consider when communicating with the customers through social media.
1.3 Purpose
The aim of this study is to investigate the important aspects of increasing the awareness of a micro-enterprise’s brand through social media, which social media platforms they should focus on and what functions are mostly demanded.
1.4 Research Questions
• How can a micro-enterprise, with niche products, increase its brand awareness with the help of social media?
• Which social media platforms tend to be the most effective in marketing for a micro-enterprise in order for them to increase their brand awareness?
1.5 Limitations
When conducting a survey, it is important to be aware of the possible limitations that might arise. In this case one of the limitations was discovered when the method of collecting the primary data by using an online-mediated questionnaire was chosen. This is a method allowing only a fraction of the online population to be able to participate in the questionnaire due to the fact that the distribution of the survey got restricted to specific social media platforms and webpages. Another limitation is the incapability of including all the social media platforms in the questionnaire. The chosen social media platforms in this study are the ones that the public are more familiar with and those that the authors believe will be the easiest to find the relevant sample of people for. Furthermore, if more time had been provided, the authors would have preferred to use more than one micro-enterprise for the case study in order to highlight the differences between companies that engage heavily in social media activities and those who do not.

3
2 LITERATURE REVIEW
This section presents the literature review of this thesis. The first part provides a more general overview of what brand and brand strategy are while the second part gives a deeper explanation on brand equity. The third part describes “social media” and “social network sites” and briefly explains the concept of social brand value followed by the topic on social media marketing and its usage today. The fourth and final part is a short description of the consumer’s decision-making process.
2.1 Brands “A product is something that is made in a factory; a brand is something that is bought by a
customer. A product can be copied by a competitor; a brand is unique. A product can be quickly outdated; a successful brand is timeless.” - (S.K, n.d. cited in Aaker, 1991, p. 1)
Consumers are all surrounded by different brands each and every day. Some of them might catch their eye right away, while others simply just exist on the market without evoking any interest or feelings. According to Kotler and Keller (2012, p. 263) the American Marketing Association defines a brand as: “a name, term, sign, symbol, or design, or a combination of them, intended to identify the goods or services of one seller or group of sellers and to differentiate them from those competitors.” Brands consist of many various characteristics. These characteristics can be functional, rational, tangible, but also symbolic, emotional, or intangible (Kotler and Keller, 2012, p. 263). Moreover, according to Baines, Fill and Page, brands are composed of two main types of attributes: intrinsic and extrinsic (2013, p. 220). Intrinsic attributes are linked to the nature of the product and its functional characteristics, such as the shape and taste of the product. If one of these attributes were to be changed then it would directly change the product too because the main characteristic of these attributes is that they disappear after the moment of consumption (Chiciudean and Chiciudean, 2013, p. 287). Extrinsic attributes, on the other hand, are the elements that are not intrinsic and when changed, they do not make any difference to the performance of the product itself (Baines, Fill and Page, 2013, p. 220). However that does not mean that they are not related to the product, instead they are connected with the product through the most important marketing instruments, e.g. labels, brand, package, marketing communication, and price (Chiciudean and Chiciudean, 2013, p. 287). Brands are seen as an ongoing social process (Muniz and O’Guinn, 2001 cited in Hutter, Hautz, Dennhardt and Füller, 2013, p. 343). Brand value is hence “also co-created through network relationships and social interactions among the ecosystem of all the stakeholders” (Merz, Yi and Vargo, 2009 cited in Hutter et al., 2013, p. 343). Furthermore, it has been seen that brands have the social nature that has led to the usefulness of social media as a marketing channel where the important relationships for co-creating a brand value can be formed (McAlexander, Schouten and Koenig, 2002 cited in Hutter et al., 2013, p. 343).

4
2.1.1 Brand Strategy
Companies need to decide their future visions, goals, and strategies in order to maintain their competitiveness. A company’s brand can be an important part of an organization’s competitive strategy (Baines, Fill and Page 2013, p. 226). The rapid growth of social media and the growing importance of it in our society have made companies to include it in their daily marketing and brand building activities (Gallaugher and Ransbotham, 2010 cited in Tsimonis and Dimitriadis, 2014, p. 328). Many managers who say they are considering different kinds of brand building activities, find it challenging to choose between them and feel like there is lack of gaining support and resources for going through with different brand building activities; therefore the brand strategy has to be thought through and well planned (Macdonald and Sharp, 2003, p. 3).
2.2 Brand Equity To briefly describe the expression of brand equity would be to say that it is a combination of different assets, which are directly linked to the brand of a specific company that add value to products and services provided by that company. These assets are, according to Aaker (1991, p. 4), brand awareness, customer loyalty, quality perception, association, and other proprietary brand assets. Assets (e.g. brands, store locations) are described as possessions a firm has that are superior to its competitors. Although the company can possess a lot of different assets, the intangible ones are the most valuable ones. Together with the company’s skills, e.g. efficient production functions, management knowledge, the assets make out the base of the sustainable competitive advantage. This explanation does not however give any deeper understanding of the subject. In order to fully recognize the value of brand equity it is also important to understand what it actually is in the first place (Aaker, 1991, p. 16). Fig. 1 below represents and summarizes the brand equity concept with all of its five assets.
Fig. 1: Brand Equity Source: made by authors, inspired by Aaker (1991, p. 17)

5
Brand awareness is referred to as to what extent the existing and potential customers are aware of your company’s brand and products. Aaker (1991, p. 61) describes it as the ability for the customer to recognize and recall that a certain brand belongs to a certain category of products. Brand loyalty is considered to be the core of brand equity. The definition used by Aaker is the extent of which customers are faithful towards specific brands (1991, pp. 39-40). The faithfulness is measured in the number of repeated purchases of the same brand, and activities such as word of mouth (WOM). Brand association is the association a customer might have that is directly connected to a brand. Having a well positioned brand with clearly communicated key attributes of a specific product class will help the company in competing of gaining and maintaining customers and thereby work as a barrier to competitors (ibid. p. 21). Quality perception on Fig. 1 is one of the most important attributes in brand equity. It affects the customer loyalty and can also be the base for brand expansion. Quality perception differs in its definition depending which industry is being focused on. However it is always an important and measurable brand characteristic (ibid. p. 19). Zeithaml (1988) provides a definition of quality perception, describing it as the customer perception about the general quality of goods and these perceptions depend on the natural purpose of the good in relationship to competing options. Brand equity adds value to the final consumer through several factors. A recent study revealed that brand equity has a strong impact on customers’ perception especially in the food industry (Miraftabzadeh, Ahangar, Khadivi, Jahanikia and Yousefi, 2015, pp. 303-305). The brand itself helps the consumers interpret and process information about products and companies. This information is stored and leads to the creation of different perceptions of the products in the consumer’s mind.
2.2.1 Brand Loyalty
Customers can be indifferent about brands when purchasing different products. However, if a customer chooses certain brand over a competitor’s brand, despite it having superior features and quality, it is quite safe to say that substantial value exists in the brand within its symbol and slogan. Laroche, Habibi and Richard conducted a survey in 2013 on how the effects of brand community converted to brand loyalty. It was found that on social media, brand communities not only increase brand loyalty but also the brand trust resulting in an improvement in the customer’s relationship with the brand as well as other consumers. Halliburton and Poenaru (2010, p. 4) say that for the customers, trust is a type of safety net as it helps them to minimize the risks and uncertainties that come with some purchases. A more recent study conducted by Luo, Zhang and Liu (2015, pp. 4-5) presented a hypothesis on social networking activities increasing and influencing substantial consumer-brand relationship. The result from the authors’ regression analysis showed that engagements in social media activities have a positive effect on consumer-brand relationship; thus the authors’ hypothesis got significant support from their resulting conclusions.

6
As the level of brand loyalty increases among customers, the risk of losing them to competing brands decreases since brand loyalty is a measure of the extent of attachment the customer has to the brand (Aaker, 1991, p. 39). Aaker (1991) divides this measure of brand loyalty into five different levels:
Fig. 2: The Five Levels of Brand Loyalty Source: made by authors, inspired by Aaker (1991, p. 40)
The customers placed in the first level are the customers that are indifferent about the brand. These customers often choose the product based on the price. Brand does not play a role in these customers’ decision-making process (see section 2.4); instead they will choose the cheapest product that can satisfy their needs. On the second level there are the habitual buyers; the ones who are satisfied with the product, or at least not dissatisfied with it, and buy the same brand mostly out of habit. The customers on the third level are the ones who are notably more satisfied with the good. These customers are faced with costs in the form of money, time, effort, and risks when switching brands. The fourth level of brand loyalty refers to the customers that have an emotional bond to the brand. The focus is no longer on the product or its quality and functions, but on the brand and the associations the customer has to it. There is one group of customers though who are more involved with the brand and they belong to the fifth level of brand loyalty. They are the committed buyers and the most important customers a company can have. These are the people who tell their friends and families about the brand and also encourage them to purchase it before any other brands. These customers act as the advocates of the firm; they wear the brand proudly and allow it to be an expression of themselves (Aaker, 1991). Aaker (1991) provides marketing managers and companies with some tools to use in order to maintain and enhance the loyalty among customers. One important factor is the treatment of the customer. Whoever is a customer of the company should be treated right and with a high amount of respect. The other one is that a company should also strive for the closeness to their customers. Executives should be out in the real world and actually face them, and get to know them in order to fully understand the very core of the customer and why they choose their brand. Further understanding of the actual income providers can only lead to companies doing better. In order to grow, companies need to know what they can do better for their customers and in order to do this they need to know about their experience of the goods. An effective way to understand this according to Aaker (1991) is to execute regular surveys of customer satisfaction where a company gets the most important people of their business to share what they want and what can be improved. The last tool provided by Aaker (1991) is the creation of switching costs. If changing brands is associated with high switching costs the customer is more likely to stay loyal to a certain brand.
2.2.2 Brand Awareness
Studies have revealed that without the creation of brand awareness, other levels of different brand elements cannot be developed. Brand awareness generates WOM as well as increases

7
the chances of customers’ intentions to try a brand. Today’s enhanced SNS marketers have much better opportunities for developing a strong brand awareness compared to before (Barreda et al., 2015). An experiment carried out by Hoyer and Brown (1990) proved that customers are likely to base their purchase decisions on which brands they recognize and they tend to ignore the unknown brands. Also, a total of 60% of the participating people reported that their purchase was based only on brand awareness, whereas the remaining people stated that the decision was partly based on the awareness of the brand. Macdonald and Sharp (2000, p. 8) later replicated this study, with the only difference being the sample size used for the study. The increased sample size was used in order to give a more realistic perspective of the study and the results were similar to the ones provided in Hoyer and Brown’s study. It is safe to assume that brand awareness has a strong impact on the consumer’s decision-making process (refer to Fig. 4). Brand awareness is not only about customers being able to recognize or recall a brand; it is also about the ability to be able to connect the brand to a specific product class (Aaker, 1991). Assume a company places their brand on a balloon. It will help them spread the knowledge of the existence of their company but it says little about the products they are providing their customers with. If they instead place their brand on a balloon that is shaped as a muffin or a cinnamon bun then the balloon’s effectiveness of creating brand awareness is even more successful than in the previous scenario (Aaker, 1991). Aaker defines the three levels of brand awareness in which brands manage to be positioned in the customer’s mind as shown in Fig. 3 below:
Fig. 3: The Levels of Brand Awareness Source: made by authors, inspired by Aaker (1991, p. 62)
The impact of brand awareness on equity depends a lot on what level of brand awareness is being achieved. At the bottom level there is “brand recognition”, referring to customers recognizing a certain brand when they hear other people mention it, i.e. the customer can recall the brand but only with the aid of others. This level is thereby the minimal level of brand awareness and has an important impact when the customer is faced with different brands to choose from when making the choice at the point of purchase. The next level is “brand recall” which can be seen as a stronger version of the previous level of awareness. Here the customer should be able to mention or think of a certain brand by only hearing other people mention a specific product class, this is also called “the unaided recall”. If the

8
customer is able to remember a brand without any help then that specific brand probably has a stronger brand position than those who can only be remembered with the help of others. The first brand that comes to mind in an unaided recall test has achieved the top-of-mind awareness. If a company’s brand happens to be the first that comes to mind then they are probably ahead of the competitors in the mind of the customer (Aaker, 1991, p. 62).
The recognition helps the brand in many ways; a company has to obtain a recognizable brand to be able to establish any form of effective communication with the customers. Without it the customer will have a difficult time associating the brand with different attributes, neither will they also be able to connect it to a certain product category (Aaker, 1991). Huang and Sarigöllû (2012, p. 7) conducted a study with the result of brand awareness having a positive effect on various market outcomes such as dollar sales and market shares. It was proved that these three factors have a distinct positive association to each other. Furthermore, recognition provides the brand with a feeling of familiarity, a positive feeling that in many customers’ minds allows the risk of being unsatisfied with the product to be reduced. Familiarity is often enough when deciding which brand to purchase, especially for the low-involvement products such as everyday goods found in groceries stores. Brand awareness can also work like a signal of existence. If a customer is aware of a brand due to aggressive marketing or its wide distribution, they might draw the conclusion that the brand sustains from a successful company that might or might not have been on the market for a long time, and since the company is successful, other people must be using their goods too (Aaker, 1991, p. 65). Thoughts and feelings like these can make the customer feel secure about a purchase, especially if it is the first time they are in need of a company's product. If, on the other hand, the customer is faced with an unknown brand when making the decision of which brand to buy, suspicions might arise which is not substantial with a committed firm standing behind it (Aaker, 1991).
How do companies create brand awareness? There are some vital points that need to be considered and Aaker has distinguished some of them (1991, pp. 72-77). In order for a brand to be able to stand out from all the noise, it has to be memorable and the most efficient way to achieve that is to be different from the competitors. One suggestion is to market the brand in a different way than the other brands within the same category. Another suggestion is to add a factor like humor into the campaigns of a brand, especially if the competitors are dull or are focusing on a more restrictive image. The help of having a different focus will help the brand stand out and thus be more memorable and recognizable. People have an easier time remembering pictures and symbols than phrases and words. The creation of a symbol for a brand will probably help creating and maintaining a brand awareness. The symbol can be used not only in advertising, but can also be discreetly exposed in areas that attract many people, e.g. different TV contests or large sports events such as the world championships in football. When exposing the symbol to people in this matter, there is a fine chance that the brand finds a position in the customer’s mind without them realizing it until they are actually in middle of the process of making a decision whether to buy a product or not.
To develop and maintain recall is more difficult than to develop recognition (Aaker, 1991, p. 76). The connection from the brand to the product class needs to be stronger and the brand name needs to be more prominent. If a company does not maintain and keep the development of the brand going, recall will eventually decay as the time passes. Having said this, it is crucial that companies remind the customers of their brand and keep repeating their message in order to prevent them from fading away from the customers’ minds (Aaker, 1991).

9
Linton (n.d.) describes some measurable goals for brand awareness including the goals of social media. A good way to keep track of the overall interest for a brand and its products is to monitor the amount of followers and visitors a brand has on different platforms. This makes it possible to see when the interest is high and it allows the company to know if people are losing their interest in the brand. This increases the chances a company has to act in a manner that motivates its customers to come back and to do so before it is too late.
2.3 Social Media With the increased amount of time consumers spend online and the popularity of social media today, companies are faced with both opportunities and challenges managing their marketing activities. Considering Facebook as an example, founded by Mark Zuckerberg in 2004, a social network site created with the intention to connect college students (Lamb and Johnson, 2013, p. 58), but has since turned out to be much bigger today. Its functions have evolved into more than simply befriending or messaging each other, the website is used by people in all different ages and stages of life and is no longer restricted to simply private individuals as both companies and brands have recognized the many advantages with having their own social media profile. A major game changer is the fact that consumers are no longer the passive spectators they used to be and have instead turned into active participants eventually leading to the rise of social media. They are able to leave comments, ratings and even create their own content thanks to the many social network sites available for them to use today. Brands are no longer the only ones holding the influencing power as consumers’ power to influence the brands have increased and continues to do so.
There has also been a shift from a product-oriented view to a customer-oriented one instead. It is no longer enough to just make good products; companies need to make products the customers want. Never has it been easier for companies to reach out to their customers or for the customers to reach out to the company as well. By simply searching for a brand on a search engine a consumer won’t just reach a company’s website, but perhaps also their Facebook page, Twitter account or even their Instagram account. Companies encourage their customers to leave feedback on their available channels in order for them to understand what they need to improve on or what is missing. It is also no longer uncommon for the customers to chat with a company’s customer service on different social media platforms instead of the traditional phone call and the waiting that comes along with it.
2.3.1 Definition of “Social Media” and “Social Network Sites”
There are various definitions for both “social media” and “social network sites” out there but in order to be consistent throughout this thesis the section below will present the definitions used by the authors while writing this thesis.
Dennis Palmieri, director of communications Independent Television Service, described social media (SM) as “media designed to engage the public and create a social impact” (Schuler, 2008 cited in Lester, 2012, p. 118). It is a communication system where private individuals along with brands and companies are allowed to communicate with each other in an environment where all of the actors are on the same level (Peters, Chen, Kaplan, Ognibeni and Pauwels, 2013, p. 282). In other words, no actor in this system acts as an authority over

10
another. One of the most important characteristics with social media is that it allows the users to create and publish their own content, more commonly known as “user generated content”. Two other important characteristics are the degree of participation and the interaction between the users is very high as well as it is also easily integrated with other sites (Campbell, 2010).
Social network sites (SNS) act as a platform or medium for the private users to build their own social networks in order to create social relations with other users with the same interests, backgrounds or activities. Kaplan and Haenlein (2010) group them into six different categories: collaborative projects (e.g. Wikipedia and Delicious), blogs (e.g. Tumblr or Twitter), content communities (e.g. YouTube), social networking sites (e.g. Facebook), virtual game worlds (e.g. World of Warcraft), and virtual social worlds (e.g. Second Life). boyd and Ellison (2007, p. 211) define SNS as:
“web-based services that allow individuals to (1) construct a public or semi-public profile within a bounded system, (2) articulate a list of other users with whom they share a connection, and (3) view and traverse their list of connections and those made by others within the system.” It might be confusing trying to differentiate between “social media” and “social network sites”. Many people might even say they share the same meaning due to the similarities. Instead of claiming they are the same, it should be said that they are heavily related or tied to each other in one way or another (Bashar, Ahmad and Wasiq, 2012, p. 89).
2.3.2 Social Brand Value
According to the concept of social brand value, when the customers of a certain brand feel more interconnected they will then be more willing to pay for a product and will also be more loyal to the brand. Dennhardt (2014, p. 68) defines it as the consumer’s perceived value derived from the exchange and interactions with the other users centered on the brand. From a consumer’s point of view this social brand value is a part of the social network activities and social ties offered by the brand itself. The preference of a brand, or the consumption of it, can help these consumers to build a relationship or a sense of trust leading to the community-like environment, or “brand communities”, surrounding a specific brand. From the companies’ perspective however, social brand value is the overall part of the brand value that arises from the social networking and interactions of their users (Dennhardt, 2014, p. 68). An interesting take on social brand value by Dennhardt is they believe that the consumers benefit from a brand because it offers them a certain linking value by connecting people with similar interests, activities or problems, and join them into separate networks and communities (Dennhardt, 2014, p. 73). These brand communities are important because they can bind the brand and the community together with each other as they help the company to build strong and lasting customer relationships (Algesheimer, Dholakia and Herrmann, 2005 cited in Zaglia, 2013, p. 216). The consumers appreciate the values derived from these networks because they can find and interact with other peers who perhaps share a similar way of thinking or can relate to them in different questions, or as Dennhardt also puts it: “providing individuals the possibilities to connect and interact with each other about the meaning and experiences that a brand offers.” (2014, p. 73).

11
2.3.3 Social Media Marketing
Social media marketing (SMM) is said to have begun when LinkedIn was created back in 2003 (Bîja and Balaş, 2014). LinkedIn is a network site where users can upload their education and employment history in order to establish and connect to people they have common professional interests with. During its launching it was mostly targeted for the business community and was therefore less popular than the general networks targeted for the common audience back then, however, its popularity has seen an amazing increase since then. One of the biggest platforms on the market today is no doubt Facebook with its 1.32 billion monthly active users, which was reported back in June 2014 (ibid.). Bîja and Balaş explain SMM as a series of techniques a company can use, which target the SNS and their users to increase its brand awareness or to advertise a product. Companies today have recognized the benefits of using social media and the importance of incorporating it in their daily activities. Hansson, Wrangmo and Solberg Søilen held a survey in 2013 and found that the most important attributes and functions on a firm’s Facebook-page, from a customer’s perspective, is frequent and regular status updates and posts, pictures and photos, and in which manner their social media profile is designed. Another study by Burson and Marsteller also found that out of the 100 most important companies present on the Fortune 500 list, 86% of them were already active on at least one of the major social media sites (Pradiptarini, 2011 cited in Bîja and Balaş, 2014).
When the customers care about a brand or are loyal to it, there is a greater chance they will be more involved with the brand itself. Just as it is easier for the companies to reach out to the consumers with the help of social media, it is now also easier for the consumers to reach out to the companies. A study made in 2008 by Cone Business in Social Media Study found that 59% of those Americans who used social media were also interacting in one way or another with different companies, and a total of 93% of the respondents in the study also felt that companies should have a social media presence (Leary, 2009 cited in Greenwald, 2010, p. 5). SMM allows companies to quickly collect more information about their customers compared to before as well as the ability to personalize their brand through social media making it possible for them to improve the communication of the brand and its content to the customers in a very efficient manner. One of the most important benefits of SMM is therefore the connection with both the customers and with the company’s staff, this is also supported by a study by Tsimonis and Dimitriadis back in 2013. In their study they found that social media helps brands to easier interact and engage with their customers. Moreover, the managers in the research stated that it is a convenient way to communicate with the customers and to listen to the customers’ needs or concerns, just like friends do. In addition, company-arranged competitions, gifts, and discounts on social media platforms can help a brand to catch the eye of users and assist the brand to become more known. A study carried out by Bruhn, Schoenmueller, and Schäfer (2012) reveals that communication between a company and their customers even has a positive influence on the brand awareness of the company as well as on their brand image. As mentioned earlier, Aaker (1991) talks about the importance of understanding and getting to know the customers in order for the company to grow. This can be done through means such as satisfaction surveys, polls, questionnaires etc., and together with the help of the many platforms available it is now both cost-effective and easy for the companies to do so. This will help them to find out what complaints their customers and staff might have and maybe even receiving suggestions with solutions on how to solve various problems.

12
One crucial fact marketers need to understand regarding SMM is that it should be seen as a complementary tool used along with the company’s traditional marketing activities, it is by no means a replacement. One of the perks with SMM is the fact that it is not necessary or even a must to spend a lot of money when creating a social media profile (Divya and Bulomine Regi, 2014, p. 165) however it is still important to recognize the differences between the budgets of a smaller company compared to a bigger one. Different budgets require different techniques and as Bîja and Balaş said, companies should not forget that SMM requires patience (2014). It takes more than a couple of days for a company’s content to draw traffic. It is a long process that requires a lot of work, monitoring, and involvement from everyone in the company.
2.4 The Consumer’s Decision-Making Process
One of the most famous models describing the consumer’s decision-making process is the one by Engel, Kollat, and Blackwell, the EKB-model from 1968 (Suelin, 2010). Despite it being so old, it is still as useful now as it was back then for marketers. The model (see Fig. 4 below) is comprised of five stages; problem or need recognition, information search, evaluation of alternatives, purchase, and evaluation of purchase made.
Fig. 4: Consumer’s Decision-Making Process Source: made by authors, inspired by Engel, Kollat, and Blackwell (1968)
The first stage is the “problem recognition stage”. An individual realizes there is a problem or a need that should be satisfied. During the second stage, “information search”, the consumer moves on to gather the information needed to solve their problem. A study from 2008 by Kim, Ferrin and Rao showed the negative affects a consumer’s perceived risk have on the customer’s intention to purchase, therefore purchases with a high involvement tend to have a longer information search process than those with a lower one. Information can be gathered both through external sources, e.g. the Internet, books, and friends, or internal sources such as their own personal memories and experience (Suelin, 2010, p. 2910). The third stage is where the consumer evaluates all of the possible alternatives, which can act as a solution for their problem. The evaluation process is similar to the former stage, i.e. usually longer for high involvement purchases and shorter for low involvement purchases. When a consumer has made their choice they move on to the fourth stage, the purchase itself. The fifth and last stage in the EKB-model is the post-purchase stage. This is where the consumer will evaluate whether the purchase they made was satisfactory or a disappointment.

13
3 METHODOLOGY
This section describes the methodology in a more detailed manner. It gives an overview of the methods that were used to conduct the research for this thesis. The following subsections provide information about qualitative and quantitative research, primary data, the sample size and also a shorter description of the reliability, validity, and ethics of this thesis.
3.1 Research Approach The methodology is a crucial step when it comes to forming a research. There are several aspects to keep in mind when gathering ideas or executing the background research on what has been already written about, and what needs to be further researched on. It is important to consider if the data is collected to test a hypothesis or to build theories. According to Bryman and Bell, a theory can be divided into two parts, namely the “deductive approach” and the “inductive approach” (2011, p. 13). When working with a deductive approach, the researcher deduces a hypothesis according to theories that are known in the specific area of interest. The deductive approach has several of important characteristics. Firstly as Saunders, Lewis, and Thornhill (2009, p. 125) point out, there is the searching of explaining the causal relationships between different variables. After stating the hypothesis, the researcher has to test it by collecting qualitative and/or quantitative data. The researcher should also be unbiased of everything when they are surveying. Furthermore, when the deductive approach is being used, concepts need to be operationalized so facts can be measured quantitatively. Finally, the last characteristic is generalization (ibid. 2009, p. 125). In order for researchers to be able to do this, they need the sample size to be large enough before they can start to attempt to generalize the results. Meanwhile, compared to the former approach, the inductive approach can be characterized by the process where theory is the outcome of the research. When researchers use the inductive approach, they are more concerned with the context where various events are occurring; the sample of the study will be significantly smaller compared to the deductive approach (ibid. 2009, p. 126). Induction may also arise from the situation when one does not have sufficient knowledge about the topic for making it possible to state a hypothesis. As described in the previous section, there are some differences between the two approaches. When choosing a research approach for a study it is necessary to select the one method that suits the purpose of research the best. For this thesis the method deemed to be the most appropriate for the study was the deductive research approach. There are numerous theories available about brands, branding, brand awareness, and social media marketing etc., making it in this case more appropriate to draw hypotheses from the already available literature and conducted studies to shed more light upon different aspects and views that have not been researched as of yet.

14
3.2 Research Method The different research approaches were introduced and explained in section 3.1. This section covers different research methods as well as the one most suitable for this study. A distinction between quantitative and qualitative research is made and an explanation of how the two methods differ from each other can also be found in this section.
3.2.1 Qualitative and Quantitative Research
According to Saunders, Lewis, and Thornhill (2009, p. 151) qualitative research is mostly based on data collection techniques or data analysis that uses non-numerical data, e.g. in-depth interviews, experiments, observations, and categorizing data. Bryman and Bell (2011, p. 386) say that it is “an inductive view of the relationship between theory and research”. There are certain steps, which need to be followed when conducting a qualitative research: creating general research questions, the selection of subjects, the collection of relevant data, interpretation of the data collected, the conceptual and the theoretical work, and the conclusion of the findings. The quantitative research method represents the idea of data collection and/or data analysis, which uses numerical data, e.g. questionnaires and polls. A relationship can be seen between theory and research as with the deductive approach since a hypothesis also relies on the theory, but there is a difference. Quantitative research does not specify the hypothesis as such, but the concepts act more freely around the subject for what a researcher collects data (Bryman and Bell, 2011, p. 151).
3.2.2 The Choice of Method
Saunders, Lewis, and Thornhill (2009, p. 152) mention that there is a mixed method approach where both quantitative and qualitative data collection and analysis procedures are used when a research is conducted. For this thesis the authors have decided to use both quantitative and qualitative data making the choice of method a mixed methods approach. The quantitative data used was collected with the help of a questionnaire, made by the authors, and chosen to be distributed on Facebook and MixWell’s website. The qualitative data is collected from an email-interview with the CEO of MixWell AB. The weight scale is more tipped on quantitative research method since, in the opinion of the authors, the questionnaire gives more suitable information for analysis and answering the stated research questions.
3.3 Data Collection
There are different ways for researchers to collect data when doing a business research or research in general. For this thesis, primary data was used.

15
3.3.1 Primary Data
According to Saunders, Lewis, and Thornhill (2009, p. 361), primary data is data that has been collected just for the purpose of the ongoing research topic. This is also one of its advantages, since data collected for a specific purpose can be used to draw better conclusions. There are multiple ways to collect primary data, e.g. through questionnaires, interviews, and observations. This thesis uses a questionnaire made by the authors as the primary data. Using a questionnaire is the most common data collection method within the survey strategy (ibid. 2009, p. 361). It is important though that the conduction of a questionnaire is made with much care since it has to help the authors to answer the research questions and achieve the objectives set by them. In this case the questionnaire was decided to be Internet-mediated and distributed through SNS, specifically Facebook as well as the website of MixWell, for a period of a week and a half to investigate what the respondents think is important when it comes to building a brand awareness with social media. The reasoning behind why the questionnaire would be distributed via online channels was partly due to the fact that it saved the authors a lot of time. By doing an Internet-mediated survey it would allow the authors to receive faster responses. Another reason was that it would be an easier way to target relevant respondents who are familiar with social media and SNS in general, especially since this is the main topic of this study (section 3.4 will explain the research sample more thoroughly). There is also an unrestricted compass with this method, i.e. the questionnaire could easily be reached to people who are located in different geographical areas. There are some few disadvantages that were also recognized when making this decision, e.g. a low response rate and motivation problems (convincing people to participate in the questionnaire); furthermore the questionnaire responses would be restricted to the online mass (Bryman and Bell, 2011, pp. 661-669). Nevertheless, after weighing in on the advantages and disadvantages, this method was still chosen to be more appropriate for this study and for the authors. The full version of the questionnaire can be found in Appendix 1 and the results of the collected primary data are presented in chapter 4 and Appendix 3. Table 1 represents the questions from the questionnaire and what part of the literature review they are covering.
THEORIES QUESTIONS Brand Loyalty 6, 7, 8, 10, 11 Brand Strategy 4, 5, 7, 16 Social Media Marketing 3, 4, 7, 14, 15 Brand Awareness 6, 8, 9, 12, 13 Social Network Sites 3, 13, 14, 15 Consumer’s Decision-Making Process 7, 8, 13 Demographics 1, 2
Table 1: The relationship between the theories and questions in the questionnaire.
An interview was also conducted with the CEO of MixWell AB, the questions asked during the interview can be all found in Appendix 2. After a short and introductory meeting held in person, allowing the authors and the company to get to know about each other and the goals with for this study, an email interview was held after an agreement between the authors and the company in order to gather in-depth information. There are several advantages for why an email interview would be a fitting choice. The answers of an interview conducted via email

16
are more thought-through, detailed and grammatically correct, since there is more time for the interviewee to answer. Moreover, the interviewers have less effect on the outcome of an interview, because they are conducted with distance (Bryman and Bell, 2011, pp. 657-659).
3.4 Research Sample When doing a quantitative research, e.g. conducting questionnaires, the chosen sample size is very important. Since it is impossible to collect data from the entire population, a big enough of a sample size is needed in order for the researchers to be able to generalize the results from the collected data. This thesis uses a non-probability sampling method, i.e. the researchers do not know the probability of who is being selected from population, therefore it is impossible to aim for the specific respondents that need to be in a sample in order to make some statistical conclusion about the population’s characteristics (Saunders, Lewis, and Thornhill, 2009, p. 213). The larger the sample size is, the smaller is the error. The question on how large a sample should be enough for making any generalizations is not an easy task since this depends on how much of an error a researcher is ready to accept and what they think is a sufficient number for the study (Bryman and Bell, 2011, pp. 187-196). Looking at the targeted population for this study, the authors recognized two important factors when deciding on the minimum numbers of respondents required for the questionnaire in order to be able to make a generalization of the results. The first factor was that the authors needed respondents who are knowledgeable or at least have some experiences regarding SNS activities and social media in general, preferably being active users themselves. The second factor was, among those who fulfilled the previous stated condition, the respondents should also be familiar with celiac disease, gluten-free products or some of the brands selling these products. After considering and recognizing these two factors, a sample size of at least 120-200 respondents was then set. This number was seen as an appropriate number of respondents considering the size of the relevant population for this study. The questionnaire uses a convenience sampling, which belongs to the non-probability sampling method. The non-probability sampling method is used because of its easiness in obtaining a sample (Saunders, Lewis, and Thornhill, 2009, p. 241).
3.5 Reliability An example of a problem related to the reliability of a study can be whether the results of a study are repeatable or not. This is a common issue with quantitative research because researchers are concerned if the measure is consistent or not. There are three factors which can help with deciding if a measure is reliable; stability, internal reliability, and inter-observer consistency. “Stability” asks whether or not the measure is stable whereas “internal reliability” deals with problems such as the consistency of scale and index. The “inter-observer consistency” is concerned with the subjectivity in activities where data translations or recordings of observations are needed; a lack of consistency might arise when making decisions (Bryman and Bell, 2011, p. 41, p. 158). Some certain aspects can affect the reliability in this specific study. When conducting an Internet-mediated questionnaire there is a possibility that some respondents might answer the

17
questionnaire multiple times, which impacts the trustworthiness of the results. Also the questionnaire was conducted in Swedish as well as in English and that may also bias the outcomes of the research. The authors of this study tried to put aside any personal aspects that may disrupt the results in order to keep an unbiased view of the questionnaire and the interview. Since the questionnaire was conducted on the Internet, the risk of being affected by the authors’ body language or comments are greatly minimized, but the risk of misunderstanding the questions is higher than if it would have been conducted in a face-to-face manner. In order to reduce this certain risk, the questions were carefully worded in simple sentences with an inclusion of instructions or explanations when needed to help the respondents throughout the whole process. The fact that the questionnaire was answered anonymously also minimized the risk of the respondents leaving untruthful answers as this allows them to have some more privacy in case they are not comfortable being public with some of their opinions or answers.
3.6 Validity Validity is held to be one of the most important criteria. It deals with the integrity of conclusions that come from the research. The main type of validity is “measurement validity”, which is mostly an issue in quantitative research, similar to internal validity, regarding the integrity of the findings. “External validity” is mostly an issue in qualitative research and concerns the representativeness of the research subject, and finally “ecological validity” which deals with the naturalness of the research approach (Bryman and Bell, 2011, pp. 42-43). The data for this thesis was collected in two different ways: the Internet-mediated questionnaire and the interview with CEO of MixWell AB, which improved the validity. The interview gave more information about the company for the case study while the questionnaire helped to improve the possibility to generalize the research results. This can also be described as “external validity” (Saunders, Lewis, and Thornhill, 2009, p. 158).
3.7 Ethics There have been concerns about data collection by using the Internet as a medium. The behavior has to be both polite and acceptable. Researchers need to take certain ethical principles into consideration; whether there is a risk of participants’ lack of informed consent, invasion of privacy, or perhaps even deception. An even greater concern, which has been recently more current, is the anonymity and confidentiality in Internet-mediated surveys, especially since it is possible to track the source of the responses if holding the right skills (Bryman and Bell, 2011, pp. 669-671). The questionnaire made by the authors was answered anonymously with the only questions linked to identities being the ones regarding the gender and the age of the respondents. When publishing the questionnaire online, the authors made sure the respondents were fully informed of the anonymity and the purpose of the study before they proceeded with it. The interview with the CEO of MixWell was also conducted only after receiving his full permission to use it in this thesis.

18
4 EMPIRICAL FINDINGS
The following is a compilation of the results and information gathered from the interview with MixWell AB and the questionnaire, which has been conducted by the authors to help them answer the two previously stated research questions.
4.1 Primary Data Results This section presents the results of the primary data, which the authors have obtained through their questionnaire and the interview with the CEO of MixWell AB, as described in chapter 3.3.1. For a more extensive view of the questionnaire, refer to Appendix 1. The questions used for the interview with MixWell AB can be viewed in Appendix 2 while Appendix 3 includes the rest of the tables with the data results from the questionnaire. These results have not been presented in this chapter yet.
4.1.1 Questionnaire Conducted by the Authors
The questionnaire, which was conducted between 30 November 2015 and 11 December 2015, had a total of 162 people participating in it, with 159 of them being included in the final results, and 3 excluded for not completing the questionnaire. Answers marked with “N/A” are responses that were not provided by the respondents due to unknown reasons. Demographics Of the 159 of respondents, 102 of them were female, 51 males, and 6 of them identified themselves as “other”, (refer to Appendix 3, Table 2). Looking at the age groups of the participants there were mostly people between 18-25 years old that responded, this age group was followed by respondents between 26-36 years old and then the people who were older than 35. 6 people also claimed to be below 18 years old (Table 3 in Appendix 3). Social Media Activities When asked to choose from the five different social media platforms and rank them according to the amount of usage (refer to question 3 in Appendix 1), Facebook ended up getting first place for being the most frequently used platform with more than twice the amount of responses than the second place, Instagram, which had 37 respondents choosing it as their most frequently used social media platform. Instagram was however the most popular choice as the second most frequently used social media platform followed by Facebook and Twitter.

19
Fig. 5: Most frequently used SNS, ranked accordingly to the frequency of usage with “1st” being the most frequently used platform and “5th” being the least frequently used social media platform.
Fig. 6: Most preferred functions on SNS, ranked accordingly to preference with “1st” being the most preferred one and “5th” being the least preferred function.
On which kind of functions the customers would like to see more of on a company’s social media platform, the most popular choice was the ability to leave customer feedback followed by the possibility to view demonstrations and pictures of the company’s products (see Fig. 6 above). Interestingly, the possibility to leave feedback was also the most popular choice when looking at the second most preferred function with “receiving special offers” coming in on second place. When the participants were asked about the character of language that should be used by companies on their social media pages, 82 people answered that companies should use a friendly or everyday-type of language for their social media profiles and platforms, 61 respondents felt that a neutral language is more appropriate and 16 respondents wanted them to be formal with their customers (see Table 4 in Appendix 3).
Continuing with the topic of social media platforms, the majority of the respondents either agreed or partly agreed (62 and 83 respectively) that the more likes or followers a brand has, the more trust do they have for a brand (refer to Appendix 3, Table 5). Another finding also showed that 126 people out of 159 felt that social media helps them to build a relationship with companies (Table 5 in Appendix 3). Furthermore, when touching on the topic of brand awareness, only 24 of all of the respondents seem to disagree with the statement that social
0
20
40
60
80
100
1st 2nd 3rd 4th 5th
3. Which Social Media Platforms Are You Currently Using?
Blogs
Other
0
10
20
30
40
50
1st 2nd 3rd 4th 5th
4. What Functions Do You Prefer Seeing on Social Media Platforms?
Possibility of Leaving Feedback
Receiving Special Offers
Provision of Customer Service
Pictures and Demonstrations of ProductsPublishing of Product Reviews
20
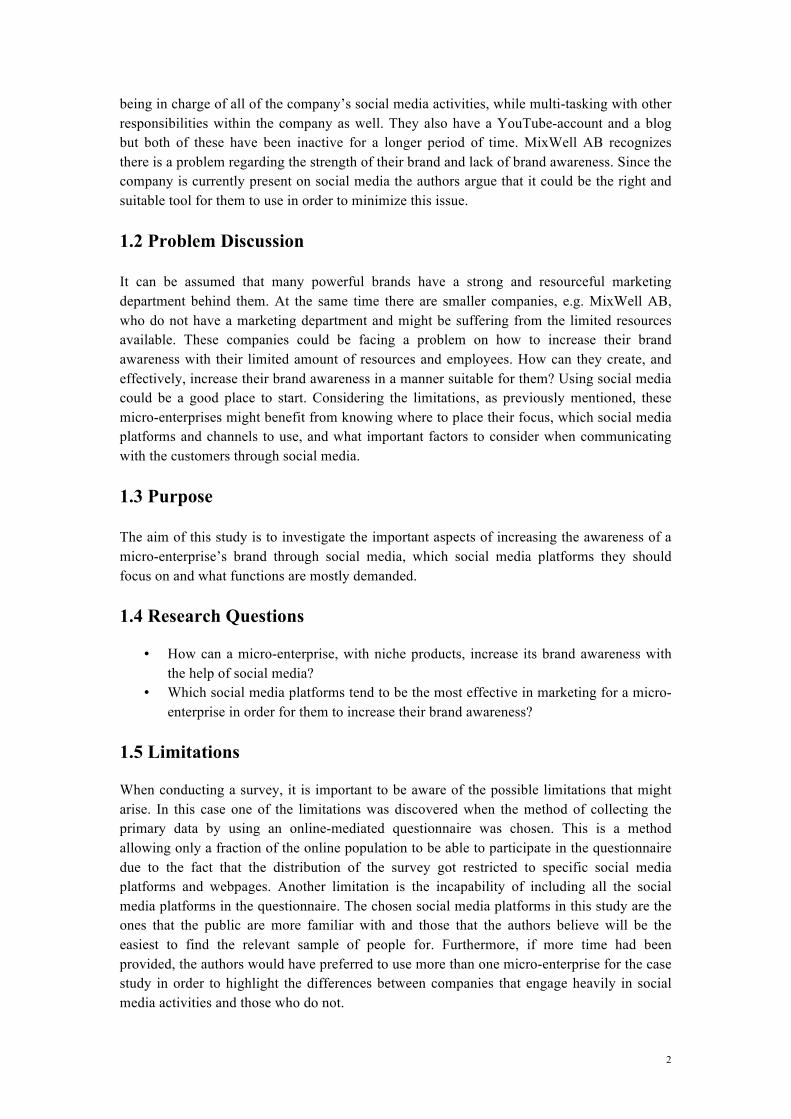
media marketing helps them to recognize the brands when they visit a store while the rest of them agreed or at least partly agreed with the statement (see Appendix 3, Table 7). The respondents were also asked to share how often they are active on different platforms (see Fig. 7), e.g. sharing, liking, and commenting on contents, and with almost 3 times more of the responses than the second place, 4-6 times/week, 82 of them stated that they were active more than 10 times/week. Further probing on the respondents’ SNS activities led to the question regarding their participation level in company-arranged competitions and contests on social media platforms where most of them said they “hardly ever” (52 responses) or “never” (54 responses) participate in them and only a total of 5 said they “often” do (see Table 8 in Appendix 3).
Fig. 7: Weekly activity on SNS.
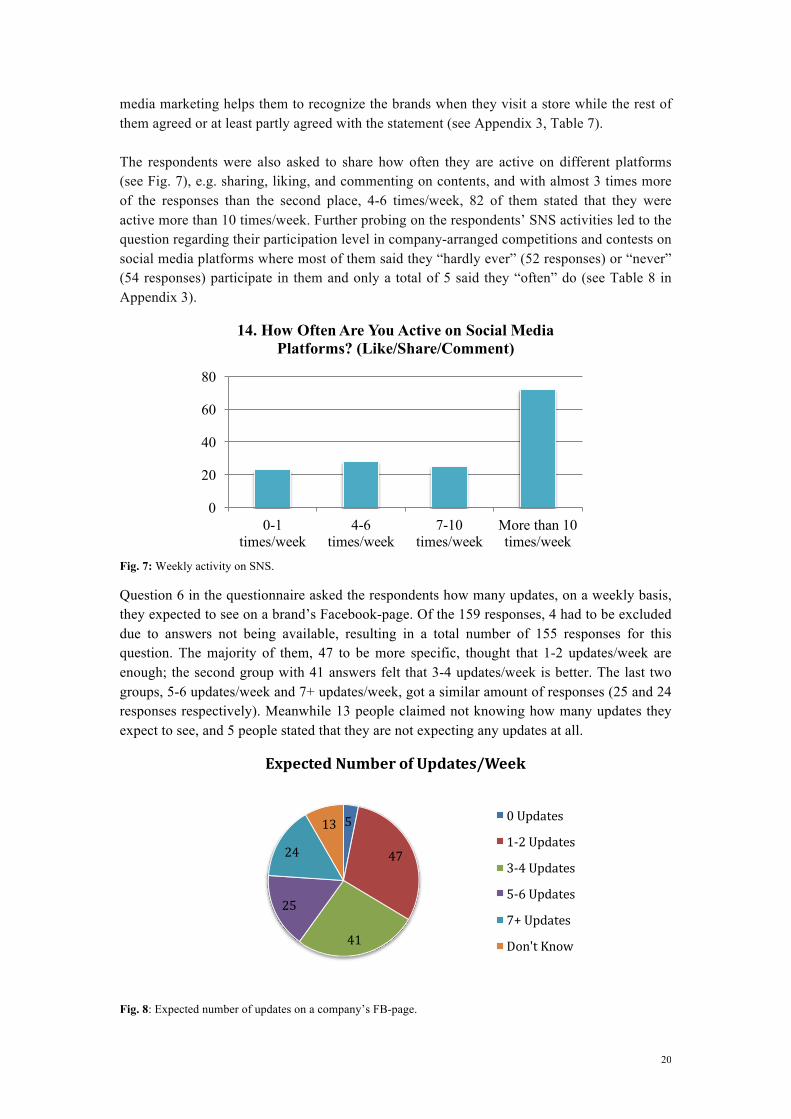
Question 6 in the questionnaire asked the respondents how many updates, on a weekly basis, they expected to see on a brand’s Facebook-page. Of the 159 responses, 4 had to be excluded due to answers not being available, resulting in a total number of 155 responses for this question. The majority of them, 47 to be more specific, thought that 1-2 updates/week are enough; the second group with 41 answers felt that 3-4 updates/week is better. The last two groups, 5-6 updates/week and 7+ updates/week, got a similar amount of responses (25 and 24 responses respectively). Meanwhile 13 people claimed not knowing how many updates they expect to see, and 5 people stated that they are not expecting any updates at all.
Fig. 8: Expected number of updates on a company’s FB-page.
0
20
40
60
80
0-1 times/week
4-6 times/week
7-10 times/week
More than 10 times/week
14. How Often Are You Active on Social Media Platforms? (Like/Share/Comment)
5
47
41
25
24
13
ExpectedNumberofUpdates/Week
0Updates
1-2Updates
3-4Updates
5-6Updates
7+Updates
Don'tKnow

21
MixWell and Competitors Since the authors are cooperating with MixWell AB for this study, there were five questions specifically related to the micro-enterprise and gluten intolerance (question 5 and 9-12 on Questionnaire 1). Out of the 159 respondents, most of them chose “I don’t buy gluten-free food” (59 respondents) and 30 of respondents said they buy gluten-free products because they or someone in the family was gluten intolerant, however, there was also a group, with 36 responses, who said they buy these products not because of allergy, but due to it being a healthier food choice (refer to Appendix 3, Table 9).
Fig. 9: Amount of people recognizing the MixWell brand.
The participants were asked if they recognized the logo of MixWell and 132 of them replied “no” whereas 27 of them replied “yes”. Among those who recognized the brand, only 16 people said that they are a customer of the company today, and the time span of having been a customer of MixWell’s ended up being anything between 2-180 (15 years) months (see Table 9 in Appendix 3 for the exact distribution). The authors asked the participants to state whether or not they recognized the brand of four of MixWell’s competitors: Risenta, Semper, ICA Glutenfri, and Oatly. Oatly ended up being the brand recognized by the most among the four with a total of 100 respondents claiming to know the brand. Risenta followed Oatly with its 80 respondents recognizing the brand, Semper was recognized by 75of the participants, and lastly ICA Glutenfri by 57 participants (see Appendix 3, Table 11).
4.1.2 Interview with the CEO of MixWell
The customers of MixWell AB are mainly industrial consumers in the forms of bakeries, retail chains, and pharmacies. Their end-consumer is generally a person with celiac disease and the customer is usually a woman. From the explanation given by the CEO in the interview, it is understood that more knowledge about their customer needs to be studied and gathered further. He also stated that MixWell AB has been active on social media platforms since 2010 with their main focus being on their Facebook page. It was also mentioned that MixWell AB has a company-blog that used to be updated frequently for a period of 2-3 years, but is presently inactive. The company has intentions to expand to further platforms within social media, however the CEO argues that the main issue and challenge is to find the time to
18%
82%
9. Do You Recognize This Brand?
Yes
No

22
manage and entertain all these channels. This is mostly due to the lack of labor resources within the company. MixWell AB is currently using social media as a tool of information for their customer, besides that, the company also demonstrates their products through pictures and shares their recipes on how to use these products. The CEO is not certain on how he wants to present the company, which message should be sent out, and where they would like to position themselves. The customers who are active on the company’s Facebook-page are able to leave feedback and the company puts effort in to answering them in the best possible manner. The general feedback is that people tend to think of their page as decent but that there is still room for improvements. The CEO said that there has been a direct effect on getting closer to their customer with the help of social media in the sense that it is now possible to directly talk and communicate to those who are actually using their products. He continued by saying that the mixes they sell have all a good baking quality leaving the finished products using MixWell with a good taste and structure; resulting in their most important competitive being their products themselves.

23
5 ANALYSIS & DISCUSSION
This chapter includes an analysis and discussion of the results and data presented in the previous section. It includes the authors’ chosen interpretations of the collected data, how the data was examined, and what kind of observations were made with the regards of what were found in the research process. The authors discuss what kind of implications the data results might have on the study and how it relates back to the research questions.
5.1 Strength and Strategies on Brand Awareness and Brand Loyalty
As presented in Chapter 4, mostly women, who are also according to the CEO of MixWell AB the company’s main customer group, answered the questionnaire, but only 11% of the participants actually knew of or recognized their brand. A larger number of the respondents were able to recognize and recall the brands of their competitors instead. Surely large brands such as Risenta and Semper focus on not just only gluten-free products, but also on baby-food or healthier/vegetarian options, making this a possibility why their brands were more recognized than MixWell’s. Regardless even when looking at those who do purchase gluten-free products, the number of people who are familiar with MixWell’s is still rather low. This confirms the concern the company had about the need to increase their brand awareness. The results give the impression that the brand of MixWell has not even reached the bottom level of brand awareness, brand recognition (refer to Fig. 3). That is, the customers were not able to recall the brand even though they were able to see the logo on the questionnaire. The Effects of Brand Awareness on Brand Loyalty The people who were familiar with MixWell’s brand and have some experience with their products tend to repeat their purchases. This confirms the conclusions of the study conducted by Hoyer and Brown (1990); brand awareness has a significant value in the customer’s decision-making process (refer to Fig. 4). The statement is based on the assumption of the number of months each person had been a customer of the company as well as being mentioned by the CEO himself who says most of their customers do come back to them and stay with them for a longer period of time. Repeat purchases is also a main characteristic of brand loyalty, thus the brand seems to give some substantial value to the already existing customers. As mentioned in 2.2.1 on brand loyalty, Luo, Zhang and Liu argued that heavy engagement in social media activities could have a positive effect on the relationship between the customer and the brand (2015, pp. 4-5) while Bruhn et al. (2012) also showed that there is a positive effect on a company’s brand awareness as well as brand image when there is regular communication between companies and customers. Having said this, there should be room for improvement even in the area of brand loyalty and social brand value subsequently because the current social media activity of MixWell AB is very light and also due to the fact that the company seems to have little time to engage in communicating directly to the customers that provides feedback or suggestions on improvement.

24
Knowing Your Customers From the interview it was clear that in most cases, the end-consumer of MixWell is someone who has celiac disease; the survey showed around 19% of the consumers purchase gluten-free products due to this reason alone. An interesting finding however was that almost 23% of the respondents purchased the goods because it appears to be a healthier choice of food or for some other unknown reason. The question that comes to mind is if there might be a whole segment of potential customers for MixWell AB that is undiscovered? The CEO of MixWell AB did conclude that the knowledge about their customers is narrow, which might be the reason why the company might have missed out on these potential customers. As pointed out in the part of brand loyalty in the literature review, it is of the most important interest to know who your customers are, what they want, if they are satisfied, and what can be improved etc. (Aaker, 1991). Companies facing problems of not knowing their customers’ characteristics and wishes might want to follow the suggestion provided by Aaker (1991) to conduct frequent surveys on the subject.
5.2 Brand Awareness Through Social Media
As mentioned in section 2.3.2, social brand value is extracted from people who are linked to the same brand being able to exchange and interact with each other on different SNS (Dennhardt, 2014). This can ultimately result in stronger trust and loyalty towards the brand. A micro-enterprise like MixWell AB could benefit tremendously by working effectively on creating and building their social media profiles as well as encouraging regular interactions with and between their customers on the different SNS. The Choice of Social Media Platforms One suggestion is thereby to expand the social media activities to other platforms than Facebook as well as to include more of the functions that people tend to value the most, which will be discussed more later on in this chapter. The reason for believing that expansion to perhaps more than one social media platform is a good idea for a small micro-enterprise, despite the argument of limited resources, is that it is a good way for them to reach out to both more potential and current customers. The primary data results from the questionnaire (see Fig. 5) showed that Facebook came in first place as the most frequently used platform followed by Instagram. These two actually ended up being the two most used SNS among the participants; both as the most frequently used social media platform as well as the second most frequently used social media platform. This result gives a hint on which of the social media platforms included in Questionnaire 1 are most efficient from a marketing point of view for these micro-enterprises. Instagram’s main functions differ from Facebook since its main focus is on the photos taken and uploaded by the users. For a micro-enterprise this could be an interesting way to demonstrate and post pictures of their products, which happens to be the second most preferred function chosen by the respondents while also coming in second place for the most preferred function. Facebook is also a great platform for that specific function since it does allow users to post their own photos too, however, with the ability to link and connect different SNS accounts today with just a few simple steps it is not necessarily as time consuming now to maintain those multiple accounts. This is one of the main challenges, which the CEO of MixWell AB pointed out in the interview. For MixWell it is important that not only should their SMM activities fit their budget, it should also not be

25
too time consuming because currently they only have one person in the company who is responsible for all of the brand’s marketing activities unlike larger companies who can afford to run a marketing team or even a whole department dedicated for this very purpose. How Social Media Activities Affect the Consumer’s Decision-Making Process When asked about the functions the respondents tend to value the most on social media, the survey revealed that the most attractive functions are the possibility of leaving feedback to the company closely followed by pictures and demonstrations of products, which were also mentioned above. This argues for the fact that customers actually do want to engage and cooperate with the companies. The findings in this thesis are also supported by the findings from a previous study mentioned in section 2.3.3 by Hansson et al. in 2013. The study carried out by Hutter et al. (2013) also arrived to the assumption that engagements on SNS such as Facebook are positively related to not only brand awareness but also to WOM activities and the consideration of a purchase as well. One of a company’s main goals is to make sure the customer will choose their product before the competitors. As explained earlier in the thesis (see Fig. 4), the customer’s decision-making progress consists of five stages in total with two stages that are more crucial for all brands but especially the smaller or new ones. Those two stages are “information search” and “evaluation of the alternatives”. In stage two where the individual searches for information on possible solutions, the companies’ need to make sure they are being found and considered as a potential alternative. As mentioned in section 2.4, the customer can make an internal information search and/or an external one. With the Internet being one of the possible external sources (Suelin, 2010, p. 2910), the brand’s social media presence can help them tremendously in this stage; there is an opportunity for customers who have never heard of them before to actually notice them. After being noticed and hopefully chosen as a potential solution to their needs, the customer moves on to the third stage. This is the stage where the customers need to be convinced. Photos and demonstrations of products and reading other people’s feedback might help them in this area as well as the amount of information that is available on this specific product, service or brand. By gathering as much information as possible the customers can minimize the risk of making a wrong purchase. This risk still lingers until the moment the purchase is made or the time of consumption, however, it can still minimize it enough to get the customers to purchase the product. Micro-enterprises who might not be able to run a big number of SM accounts need to make sure the platforms they are available on can ensure this. With the limited number of SNS used, the uploaded content and posts need to have plenty of information about their products, e.g. instructions on how to use them, and information about the company, to make it easier for the customers who are still in the second or third stage in the customer’s decision-making process. Social Media Marketing and Brand Awareness When asking the respondents whether or not social media helped them to recognize different brands when they visit physical stores (refer to question 9 in Appendix 1), 83% of them do think it has an impact in making people more aware of a brand; partly and fully agreeing with the statement. The majority of the respondents acknowledged the fact that social media do have some significance in this matter, despite the different views on the amount it does. The findings from this question agree with some of the other findings from previous studies. One

26
of them, by Barreda et al. (2015), investigated the possibility of whether virtual interactivity, i.e. customers interacting with brands and with other people also connected with those brands, could lead to the development of increased mental awareness of the brands. The conclusion was that there was indeed a positive relationship between the two. For a micro-enterprise such as MixWell AB who is competing against larger names like Oatly and Semper, they usually do not have the same amount of shelf-space, i.e. exposure in the stores, which is why it is important for them to be recognized by the customers. Social Media Marketing and Brand Trust Just being present in the social media-sphere is far from enough. Maintaining these social media channels is the real challenge. Question 11 on the questionnaire asked the respondents if they think the number of likes and/or followers a company has affects the amount of trust they have for the company. Only 9% of them disagree with the statement while 91% either agreed or partly agreed with it (see Table 5). It is difficult to know the exact reason behind these results with no in-depth information available however it is assumable that the number of likes and followers act as a sort of indicator for these customers on the trustworthiness of a brand. Trust is an important factor for brands as it contributes to the value of the brand; this is especially true in the case of Internet-shopping (Kim, Ferrin and Rao, 2008). In the study by Kim, Ferrin and Rao not only did they find that there was a relationship between perceived risk and intention to purchase but they also found that the same thing could also be said about trust; trust has a positive effect on a customer’s decision-making process and actual purchase decision as well. The more trust the customers have in a brand, the shorter and easier will their decision-making process be since the sense of trust helps them to minimize or even remove the risks and uncertainties they might have for certain purchases (Halliburton and Poenaru, 2010, p. 4). After taking a look at what the numbers of “likes” and followers can mean from a customer’s point of view, what does this mean from a company’s perspective? The Effects of Social Media Marketing on the Relationship between the Customer and the Brand According to the data from Table 6, a little more than 79% of the respondents agreed that social media helps them to build a relationship with a brand. One of the main benefits with having the customers’ trust is the customer and brand loyalty; resulting in long term relationships between the customers and the company, greater share of wallet, and increased WOM (Halliburton and Poenaru, 2010, p. 3). The five level of brand loyalty as presented by Aaker in section 2.2.1 (see Fig. 2) explains the fifth and highest level, “committed”, as the most important and committed buyers a company can have. They act as the advocates of the company and help them to spread the awareness of the brand to the people they know and engage with (Aaker, 1991). To apply this to SM, the hope is to get the followers of the brand to talk and create a buzz by having them discuss and share the brand’s content with their friends on SNS. To increase the chances of getting these customers to talk about the brand, micro-enterprises can take advantage of the benefits of brand communities. Section 2.2.1 mentioned the survey conducted by Laroche et al. (2013) who found that brand communities in SM also increased both the brand trust as well as the brand loyalty, which again resulted in the improvement of the customer’s relationships with the brand as with other customers. This value that emerges from these community activities, social brand value, results in the increase in customers’ willingness to pay for a higher priced product and also an increased loyalty to

27
the brand while brand communities bind customers and companies together resulting in stronger customer relationships (Algesheimer, Dholakia and Herrmann, 2005 cited in Zaglia, 2013, p. 216). Brand community is described as a place where the members engage jointly to achieve goals and/or express their mutual feelings and commitments with each other (Bagozzi and Dholakia, 2006 cited in Luo, Zhang and Liu, 2015). Engaging the Customers There is no one-time solution on how to make a SM brand community successful, however one of the most important factors is to get the customers or members of the community to engage with each other as seen in the previous explanation offered by Bagozzi and Dholakia. For a micro-enterprise like MixWell AB, it does not have to necessarily take on complicated and drastic tactics to get the customers to engage with each other, but as pointed out before, SMM is a process that requires a lot of patience. The majority of the respondents expected to see at least 1-2 updates/week on a company’s Facebook page (refer to Fig. 8) and 26,5% wanted to see at least 3-4 updates/week. The reason for measuring the amount of posts per week is because a company needs to be consistent and update their social media profiles on a regular basis. As Hansson et al. (2013) said, the customers want to see regular posts and status updates from the companies. Aside from the regular updates, the content of the posts is equally important if not more. There is no point in updating or posting regularly if the content is simply just spam or uninteresting for the customers. This is also similar to what Hutter et al. (2013) said before in their research, too much posting can be seen as annoying and instead have a negative effect on a customer’s decision-making process as well as a reduction in WOM-activities. The posted content should be informative or useful, have a clear purpose and message from the company to the customers. The content and message need to be relevant to the identity of the company or what kind of products and/or services they are offering; e.g. MixWell AB who focuses on selling gluten-free products, specifically gluten-free mixes, posts recipes both on their Facebook-page and website to their customers and visitors in order to help and inspire them on how MixWell’s products can be used. Another way to engage the customers or members in a brand community is to arrange contests. When asked if the respondents participated in company-arranged contests, only five people admitted that they do while the majority said they “hardly ever” or “never” do (refer to question 15 in Appendix 1). This can raise the question if these kinds of contests really are an efficient method to catch the customer’s attention. The argument for a company using this kind of SMM technique can be that even if only five people are sharing the information about the competition, then their friends or acquaintances on different social media platforms will take a notice of it, which in turn could increase the brand awareness of the company. It can also be reasonable to use a friendly and relaxed character of language when posting on SNS. 82 people who participated in the questionnaire answered that they expect the language of a company to be friendly or in an everyday type of manner. The second most popular type of language was a neutral one, which was preferred by 61 of the respondents. Only 16 people expected the language to be formal. The reason behind it can be that these customers see SM mostly as a “place to meet your friends” and people do not want the overly formal communication even from the companies. Obviously being overly friendly is not always a good thing so companies need to remember that they should speak to and communicate with the customers as if they were friends, but it still needs to be in a respectful manner.

28
6 CONCLUSIONS
The final chapter of this thesis includes the conclusions of this thesis. This is followed by a number of suggestions to MixWell AB based on the findings from the study as well as some suggestions on what still needs to be researched on for future interested parties.
6.1 Conclusions of the Thesis
The aim of this thesis is to investigate in what manner a micro-enterprise with niche products could increase its brand awareness with the help of social media. Furthermore, to also shed a light on which social media platforms could be the most effective ones, in terms of marketing, that these micro-enterprises can use to enhance their brand awareness. The research findings of this thesis show that choosing social media platforms and maintaining a social media presence is not a simple task. Generally micro-enterprises are not able to keep up with a big number of SM accounts because they usually lack the resources necessary to run a marketing team or a whole marketing department. This can result in time-related issues since the company normally only have one person handling the marketing activities at the same time as they are in charge of handling other work related tasks.
The study found that Facebook is the most frequently used social media platform, which might not be a complete surprise, since according to Bîja and Balaş (2014), Facebook is one of the largest platforms with its 1.32 billion monthly active users. Meanwhile, Instagram is the secondly most frequently visited platform. This suggests that it is reasonable for a micro-enterprise to consider being present on both of these social media platforms. The choice of the right or most suitable social media platform is important, but even more significant is the activities and contents posted by the companies. For these micro-enterprises, who are already limited in terms of the number of SNS-accounts that they can maintain, the uploaded content and posts should contain plenty of useful information about the micro-enterprise’s products as well as information regarding the company. Moreover, the idea is to create a buzz within the community by getting customers to discuss and share the brand’s content, in other words, to get the customers to engage with each other and spread the word about the brand as well as engaging with the company. A good way to manage this is by creating a social media brand community. As Laroche et al. (2013) pointed out, aside from being a strong platform for creating and holding discussions, brand communities can also help to increase the brand trust and brand loyalty.
Social media marketing requires a lot of patience. The findings in this thesis regarding the frequency of updates and posts people are expected to see on a company’s Facebook-page show that the customers want to see regular posts and status updates. As mentioned earlier, the uploaded content posted by a company should be informative, useful, and have a clear purpose and message to customers. The company should only consider content and messages that are relevant and identifies the company or the type or products and/or services they are providing. There is no point in updating irrelevant or annoying postings or content since this is just uninspiring for the consumers.

29
Additionally the findings also showed that the respondents claimed to value the possibility to be able to leave feedback to the company through their social media accounts. This was followed by the ability to post and upload pictures and demonstrations of a brand’s products. Thus, customers are eager to show that they use a company´s products and services when they are both satisfied and unsatisfied with the results. The satisfied customer can act as an influencer to potential buyers whereas the unsatisfied one might scare new customers away. On the other hand, due to the potential of engagement between the companies and their customers through SNS, companies are given the opportunity of compensating and improving on their deliveries in terms of products and services. In other words, customers do feel a need to engage and cooperate with the companies, which in turn increases the possibilities of spreading awareness of the brand and increasing the WOM-activities as well.
6.2 Suggestions to MixWell AB
For this thesis, research was made on how a micro-enterprise with niche products is able to increase its brand awareness with the help of social media considering the most efficient platforms having the company´s different limitations in mind. An online questionnaire was conducted where people were asked about their feelings and opinions regarding this matter in hopes of gathering sufficient useful information and data for the thesis. Based on the gatherings throughout this study, these are the suggestions and recommendations from the authors to MixWell AB on how to improve their social media presence and by doing so also increase and build their brand awareness. MixWell AB should define themselves by looking at questions such as who they are and who the faces behind the company are. Having a clear company image running through the whole organization will help them to send out clear messages to potential and already existing customers. This will in turn lead to less confusion and make people more familiar to not only the brand but to the company as well. As described throughout the thesis, familiarity often leads to purchases and thereby increased dollar sales. Having said this, there were some areas of concern recognized after conducting the interview with the CEO who acknowledged that not only do they not have a way of managing their aftermarket, they also claimed to be not fully sure about what their customers want. In order to move forward and improve the things that can be improved, it is vital for the company to know these core attributes of its customers. If you don’t know what they wish for, then it will be difficult to provide the type of products they would like to purchase; or even being a brand the customers would want to consider buying from in the first place. The company needs to ensure themselves that they are fulfilling an actual need. In order to get to know their customers better, a suggestion to MixWell AB is to conduct surveys on the subject and maybe investigate further if they might have missed to target a whole new segment; the people who valid and are conscious of their health regardless of allergy or not. The company should also stay open for feedback and suggestions on modifications of their products and services. Considering the result of the eagerness of the customers to engage with the companies, MixWell AB might want to consider encouraging their customers to be more active on their Facebook-page. One way to do this could be by arranging contests with discounts or free products as prizes for the people who win; e.g. who could come up and share the most interesting recipes or tips and tricks on how to use MixWell’s products in terms of

30
creativeness. However, engaged and dedicated customers also require engaged and dedicated companies. Those who leave feedback or posts anything related to a company’s products, or other related information about the company, often do so in hopes of receiving some kind of response from the company. Thus, when a customer is sharing their opinions on, e.g. improvements on the website, the products or the customer service, they expect the company to listen and take it into consideration. This requires that the company leave some sort confirmation to those customers to show that they actually have acknowledged their suggestions and care about their customers’ opinions. This is easily achieved by simply commenting on the posts or sending short answers as well as doing so in a timely manner, i.e. not taking too long to respond. There is also room for improvements on MixWell’s current Facebook-page. First of all, the company needs to pay more attention to the details. They might seem insignificant but in the end these can make a huge difference in the visitors’ eyes. For instance, adding a phone number and address on the Facebook-page, consider the quality and designs of the uploaded pictures, and also work on post and update on a regular basis. As a mentioned in section 6.1, customers value details like these. Customers appreciate it if they can find useful information about the company, e.g. contact information and where to find the provided products. Maintaining a regular post/update schedule is a way to remind the customers that the company or brand exist, an inactive page or social media account where no response is given (or given too late) and very little activity is found, can leave the impression of a less serious social media presence where the company either seem to have forgotten about their customers or are not interested in engaging with them at all. Knowing this, another suggestion is that the company-blog, which is currently not in use, is either shut down or proceeded on with a lot more activity. The quality of the pictures is very important especially since MixWell is in fact a company that sells food products and people are said to “eat with their eyes”. The more appetizing the content on the pictures look, the stronger will the effect be. People will be tempted to buy and use more of the products from MixWell’s product range as well as gaining some inspiration from the said pictures. Since Instagram was found to be the second most frequently used SNS, MixWell AB is should consider opening an account on this specific SNS, despite their limited time resources in order to increase the awareness of their existence. This SNS is easily managed and is only based on pictures followed by a caption, i.e. a short informative text. There is also the possibility to link the Instagram account to the current Facebook-page and the possibility to market the company through ads if future resources would allow it. Instagram is an explicit tool for getting more intimate with the audience. For instance, customers find it amusing to be able to take part of the behind-the-scene process of different events such as fairs or normal working days in production. It brings the company closer to the customers, which can lead to increased brand awareness and brand loyalty. It is important to keep in mind that the social media platforms should be connected to each other assuming that the company will be running several in the future. Consistency in layout/design and themes is also necessary, since it makes it easier for customers to comprehend the image of the company as well as to recognize and remember it.

31
There are many advantages for managing a brand and company image in a proper manner. Considering the business-to-business market, a company with a clear message and a lot of loyal customers/followers is more attractive to cooperate with than a company that many have not heard about. If someone happens to start cooperating with a business anyhow, the risk is that they sell their own company out because of other strong attributes e.g. the products. The products might be able to sell but unfortunately this will not be under the brand of the company who are actually producing it. In this case the company should ask themselves, are they willing to they sell their only competitive advantage? If so, what else do they have to compete with if, and when, the company achieves the goal of having a strong and widely spread brand awareness? Overall it seems like MixWell AB have not fully considered social media or SNS as the important and effective marketing tool as it really is. This is supported by the acknowledgement given by the CEO about not having recognized any direct effects of being present on social media. However, there is a belief that with the help of the findings in this thesis and some other modifications, the company will be able to run and maintain their own proper social media marketing activities.
6.3 Future Research
The following are suggestions from the authors on extended areas, which are related to this topic that could be considered by future researchers who might be interested in this topic. These are questions and topics the authors have stumbled upon while writing this thesis, but were unfortunately not able to take on themselves due to limited time or resources. The study carried out in the thesis investigated in what manner micro-enterprises are able to increase their brand awareness through social media and what aspects to focus on with their resources available being so limited. Due to the time constraint of this thesis, the problem on how to measure the brand awareness created through social media, as a micro-enterprise, needs to be further researched. Moreover, a larger numbers of micro-enterprises should be studied to get a clearer picture and deeper understanding on the brand increasing process through social media, compared to the one case study in this thesis. One of the findings from this thesis suggests that the majority of the people agree on the fact that social media helps to identify and recognize brands when visiting physical stores, however, there were a total of 33% that disagreed with the statement, which gives some room for more investigation in the future. What are the reasons for people experiencing these effects of social media differently and how could this gap be minimized? Another related topic the authors questioned was if and how the increased brand awareness would effect and improve the probability of being noticed by possible business partners and relationships. There is often also a problem with the allocation of resources in micro-enterprises when it comes to marketing, therefore, further studies could be conducted in this area regarding how to distribute the resources in the most efficient manner in terms of marketing.

32
REFERENCE LIST
Books and Journals:
Aaker, D., 1991. Managing Brand Equity. New York: The Free Press.
Baines, P., Fill, C. and Page, K., 2013. Essentials of Marketing. Oxford: Oxford University Press.
Barreda, A.A., et al., 2015. Generating Brand Awareness in Online Social Networks. Computers in Human Behavior, [e-journal]. Available through: <http://dx.doi.org/10.1016/j.chb.2015.03.023> [Accessed 28 November 2015].
Bashar, A., Ahmad, I. and Wasiq, M., 2012. Effectiveness of Social Media as a Marketing Tool: An Empirical Study. International Journal of Marketing, Financial Services and Management Research, 1(11), pp. 88-99.
Bîja, M. and Balaş, R., 2014. Social Media Marketing to Increase Brand Awareness. Journal of Economics and Business Research, 2, pp. 155-164. boyd, d. and Ellison, N.B., 2007. Social Network Sites: Definition, History, and Scholarship. Journal of Computer-Mediated Communication, 13(1), pp. 210-230.
Bruhn, M., Schoenmueller, V., Schäfer, D. B., 2012. Are Social Media Replacing Traditional Media in Terms of Brand Equity Creation?. Management Research Review, 35(9), pp. 770-790. Bryman, A. and Bell, E., 2011. Business Research Methods. 3rd ed. Oxford: Oxford University Press.
Chiciudean, G. and Chiciudean, D., 2013. Customer Segmentation by Attributes Considered Important During the Buying Decision-Making Process for Cheese. Bulletin UASVM Horticulture, 70(2)/2013, pp. 287-292.
Dennhardt, S., 2014. User-Generated Content and its Impact on Branding. [e-book] Wiesbaden: Springer Gabler. Available through: Mälardalen’s University Library <http://link.springer.com.ep.bib.mdh.se/> [Accessed 12 November 2015].
Divya, A. and Bulomine Regi, S., 2014. An Empirical Study on Effectiveness of Social Media as a Marketing Tool. International Journal of Current Research and Academic Review, 2(3), pp. 163-168.
Greenwald, D., 2010. Social Media: Changing the World of Business Communication, paper presented to the 75th Annual Convention of the Association for Business Communication, Chicago, Illinois, 27-30 October.
Halliburton, C. and Poenaru, A., 2010. The Role of Trust in Consumer Relationships: discussion paper, ESCP Europe Business School. Available through: <http://news.pb.com/white-papers/the-role-of-trust-in-consumer-relationships--escp.download> [Accessed 15 December 2016]. Hansson, L., Wrangmo, A., and Solberg Søilen, K., 2013. Optimal Ways for Companies to Use Facebook as a Marketing Channel. Journal of Information, Communication and Ethics in Society, 11(2), pp. 112-126.
Hoyer, W.D. and Brown, S.P., 1990. Effects of Brand Awareness on Choice for a Common, Repeat-Purchase Product. Journal of Consumer Research, 17, pp. 142-145.
Huang, R. and Sarigöllû, E., 2012. How Brand Awareness Relates to Market Outcome, Brand Equity, and the Marketing Mix. Journal of Business Research, [e-journal], 65, pp. 92-99. Available through: ScienceDirect <http://www.sciencedirect.com.ep.bib.mdh.se/science/article/pii/S0148296311000361> [Accessed 3 December 2015]. Hutter, K., Hautz, J., Dennhardt, S. and Füller, J., 2013. The Impact of User Interactions in Social Media on Brand Awareness and Purchase Intention: the Case of MINI on Facebook. Journal of Product & Brand Management, 22(⅚), pp. 342-351.
Ismail, R., Boye, L.C. and Muth, A., 2012, Customer Brand Relationship - An Empirical Study of Customers’ Perception of Brand Experience, Brand Satisfaction, Brand Trust and How They Affect Brand Loyalty. Ph.D. Linnaeus University. Kaplan, A.M. and Haenlein, M., 2010. Users of the World, Unite! The Challenges and Opportunities of Social Media. Business Horizon, [e-journal], 53(1), pp. 59-68. Available through: ScienceDirect <http://www.sciencedirect.com/science/article/pii/S0007681309001232> [Accessed 29 November 2015].
Kim, D.J., Ferrin, D.L. and Rao, H.R, 2008. A Trust-Based Consumer Decision-Making Model in Electronic Commerce: The Role of Trust, Perceived Risk and Their Antecedents. Decision Support Systems, [e-journal], 44(2), pp. 544-546. Available through: ScienceDirect <http://www.sciencedirect.com/science/article/pii/S0167923607001005> [Accessed 12 December 2015].
Kotler, P. and Keller, K.L., 2012. Marketing Management. 14th ed. Essex: Pearson Education Limited.

33
Lamb, A. and Johnson, L., 2013. A Decade of Facebook. Teacher Librarian, [e-journal], 41(2), pp. 58-62. Available through: Mälardalen’s University Library Database <http://www.mdh.se.ep.bib.mdh.se/bibliotek/sok/databaser/databaser-a-o-1.9000> [Accessed 30 November 2015].
Laroche, M., Habibi, M. R. and Richard, M., 2013. To Be or Not to Be in Social Media: How Brand Loyalty Is Affected by Social Media?. International Journal of Information Management, 33, pp. 76-82.
Lester, D.H., 2012. Social Media: Changing Advertising Education. Online Journal of Communication and Media Technologies, 2 (1), pp. 116-125.
Luo, N., Zhang, M. and Liu, W., 2015. The Effects of Value Co-creation Practices on Building Harmonious Brand Community and Achieving Brand Loyalty on Social Media in China. Computers In Human Behavior, [e-journal], 48, pp. 492-499. Available through: ScienceDirect <http://www.sciencedirect.com.ep.bib.mdh.se/science/article/pii/S0747563215001181> [Accessed 3 December 2015].
Macdonald, E.K. and Sharp, S.M., 2000. Brand Awareness Effects on Consumer Decision Making for a Common, Repeat Purchase Product: A Replication. Journal of Business Research, [e-journal], 48(1), pp. 5-15. Available through: ScienceDirect <http://www.sciencedirect.com.ep.bib.mdh.se/science/article/pii/S0148296398000708> [Accessed 3 December 2015].
Macdonald, E.K. and Sharp, B.M., 2003. Management Perceptions of the Importance of Brand Awareness as an Indication of Advertising Effectiveness. Marketing Bulletin, 14, Article 2.
Miraftabzadeh, S.M. et al., 2015. Measuring the Role and Value of a Corporate Brand on Customers’ Perception of Products and Services. International Journal Of Academic Research, [e-journal], 7(1) pp. 302-306. Available through: Mälardalen’s University Library Database <http://eds.b.ebscohost.com.ep.bib.mdh.se/eds/detail/detail?vid=8&sid=c808fa8b-7de9-4cb8-9c0f-c05d9cd7a4be%40sessionmgr113&hid=113&bdata=JnNpdGU9ZWRzLWxpdmU%3d#AN=101203559&db=afh> [Accessed 4 December 2015].
Moisescu, O. I., 2009. The Importance of Brand Awareness in Consumers’ Buying Decision and Perceived Risk Assessment. Management & Marketing Journal, 7(2), pp. 103-110. Peters, K. et al., 2013. Social Media Metrics - A Framework and Guidelines for Managing Social Media. Journal of Interactive Marketing, [e-journal], 27(4), pp. 281-288. Available through: ScienceDirect <http://www.sciencedirect.com/science/article/pii/S109499681300042X> [Accessed 29 November 2015].
Saunders, M., Lewis, P. and Thornhill, A., 2009. Research Methods for Business Students. 5th ed. Harlow: Pearson Education Limited.
Suelin, C., 2010. Understanding Consumer Purchase Behavior in the Japanese Personal Grooming Sector. Journal of Yasar University, 17 (5/2821-2831), pp. 2910-2921.
Tsimonis, G. and Dimitriadis, S., 2014. Brand Strategies in Social Media. Marketing Intelligence & Planning, 32(3), pp. 328-344.
Zaglia, M.E., 2013. Brand Communities Embedded in Social Networks. Journal of Business Research, [e-journal], 66(2), pp. 216-223. Available through: ScienceDirect <http://dx.doi.org/10.1016/j.jbusres.2012.07.015> [Accessed 15 December 2015].
Zeithaml V. A., 1988. Consumer Perceptions of Price, Quality and Value: A Means-end Model and Synthesis of Evidence. Journal of Marketing, 52(7), pp. 2-22.
Websites:
Alla Bolag. [online] Available at: <http://www.allabolag.se/5567466106/MixWell_AB>[Accessed 9 January 2016].
Business Dictionary. [online] Available at: <http://www.businessdictionary.com/definition/niche-product.html> [Accessed 9 December 2015].
Business Dictionary. [online] Available at: <http://www.businessdictionary.com/definition/word-of-mouth-marketing.html> [Accsessed 9 January 2016].
Financial Times. [online] Available at: <http://lexicon.ft.com/Term?term=user_generated-content-(UGC)> [Accessed 9 December 2015].
Campbell, A., 2010. Social Media – A Definition. Amy Campbell’s Web Log, [blog] 21 January, Available at: <http://blogs.harvard.edu/amy/2010/01/21/social-media-a-definition/> [Accessed 29 November 2015].
Linton, I., n.d. Hearst Newspaper, Measurable Goals for Brand Awareness, [online]. Available at: <http://smallbusiness.chron.com/measurable-goals-brand-awareness-38520.html> [Accessed 1 December 2015].
Mixwell, 2008. Företaget. [online] Available at: <http://www.mixwell.com/foretaget.php> [Accessed 9 December 2015].
Web.M.D, 2014. Celiac Disease Health Centre. [online] Available through: <http://www.webmd.com/digestive-disorders/celiac-disease/celiac-disease-topic-overview?page=2> [Accessed 8 December 2015].
Investopedia. [online] Available at: <http://www.investopedia.com/terms/m/microenterprise.asp> [Accessed 9 December 2015].

34
APPENDIX 1: Questionnaire 1
This version of the survey has been modified in size in order to fit on one page.
Market ResearchThis research contributes to our study of how micro-enterprises can increase their brand awareness with the help of social media. It contains some short questions about the influence social media has on brand awareness. 1. Gender: Male Female 2. Age: Under 18 18-25 26-35 35+ 3. Which social media platforms are you currently using? (If you are using several, please rank them from 1-5, 1 being the platform most frequently used). Facebook Instagram Twitter Blogs Other 4. What functions do you prefer seeing on social media platforms? (Please rank the alternatives from 1-5, 1 being the most important function). Possibility of leaving feedback Get special offers Provision of customer service Demonstrations/pictures of products Publishing of product reviews 5. What is your main reason for buying gluten-free products? Healthier choice of food Because of Allergy Other Reason: 6. Are you currently a customer of MixWell?
7. If your answer was "Yes", how long have you been their customer? _______ months 8. Do you recognize the following brands?
Semper | Risenta | ICA Glutenfri | Oatly
Yes Yes Yes Yes
No No No No 9.Thanks to marketing through social media I recognize company’s brands when I go to the store.
Agree Partly Agree Disagree
10. How many updates do you expect to see on a firm’s Facebook page? ________ updates/week 11. The more likes/followers a company has, the more do I trust their brand.
Agree Partly Agree Disagree
12. Social media helps me to build a relationship with the company.
Agree Partly Agree Disagree
13. Do you recognize the brand of Mix Well? (See picture below). Yes No
Yes No
14. How often are you active on social media platforms? (Like/Share/Comment). _____ times/week 15. I participate in company-arranged contests on different social media platforms.
Often Sometimes Hardly Ever Never
16. Which character of language should companies use on their SNS accounts? (see examples on the left).
Formal Neutral Friendly/Everyday
Examples of character of language:
Formal: “Dear Sir/Madam [Full Name]…” Neutral: “Hello [Full Name]…” Friendly/Everyday: “Hi [First Name]…”

35
APPENDIX 2: Questions for the Interview with the CEO of MixWell
These are the questions the authors used for the interview with the CEO of MixWell AB. Everything was conducted via email where the CEO was able to include his own answers for all of the questions.
1. Who or how many people of your staff group are in charge of your marketing activities today?
2. On which social media platforms can customers find MixWell today?
3. Do you have any plans on expanding to other social media platforms? If so, which ones? Why so?
4. How long have you been using social media as a marketing tool?
5. How do you market yourself on these platforms? In other words, what is your
message? What is the message or image you want to communicate to your customers?
6. What types of functions are you currently offering the customers? (e.g. customer
service, demonstration of products, special offers, taking on feedback, and critique).
7. Have your customers left any feedback or remarks regarding your Facebook-page? If they have, what do they have to say about it?
8. How do you manage the aftermarket? How are you handling the feedback and
critique given by your customers on social media?
9. Have social media helped you to get closer to your customers? If so, how?
10. Are there any other instant effects caused by your current presence in social media?
11. Tell us a little bit about Mix Well. What makes you different from your competitors?
12. How does your customer base look today?
13. Who is the “typical” Mix Well customer? What are their characteristics and where can we find them?

36
APPENDIX 3: Tables of the Data Results from Questionnaire 1
The tables below present the rest of the primary data results of those questions from Questionnaire 1, which was not already included in Chapter 4. Demographics
GENDER NUMBER OF RESPONDENTS Female 102 Male 51 Other 6
Table 2: Gender.
AGE NUMBER OF RESPONDENTS
Under 18 6 18-25 92 26-35 46 35+ 15
Table 3: Age of the respondents.
Social Media Activities
TYPE OF LANGUAGE NUMBER OF RESPONDENTS
Formal 16 Neutral 61 Friendly/Everyday 82
Table 4: Character of language preferred for a company on SNS.
NUMBER OF RESPONDENTS Agree 62 Partly Agree 83 Disagree 14
Table 5: “The more likes/followers a company has, the more do I trust their brand.”
NUMBER OF RESPONDENTS Agree 126 Disagree 33
Table 6: “Social media helps me to build a relationship with the company.”
NUMBER OF RESPONDENTS Agree 60 Partly Agree 75 Disagree 24
Table 7: “Thanks to marketing through social media, I recognize companies’ brands when I visit a store.”
NUMBER OF RESPONDENTS Often 5 Sometimes 48 Hardly Ever 52 Never 54
Table 8:“I participate in company-arranged contests on different social media platforms.”

37
MixWell and Competitors
REASON NUMBER OF RESPONDENTS Healthier Choice of Food 36 Allergy 30 Other 29 Don’t buy Gluten-free Food 59 N/A 5
Table 9: Reason for buying gluten-free products.
MONTHS NUMBER OF RESPONDENTS 2 1 3 2 5 1 6 2 10 1 12 2 15 1 24 1 36 1 48 1 60 1 180 1
Table 10: Number of months being a customer of MixWell.
BRAND YES NO Semper 75 84 Risenta (N/A: 1)
80 78
ICA Glutenfri (N/A: 2)
57 100
Oatly (N/A: 1)
100 58
Table 11: MixWell's Competitors.