increase at pedestrian height in … heat contribution to air temperature increase at pedestrian...
TRANSCRIPT

ANTHROPOGENIC HEAT CONTRIBUTION TO AIR TEMPERATUREINCREASE AT PEDESTRIAN HEIGHT IN SINGAPORE’SHIGH DENSITY CENTRAL BUSINESS DISTRICT (CBD)
Daniel HII Jun ChungProf. WONG Nyuk HienDr. Steve Kardinal JUSUF
20 July 2015
0
1
CONTENT
• INTRO (UHI & ANTHROPOGENIC HEAT)• SITE MEASUREMENT• PRELIMINARY STUDIES (ROADSIDE MEASUREMENT)• PRELIMINARY STUDIES (CFD SIMULATION)• CONCLUSION & FUTURE WORK
UHI
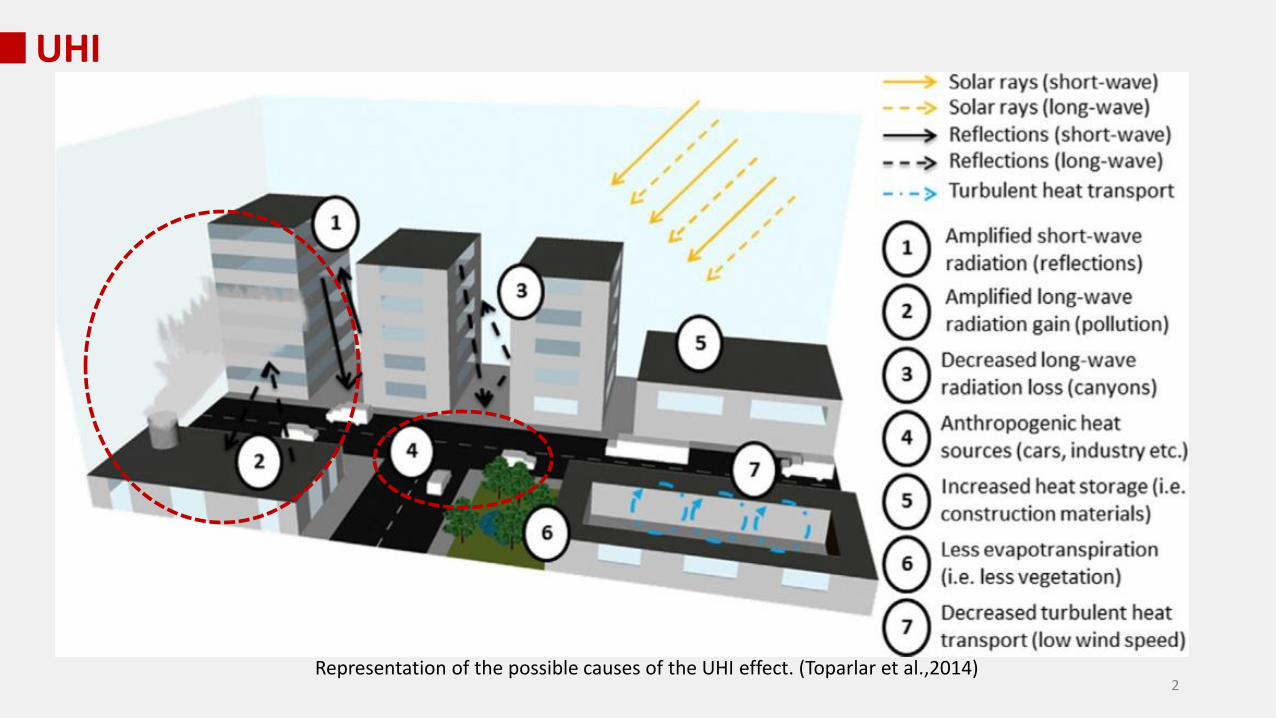
Representation of the possible causes of the UHI effect. (Toparlar et al.,2014)2

ANTHROPOGENIC HEAT
3
Conceptual representation of the urban energy balance for a balancing volume that reaches from the depth where no exchange with the subsurface is found (zb) to the measurement
height on a tower above the urban ecosystem (zt). (Grimmond and Christen, 2012)
Q* + QF = QH + QE + ΔQS
Flowchart of the LUCY global anthropogenic heat. (Allen et al., 2011)
QF = QM + QV + QB

4
Ohashi et al. (2003) 1-2°C temperature rise within the building canopy. Narumi et al. (2003) Osaka resulted 1°C temperature rise compared with baseline simulations.
Bohnenstengel et al. (2013), Chen et al. (2009); Kikegawa et al. (2014); Krpo et al. (2010); Li et al. (2014); Fan & Sailor (2005); Jusuf & Wong (2009) Anthropogenic heat contributes 0.4 oC - 3oC to the air temperature.
ANTHROPOGENIC HEAT & AIR TEMPERATURE RISE
ANTHROPOGENIC HEAT IN SINGAPORE
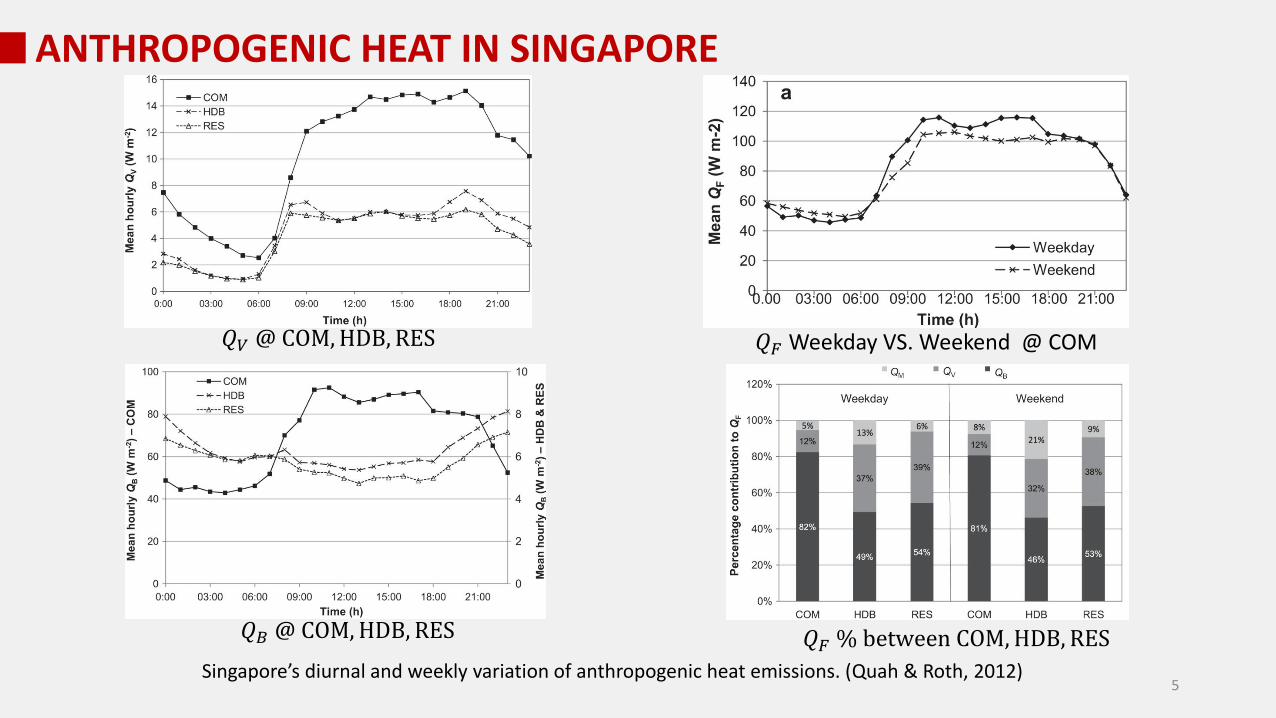
5Singapore’s diurnal and weekly variation of anthropogenic heat emissions. (Quah & Roth, 2012)
𝑄𝑉 @ COM,HDB, RES
𝑄𝐵 @ COM,HDB, RES
𝑄𝐹 Weekday VS. Weekend @ COM
𝑄𝐹 % between COM,HDB, RES

ANTHROPOGENIC HEAT
Annual energy consumption per capita versus combined total of annual heating and cooling degree days (°C) for countries with a population greater than 1 million for 2005. (Lindberg et al., 2013)
Singapore
6

City: Tokyo London Guangzhou Singapore Hong KongMotor Vehicles (per 1,000 people): 350 (cars) 317.2 (cars) 150 149 77Population Density (/sqkm): 6,029 5,285 1,708 7,669 6,516H/W Ratio: 0.4142 0.47 0.8 2.45 2.99 / 4.01
Vertical obstruction angle restrictions in different cities. (Ng, 2009 & Ng, 2012)
Cities population and vehicles density
*H/W = Height to Width
7
ANTHROPOGENIC HEAT

Number of cars per 100 persons and road density (km/sqkm). (LTA, 2014)
Year Amount
2002 245,000
2003 244,000
2011 300,000
2012 292,000
Average daily traffic volume entering the CBD. (LTA, 2014)
Year Amount2002 706,9562003 711,0432011 956,7042012 969,910
Motor vehicle population. (LTA, 2014)
Public bus fleet/million persons.(LTA, 2014)
8
ANTHROPOGENIC HEAT

SITE MEASUREMENT
9
The URA Masterplan showing the plot ratio figures of the measurement site at the CBD above and the new Marina Bay development below. (URA, 2014)
10
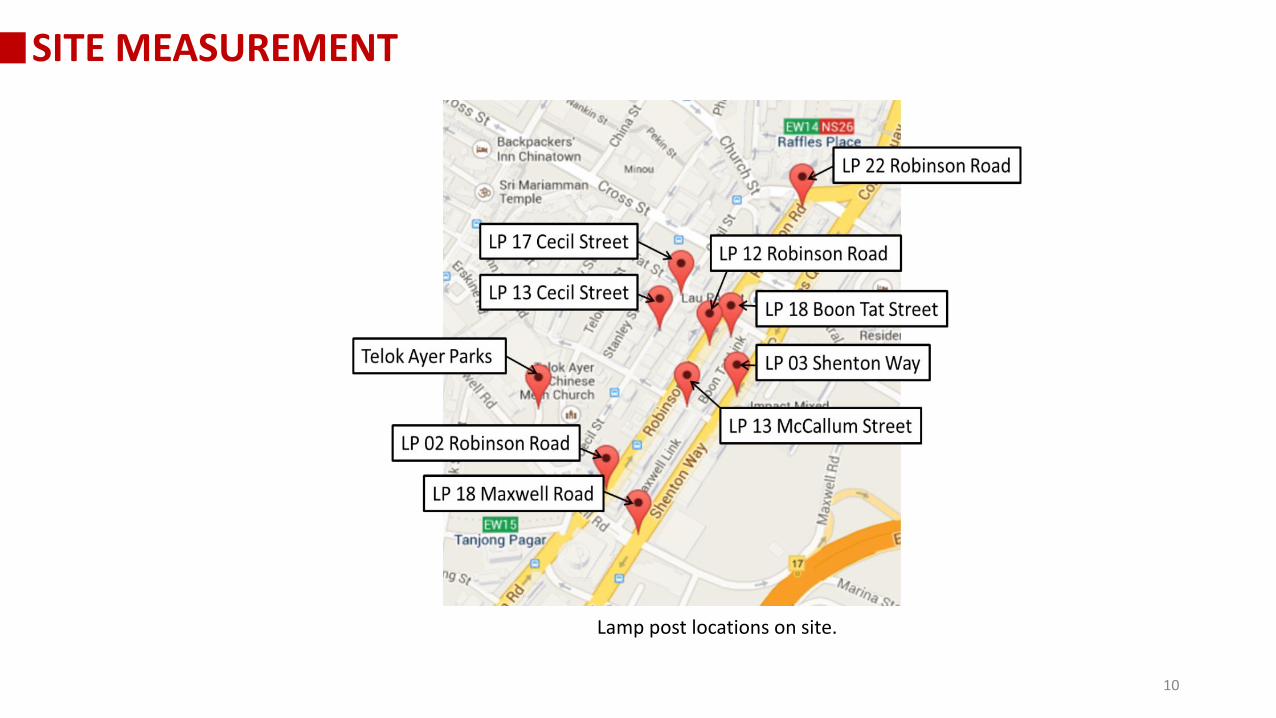
Lamp post locations on site.
SITE MEASUREMENT
11
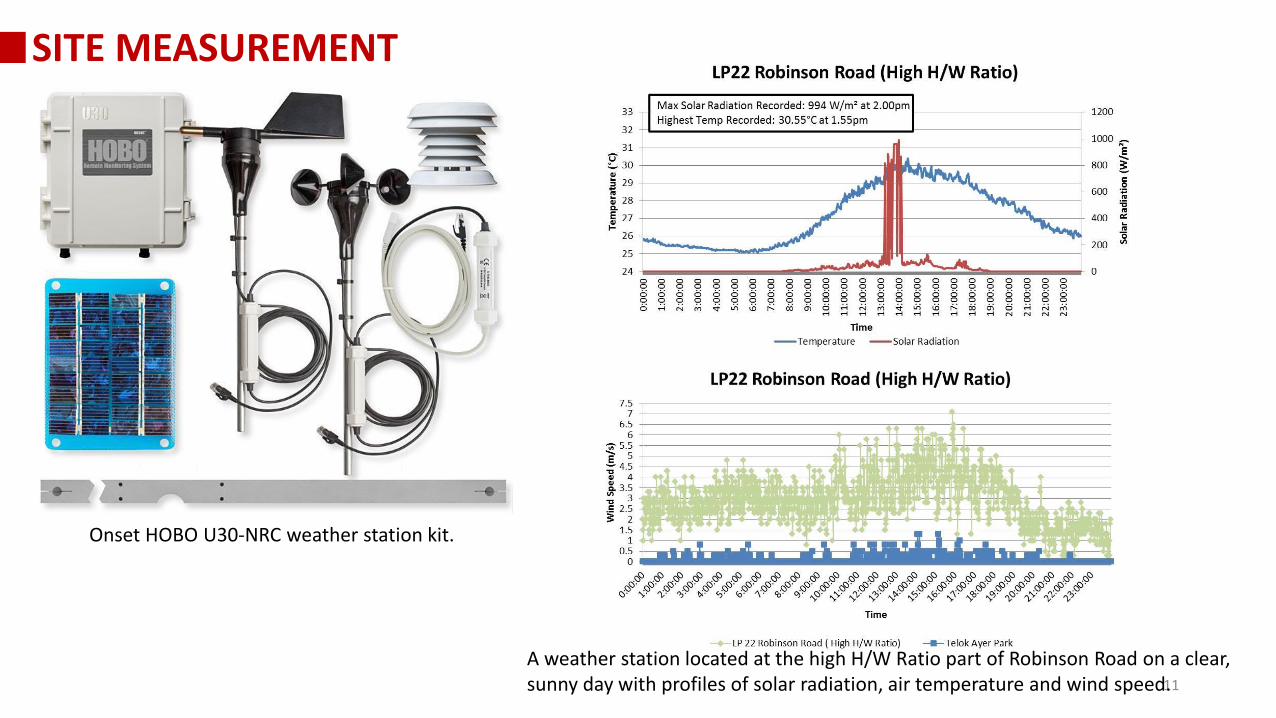
A weather station located at the high H/W Ratio part of Robinson Road on a clear, sunny day with profiles of solar radiation, air temperature and wind speed.
Onset HOBO U30-NRC weather station kit.
SITE MEASUREMENT

Park(Baseline)
Water UndergroundCarpark
High H/W Ratio
BBQSatay
Weather Stations on CBD Site
12
SITE MEASUREMENT
-Shading, cooling effect, idling vehicles, openness.
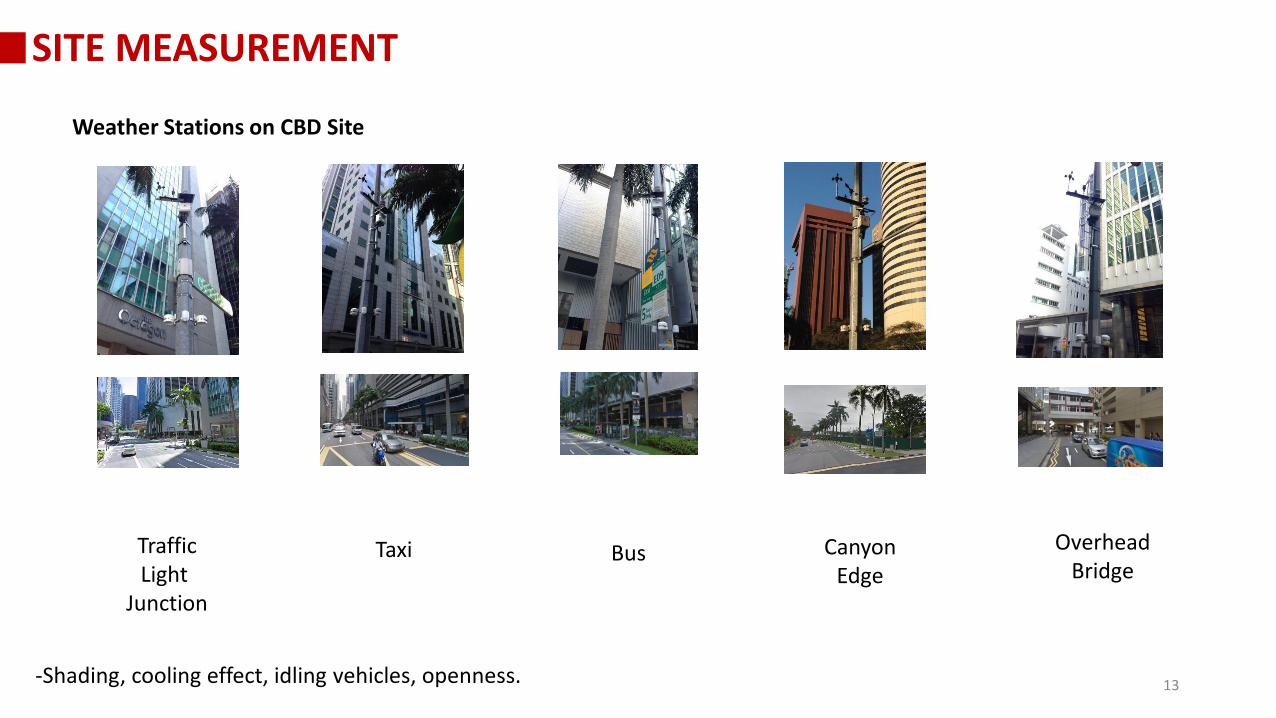
TrafficLight
Junction
Taxi Bus CanyonEdge
OverheadBridge
Weather Stations on CBD Site
13
SITE MEASUREMENT
-Shading, cooling effect, idling vehicles, openness.

14
Weekdays
Weekends
Weekdays and weekends (February 2014) air temperature at 3.5m above ground (MR_ES=Maxwell Road_Edge of Site, RR_BS=Robinson Road_Bus Stop, BTS_BBQ=Boon Tat
Street_Barbeque Stalls, TAP_TC=Telok Ayer Park_Trees Canopy, RR_HWR=Robinson Road_High Height-to-Width Ratio, CS_TJ=Cecil Street_Traffic Junction,, CS_TS=Cecil Street_Taxi Stand, MC_OB=McCallum Street_Overhead Bridge, RR_WF=Robinson Road_Water Feature, SW_CPE=Shenton Way_Car Park Entrance).
PRELIMINARY STUDIES (Weather Stations)
PRELIMINARY STUDIES (Weather Stations)
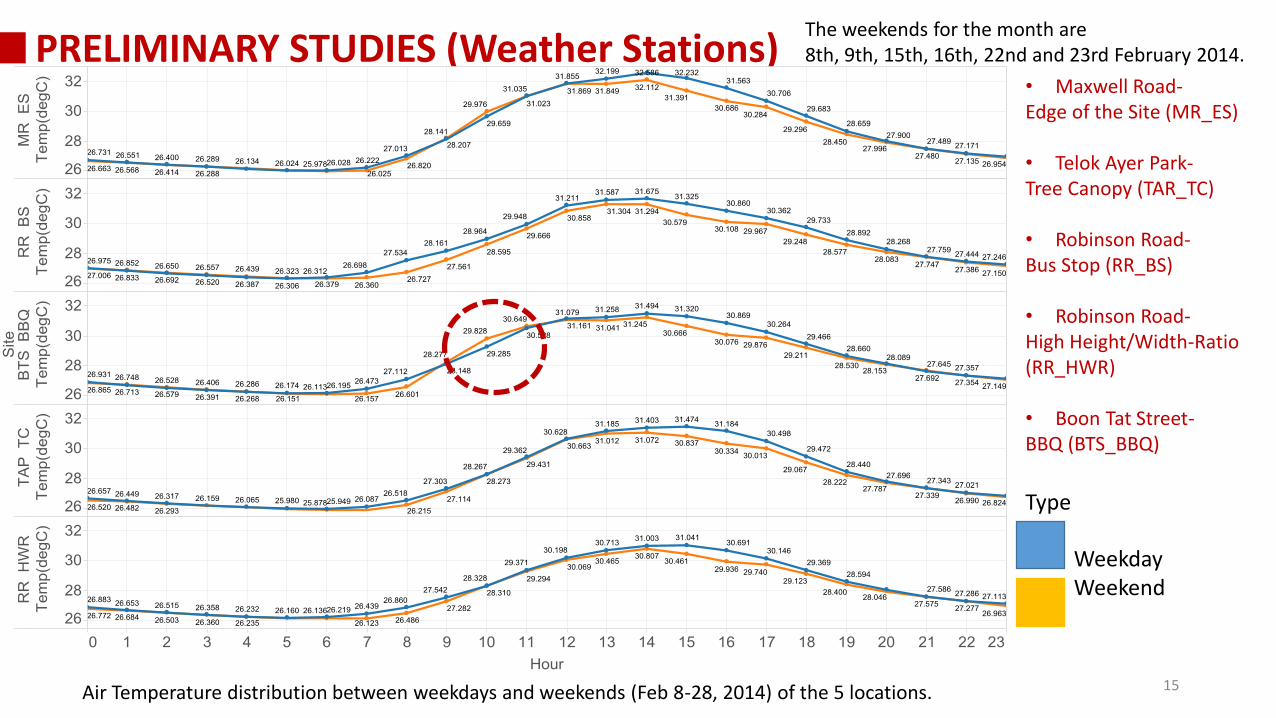
15Air Temperature distribution between weekdays and weekends (Feb 8-28, 2014) of the 5 locations.
The weekends for the month are 8th, 9th, 15th, 16th, 22nd and 23rd February 2014.
• Maxwell Road-Edge of the Site (MR_ES)
• Telok Ayer Park-Tree Canopy (TAR_TC)
• Robinson Road-Bus Stop (RR_BS)
• Robinson Road-High Height/Width-Ratio (RR_HWR)
• Boon Tat Street-BBQ (BTS_BBQ)
Type
WeekdayWeekend

PRELIMINARY STUDIES (Roadside Measurements)
16
Fluke TiR125 thermal imager.
Roadside measurement at the bus stop in the urban canyon in the afternoon.
Bus surfaces under thermal imaging.Roadside measurement equipment
on the 1.2m high tripod.

0
1
2
3
282930313233
0 500 1000 1500 2000 2500 3000 3500 4000Tem
pe
ratu
re (
°C)
Time (sec.)
Temp & Bus Count (5 second interval (5:50-6:50PM, 16Feb2014 Weekend)
Temp (degC) Bus CountTemperature and bus count during rush hour of a weekend
0
1
2
3
29303132333435
0 500 1000 1500 2000 2500 3000 3500 4000
Tem
pe
ratu
re (
°C)
Time (sec.)
Temp & Bus Count (5 second interval (5:50-6:50PM, 17Feb2014 Weekday)
Temp (degC) Bus Count
WEEKEND
WEEKDAY
Temperature and bus count during rush hour of a weekday 17
PRELIMINARY STUDIES (Roadside Measurements)

SLAB PLAN ELEVATION POINT PLAN
Computational Fluid Dynamics (CFD) SimulationFluent 15: Realizable K-Epsilon with buoyancy, solar load model & S2S radiation, transient
H/W 2 & 4(8 & 16 stories)
18
PRELIMINARY STUDIES (CFD Simulation)

North & East Wind Directions 2m Pedestrian Height2.3m/s @ 15m.
19
PRELIMINARY STUDIES (CFD Simulation)

Parallel Flow (Plan) Perpendicular Flow (Plan)
20
PRELIMINARY STUDIES (CFD Simulation)

Parallel Flow (Left Elevation) Perpendicular Flow (Left Elevation)
21
PRELIMINARY STUDIES (CFD Simulation)

PRELIMINARY STUDIES (CFD Simulation)
22Without and with bus heat.
Bus Heat
YesNo
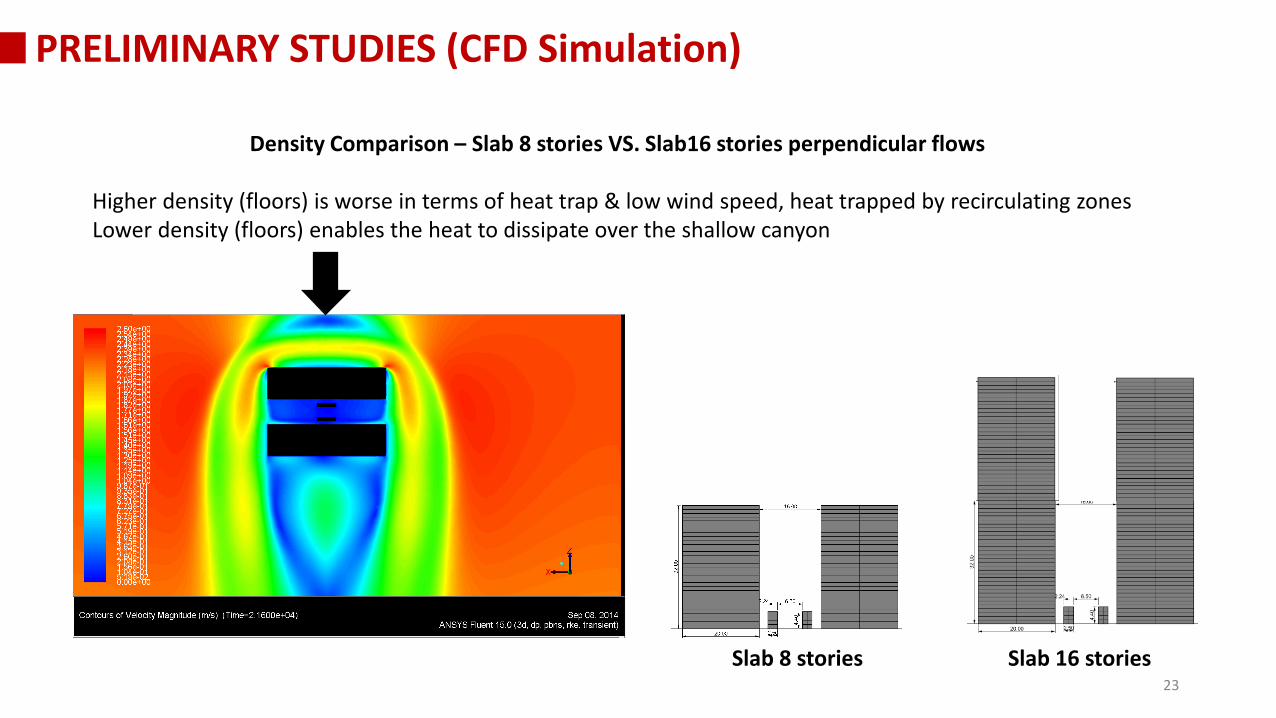
Density Comparison – Slab 8 stories VS. Slab16 stories perpendicular flows
Higher density (floors) is worse in terms of heat trap & low wind speed, heat trapped by recirculating zonesLower density (floors) enables the heat to dissipate over the shallow canyon
Slab 8 stories Slab 16 stories 23
PRELIMINARY STUDIES (CFD Simulation)
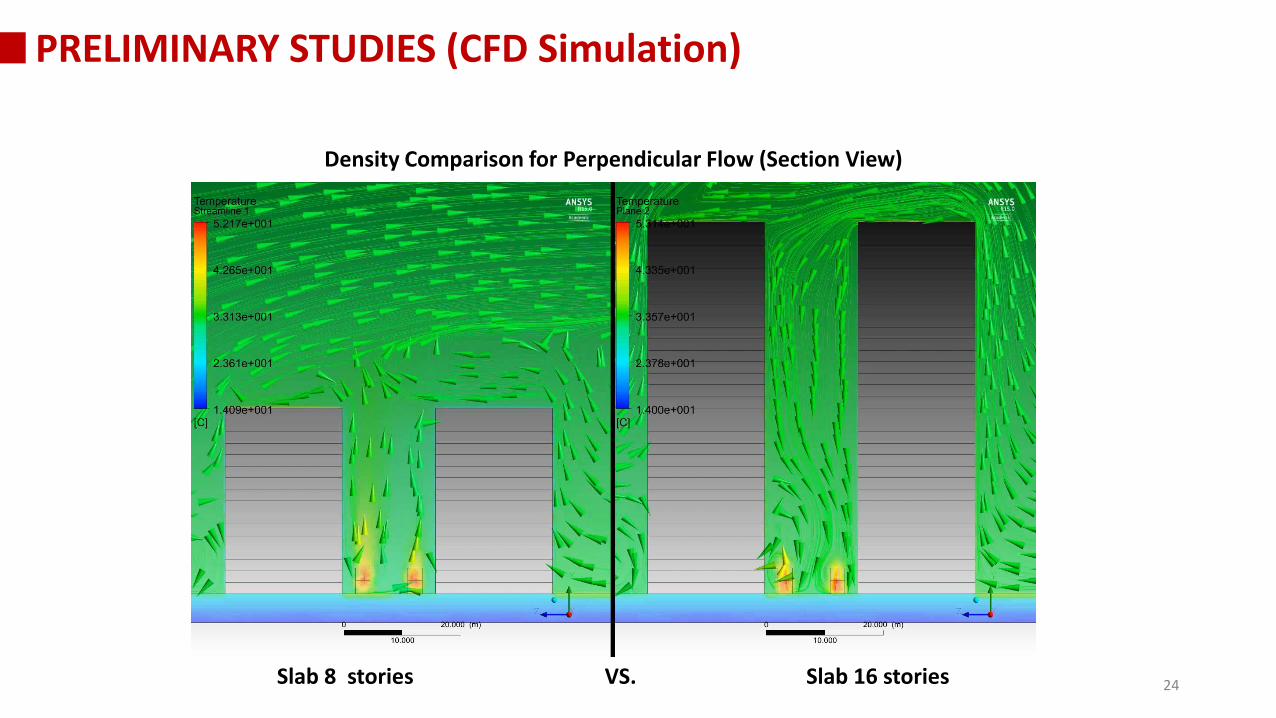
Density Comparison for Perpendicular Flow (Section View)
Slab 8 stories VS. Slab 16 stories 24
PRELIMINARY STUDIES (CFD Simulation)
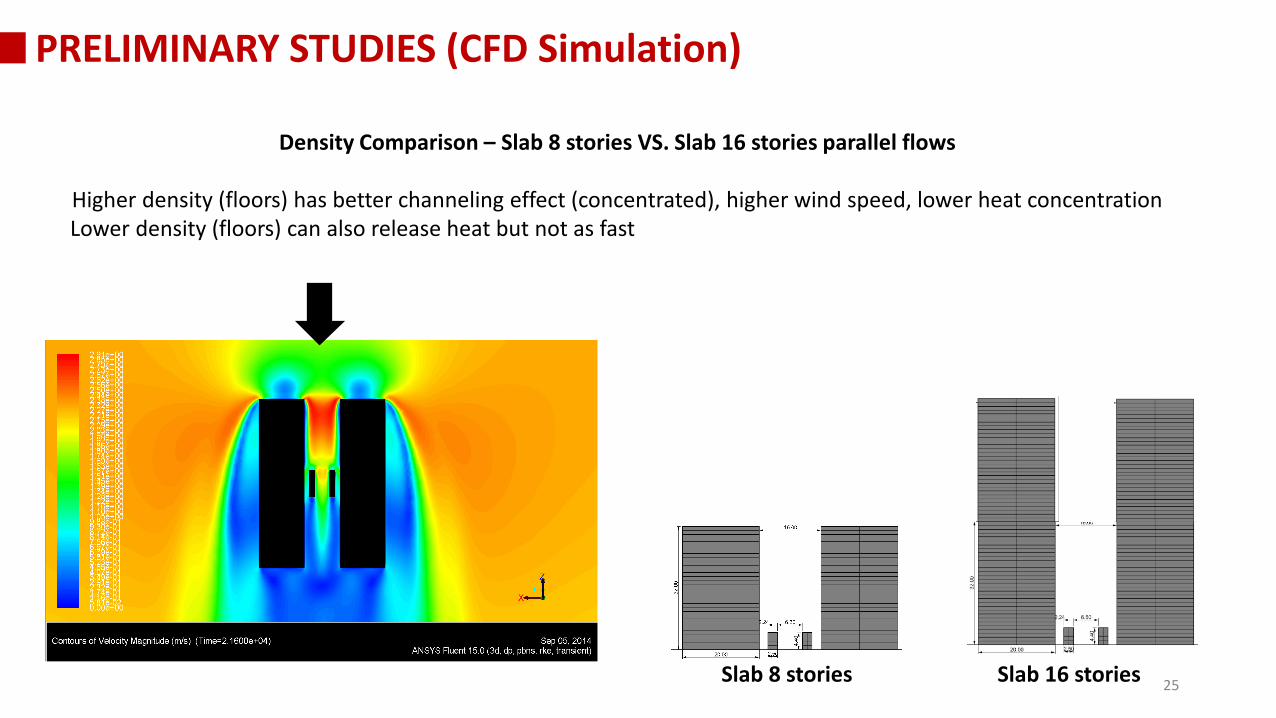
Density Comparison – Slab 8 stories VS. Slab 16 stories parallel flows
Higher density (floors) has better channeling effect (concentrated), higher wind speed, lower heat concentrationLower density (floors) can also release heat but not as fast
Slab 8 stories Slab 16 stories 25
PRELIMINARY STUDIES (CFD Simulation)
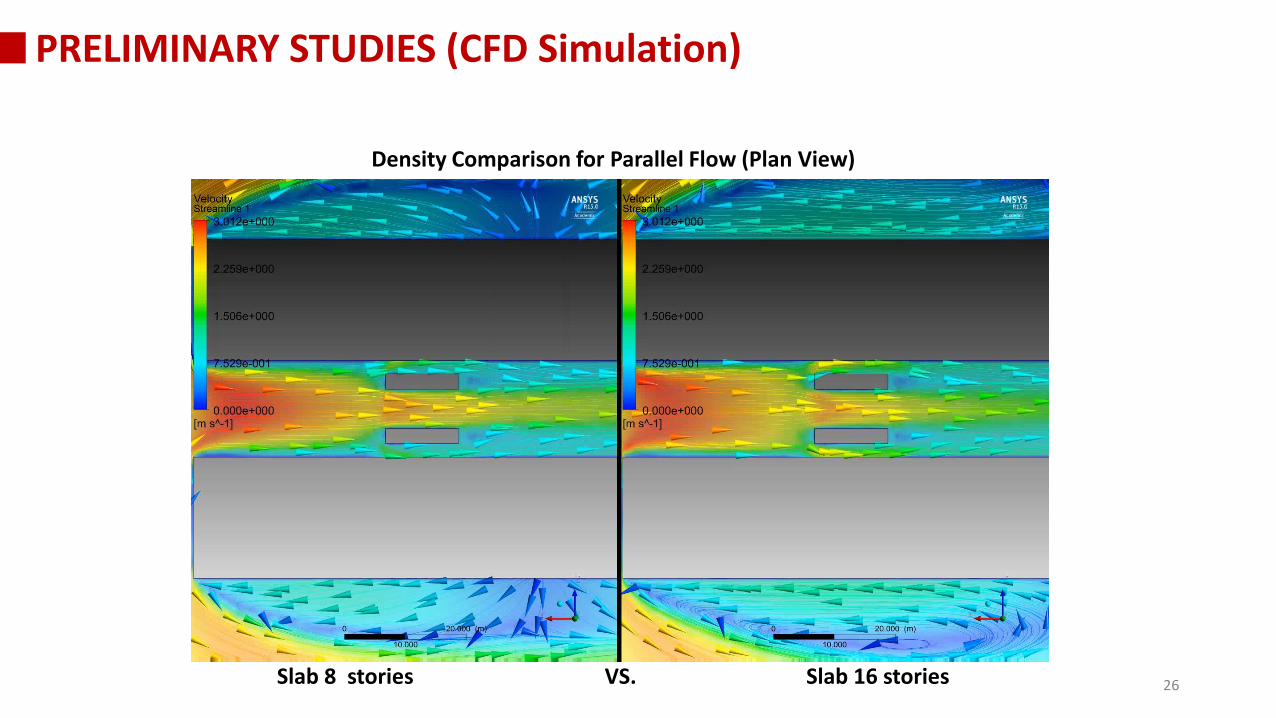
Density Comparison for Parallel Flow (Plan View)
Slab 8 stories VS. Slab 16 stories 26
PRELIMINARY STUDIES (CFD Simulation)
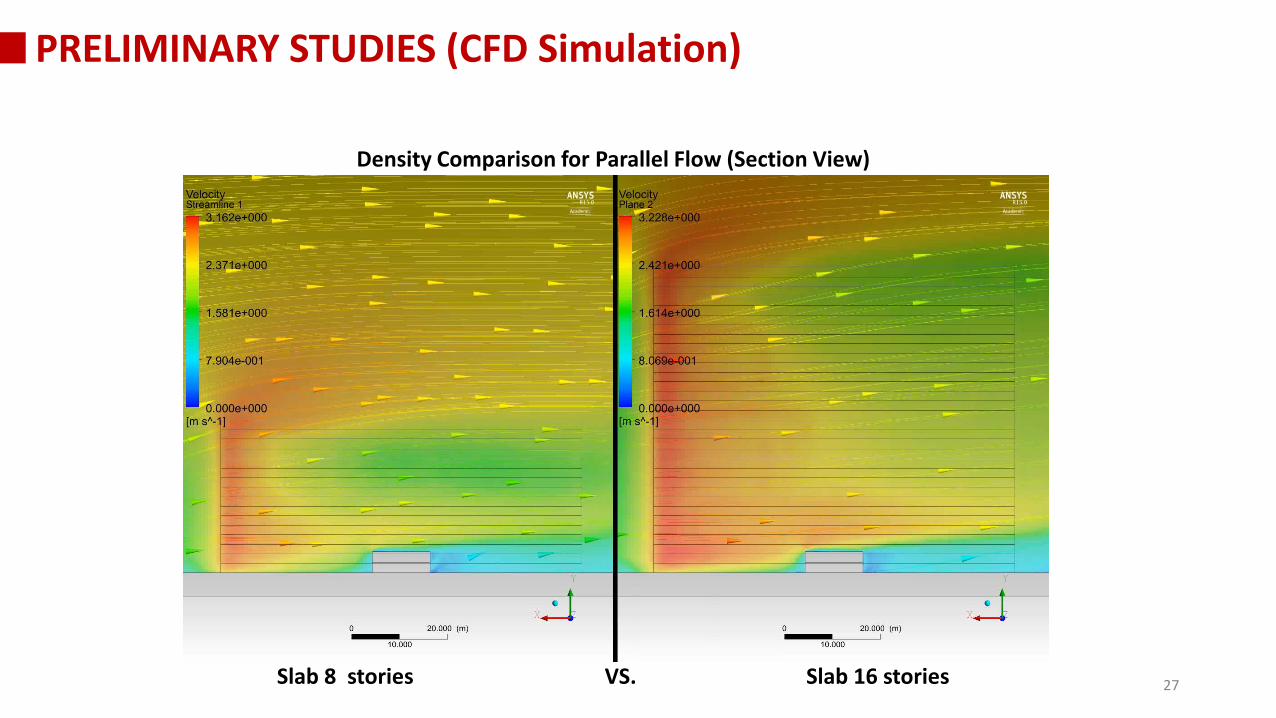
Density Comparison for Parallel Flow (Section View)
Slab 8 stories VS. Slab 16 stories 27
PRELIMINARY STUDIES (CFD Simulation)

Form Comparison – Slab 16 stories VS. Points16 perpendicular flowsPoints are better at dissipating heat and higher wind speed because of porosity
Points 16 stories VS. Slab 16 stories28
PRELIMINARY STUDIES (CFD Simulation)

Form Comparison for Perpendicular Flow (Plan View)
Points 16 stories VS. Slab 16 stories 29
PRELIMINARY STUDIES (CFD Simulation)
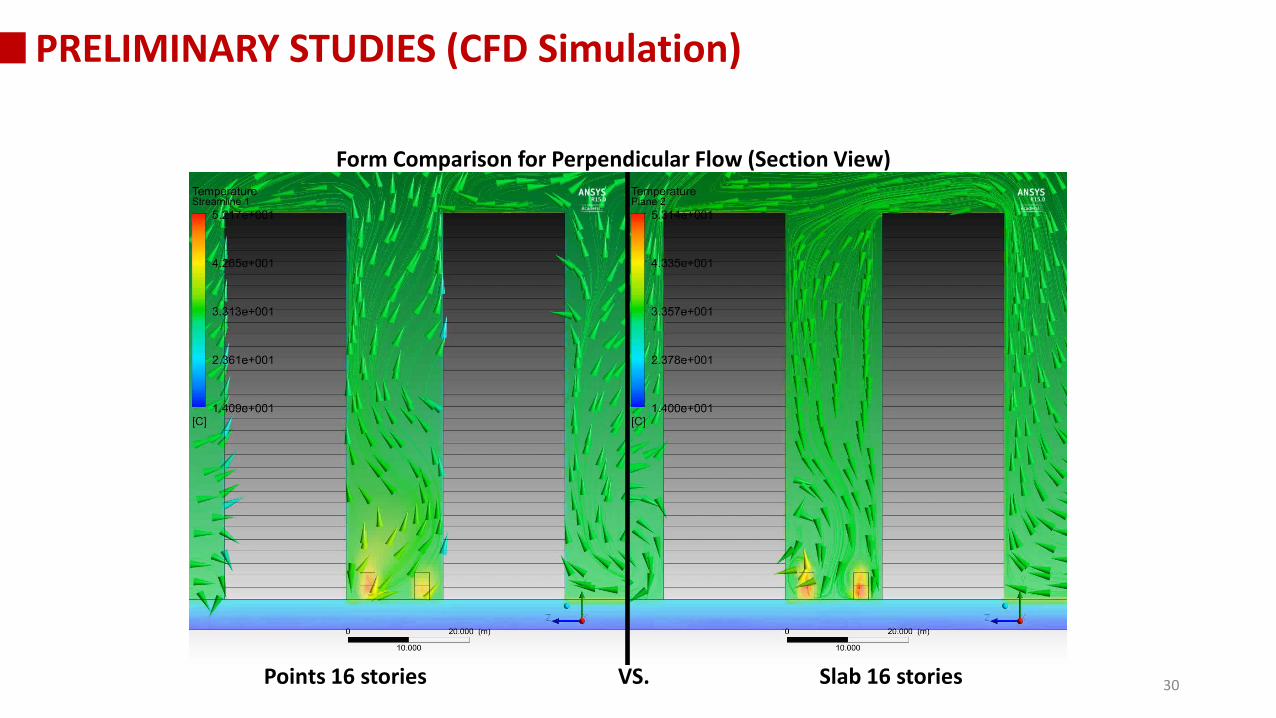
Form Comparison for Perpendicular Flow (Section View)
Points 16 stories VS. Slab 16 stories 30
PRELIMINARY STUDIES (CFD Simulation)
Wind flow regulates the air temperature inside the canyon well by parallel flow. Higher H/W ratio receives better channeling effect causing higher wind speed and more shading.
Higher H/W ratio cases has higher air temperature and lower wind speed with for perpendicular flow.
If design against predominant wind direction, form permeability is more important while for design with predominant wind direction, density may help to create better urban ventilation.
31
PRELIMINARY STUDIES (CFD Simulation)

Ratio for simulationCars : Buses : Motorcycles : Goods Vehicles = 67 : 2 : 15 : 16(*2 covers 2/3 of street)
32
FUTURE WORK (CFD Simulation)
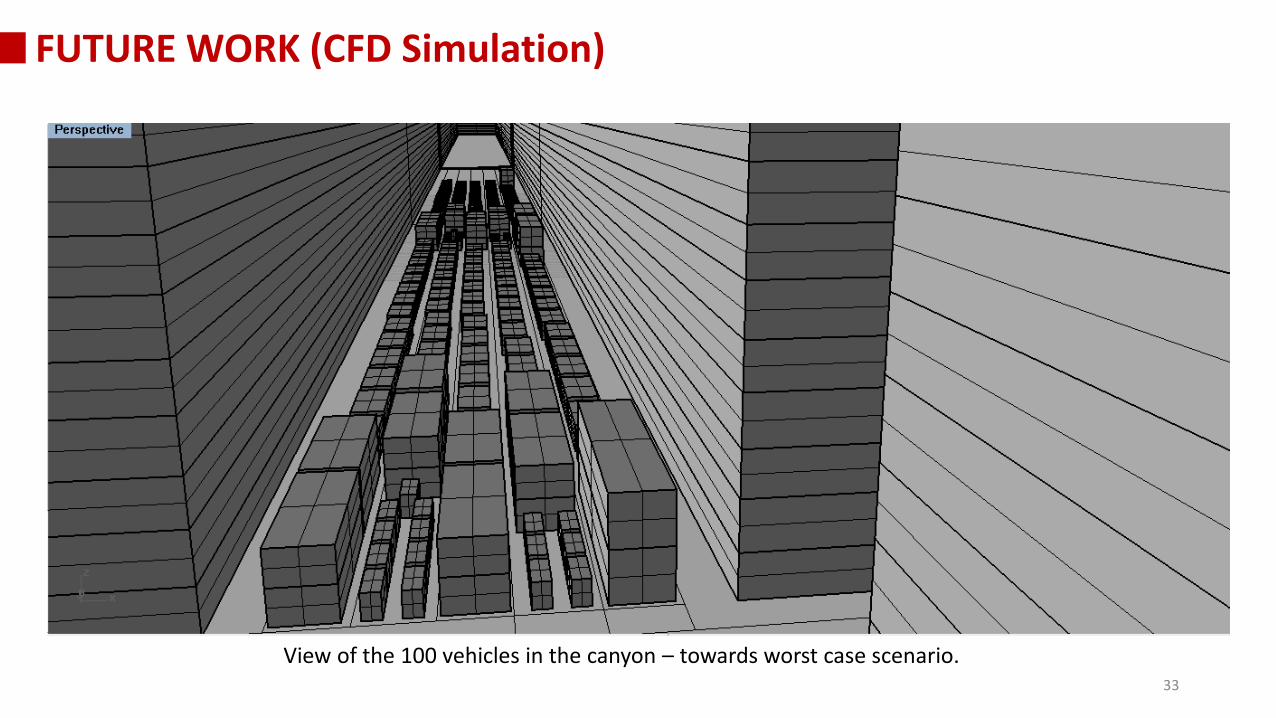
View of the 100 vehicles in the canyon – towards worst case scenario.33
FUTURE WORK (CFD Simulation)

Air temperature, wind velocity values taken at 10 spots (5 on left pedestrian, 5 on right pedestrian) in the canyon.
34
FUTURE WORK (CFD Simulation)
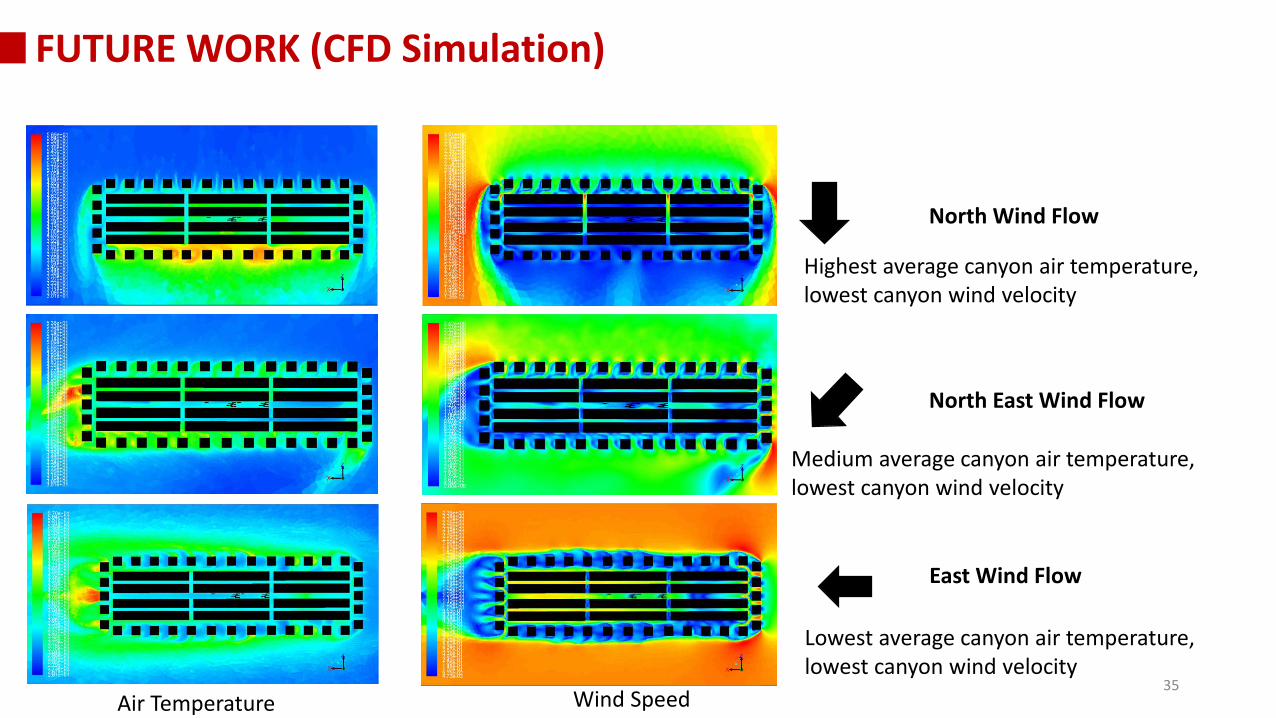
North Wind Flow
Air Temperature
Highest average canyon air temperature, lowest canyon wind velocity
North East Wind Flow
Wind Speed
Medium average canyon air temperature, lowest canyon wind velocity
Lowest average canyon air temperature, lowest canyon wind velocity
East Wind Flow
35
FUTURE WORK (CFD Simulation)

Parallel VS. Perpendicular Flow Difference (Plan)
Parallel flow has higher wind speed, lower recirculating zonesPerpendicular flow has lower wind speed, higher temperature because of recirculating zones
Parallel Flow VS. Perpendicular Flow 36
FUTURE WORK (CFD Simulation)
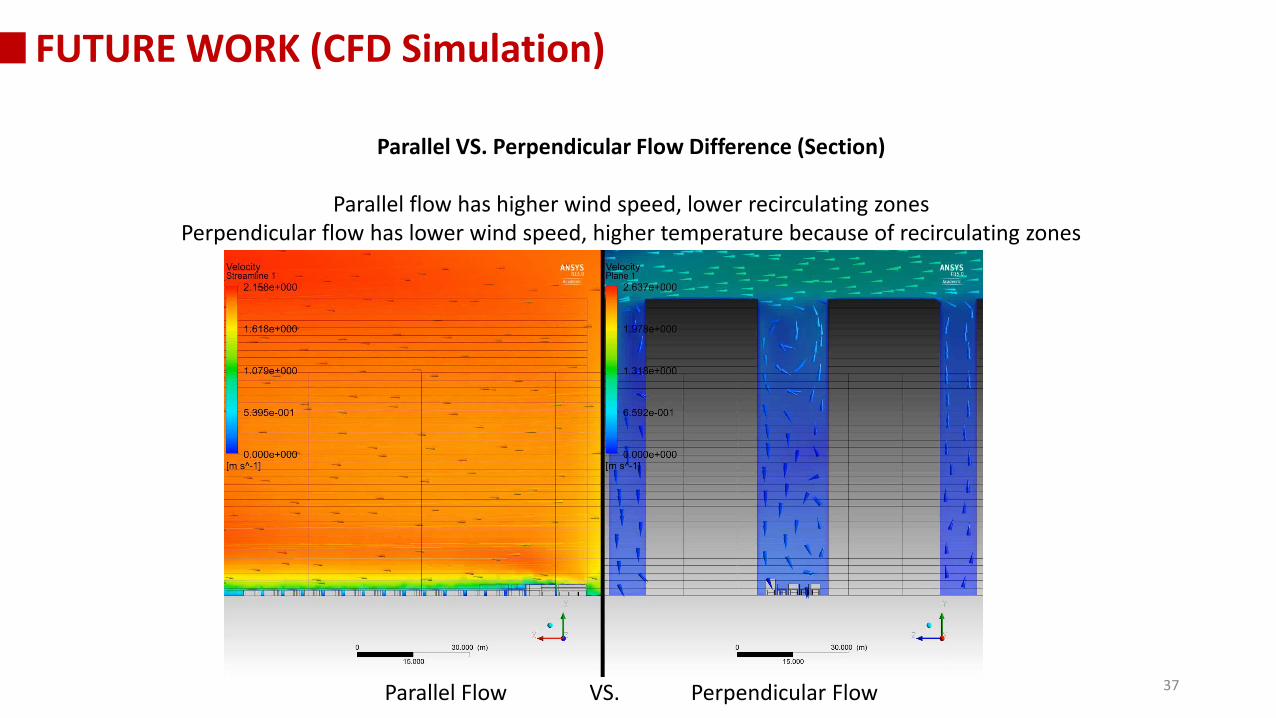
Parallel VS. Perpendicular Flow Difference (Section)
Parallel flow has higher wind speed, lower recirculating zonesPerpendicular flow has lower wind speed, higher temperature because of recirculating zones
Parallel Flow VS. Perpendicular Flow 37
FUTURE WORK (CFD Simulation)
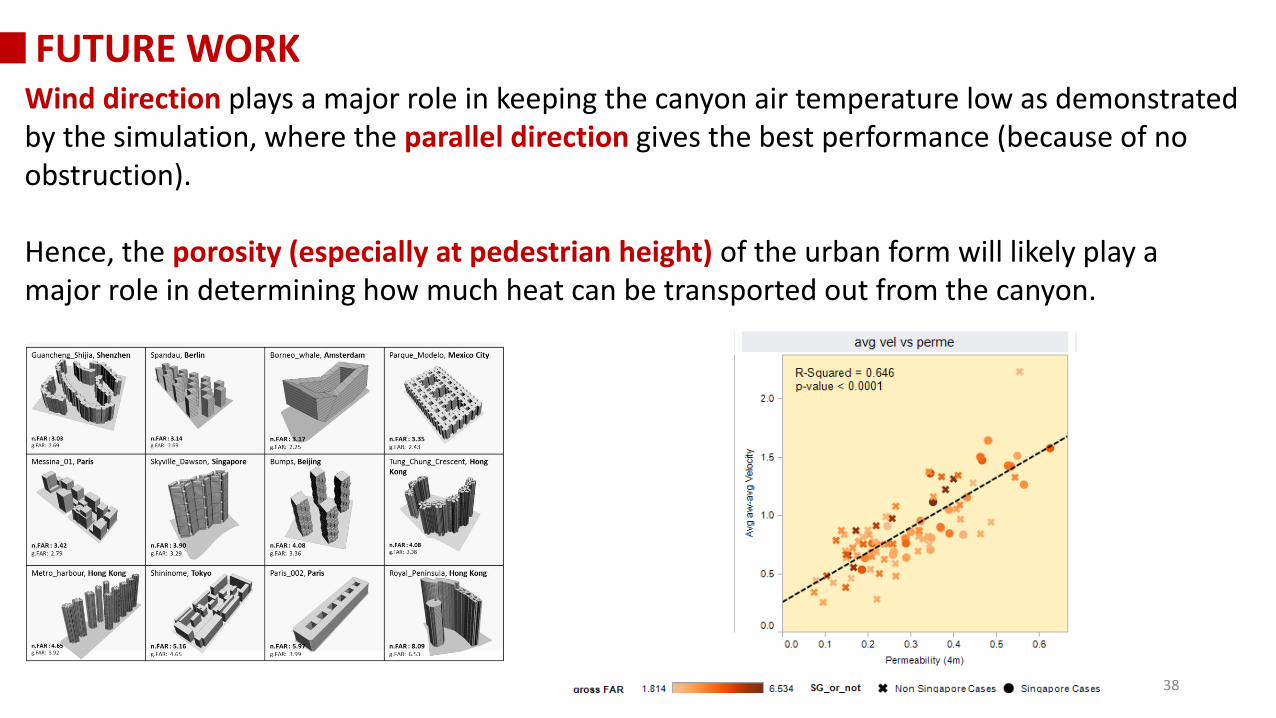
Wind direction plays a major role in keeping the canyon air temperature low as demonstrated by the simulation, where the parallel direction gives the best performance (because of no obstruction).
Hence, the porosity (especially at pedestrian height) of the urban form will likely play a major role in determining how much heat can be transported out from the canyon.
38
FUTURE WORK

39
FUTURE WORK
Other urban morphologies / geometric variables will be explored togetherto find their correlations to urban ventilationand air temperature of pedestrian heigt.
Considering EUI (Energy Use Intensity)rejecting from building rooftops as well(QB).
Key density and morphology variables.

ACKNOWLEDGEMENTThis research programme / project is funded by the National Research Foundation Singapore under its
Campus for Research Excellence and Technology Enterprise (CREATE) programme.
THANK YOU!
Q & A
40
Fighting Urban Heat Island (UHI) and Climate Change through Mitigation
and Adaptation
www.ic2uhi2016.org30 – 31 MAY AND 1 JUNE 2016
NATIONAL UNIVERSITY OF S INGAPORE
FOURTH INTERNATIONAL CONFERENCE ON COUNTERMEASURES TO URBAN HEAT ISLAND
4TH IC2UHI 2016
41