incorporating health into the planning and design of transportation improvements
TRANSCRIPT

Learning Objectives
Understand the relationship between public health and transportation planning
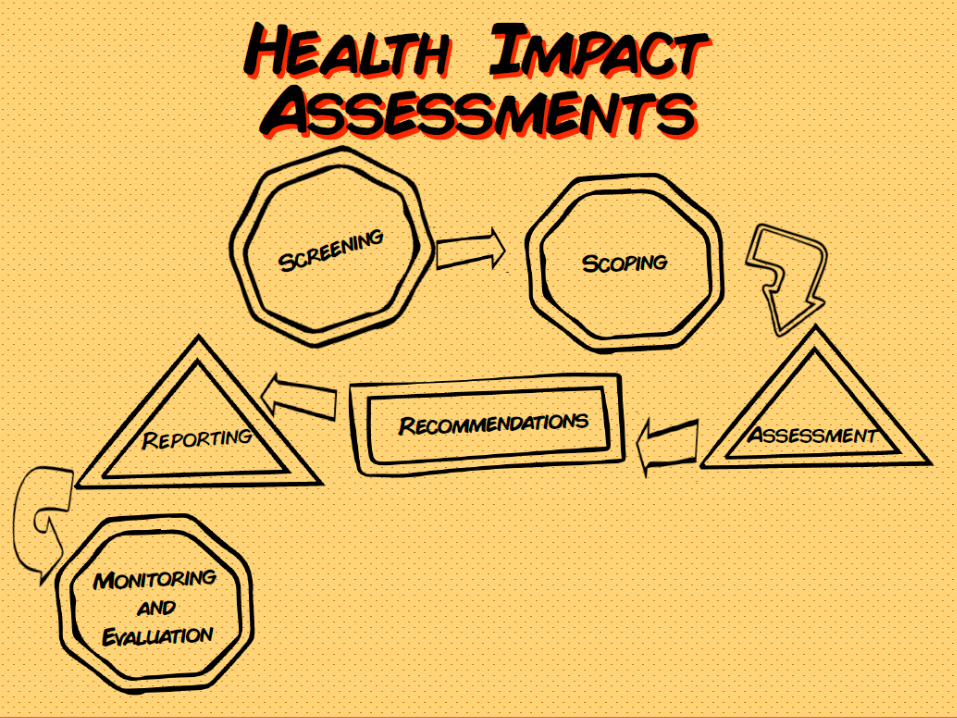
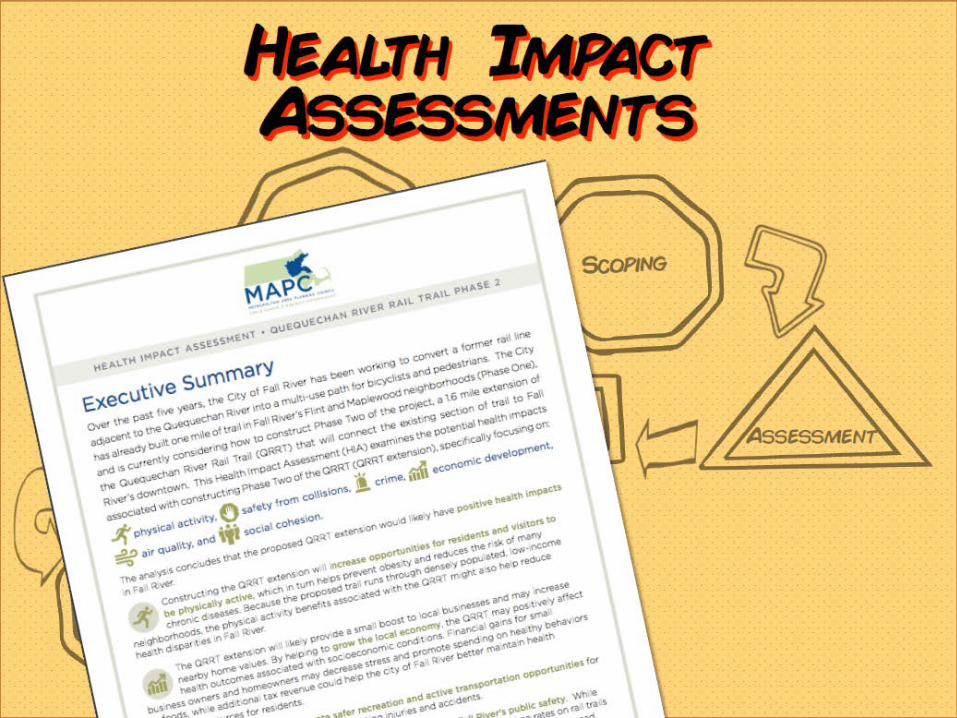
Health impact assessment
Best practices
Lessons learned
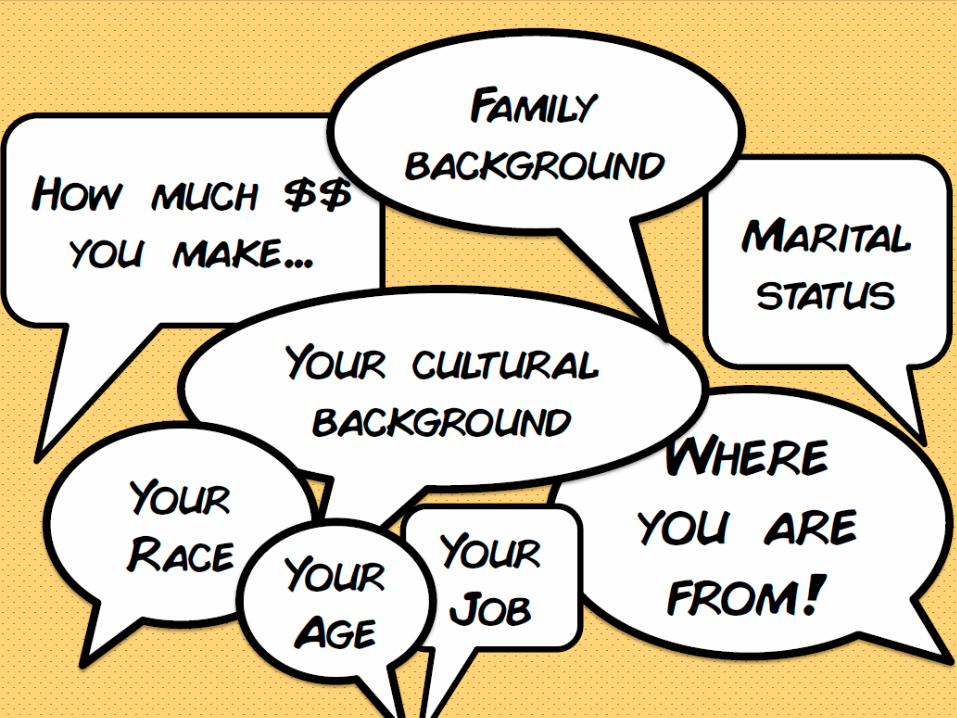
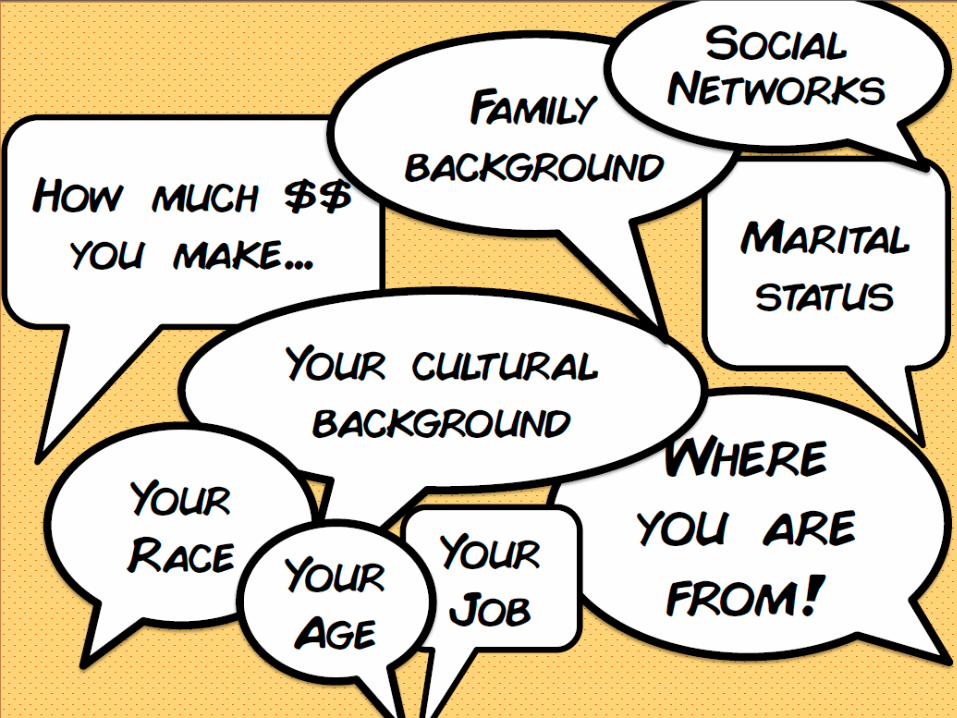
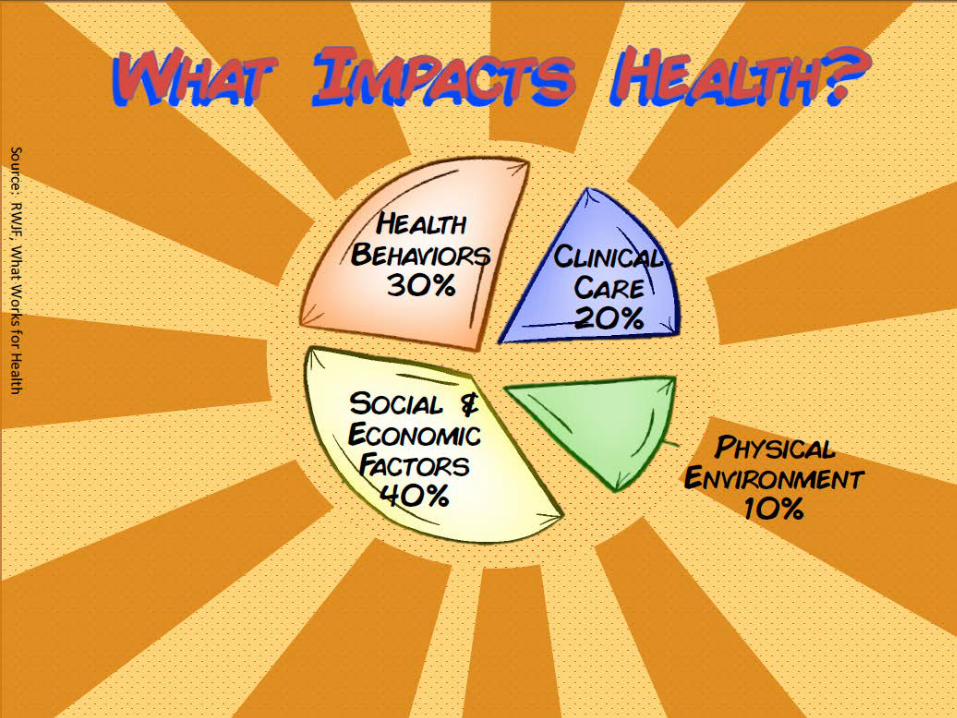
What factors determine our health?

Family health history
Source: Healthy Community Design – Making the Healthy Choice the Easy Choice (part of the CDC Healthy Community Design Checklist Toolkit)

Behaviors/lifestyles
Source: Healthy Community Design – Making the Healthy Choice the Easy Choice (part of the CDC Healthy Community Design Checklist Toolkit)

Built environment

The growing cost of health care is a global megatrend
CDC projects that by 2017, 19% of our GDP ($3 trillion) will be spent on health care
One-third of adults and 17% of children in the US are obese
Adult obesity rate could reach 43% of the population by 2018
Medical costs associated with obesity is ~$147 billion
We could save ~$5.5 billion in health care costs related to obesity if one in 10 adults started a walking program
Physical inactivity and unhealthy diet are second only to tobacco use as the main cause of premature death in the US
How we design communities reinforces the epidemic of obesity, diabetes, high blood pressure, heart disease, asthma, orthopedic, and psychological disorders
We have changed how much we walk or bike.

Source: CDC, 2000
walked or biked to school in 197466% of children

Source: CDC, 2000
walked or biked to school in 200013% of children

ConsequencesAdult Obesity Rate by State, 1995
1991
Source: Making Healthy Places: Designing and Building for Health, Well-Being, and Sustainability – Richard J. Jackson MD MPH AIA(Hon)

ConsequencesAdult Obesity Rate by State, 2000
Source: Making Healthy Places: Designing and Building for Health, Well-Being, and Sustainability – Richard J. Jackson MD MPH AIA(Hon)

ConsequencesAdult Obesity Rate by State, 2016
Source: Making Healthy Places: Designing and Building for Health, Well-Being, and Sustainability – Richard J. Jackson MD MPH AIA(Hon)

ConsequencesAdults with Diabetes Rate by State, 1995
Source: Making Healthy Places: Designing and Building for Health, Well-Being, and Sustainability – Richard J. Jackson MD MPH AIA(Hon)

ConsequencesAdults with Diabetes Rate by State, 2003
Source: Making Healthy Places: Designing and Building for Health, Well-Being, and Sustainability – Richard J. Jackson MD MPH AIA(Hon)

ConsequencesAdults with Diabetes Rate by State, 2016
Source: http://www.americashealthrankings.org/reports/annual

The Solution
We need to reverse the trend—prevention vs. treatment
Public health is no longer solely the business of health professionals
Relationship between the built environment and health– Strong connection between transit rich communities and better
health outcomes– Health is a competitive advantage for cities and their economic
development efforts– Opportunities to be healthy are influencing what people want
in their communities, workplaces, schools and public spaces
“Health is where we live, not a doctor’s office.”
—Dr. Richard Jackson, MD, MPH

What is Healthy Community Design?
HealthA state of complete physical, mental, and social well-being and not merely the absence of disease
Healthy Community DesignPlanning and designing communities and the built environment in a way that makes it easier for people to live healthy lives


Benefits of healthy community design Improve air and water quality
Lower the risk of traffic-related injuries
Easier to include physical activity into everyday life
Increase access to healthy food
Increase social connectivity and sense of community
Ensure social equity for all community members
Promote good mental health
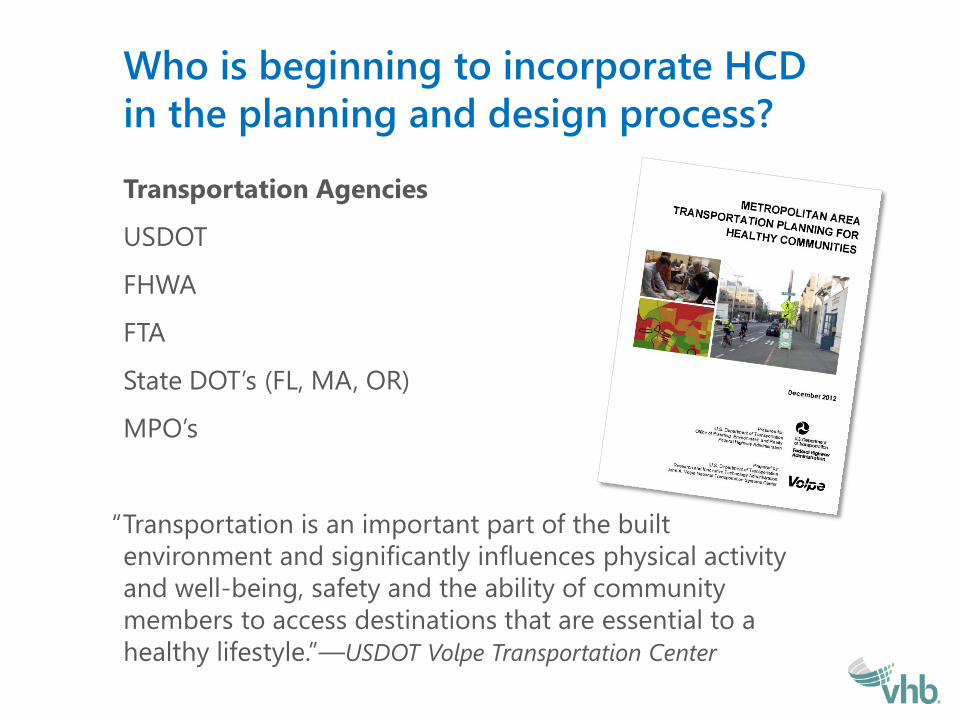
Who is beginning to incorporate HCD in the planning and design process?
Transportation Agencies
USDOT
FHWA
FTA
State DOT’s (FL, MA, OR)
MPO’s
“Transportation is an important part of the built environment and significantly influences physical activity and well-being, safety and the ability of community members to access destinations that are essential to a healthy lifestyle.”—USDOT Volpe Transportation Center

Who is beginning to incorporate HCD in the planning and design process?
Federal, State and Local Planning Agencies
HUD/USDOT/EPA Sustainable Community Plans
Choice Neighborhoods
Comprehensive Plans
Corridor Studies
Complete Streets
Redevelopment Plans
Zoning/Design Guidelines
How should Healthy Community Design be applied to transportation projects?
Apply the principles of HCD into the transportation planning process—holistic approach that can be used to determine which design solutions work best
Establish health indicators (metrics/measures) to assess and evaluate effectiveness
Partner with health agencies/organizations

A Healthy Corridor “Shift the focus from moving cars to connecting people”
Barriers
Curb cuts
Traffic volume and speed
Roadway dimensions
Lack of sidewalks and bike lanes
Lack of access to healthy food
Undesirable land uses (fast food, car dealerships/repair shops, liquor stores, gas stations)
Multiple landowners
Multiple jurisdictions
Linear, not nodal
Lot size
DOT standards—metric for success is moving cars efficiently
Not enough density to support mixed-use
Lack of political and civic leadership in making corridors healthy places
Access to local health data

A Healthy Corridor
Attributes
People before cars
Sites for community building—local arts and culture, gathering and celebration
“Place-focused“— emphasize visual appeal, connectivity, and authenticity
Connect to green space and nature
Mix of uses
Multiple modes of transportation (walking, cycling, automobiles, and transit)
Access to healthy and affordable food
Connect residents to economic opportunities

Typical Corridor

Healthy Corridor Audit | Baseline Indicators
Residential Land Use
Number of residential units
Type of residential housing
Condition of residential units
Burned, boarded up, or abandoned units
Average monthly rent
Average home price
Residential Demographics
Average income
% below poverty level
Race
Obesity percentage
Asthma rate
Accident rate (crashes, injuries, fatalities)

Healthy Corridor Audit | Baseline Indicators
Non-Residential Land Uses
Presence of the following:– Commercial land use– Industrial land use– Religious structures– Civic/Government owned structures– Primary or secondary schools– Anchor institutions– Healthy food retailers– Neighborhood retail– Locally-owned businesses

Healthy Corridor Audit | Baseline Indicators
Public Spaces, Sidewalks and Bike Amenities Undeveloped or Underdeveloped land
Number of publicly accessible parks
Number of annual programs in public spaces
Presence of sidewalks
Sidewalk conditions
Trails
Opportunities for physical fitness
Trees shading walking areas
Natural environmental features
Public lighting
Benches
Are people being physically active (walking, jogging, biking)
Litter Garbage cans
Connectedness to adjacent neighborhoods
Bike accommodations
Bike racks

Healthy Corridor Audit | Baseline Indicators
Transit and Road Characteristics
Transit options
Number of travel lanes
Speed limit
Distance between safe pedestrian crossings
On street parking
Number of curb cuts
Traffic control devices

Massachusetts Case Study

MassDOT | Arsenal Street Corridor Study
RFP Scope: “Analyze public health impacts including data for asthma, myocardial infarction, congestive heart failure, stroke, and hypertension; levels of pediatric and adult obesity; levels of pediatric and adult depression; levels of pediatric and adult diabetes; levels of pediatric asthma; and injuries and fatalities related to vehicle crashes, to the extent these data sources are available.”
MassDOT | Arsenal Street Corridor Study
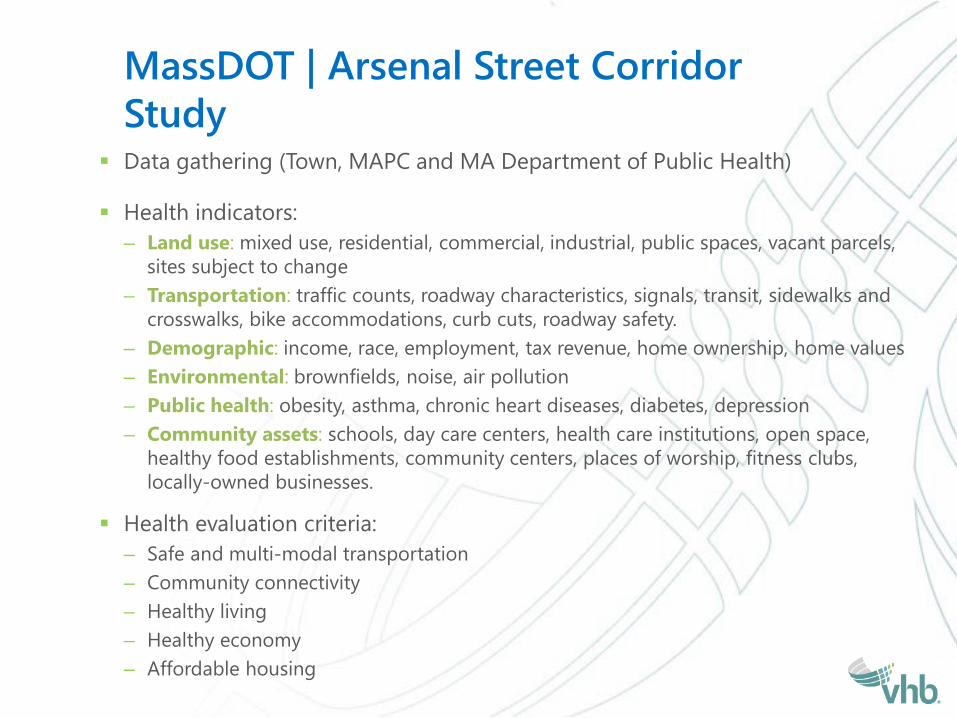
Data gathering (Town, MAPC and MA Department of Public Health)
Health indicators:– Land use: mixed use, residential, commercial, industrial, public spaces, vacant parcels,
sites subject to change – Transportation: traffic counts, roadway characteristics, signals, transit, sidewalks and
crosswalks, bike accommodations, curb cuts, roadway safety.– Demographic: income, race, employment, tax revenue, home ownership, home values– Environmental: brownfields, noise, air pollution– Public health: obesity, asthma, chronic heart diseases, diabetes, depression – Community assets: schools, day care centers, health care institutions, open space,
healthy food establishments, community centers, places of worship, fitness clubs, locally-owned businesses.
Health evaluation criteria:– Safe and multi-modal transportation– Community connectivity– Healthy living– Healthy economy– Affordable housing

Arsenal Street Corridor StudyPublic Health Assessment | Baseline profile
Limited public health data at corridor level
Community-wide data indicates that the top three health concerns affecting Watertown include:– Obesity and inactive living– Poor self-management of chronic disease– Mental health issues
Arsenal Street Corridor StudyPublic Health Assessment | Baseline profile
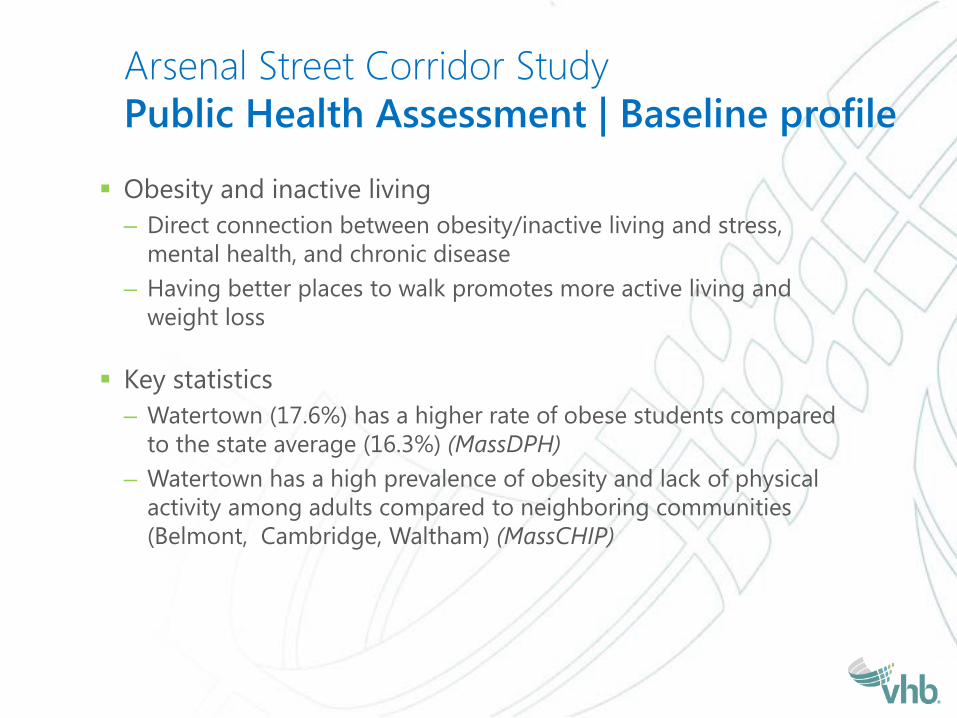
Obesity and inactive living– Direct connection between obesity/inactive living and stress,
mental health, and chronic disease– Having better places to walk promotes more active living and
weight loss
Key statistics– Watertown (17.6%) has a higher rate of obese students compared
to the state average (16.3%) (MassDPH)– Watertown has a high prevalence of obesity and lack of physical
activity among adults compared to neighboring communities (Belmont, Cambridge, Waltham) (MassCHIP)

Arsenal Street Corridor StudyPublic Health Assessment | Baseline profile
Poor self-management of chronic disease– Lack of understanding of how to manage and prevent
chronic disease
Key statistics– According to Massachusetts Healthy Aging Data Report,
Watertown has a number of aging indicators that are worse than the state average
% ever had a heart attack
% with heart disease
% with congestive heart failure
% with osteoporosis
% with glaucoma
% women with breast cancer
% men with prostate cancer
% with anemia
% with benign prostatic hyperplasia
Watertown 5.7 46.3 25.2 21.8 25.5 12.1 16.2 54.8 42.8
State 5 44.1 24.8 21.7 25.1 10.3 14.6 48.7 40.9

Arsenal Street Corridor StudyPublic Health Assessment | Baseline profile
Mental health issues– There is a close link between mental health and physical health
Key statistics– Watertown has a higher percentage of people who reported being
diagnosed with depression (31.6%) compared to the state (28.6%) (MassCHIP)

Arsenal Street Corridor StudyPublic Health Assessment |
Public health contributors– Public transit options
• MBTA 70 and 70A bus services• MBTA rapid transit and commuter rails accessed via bus services
– Access to ped/bike facilities• Sidewalks on both sides• Presence of on/off road and shared bike lanes
– Signalized intersections
– Mixed use development
– Parks/Trails and school play grounds
– Street trees

Arsenal Street Corridor StudyPublic Health Assessment
Public health barriers– Bus service is at/over capacity– Lack of bus stop amenities– Insufficient pedestrian safety features (signal, ADA compliance,
sidewalk accommodations)– High crash locations– Congestions and delays– Excessive curb cuts– High automobile traffic volume and noise levels – Lack of public-health conducive land uses (vacant land, automobile
service establishments, large format retail)

Arsenal Street Corridor | Public Health Contributors
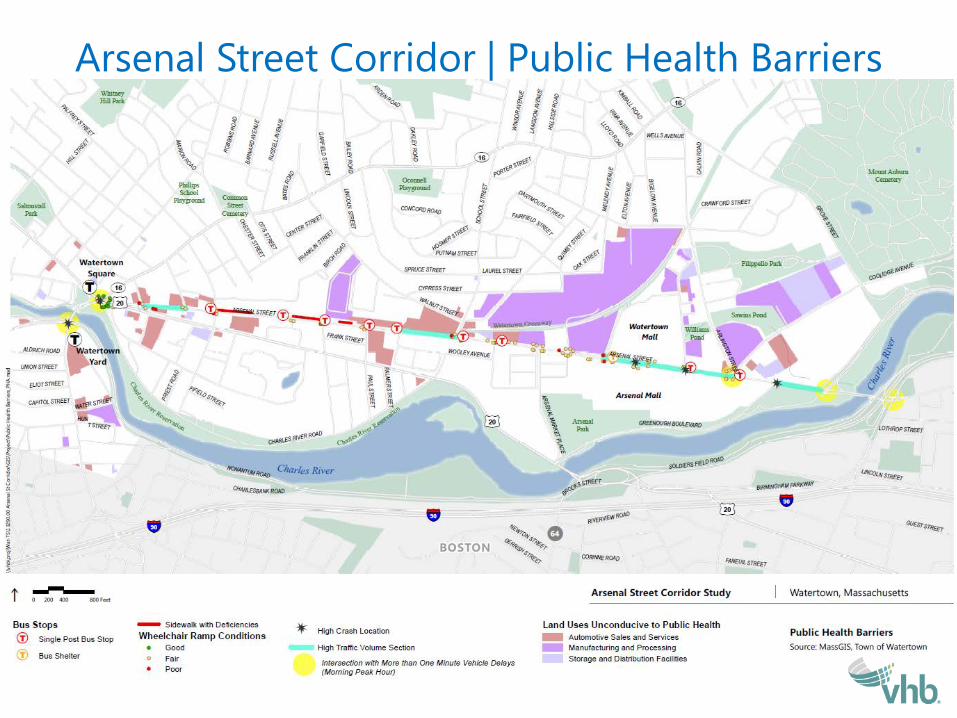
Arsenal Street Corridor | Public Health Barriers


Building
Health intoCommunities

Source: K
evin Cortes, The E
agle Hill P
lace-making P
hoto Project
Source: https://s-m
edia-cache-ak0.pinim
g.com/originals/69/28/95/692895396e195ba9063bfed51cb73c78.jpg

What determines health?
Healthcare Genetics Social, Environmental, Behavioral Factors
20% 60%20%
Based on: Slide from The American Healthcare Paradox, Lauren Taylor; Original Source: McGinnis et al, 2002
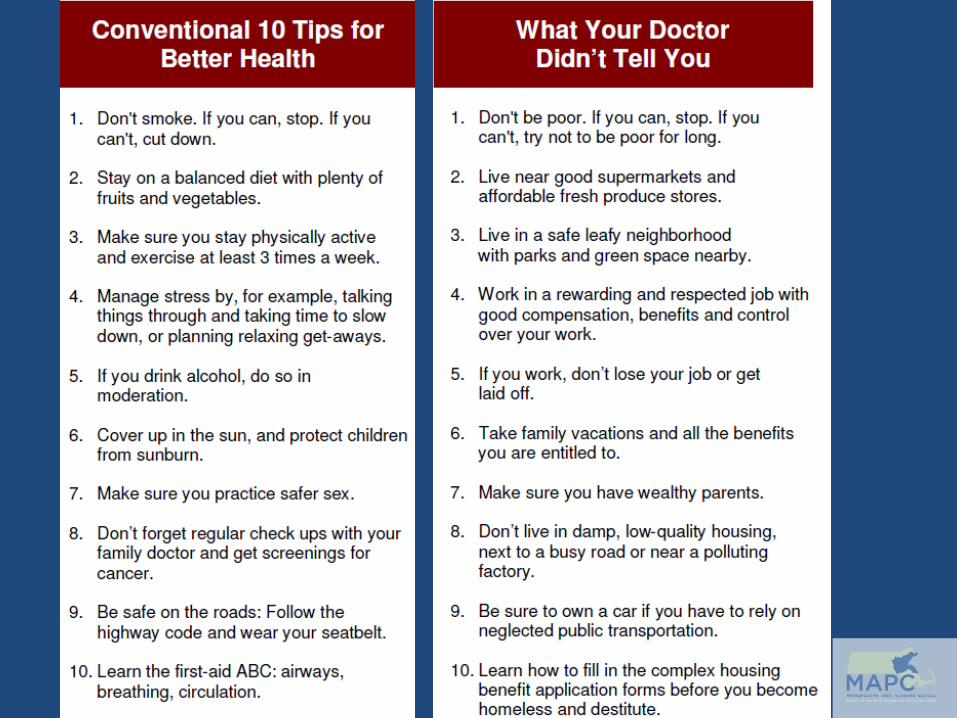

OUR NEIGHBORHOODS SHOULD NOT BEHAZARDOUS TO OUR HEALTH.
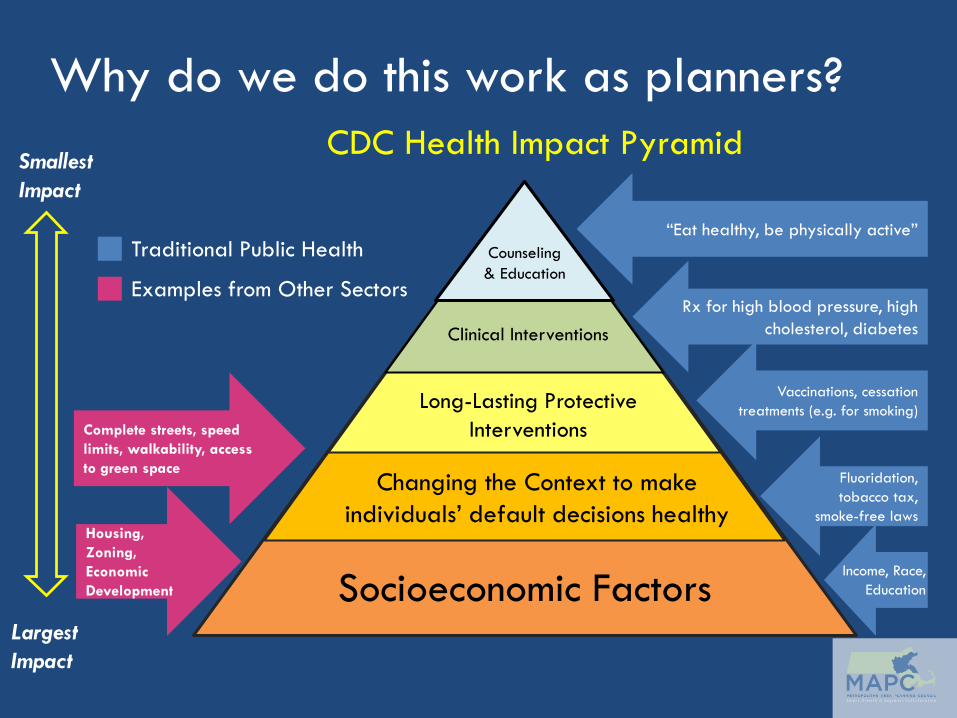
Why do we do this work as planners?
Counseling & Education
Clinical Interventions
Long-Lasting Protective Interventions
Changing the Context to make individuals’ default decisions healthy
Socioeconomic Factors
Smallest Impact
Largest Impact
“Eat healthy, be physically active”
Rx for high blood pressure, high cholesterol, diabetes
Vaccinations, cessation treatments (e.g. for smoking)
Fluoridation, tobacco tax,
smoke-free laws
Income, Race, Education
Complete streets, speed limits, walkability, access to green space
Housing, Zoning, Economic Development
Examples from Other Sectors
Traditional Public Health
CDC Health Impact Pyramid

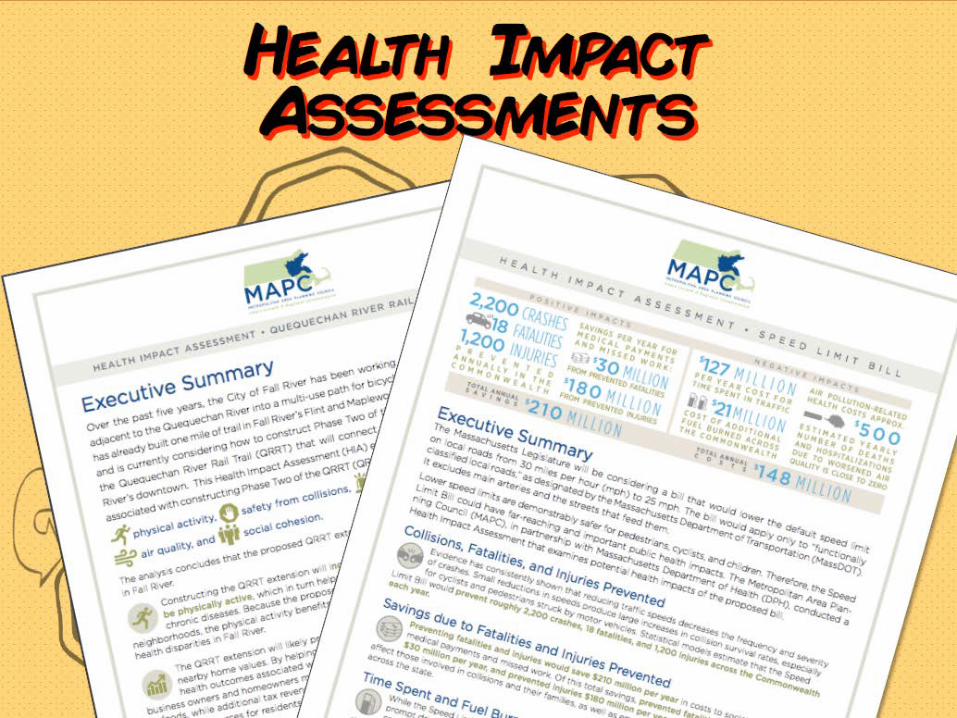
Slower vehicle speeds make people feel safe and encourage them to be active and walk and bike more. For example, we know that is you are hit by a car going 25 mph, you have a less that a 1 in 10 chance of being killed; at 40mph, you have a nearly 7 in 10 chance of being killed.
It’s not right that residents of certain neighborhoods have to experience speeding vehicles and be at greater risk for severe injury and death while others do not.
To change this, the officials, planners and public health professionals should use community strategies like traffic calming and slower speed limits to reduce speeding.*
* Adapted from Talking about Health in All Policies, Dorfman & Krasnow, Berkeley Media Studies Group

Speed Limit HIA

Speed Limit HIA
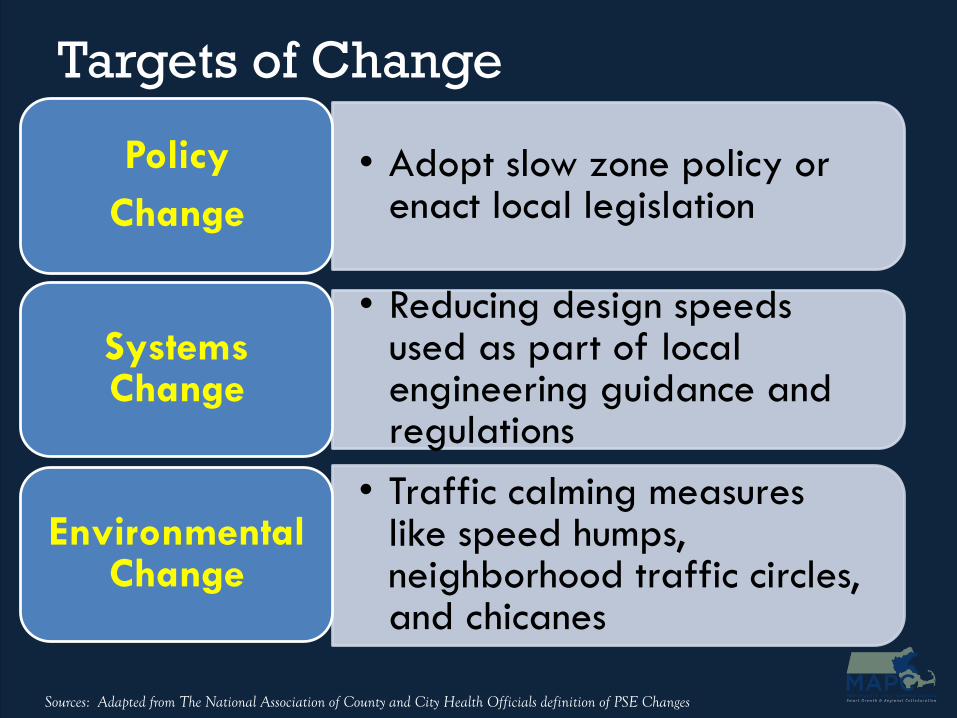
• Adopt slow zone policy or enact local legislation
Policy Change
• Reducing design speeds used as part of local engineering guidance and regulations
Systems Change
• Traffic calming measures like speed humps, neighborhood traffic circles, and chicanes
Environmental Change
Sources: Adapted from The National Association of County and City Health Officials definition of PSE Changes
Targets of Change

* Adapted from Talking about Health in All Policies, Dorfman & Krasnow, Berkeley Media Studies Group
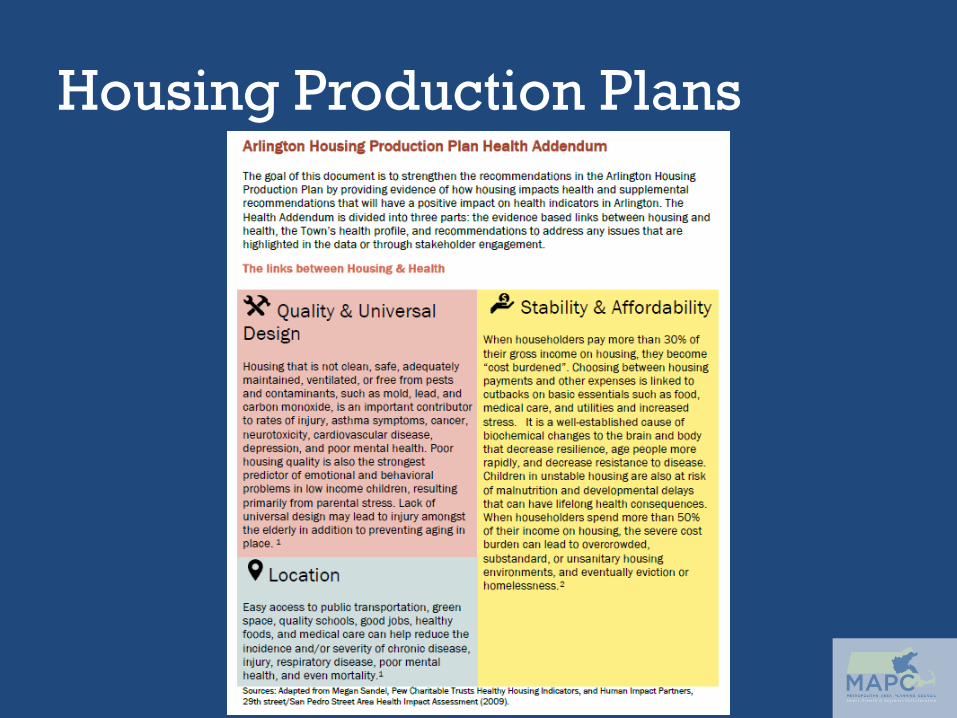
Housing insecurity results from individuals and families can no longer afford to live in stable and safe housing. Sadly, housing insecurity is issue in our community and having real effects. For instance, children who experience housing insecurity have been associated with poor health, lower weight, and developmental risk.
We can’t address the housing insecurity problem working in isolation. We need to work with partner in housing and community development to incorporate health criteria into our housing priorities.
Working together, we can address the issue of housing insecurity and fix multiple problems at the same time. It will create more stability in people’s lives, improve childhood outcomes, and strengthen our economy.*
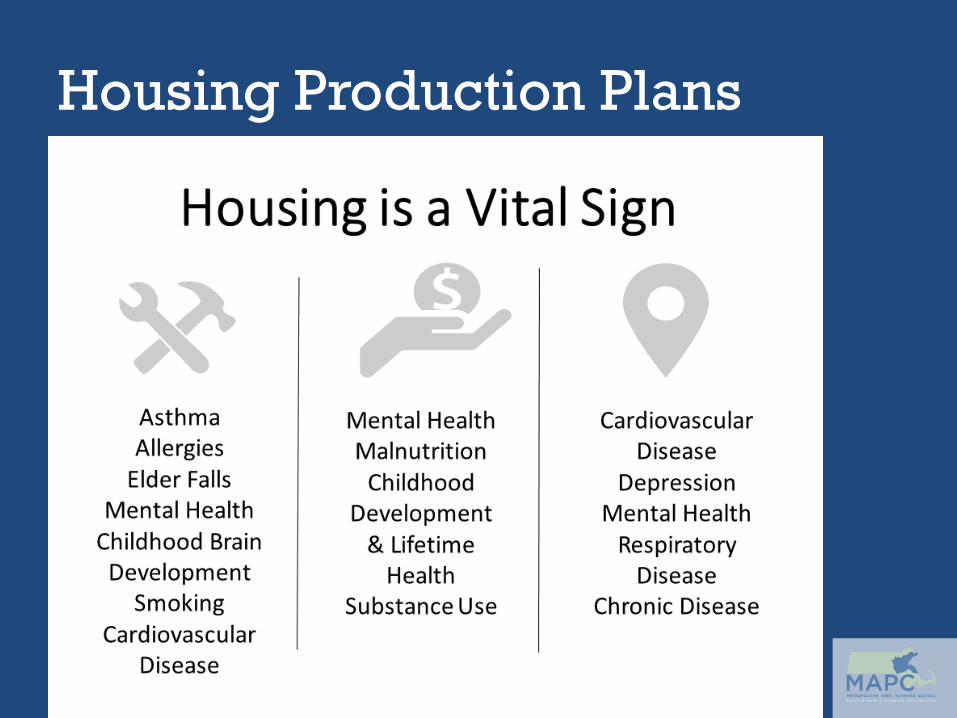
Housing Production Plans
Housing Production Plans

Healthy Neighborhood Fund HIA
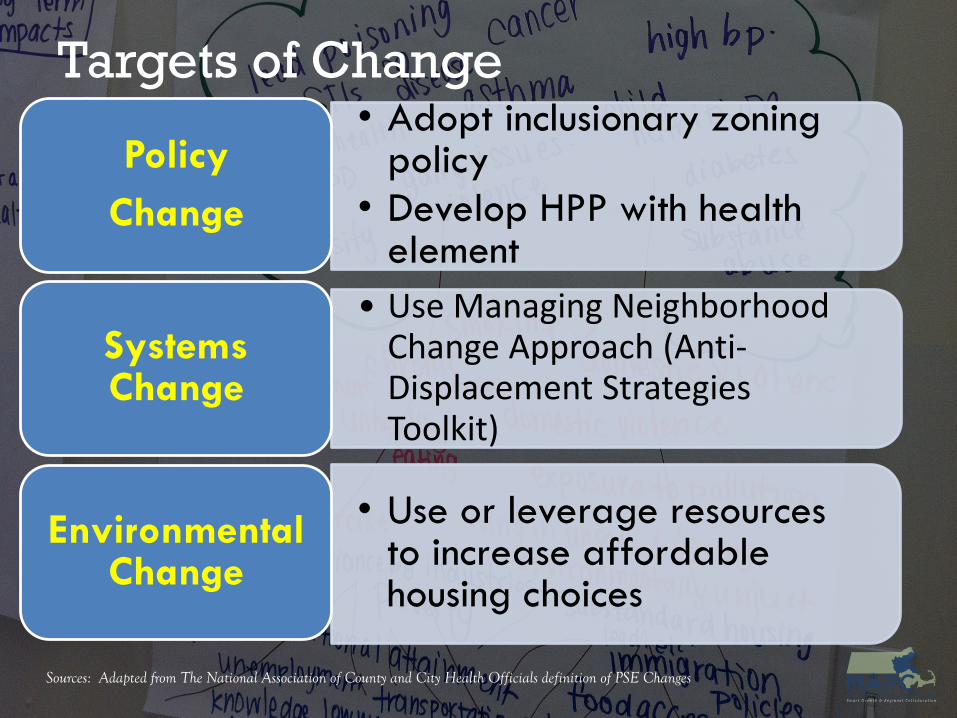
• Adopt inclusionary zoning policy
• Develop HPP with health element
Policy Change
• Use Managing Neighborhood Change Approach (Anti-Displacement Strategies Toolkit)
Systems Change
• Use or leverage resources to increase affordable housing choices
Environmental Change
Sources: Adapted from The National Association of County and City Health Officials definition of PSE Changes
Targets of Change
People are healthier when they have a say in how in their neighborhoods are maintained and how they change.
We need to engage residents, especially those who do not typically participate in neighborhood activities, so that we can make improvements like fixing sidewalks and parks so that everyone feels as part of the neighborhood.
To do that, the officials, planners and public health professionals should work with residents to support mutual goals that create inclusive and resilient neighborhoods.*
* Adapted from Talking about Health in All Policies, Dorfman & Krasnow, Berkeley Media Studies Group

Photovoice
• Record and reflect on community strengths and concerns
• Promote critical dialogue and knowledge about important issues through group discussion of photographs
• Reach decision-makers

Placemaking
Allows people to create places and streets which are healthy, safe, active, and useful.
Photo Credit: Principle+
Incremental, small-scale improvements
Local ideas for local planning challenges
Short-term commitment and realistic expectations
Low-risk, with a possibly of high reward
Tactical Urbanism by The Street Plans Collaborative

Photovoice + Placemaking
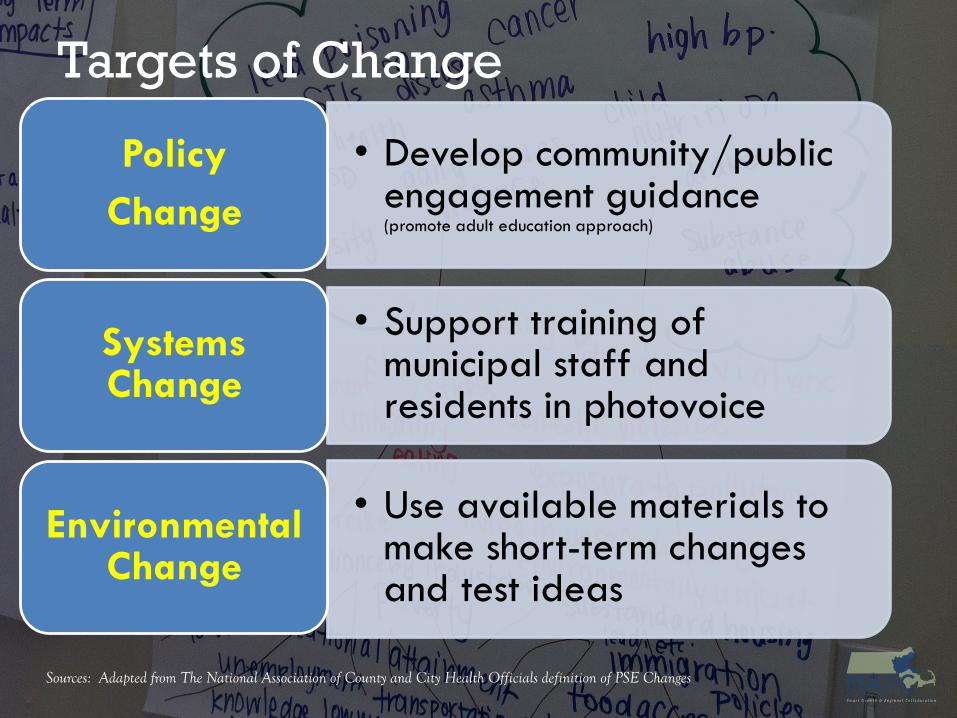
• Develop community/public engagement guidance (promote adult education approach)
Policy Change
• Support training of municipal staff and residents in photovoice
Systems Change
• Use available materials to make short-term changes and test ideas
Environmental Change
Sources: Adapted from The National Association of County and City Health Officials definition of PSE Changes
Targets of Change


HEALTH STARTS LONG BEFORE ILLNESS, IN OURHOMES, SCHOOLS, AND JOBS


Council of Governments: Chief Elected Officials of each town serve on MetroCOG’s Board of Directors
Federally Designated Transportation Planning Organization (MPO)
Provide a range of services to the six member municipalities
Stratford
Fairfield
EastonTrumbull
Bridgeport
Monroe

About 316,000 people live in the MetroCOG Region
145 square miles in area
Located between New York & Boston
Bordered by Long Island Sound

About 316,000 people live in the MetroCOG Region
145 square miles in area
Located between New York & Boston
Bordered by Long Island Sound

Healthy Community Design: Greater Bridgeport
Obesity and access to physical activity and healthy food were concerns identified by focus group participants and interviewees. Walkability of communities, nutritious school lunches, and accessible and affordable recreational areas were all issues identified as important for changing the environmental landscape to support obesity prevention.
Healthy Eating, Physical Activity, and Overweight/Obesity. Greater Bridgeport region focus group participants and interviewees reported that obesity is emerging as a serious community issue, and with it, rising cases of chronic diseases. Survey data indicate that 57% of adults in the region are either overweight or obese. In addition to time constraints, the infrastructure itself – having the healthy choice be the easy choice – was discussed among many assessment participants.
Recreational Facilities. According to focus group participants and interviewees, the region has a geography and infrastructure that supports health, although accessibility is an issue for some. Safety concerns constrain physical activity in Bridgeport which has a large number of parks. Participants identified lack of time as another barrier to physical activity.
Source: Greater Bridgeport, CT Community Health Assessment. April 2013.

71% of Bridgeport residents reported themselves as obese or overweight, greater than state (59%) or national (63%) averages
36% of Bridgeport residents reported themselves as obese greater than state (21%) or national (27%) averages
81% of Bridgeport residents reported that they participated in physical activity on a regular basis
East End: 33% of residents reported that they were obese.
East Side: 40% of residents reported that they were obese.
Source: City of Bridgeport, 2011. Bridgeport Community Allied to REACH Health Equity (Bridgeport CARES): Results of a Community Health Assessment.

Improving Community Health
Goal: Reduce and prevent obesity by creating environments that promote healthy eating and active living in the Greater Bridgeport Region
Objective: By 2016, increase by 2% the number of adults engaged in moderate physical activity for at least 30 minutes a day for 5 days a week
Strategy: Increase/enhance access to and the number of places to get physical activity in the region
Indicators:– Number of adults engaged in moderate physical activity for at
least 30 minutes a day for 5 days a week– Number of new locations to get safe access to physical activity
created
Source: Greater Bridgeport Region Community Health Improvement Plan (CHIP) Report, June, 2013.

Barnum Station Study: Project Objectives
Increase the availability of housing options in a transit-supportive location
Improve transit and promote transit-oriented development (TOD) in East Bridgeport
Improve access to jobs, education, and services
Decrease per-capita vehicle-miles-travelled (VMT) and transportation-related emissions for the corridor
Increase participation and decision-making in developing a long-range vision for the area around Barnum Station

Street Level Station Design

Station Area Infrastructure Improvements
Land use patterns present a challenge to integrating bicycle & pedestrian infrastructure
Most principal roads have sidewalks, but many need repairs
No designated bicycle facilities or infrastructure
A linear park along the Yellow Mill Channel would provide a facility for active transportation, and complement future projects
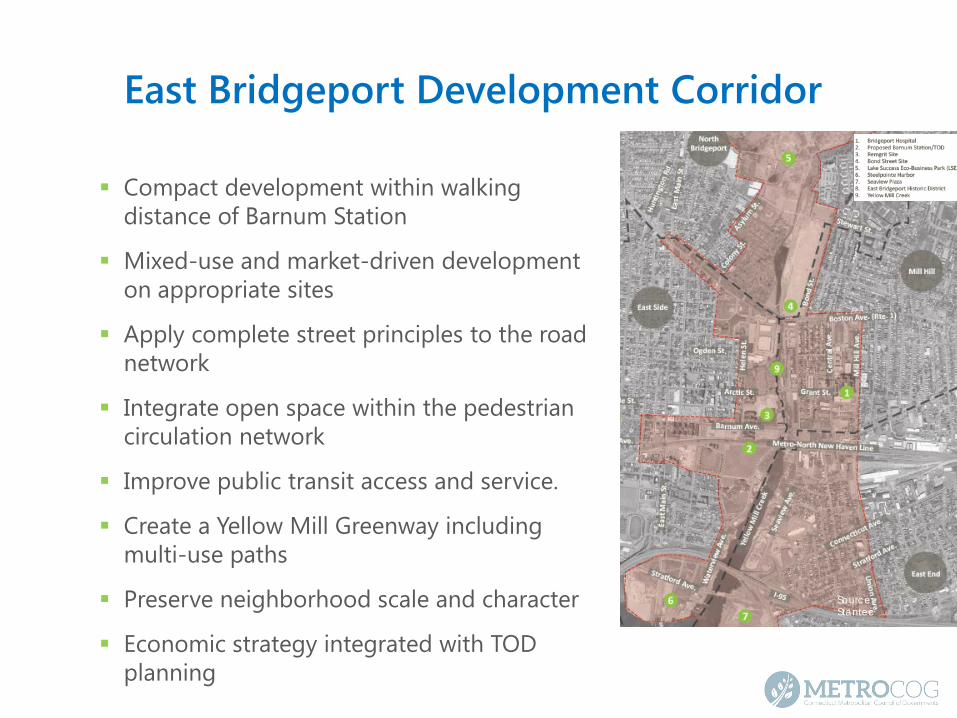
East Bridgeport Development Corridor
Compact development within walking distance of Barnum Station
Mixed-use and market-driven development on appropriate sites
Apply complete street principles to the road network
Integrate open space within the pedestrian circulation network
Improve public transit access and service.
Create a Yellow Mill Greenway including multi-use paths
Preserve neighborhood scale and character
Economic strategy integrated with TOD planning
Source: Stantec

Stakleholder Feedback
Need for improved pedestrian routes and safe routes to schools
Increased retail and local service shops
Expansion and enhancement of park space along the Yellow Mill Channel and Creek

Source: Stantec

Source: Stantec

Active Transportation
Improve intersections with amenities and pedestrian facilities by emphasizing complete streets and a balanced approach to pedestrian, transit and vehicular travel
Construct the Yellow Mill Greenway to connect the Lake Success Eco-Business to Bridgeport Harbor
Bicycle lanes and pedestrian paths along both sides of the Yellow Mill Channel and Creek
Complete street strategies include bicycle and pedestrian facilities, improved sidewalks, streetscapes and traffic calming measures
Provide a new pedestrian walk from Ogden Street across Yellow Mill Creek via a new pedestrian bridge
Source: Stantec
Source: Greater Bridgeport, CT Community Health Assessment. April 2013.
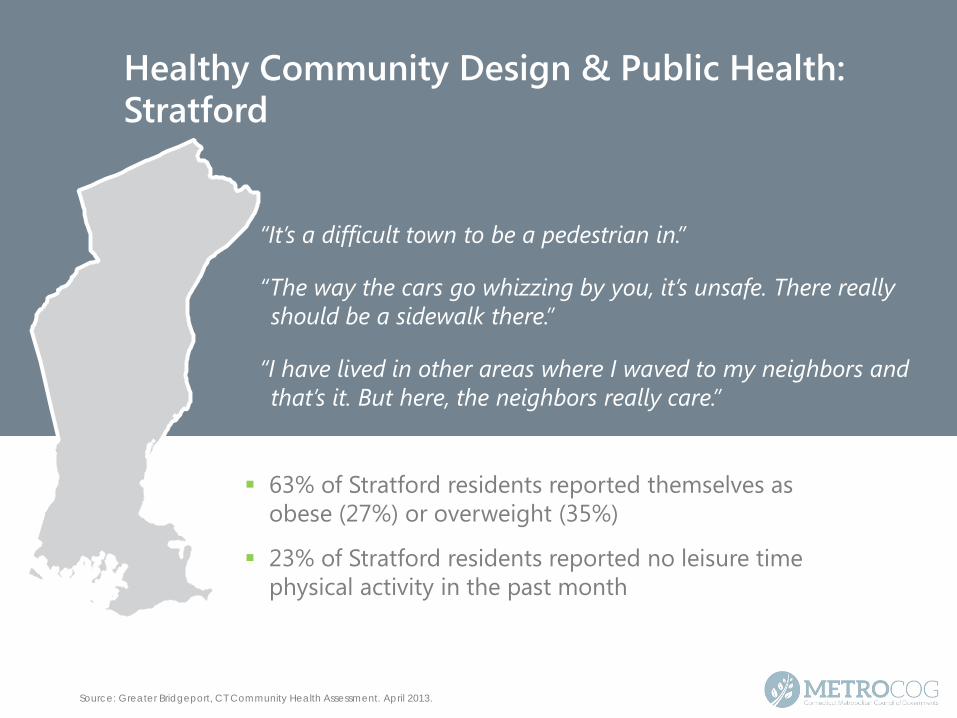
Healthy Community Design & Public Health:Stratford
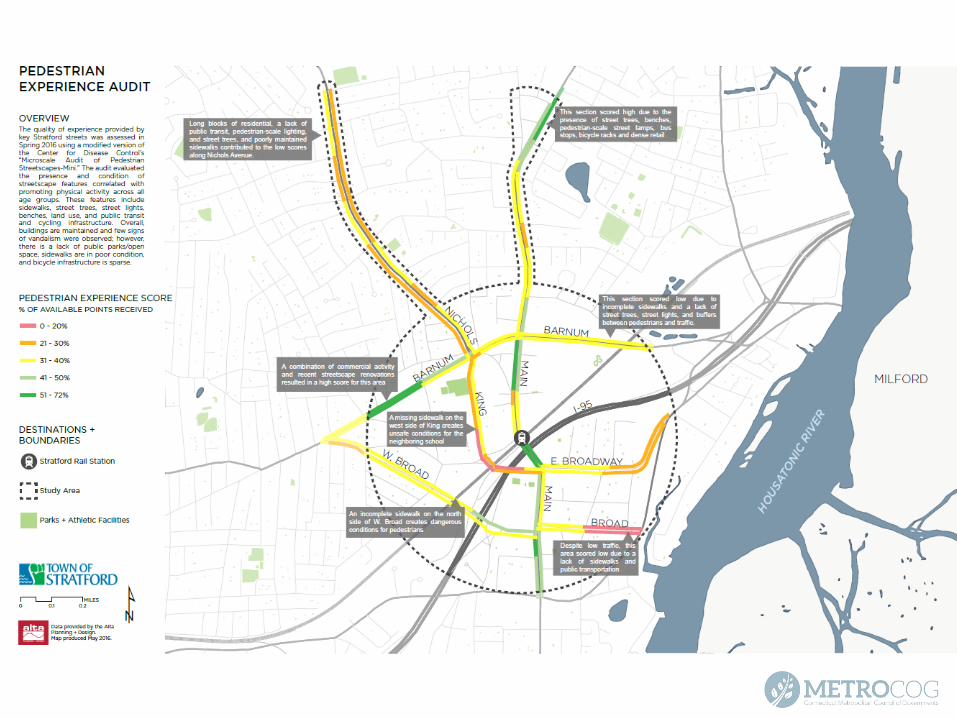
63% of Stratford residents reported themselves as obese (27%) or overweight (35%)
23% of Stratford residents reported no leisure time physical activity in the past month
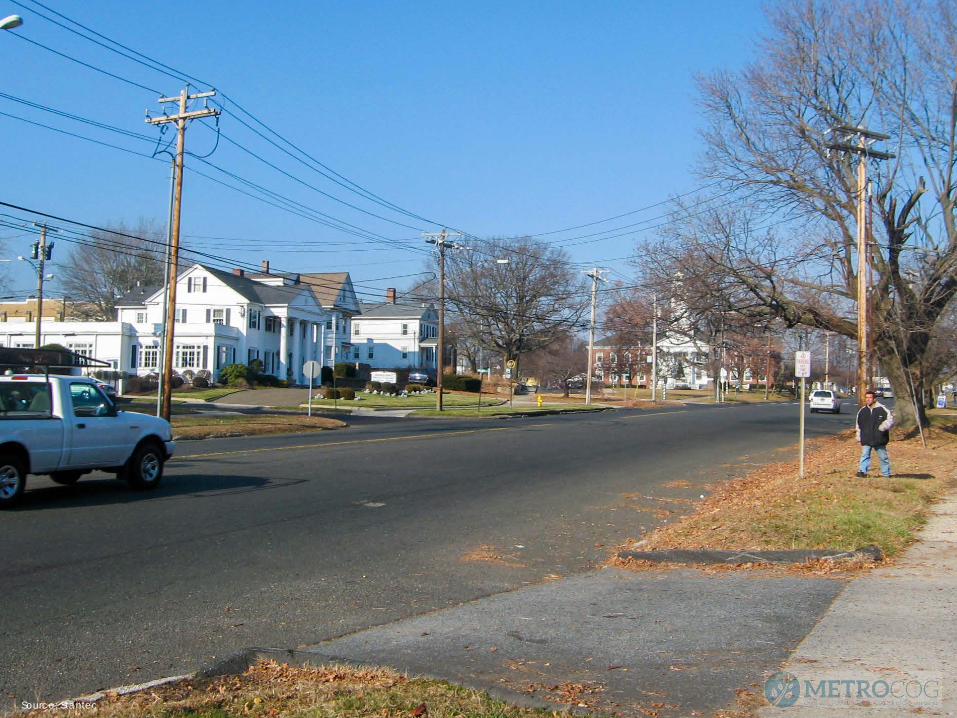
“It’s a difficult town to be a pedestrian in.”
“The way the cars go whizzing by you, it’s unsafe. There really should be a sidewalk there.”
“I have lived in other areas where I waved to my neighbors and that’s it. But here, the neighbors really care.”
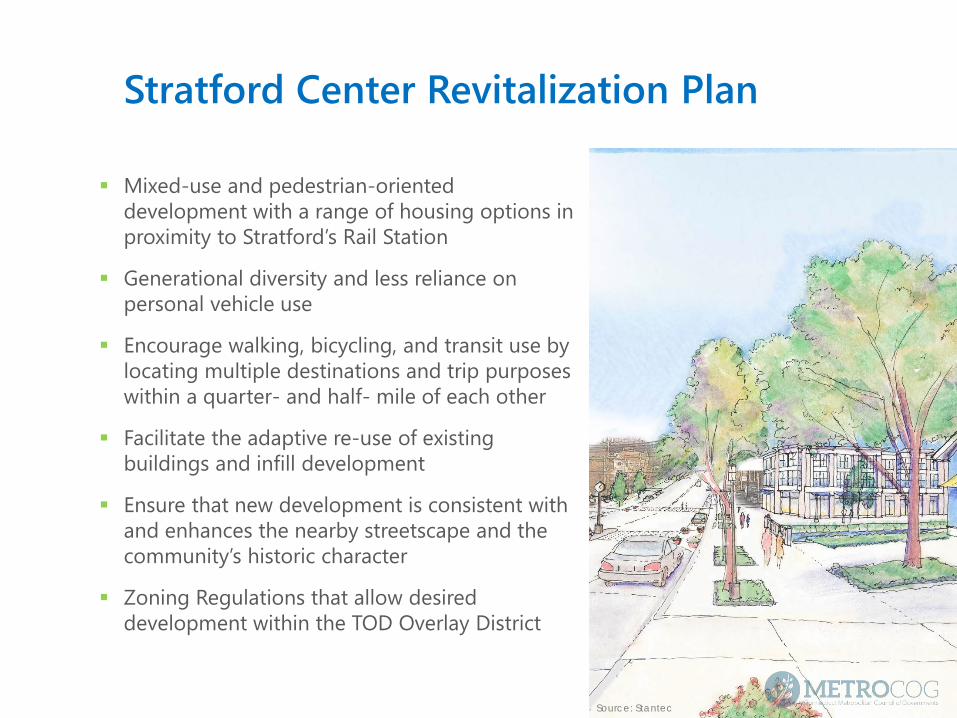
Stratford Center Revitalization Plan
Mixed-use and pedestrian-oriented development with a range of housing options in proximity to Stratford’s Rail Station
Generational diversity and less reliance on personal vehicle use
Encourage walking, bicycling, and transit use by locating multiple destinations and trip purposes within a quarter- and half- mile of each other
Facilitate the adaptive re-use of existing buildings and infill development
Ensure that new development is consistent with and enhances the nearby streetscape and the community’s historic character
Zoning Regulations that allow desired development within the TOD Overlay District
Source: Stantec

TOD Ordinance
Sidewalks constructed along the frontage of all public streets
Main entrances connected by a continuous network of sidewalks
Designated crosswalks and pedestrian-oriented paving treatment at internal and external intersections
Street trees, pedestrian amenities and adequate lighting
Source: Stantec

“Superblocks”—very large blocks of over 1000 feet with no internal paths or streets accessible for public use
Obstructs pedestrian and bicyclist circulation
Source: Stantec
Source: Stantec
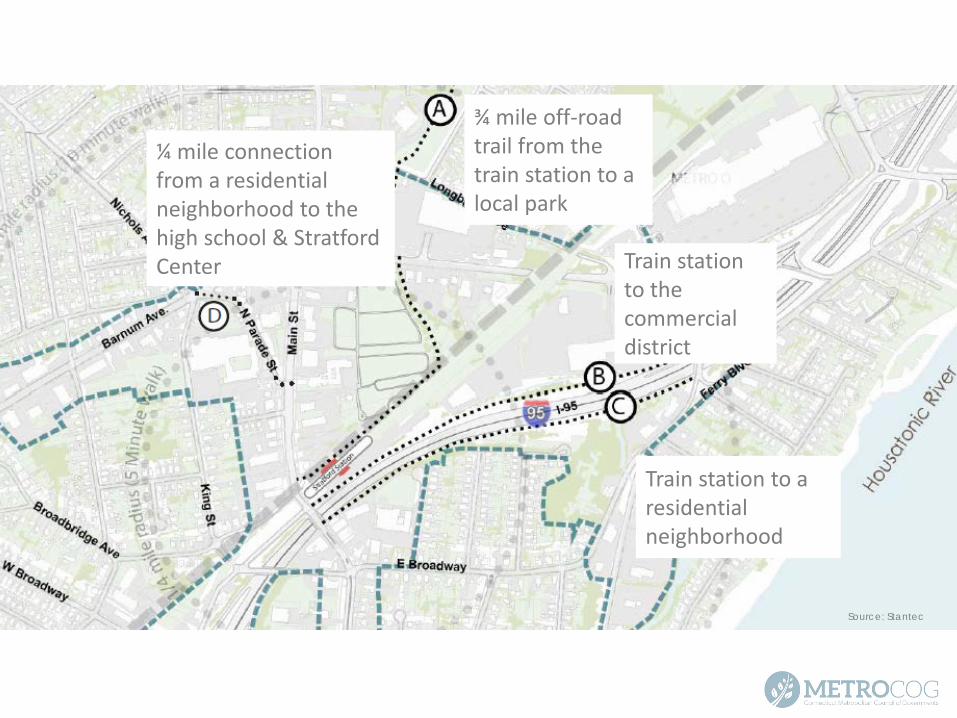
¾ mile off-road trail from the train station to a local park
¼ mile connection from a residential neighborhood to the high school & Stratford Center Train station
to the commercial district
Train station to a residential neighborhood
Source: Stantec

Complete Streets Planning for Stratford Center
Safety and access for all ages, abilities, and modes
Better connections between residential and commercial areas
Improve access to and between public transit systems
Develop safe routes to school
Design interventions that create a sense of place, reflect the character of Stratford’s different neighborhoods, and evoke a sense of safety and vibrancy
Soften existing barriers (e.g., I-95 and rail corridor)
Embrace Stratford’s cultural arts, history and natural resources
Integrate traffic calming measures to slow traffic and encourage active transportation in key areas

“It’s a difficult town to be a pedestrian in.”
“The way the cars go whizzing by you, it’s unsafe. There really should be a sidewalk there.”

Lessons Learned

Lessons Learned
Pedestrian and bicyclist safety is paramount—typically no debate about improvements to pedestrian and bicyclist facilities
Understand the transportation infrastructure: inventory the availability and condition of sidewalks, crossings and amenities.
Safe connections for pedestrians and cyclists to destinations (transit, parks, shopping, jobs) will make physical activity a part of life, rather than a leisure activity.

Lessons learned
Direct relationship between public health and the built environment
Include health professionals in the planning process
An interdisciplinary team (planners, designers, engineers, developers and health care professionals) bring varied expertise, collaboration and curiosity
What seems simple to one discipline is ground breaking for another
Health can be a catalyst for capacity building
Establish health indicators and be specific about health outcomes
Warning: Finding health data is difficult—be clear on the limitations