incomes and expenditures among polish students – a case of
TRANSCRIPT
European Scientific Journal May 2016 /SPECIAL/ edition ISSN: 1857 – 7881 (Print) e - ISSN 1857- 7431
317
Incomes And Expenditures Among Polish Students – A Case Of Students From Czestochowa University Of
Technology
Paula Bajdor Katarzyna Łukasik
Agnieszka Puto Tomasz Lis
Faculty of Management, Czestochowa University of Technlogy, Poland
Abstract
The living condition of almost every human being is primarily determined by the financial aspect - because in most cases, the quality and standard of living depends precisely on the income. And it will not be a mistake, the statement that most people are seeking to obtain higher and higher income that, maybe can not "make you happy" but make the life much easier. In Poland, the financial condition of its population is the subject of research conducted by the. An income per capita is being, the average wage is calculated and the level of satisfaction with the current financial situation is being tested as well. However, in their analysis, Central Statistical Office omits a certain social group - the students - now, this group represents 4.2% of the entire Polish population. Having this in mind, a research hav been conducted in order to characterized the structure of income and expenditure in relations to Polish students. In the introduction of this article a brief description of the country has been presented and the structure of income and expenditure of the whole Polish population has been characterized as well. In the further part of the article, the purpose of the research, the used methods and obtained results are presented. The article ends with a summary, which contains the most important conclusions.
Keywords: Students, incomes, expenditures, full-time student, part-time student, men, women

European Scientific Journal May 2016 /SPECIAL/ edition ISSN: 1857 – 7881 (Print) e - ISSN 1857- 7431
318
Introduction Poland is situated in the Central part of Europe, having neighbors as
follows: Germany from the West, Czech Republic and Slovakia from the South, and Latvia, Ukraine, Belarus and Russia from the East. Poland has also an access to the Baltic Sea from the North. Poland is a member of the European Union from the 1st May 2004, this year is a final year for the first decade of being an UE member. The capital of Poland is Warsaw (it is the biggest city as well) and other big cities such as: Cracov, Wroclaw, Poznan, Lodz, Gdansk and Szczecin. Also Poland is divided into 16 voivodeships, where the largest is Masovian voivodeship and the smallest is Opolskie.
In the year 2013, Poland recorder a GDP per Capita (PPP – Purchasing Power Parity rates) of 17,500 Euro, which represent 68% of the EU average, what gives Poland the 6th place from the end. According to the World Bank, the GDP per Capita of Poland was 21 214 USD. The inflation rate in the year 2013, was 0,9%, went down from 3,7% in the previous year (Central Statistical Office of Poland). By the end of the year 2013, the population of employees was 8,5 mln, the unemployment rate has remained the same in according to 2012, every employee worked for 435 hours and the average salary was about 860 Euro per month. The population is mainly employed in service (66,9%), industry (29,5%), trade (13,8%) and education ( 12,3%) sectors (Central Statistical Office of Poland).
According to the forecasts of the Polish National Bank, in the years 2014 – 2016, the following changes should occur: - GDP growth will accelerate to 3.6%, as the Polish economy is currently in the recovery phase, - Inflation will be below 0.2% in 2014, 1.4% in 2015 and 2.3 in 2016, in the longer term, inflation will rise, but it will remain at a moderate level, - The unemployment rate will decline to 9.7 level this year, to 8.8% at the end of 2015 and 8% by the end of 2016. Reduction in the unemployment rate is due to greater labor market flexibility. Income and expenditure in Poland
There is a visible a differentiation in salaries in Poland, variation occurs in terms of provinces, the private sector and the public as well as gender. In 2013, the average salary was 862 euros per month. In the case of wage inequality in terms of provinces, in 2013, the highest salary received residents of Mazovia - 1144.2 Euro/month, on the second place were found the citizens of the Silesia province -934.38 Euro/month, and on the third - the citizens of Pomerania - 910, 56 Euro/month. The lowest salaries, earned the citizens of Warmia and Mazury, on average, 761.89 Euro/month. The difference between salaries in the Mazovia and Pomerania is up to 382.31

European Scientific Journal May 2016 /SPECIAL/ edition ISSN: 1857 – 7881 (Print) e - ISSN 1857- 7431
319
Euros/month. The level of the wages above, is influenced by the following facts: In Mazovia voivodship is located the Polish capital - Warsaw, being Polish business center, as well, focusing largest number of entrepreneurs and attracting foreign investors. In the case of the Silesian province is a former industrial area (coal mines and steel mills). The province also includes the so-called. Katowice Agglomeration - a 14 towns lying close to each other, and connected by a dense network of roads and rail networks, they lead a common strategy for regional development and have attractive areas for potential investors. In turn, proximity to the sea and sea-developed infrastructure contributed to the Pomeranian is on the third place in terms of the earned wages.
In the case of poverty, it's been a few years when this ratio is maintained at the same level of 6.5%. Since the fall of communism, this rate steadily decreased, due to the period of increased economic development. As Rutkowski said "those who have gained from income changes are outnumbered by those who have lost. However, while the gains have been significant, the losses have been relatively small".
Regarding the differentiation of wages between the public and private sectors, the public sector workers earned 9.1% more than private sector employees. The same better wages can boast of men, whose wages on average by 6.1% higher than the wages of women Lubusz Business Portal.
In the case of expenditure incurred by households, the chart below shows the percentages of the major expenditure groups in 2014:
Fig. 1. The structure of expenditure incurred by households.
Source: Central Statistical Office of Poland “Household Budget Survey in 2014”, Warsaw 2015.
25%
21%
10% 8%
5%
5%
5%
5%
4% 4% 3% 2% 2% 1%
food and non-alcoholicbeverages
housing, water, electricity, gasand other fuels
transport
recreation and culture
miscellaneous goods andservices
clothing and footwear

European Scientific Journal May 2016 /SPECIAL/ edition ISSN: 1857 – 7881 (Print) e - ISSN 1857- 7431
320
As the figure 1 presents, the expenditures on food and non-alcoholic beverages and housing, water, electricity gas and other fules are characterized by the boggest share. They account for almost half of the total expenditures of polish society. On the further places are fuels and recreation and culture. Despite the fact that the fuel prices have been decreasing for the last year, still the price for one litre of petrol or diesel is quite high. And having in mind that in Poland, there are almost 600 cars for every 1000 people (which located Poland higher than Germany, UK, Spain and France), this high share should not be surprising. Instead, the expenditures on recreation and culture can be. But the biggest surprise may raise the fact that the smallest share in total expenditures is education - only 1%. This can be explained by the fact, that in Poland education is free and except for private kindergartens, schools and universities which charge fees in the form of tuition, studying in public educational centers cost no money. In the case of alcoholic beverages and tobacco, they represent 3% of total expenditures, but are higher than the expenses incurred for restaurants and hotels, which account for only 2%. It follows from this that sill the majority of the population eat at home and during travelling use the hotels only when necessary.
It is worth noting that in the year 2014, population from Poland perceived their financial situation rather good or very good - 27.1% of households, while only 17.8% of them perceived this as bad or rather bad. These results are slightly better than in the year 2013, amounted accordingly 22.7% and 20.5% (fig. 2)
Fig. 2. The financial situation perception by polish social groups.
Source: Central Statistical Office of Poland “Sytuacja gospodarstw domowych w 2014 r. w świetle wyników badania budżetów gospodarstw domowych”, Warsaw 2015.
0,00%10,00%20,00%30,00%40,00%50,00%60,00%70,00%
30,30% 24,10%
48,70%
22,40% 11,50%
27,10%
56,20% 65,60%
45,10%
59,00% 51% 55,20%
13,50% 10,30% 6,20%
18,60%
37,40%
17,70%
Rather good Average Rather bad
European Scientific Journal May 2016 /SPECIAL/ edition ISSN: 1857 – 7881 (Print) e - ISSN 1857- 7431
321
The households of self-employed have estimated their financial situation as a very good of rather well - 48.7% and households of employees - 30.3% (Respectively in 2013: 42.0% and 25.5%). The highest percentage of assessments of bad or rather bad was recorded among households of pensioners (37.4%), and this result is lower by 4.1% than in the year 2013. The purpose of the research
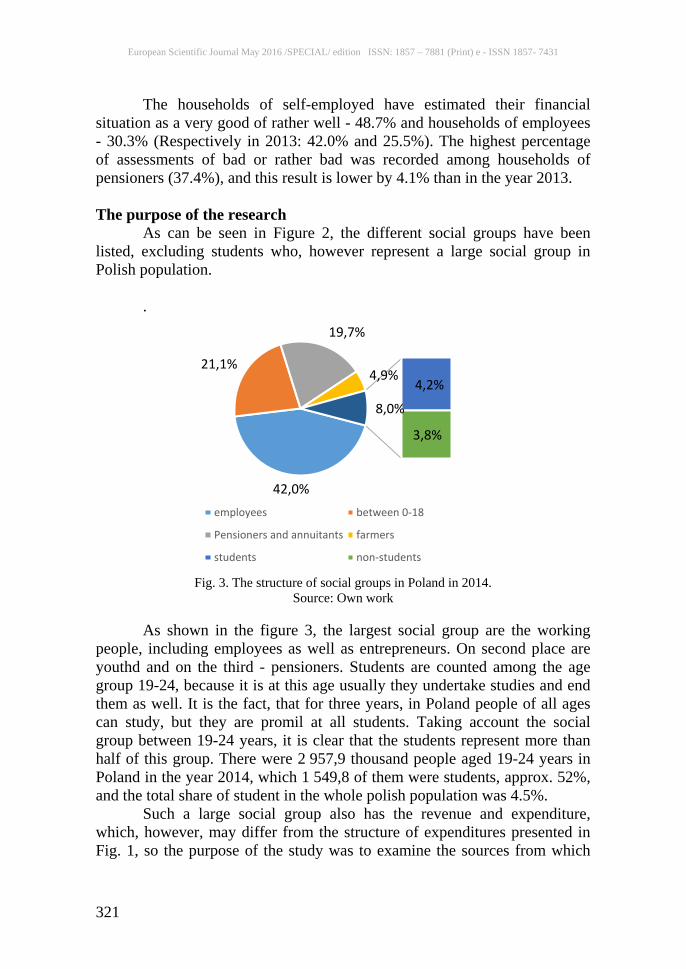
As can be seen in Figure 2, the different social groups have been listed, excluding students who, however represent a large social group in Polish population.
.
Fig. 3. The structure of social groups in Poland in 2014.
Source: Own work As shown in the figure 3, the largest social group are the working
people, including employees as well as entrepreneurs. On second place are youthd and on the third - pensioners. Students are counted among the age group 19-24, because it is at this age usually they undertake studies and end them as well. It is the fact, that for three years, in Poland people of all ages can study, but they are promil at all students. Taking account the social group between 19-24 years, it is clear that the students represent more than half of this group. There were 2 957,9 thousand people aged 19-24 years in Poland in the year 2014, which 1 549,8 of them were students, approx. 52%, and the total share of student in the whole polish population was 4.5%.
Such a large social group also has the revenue and expenditure, which, however, may differ from the structure of expenditures presented in Fig. 1, so the purpose of the study was to examine the sources from which
42,0%
21,1%
19,7%
4,9% 4,2%
3,8%
8,0%
employees between 0-18
Pensioners and annuitants farmers
students non-students

European Scientific Journal May 2016 /SPECIAL/ edition ISSN: 1857 – 7881 (Print) e - ISSN 1857- 7431
322
Polish students receive their income and how looks the structure of their expenditure.
To carry out the research, students of the Faculty of Management of Czestochowa University of Technology were selected, both students in full-time and part-time. More than 500 questionnaires research have been distributed among the students. This questionnaire consisted of three parts:
- Specifications (gender, age, type of study) - The structure of revenue and expenditure, - Feelings for their own financial situation, The entire research took account many issues but for the purposes of
this article, only a few of them, the most imprtant ones, have been selected. For the final study only 396 questionnaires have been classified,
some of them have not been returned and some did not meet the formal requirements.
The minimum sample size for estimating the probability of p success in a general population, was calculated on the basis of the formula for sample size with a very large population:
𝑁𝑚𝑖𝑛 = 𝑁𝑝 (𝛼2 ∗ 𝑓(1 − 𝑓)
𝑁𝑝 ∗ 𝑒2 + 𝛼2 ∗ 𝑓(1 − 𝑓)
Where: Nmin = the minimum sample size, Np = the size of the population, α2 = the confidence level for results, e2 = accepted level of highest error, f = the size of the fraction.
This formula allows to obtain a predetermined accuracy of the estimation of population structure ratio. After substituting into the formula adopted values, the following equation have been received:
𝑁𝑚𝑖𝑛 = 1549800 (1,962 ∗ 0,5(1 − 0,5)
1549800 ∗ 0,052 + 1,962 ∗ 05(1 − 0,5)=
1549800 ∗ 0,963,8745 + 0,96
= 14878083875,46
= 384
As is evident from the calculations, the minimum sample size, with
the adopted confidence level 1-2 = 0.90, and the accepted level of highest error e = 5%, should be 384 questionnaires. Due to the fact that the study involved 396 questionnaires, it can be assumed that this condition has been met.
European Scientific Journal May 2016 /SPECIAL/ edition ISSN: 1857 – 7881 (Print) e - ISSN 1857- 7431
323
The research results As was mentioned earlier, the research questionnaire consists of three
parts: the specifications, questions relating to the structure of income and expenditure and questions related to feelings of students with respect to its financial resources.
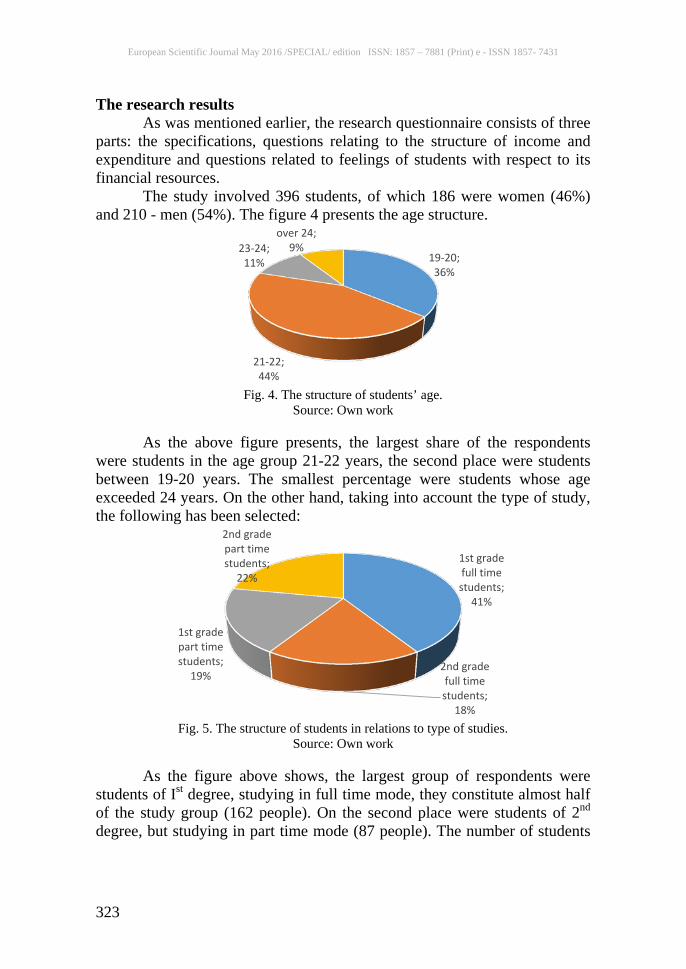
The study involved 396 students, of which 186 were women (46%) and 210 - men (54%). The figure 4 presents the age structure.
Fig. 4. The structure of students’ age.
Source: Own work As the above figure presents, the largest share of the respondents
were students in the age group 21-22 years, the second place were students between 19-20 years. The smallest percentage were students whose age exceeded 24 years. On the other hand, taking into account the type of study, the following has been selected:
Fig. 5. The structure of students in relations to type of studies.
Source: Own work As the figure above shows, the largest group of respondents were
students of Ist degree, studying in full time mode, they constitute almost half of the study group (162 people). On the second place were students of 2nd degree, but studying in part time mode (87 people). The number of students
19-20; 36%
21-22; 44%
23-24; 11%
over 24; 9%
1st grade full time students;
41%
2nd grade full time students;
18%
1st grade part time students;
19%
2nd grade part time students;
22%

European Scientific Journal May 2016 /SPECIAL/ edition ISSN: 1857 – 7881 (Print) e - ISSN 1857- 7431
324
of 1st degree in part-time and 2nd degree in full-mode was almost the same (75 and 72 people).
Fig. 6. The structure of students’ incoming sources.
Source: Own work As shown in the figure 5, more than half of the surveyed students as a
source of income indicated the parents, but quite a large proportion of them indicated scholarships and grants as a source of their income. Finally on the third place was the salary. A small percentage of students, less than 10% as a source of income indicated its own business and the money received from family relatives (most often were the grandparents but sometimes siblings). Only four people indicated as a source of income, "other," but did not indicate exactly the source. While comparing the structure of income distribution (Fig. 6) to the types of studies (full or part-time studies), it was shown, that in the case of full-time students up to 184 of them gets money from its parents, and they represent 85%, the remaining 15% of them are the part-time students, 32 persons. Full-time students that receive money from their parents, explain this situation by the mode of study, due to daily activities, it is impossible for them to get a job. But even in this group, 8 of them obtain income in the form of salary or wages resulting from its own entrepreneurship. In the case of income obtained from another family member, full-time students more often use this form of financing, up to 75%, the remaining 25% are the part-time students.
15%
21%
55%
5% 3% 1%
Wage Scholarship/Bursary
Parents Other relatives
Private entrepreneurship Other source. Please mention
European Scientific Journal May 2016 /SPECIAL/ edition ISSN: 1857 – 7881 (Print) e - ISSN 1857- 7431
325
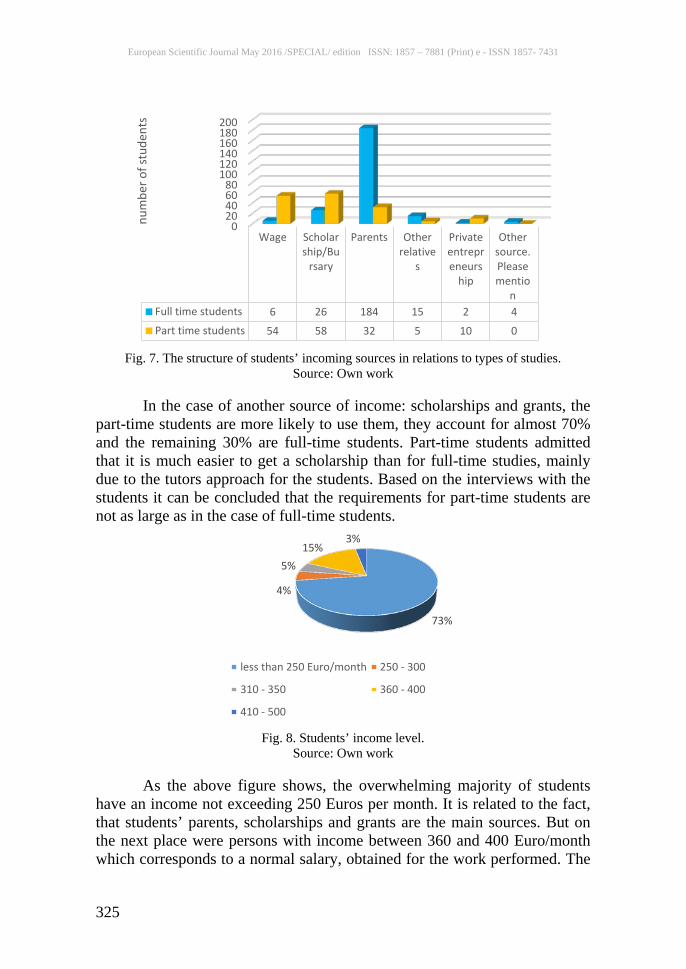
Fig. 7. The structure of students’ incoming sources in relations to types of studies.
Source: Own work In the case of another source of income: scholarships and grants, the
part-time students are more likely to use them, they account for almost 70% and the remaining 30% are full-time students. Part-time students admitted that it is much easier to get a scholarship than for full-time studies, mainly due to the tutors approach for the students. Based on the interviews with the students it can be concluded that the requirements for part-time students are not as large as in the case of full-time students.
Fig. 8. Students’ income level.
Source: Own work
As the above figure shows, the overwhelming majority of students have an income not exceeding 250 Euros per month. It is related to the fact, that students’ parents, scholarships and grants are the main sources. But on the next place were persons with income between 360 and 400 Euro/month which corresponds to a normal salary, obtained for the work performed. The
020406080
100120140160180200
Wage Scholarship/Bu
rsary
Parents Otherrelative
s
Privateentrepreneurs
hip
Othersource.Pleasementio
nFull time students 6 26 184 15 2 4Part time students 54 58 32 5 10 0
num
ber o
f stu
dent
s
73%
4%
5% 15%
3%
less than 250 Euro/month 250 - 300
310 - 350 360 - 400
410 - 500

European Scientific Journal May 2016 /SPECIAL/ edition ISSN: 1857 – 7881 (Print) e - ISSN 1857- 7431
326
percentage of students with an income of 410 - 500 Euro/month is only 3%, but these are the students who run their own business. However, it can be concluded that the financial condition of Polish students is not so bad.
In the case of the structure of the incurred expenditure, in the questionnaire research this question concerned the following types of expenditure: - Books, - Communication, - Dwelling- rent or instalment, - Entertainment, - Food, - Household expenses, - Transportation, - Tuition fees, - Other, please specify
However, in the case of this question, students were asked to give their respective rank, in the case of the most important type of expense attributed to the number 8, the next number in the series should be 7, and to the last position - the number 1. Then, the results were summed and the obtained results are presented on fig. 9.
Fig. 9. The students’ structure of expenses.
Source: Own work As the presented above figure 8 presents, the main students’ expense
are food expenses. But, under this category lies mostly dinners at restaurants, coffees in coffees bar or dinners in academic cafeteria. Less frequently this kind of expenses are related to purchases made in grocery stores. On second place are the household expenses - fees for rent, electricity, gas or water. This results indicate that a large part of the students do not live with their parents but they have own flats, live with the grandparents, rent with friends,
050
100150200250300350
European Scientific Journal May 2016 /SPECIAL/ edition ISSN: 1857 – 7881 (Print) e - ISSN 1857- 7431
327
colleagues or partners. On third place were telecommunications expenses, including here charges for phone, Internet or cable TV. Transport expenses were at another place and they involve both spendings on tram and rail tickets but also fuel expenses in case of the own car possession. In the middle there were also costs associated with repaying installments of loans or credtis. Much less money students spend on entertainment, books, and fees associated with tuition for college. Even among students of extramural studies, such charges were to further places, this is due to the fact that some of these costs are borne by parents and some students take grants which balance these expenses. In the case of expenses related to household bills and transport we examined the proportions of students living separately and havinf its own car. It turned out that 72% of all students do not live with their parents, but either already has its own apartment (usually inherited), lives in a dormitory or rent an apartment with friends or partner. The remaining 28% still live with their parents but plan to do so only until the end of study. Even more students, 83% of the respondents declared having the own car, and among the remaining 17%, a few dozen people declared their desire to buy a car in the near future and only a few, said that they did not have a car and dis not plan to buy it.
In the next part of the questionnaire, students were asked whether they are satisfied with their financial situation and if they expect that after graduation would be improved.
In the case of the first issues the vast majority of students, 268 of them people responded negatively (67%) and 128 students (33%) said they were satisfied with their current financial situation. It was also examined as its financial situation perceive women and men, as well as full-time and part-time students.
In the group of people satisfied and dissatisfied with their financial situation, men are the slight majority. In the first group they represent 58% and women 42%. In the group of people dissatisfied with their financial situation, the voices were divided up equally, both 50% men and 50% of women are dissatisfied with their financial situation. Taking into account the type of study, among full-time students up to 88% of them are dissatisfied with their financial situation, and only 22% have the opposite opinion. However, among the part-time students, the percentage of people dissatisfied was counted on 36% and the remaining 64% are satisfied. So the perception of its financial opinion may stem from the fact that the majority of full-time students receive money from their parents, and the part-time students have been paid for their work. Probably, a kind of source of earned income affects the perception of their financial situation.
The last issue concerned the question whether students expect that their financial situation will improve after graduation.
European Scientific Journal May 2016 /SPECIAL/ edition ISSN: 1857 – 7881 (Print) e - ISSN 1857- 7431
328
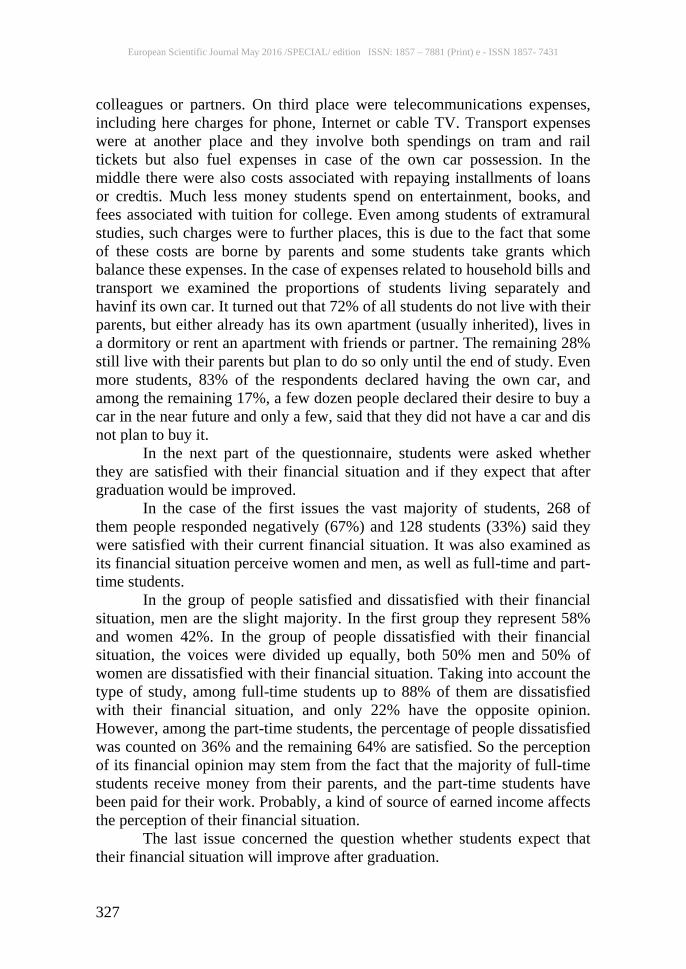
Fig. 10. The students’ expectations according their financial conditions after the graduation.
Source: Own work As shown in the figure 10, more than most students expect to
improve their financial situation after graduation, mainly due to the work undertaken in the future. And more than a ¾ of the students indicated that they did not know whether their financial situation would improve after graduation, this kind of response is motivated by the current realities of the labor market, which do not guarantee to find a job very quickly. 14% expect small improvement, explaining it by the fact that even taking a job after graduation, the received salary will not be high. Only 1% of respondents indicated that more surely their financial situation will not improve in connection with the graduation.
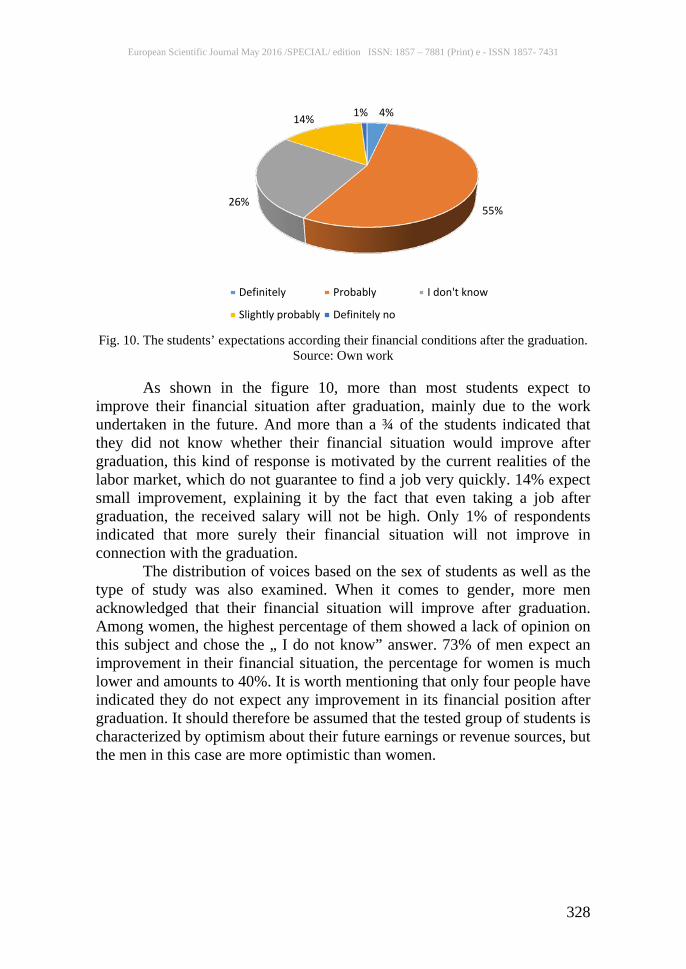
The distribution of voices based on the sex of students as well as the type of study was also examined. When it comes to gender, more men acknowledged that their financial situation will improve after graduation. Among women, the highest percentage of them showed a lack of opinion on this subject and chose the „ I do not know” answer. 73% of men expect an improvement in their financial situation, the percentage for women is much lower and amounts to 40%. It is worth mentioning that only four people have indicated they do not expect any improvement in its financial position after graduation. It should therefore be assumed that the tested group of students is characterized by optimism about their future earnings or revenue sources, but the men in this case are more optimistic than women.
4%
55% 26%
14% 1%
Definitely Probably I don't know
Slightly probably Definitely no
European Scientific Journal May 2016 /SPECIAL/ edition ISSN: 1857 – 7881 (Print) e - ISSN 1857- 7431
329
Fig. 11. The students’ expectations according their financial conditions after the graduation
in relations to their gender. Source: Own work
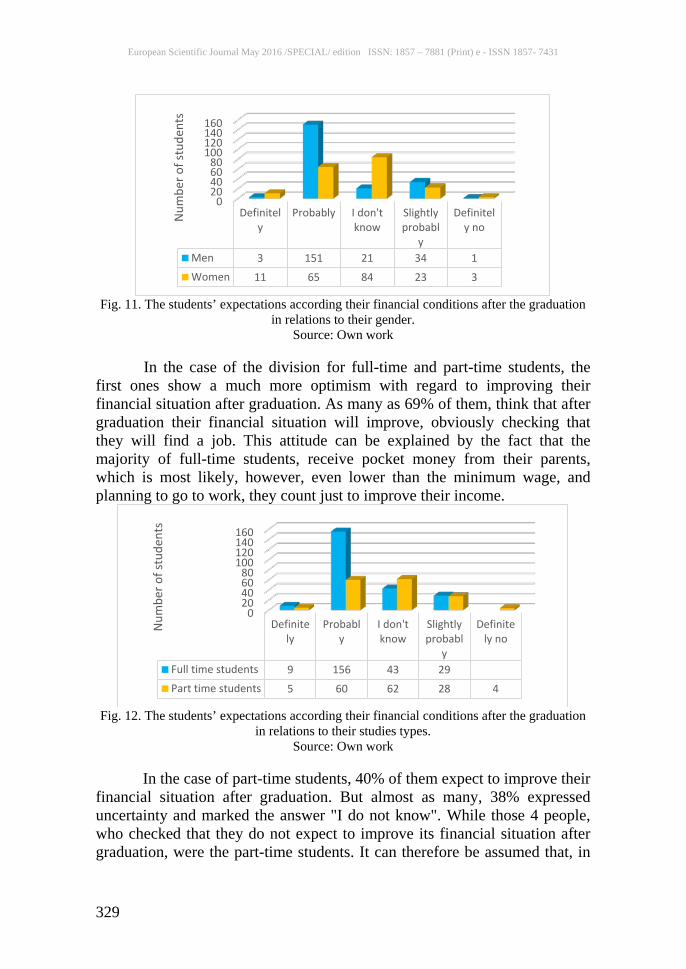
In the case of the division for full-time and part-time students, the
first ones show a much more optimism with regard to improving their financial situation after graduation. As many as 69% of them, think that after graduation their financial situation will improve, obviously checking that they will find a job. This attitude can be explained by the fact that the majority of full-time students, receive pocket money from their parents, which is most likely, however, even lower than the minimum wage, and planning to go to work, they count just to improve their income.
Fig. 12. The students’ expectations according their financial conditions after the graduation
in relations to their studies types. Source: Own work
In the case of part-time students, 40% of them expect to improve their
financial situation after graduation. But almost as many, 38% expressed uncertainty and marked the answer "I do not know". While those 4 people, who checked that they do not expect to improve its financial situation after graduation, were the part-time students. It can therefore be assumed that, in
020406080
100120140160
Definitely
Probably I don'tknow
Slightlyprobabl
y
Definitely no
Men 3 151 21 34 1Women 11 65 84 23 3
Num
ber o
f stu
dent
s
020406080
100120140160
Definitely
Probably
I don'tknow
Slightlyprobabl
y
Definitely no
Full time students 9 156 43 29Part time students 5 60 62 28 4
Num
ber o
f stu
dent
s
European Scientific Journal May 2016 /SPECIAL/ edition ISSN: 1857 – 7881 (Print) e - ISSN 1857- 7431
330
spite of studying, they work full time or run their own business and this situation will not change even after graduation. Conclusion
In Poland there is a stratification in the level of income, since income in Mazowieckie averages 1144,2Euro and in Pomerania 382,31Euro only. In the case of Czestochowa, which is one of the Silesian province this amount is 934.38 Euros and it is much higher than the income received by students participating in the survey, since the overwhelming majority of them, have monthly income less than 250 Euro, but we should bear in mind, they are the amounts that students receive from parents or scholarship, so on the one hand they can not be treated as income resulting from work. Despite the stratification of income and still relatively high level of unemployment, Polish society treats its financial situation as average, neither too good nor too bad. In this group mos of the students describe their financial situation as unsatisfactory. But on the other hand, the greater part of them expect to improve their financial situation after graduation. In this group, only 5 people showed up pessimism in this regard. The biggest part of the students expenditures are food and household bills expenses. The lowest proportion is spent on entertainment, books, and fees associated with studies. Such a structure of expenditure may also be due to the size of incomes, that are simply too low and students mostly spend them on the most important needs. In summary it can be assumed that the financial situation of students is not very bad, since the amounts which they have allow to pay for food and households bills, but on the other hand - are low, since students rarely can afford to entertain or to buy books. With this money they are also, not able to fund trips, holidays or vacations. References: Central Statistical Office of Poland “Household Budget Survey in 2014”, Warsaw 2015 Eurostat 2014, http://ec.europa.eu/eurostat/web/income-and-living-conditions/data/database Grondys K., Kott I., Wiśniewska-Sałek A., “Entrepreneurship as an opportunity of development for industrial companies using logistics centers”, in: Polish Journal of Management Studies, vol. 10/1/2014, pp. 45-53. International Monetary Fund, http://www.imf.org/external/pubs/ft/scr/2015/cr15183.pdf Kot S., Pigoń Ł., “Effective occupational counselling for the unemployed”, in: Polish Journal of Management Studies, vol. 10/1/2014, pp. 54-62. Polish National Bank, http://www.nbp.pl/publikacje/biuletyn_informacyjny/2014/2015_10_pl.pdf
European Scientific Journal May 2016 /SPECIAL/ edition ISSN: 1857 – 7881 (Print) e - ISSN 1857- 7431
331
Rutkowski A, „Zarządzanie finansami”, PWE, Warszawa 2000, p. 124. Salaries in Poland, www.wp.pl/Finance