income and wealth concentration in switzerland …
TRANSCRIPT

DISCUSSION PAPER SERIES
ABCD
www.cepr.org
Available online at: www.cepr.org/pubs/dps/DP5090.asp www.ssrn.com/xxx/xxx/xxx
No. 5090
INCOME AND WEALTH CONCENTRATION IN SWITZERLAND
OVER THE 20TH CENTURY
Fabian Dell, Thomas Piketty and Emmanuel Saez
PUBLIC POLICY

ISSN 0265-8003
INCOME AND WEALTH CONCENTRATION IN SWITZERLAND
OVER THE 20TH CENTURY
Fabian Dell, DIW, Berlin, PSE, Paris and CREST, Paris Thomas Piketty, EHESS and CEPR
Emmanuel Saez, University of California, Berkeley and CEPR
Discussion Paper No. 5090 May 2005
Centre for Economic Policy Research 90–98 Goswell Rd, London EC1V 7RR, UK
Tel: (44 20) 7878 2900, Fax: (44 20) 7878 2999 Email: [email protected], Website: www.cepr.org
This Discussion Paper is issued under the auspices of the Centre’s research programme in PUBLIC POLICY. Any opinions expressed here are those of the author(s) and not those of the Centre for Economic Policy Research. Research disseminated by CEPR may include views on policy, but the Centre itself takes no institutional policy positions.
The Centre for Economic Policy Research was established in 1983 as a private educational charity, to promote independent analysis and public discussion of open economies and the relations among them. It is pluralist and non-partisan, bringing economic research to bear on the analysis of medium- and long-run policy questions. Institutional (core) finance for the Centre has been provided through major grants from the Economic and Social Research Council, under which an ESRC Resource Centre operates within CEPR; the Esmée Fairbairn Charitable Trust; and the Bank of England. These organizations do not give prior review to the Centre’s publications, nor do they necessarily endorse the views expressed therein.
These Discussion Papers often represent preliminary or incomplete work, circulated to encourage discussion and comment. Citation and use of such a paper should take account of its provisional character.
Copyright: Fabian Dell, Thomas Piketty and Emmanuel Saez

CEPR Discussion Paper No. 5090
May 2005
ABSTRACT
Income and Wealth Concentration in Switzerland Over the 20th Century*
This paper presents homogeneous series on top shares of income and wealth in Switzerland since 1913 using personal income and wealth tax return statistics. In contrast to other countries such as Canada, France, the United Kingdom, the Netherlands or the United States, top income and wealth shares in Switzerland are strikingly flat over the century, and display no secular downtrend from the early part of the century to the post-World War II period. Switzerland hardly ever implemented a very progressive income and wealth tax structure and top income and wealth tax rates have been very low relative to other developed countries. Therefore, our findings for Switzerland lead much credence to the view that the development of very progressive taxation is the central factor explaining the sustained decline in wealth and income concentration in countries such as Canada, France, the United Kingdom, the Netherlands, or the United States.
JEL Classification: O15 and O52 Keywords: income inequality, taxation and wealth inequality
Fabian Dell DIW Königin-Luise Str. 5 D-14195 Berlin GERMANY Tel: (49 30) 89 789 152 Email: [email protected] For further Discussion Papers by this author see: www.cepr.org/pubs/new-dps/dplist.asp?authorid=159729
Thomas Piketty Paris Jourdan Sciences Economiques 48 Boulevard Jourdan 75014 Paris FRANCE Tel: (33 1) 4313 6250 Fax: (33 1) 4313 6259 Email: [email protected] For further Discussion Papers by this author see: www.cepr.org/pubs/new-dps/dplist.asp?authorid=119727

Emmanuel Saez University of California, Berkeley 549 Evans Hall, 3880 Berkeley CA 94720 USA Tel: (1 510) 642 4631 Fax: (1 510) 642 6615 Email: [email protected] For further Discussion Papers by this author see: www.cepr.org/pubs/new-dps/dplist.asp?authorid=145017
*We thank Tony Atkinson, Wiemer Salverda, and seminar participants at the CHANGEQUAL conference on Inequality at Nuffield College in Oxford for helpful comments and discussions. Financial support from the Sloan foundation, NSF Grant SES-0134946, and the Mac-Arthur foundation are thankfully acknowledged.
Submitted 10 May 2005
1
1. Introduction
The evolution of income and wealth inequality during the process of
development has attracted enormous attention in the economics literature.
Liberals have blamed income and wealth concentration because of concerns for
equity and in particular for tilting the political process in the favor of the wealthy.
They have proposed progressive taxation as an appropriate counter-force
against wealth concentration. For conservatives, concentration of income and
wealth is considered as a natural and necessary outcome of an environment that
provides incentives for work, entrepreneurship, and wealth accumulation, key
elements of macro-economic success. Progressive taxation may redistribute
resources away from the rich and wealthy and reduce wealth concentration but it
might also weaken those incentives and generate large efficiency costs.
Therefore, it is of great importance to understand the forces driving income and
wealth concentration over time and understand whether government
interventions through taxation are effective and/or harmful to curb wealth
inequality. This task is greatly facilitated by the availability of long and
homogeneous series of income or wealth concentration.
A number of recent studies, gathered in this volume, have constructed
series for shares of income accruing to upper income groups (such as the top
decile, top percentile, etc.) for various countries such as Piketty (2001, 2003, and
this volume) for France, Atkinson (this volume) for the United Kingdom, Piketty
and Saez (2003 and this volume) for the United States and Dell (2005) for
Germany. Shares of wealth accruing to top wealth groups have also been
constructed for some countries: Atkinson and Harrison (1978), and Atkinson,
Gordon and Harrison (1989) for the United Kingdom,1 Kopczuk and Saez (2004)
for the United States, Piketty, Postel-Vinay, and Rosenthal (2004) for France. All
these series share two important and striking characteristics. First, in all those
countries, a dramatic reduction in top income and wealth shares is observed from

2
the early part of the century to the decades following World War II. In virtually all
cases, the share of income or wealth accruing to the top 1% has been divided by
a factor two and sometimes, by a much greater factor. For example, in the United
Kingdom, the top 1% income share falls from almost 20% in 1918 to 6% in the
1970s (Atkinson, this volume). Second, in all those countries as well, those
dramatic decreases are concentrated in the very top groups of the income or
wealth distribution. There are relatively little secular changes for the bottom part
of the top decile or even the bottom of the top percentile, and the majority of the
decrease is actually concentrated in the top 0.1%.
In contrast, the evolution of top income shares in the recent decades has
been different across countries: the United States, Canada, and the United
Kingdom have experienced a large increase in top income shares while France,
and the Netherlands display hardly any change in top income shares. For the
United States (Piketty and Saez, 2003 and this volume) and Canada (Saez, and
Veall, 2004 and this volume), and the United Kingdom (Atkinson, this volume),
this dramatic increase has been due to a dramatic increase in top wages and
salaries. Kopczuk and Saez (2004) and Atkinson, Gordon and Harrison (1989)
show that in both the United States and the United Kingdom, the increase in top
wealth shares has been very small and almost negligible relative to the dramatic
increase in top income shares. This suggests that, although income
concentration has increased sharply in the United States and the United
Kingdom, it has not yet translated into a significant increase in wealth
concentration. 2
Following Piketty (2001, 2003, and this volume), most authors have
argued that the dramatic increase in tax progressivity - which took place during
World War I and the inter-war period in all the countries studied and which
remained in place after World War II period at least until the recent decades - has
been the main factor preventing top income and wealth shares from coming back
1 Lindert (2000) presents those UK wealth concentration series as well as more recent estimates prepared by the British fiscal administration.

3
to the very high levels observed at the beginning of the century.3 Indeed, with
marginal income tax rates in excess of 60%, and sometimes reaching even 90%
for very high incomes, a wealthy individual has to pay in taxes a very large
fraction of its returns on capital, and accumulating or sustaining a fortune
requires much higher saving rates.
However, because the effects of taxes on wealth concentration are a long-
term process, it is nearly impossible to provide a rigorous proof of this
hypothesis. The goal of the present paper is to provide a simple test of this
hypothesis by examining the case of Switzerland, a country which did not
experience the shocks of the two World Wars and never established a very
progressive tax structure. For most of the century, and it is still true today, the
majority of income taxes in Switzerland are levied at the local level (county
(Canton) level and municipal level). These local income and wealth taxes present
a relatively flat rate structure with low top marginal tax rates. Today, the
combined county and municipal income tax rates are around 25% in general, and
the top local wealth tax rate are in general less than 0.5% (see Charge Fiscale
en Suisse). Switzerland has also imposed federal income and wealth taxes
(starting during World War I in 1915). However, the top marginal income tax rates
have been around 10% for most of the period and the top wealth tax rates have
in general been less than 0.5%, except for a very few years during the World
Wars (see Charge Fiscale en Suisse). There is no federal inheritance and estate
taxes and most counties do not levy inheritance taxes between spouses and
between parents and children, or levy only a very modest tax of below 10% for
bequests to children. Thus over the 20th century, the marginal tax rate in
Switzerland on capital income of the very wealthy including federal and local
2 However, a spread of popular wealth could account for these flat shares, reconcentration at the top nonetheless taking place. This is for instance what happened in the UK, accentuated in the 1980s and 1990s by privatization and more recently by the house price boom. 3 Earlier studies of income and wealth concentration in the United States (Kuznets, 1955 and Lampman, 1962) also mentioned the development of progressive taxation as a factor explaining the decline of U.S. income and wealth concentration in the first half of the 20th century.

4
income, wealth, and inheritance taxes has been very low relative to other OECD
countries.4
Therefore, if the development of progressive taxation is the main factor
which drove and kept top income and wealth shares at a much lower level than in
early part of century, then we should not observe such a drop in Switzerland, a
country which never experienced sustained progressive taxation. In order to
answer this question, the present paper uses Swiss income and wealth tax
statistics to construct homogeneous series of income and wealth shares for
various upper income and wealth groups within the top decile. As personal
income and wealth taxes in Switzerland are based on family income (and not
individual income), our series measure inequality among families (which may be
different from inequality among individuals). Our top wealth shares series start in
1913 and cover a large number of years up to year 1957, the last year a federal
wealth tax was implemented. Since 1957, we have to rely on wealth surveys
compiled by the federal administration from county wealth tax statistics.
Unfortunately, such surveys were only made about once every ten years, and the
latest year available is 1997. Our top income share series start in 19335 and end
in 1996, the latest year available (due to a fundamental income tax reform
starting in 1997 in some counties and with a long transition period, see below).
Because federal income taxes in Switzerland have been assessed every two
years on the average income of the two preceding years, our top income shares
series are bi-annual. In contrast to the wealth share series, the income series are
quasi-continuous and cover almost all the years in the period 1933-1997.
Our results strongly support the tax explanation discussed above: top
wealth and income shares in Switzerland fell during the shocks of the World
Wars and the Great Depression (although much less than in other countries) but,
4 This statement should be carefully evaluated by estimating the average and marginal tax rates that top income and wealth groups face in Switzerland using the detailed statistics published in Charge Fiscale en Suisse. We leave establishing rigorously this key first stage point for future work. 5 Before 1933, Switzerland imposed federal income taxes but those taxes were based on labor income only and excluded capital income. As a result, these income tax statistics cannot be compared to the tax statistics starting in 1933 where all sources of income, both labor and capital, are reported.

5
most importantly, top wealth and income shares fully recovered from those
shocks in the post World War II period. As a result, by 1969, the top wealth
shares are about as high as they were before World War I, and top income
shares are higher in the early 1970s than in the pre-World War II period. As we
mentioned above, these results offer a striking contrast with the experiences of
France, the United Kingdom, the United States, and Canada. Thus, although
Switzerland had relatively less income and wealth concentration in the early part
of the century than those countries, by the 1960s, Switzerland displays
significantly more income and especially wealth concentration than other
countries. Interestingly, Switzerland does display a reduction in income and
wealth concentration since the 1970s, suggesting that non-tax factors such as
the aging of the population and the development of pensions might have reduced
wealth concentration.
Finally, we investigate the issue of tax evasion through relocation to
Switzerland or through Swiss bank accounts investments. We obtain upper
bounds on the fraction of income taxpayers in Switzerland with income abroad or
non-resident taxpayers. Although the fraction of such taxpayers has increased in
recent decades, it still remains below 20% even at the very top of the income
distribution suggesting that the phenomenon of migration toward Switzerland of
wealthy individuals is a very limited phenomenon relative to the number of high
income individuals actually living in European high tax countries.
Similarly, we can estimate an upper bound on the total amount of capital
income earned through Swiss accounts, which is never reported (either to the
Swiss fiscal administration for Swiss residents or to foreign fiscal administrations
in the case of non-residents). This amount is at most around $5 billion in recent
years and is negligible relative to total incomes earned by high income
individuals in the United States. This amount is also relatively small relative to
high incomes earned in large European countries such as France and clearly
cannot account for the gap in top income shares that has taken place between
continental Europe and Anglo-Saxon countries in recent decades. Clearly,
Switzerland is only but one of the potential destination for investors trying to

6
evade taxes in their home country. Trying to estimate systematically amounts of
capital income earned and evaded in all tax havens would be a useful project
that we leave for future work.
The paper is organized as follows. Section 2 describes our data sources
and outlines our estimation methods. In Section 3, we present and analyze the
trends in top income shares since 1933. Section 4 presents the evolution of top
wealth shares since 1913. Section 5 discusses the evidence on capital income
earned in Switzerland by non-residents. Finally, Section 6 offers a brief
conclusion.
2. Data and Methodology
2.1. Income and Wealth Federal Taxation and Statistical Sources Switzerland has imposed a Federal individual income tax irregularly in the first
part of the 20th century. The first two federal income taxes were the Impôt de
Guerre (based on incomes earned from 1911 to 1914) and the Nouvel Impôt
Federal de Guerre Extraordinaire (based on incomes earned in 1917 to 1928).
Statistics on these income taxes were published in Statistique du 1er impôt
fédéral de guerre 1916/17 and in Statistique concernant le nouvel impôt fédéral
de guerre extraordinaire (périodes I, II, et III), respectively. Unfortunately, those
early income taxes were based only on labor income and excluded capital
income and therefore are not analyzed in this study.6
Starting with the third federal income tax from 1933 to 1937 (Contribution
Fédérale de Crise), the income tax was assessed on total income (both income
from labor and capital). The fourth federal income tax (Impôt Fédéral pour la
Défense Nationale) started in 1939 and has been imposed regularly ever since.
This study is based on statistics by size of income published by the Swiss fiscal
6 Those taxes also included a wealth tax on individuals. We exploit those early wealth statistics to estimate top wealth shares early in the 20th century (see below).

7
administration covering those two federal income taxes for the periods 1933-
1937 and 1939-1996 (except 1941-42 for which no statistics were published).
A striking feature of the federal income tax in Switzerland is that, except
for 1933, it is not imposed on annual incomes as in most other countries but on
the average of two consecutive annual incomes. Column (0) in Table 2 shows
the bi-annual periods corresponding to the federal income tax in Switzerland
since 1933. For example, for the last period of analysis 1995-96, the income tax
is assessed on average (nominal) income earned in 1995 and 1996. The income
tax corresponding to those years is paid twice in the two following years (1997
and 1998). Therefore, there is a substantial lag between the moment when the
incomes are earned and the moment when the income tax is paid. The
distribution statistics have been published in Contribution Federale de Crise (for
years 1933 to 1937), Impot Federal pour la Defense Nationale (for years 1939 to
1980), and in Impot Federal Direct (for years 1981 to 1992). For years after 1992,
the paper publication is no longer available but statistics have been made
available online at http://www.estv.admin.ch. Many of these income distributions
are also been published in the annual Statistical yearbook for Switzerland
Annuaire Statistique de la Suisse.
After 1995/96, some counties in Switzerland start to switch to a standard
annual tax system instead of the bi-annual tax. By 2003, all counties have
switched to the new annual system. Unfortunately, during the transition period,
no uniform statistics for the full country exist and hence estimates would require
merging data from different counties and different years. That is why we do not
try to estimate top income shares after 1995/96, the last uniform bi-annual tax
period. We leave for future research the estimation during and after the transition
period. Such estimations are important to assess the effect on top income shares
of averaging income over two years instead of considering annual incomes as in
all other countries.

8
Our estimates are based on tabulation by size of income before
deductions (this is called Revenu net or net income7). The income definition is
stable over time and includes employment income, business income, and capital
income. It always excludes realized capital gains. Before 1971, income
distributions are presented by size of income after personal exemption
deductions (this is called Revenu imposable or taxable income). However,
information on the amounts and levels of those deductions is provided and we
add back those amounts in our estimation to obtain consistent series over time
based on income before deductions. We can check with statistics for 1971-72 (as
well as later years) presented both by size of income before deductions and
income after deductions that adding back deductions does not introduce any
significant error in our estimates.
Federal wealth taxes have been levied irregularly over the 20th century in
Switzerland. At the same time the federal income taxes were levied, Switzerland
imposed a federal wealth tax. Those wealth taxes were based on family net
worth as of January 1st, 1915 (for the first federal wealth tax, Impôt de Guerre),
as of January 1st, 1921, 1925, and 1929 (for the second federal wealth tax,
Nouvel Impôt Fédéral de Guerre Extraordinaire), and as January 1st, 1934, 1936,
and 1938 (for the third federal wealth tax, Contribution Fédérale de Crise).
Special federal wealth taxes were also levied on net worth as of January 1st of
1940 and 1945 (Sacrifice de Guerre). Finally, a more regular wealth tax (Impôt
Fédéral pour la Défense Nationale) was imposed every two years from 1947 to
1957 (always based on family net worth as of January 1st of the corresponding
years). After 1957, the federal wealth tax was eliminated.
All those federal wealth taxes were progressive with an exemption level
(which depended on family structure). As a result, families below the exemption
thresholds are not included in the statistics. For 1940 however, statistics on
wealth for families below the taxable threshold were collected for the county of
7 Note that this purely statistical denomination is somewhat misleading and correspond more to a “gross income” notion than to a “net income” notion (as frequently stated in the Swiss statistical

9
Thurgovia. We extrapolate the distribution of wealth in this county to Switzerland
to obtain a complete wealth distribution for 1940.
In addition to federal wealth taxes, counties have levied on a regular basis
(and often since the beginning of the 20th century or even earlier) wealth and
income taxes. Unfortunately, statistics on county wealth and income taxes
displaying distributions of income and wealth have not been officially published,
although some counties (such as the largest and wealthiest county of Zurich)
have compiled such statistics for internal use.8
However, for a number of years (1913, 1919, 1969, 1981, 1991, and
1997), Switzerland has compiled such statistics based on the wealth tax statistics
of all counties to construct wealth distributions as of January 1st of those years. In
contrast to the federal wealth tax statistics, those distributions cover the universe
of families with positive net worth.
The wealth distributions for 1913 and 1919 have been published in
Annuaire Statistique de la Suisse, 1914 (pp. 222-6) and 1921, p. 378
(respectively). The wealth distributions for 1969, 1981 were not officially
published but have been made available to us by the federal fiscal
administration. The wealth distributions for 1991, and 1997 have published in
Annuaire Statistique de la Suisse, 1997 and 2003 (respectively). The Swiss
administration plans to construct such wealth distributions every 6 years and the
next one should be produced for wealth held as of January 1st, 2003 (but is not
yet available).
The concept of wealth used for tax purposes (at the federal or county
levels) is very broad and includes all assets (tangible assets such as land,
buildings, residences, furniture, vehicles, jewelry, business assets, and intangible
assets such as stocks, bonds, cash, and also some pension rights) net of all
liabilities. Taxpayers were assessed at the same time for wealth and income
taxes so a number of tables showing wealth (respectively income) by size of
publications). 8 Income and wealth tax statistics for the county of Zurich have been made available to us for a number of years from 1934 to 1999. Such county statistics could be used to expand our series estimates. They moreover feature tabulations of the joint (income,wealth) distribution.

10
income (respectively wealth) are also available, although we have not used them
in the present study.
As discussed in introduction, Swiss income and wealth taxes are levied
both at the federal and local (county and city) levels. There is some variation in
the level of local income and wealth taxes. The Swiss fiscal administration has
published regularly summaries showing the level of income and wealth taxes by
size of income and wealth and by locality in the publication Charge Fiscale en
Suisse. Interestingly, this publication describes not only federal taxation but also
county and local level taxation and hence can provide a very accurate picture of
the fiscal environment for high income, high wealth families in Switzerland.
This publication is available since the beginning of the 20th century and
could be used to estimate average income and wealth tax rates of each of our
top income and wealth groups in every year. We have not yet exploited those
statistics on taxation but plan to do so in the future to establish rigorously our
claim that the tax burden on high income, high wealth individuals in Switzerland
has been substantially lower than in other countries such as the United States or
France.
2.2. Total Number of Tax Units and Total Income
The individual income and wealth taxes in Switzerland have always been
assessed at the family level (married couples with children dependents if any or
single taxpayers with children dependents if any). Therefore, our total number of
tax units is defined as the total number of adults (aged 20 and above) less half
the number of married men and women. The total number of adults in
Switzerland is obtained from Annuaire Statistique de la Suisse, 1993 (p. 47)
which reports population totals in Switzerland by age ranges for each of the
decenal census from 1900 to 1990. The estimate for year 2000 is obtained from
the same source available online at http://www.statistik.admin.ch. Those
statistics also report for every census the total number of married individuals. We
have interpolated linearly our estimates between two consecutive census to

11
create an annual series for the total number of adults and total number of tax
units in Switzerland. Those series are reported in columns (1) and (2) in Table 1.
Our total income denominator is estimated as follows. For the period
1971-1996, between 75% and 95% of families are filing tax returns (see columns
(3) and (4) in Table 1), therefore in that case, we estimate the denominator
starting from total income (called Revenu net) reported on tax returns (before
personal deductions and exemptions) and we assume that non-filers earn on
average 20% of average income. Our denominator is not very sensitive to the
exact assumption we are making about non-filers average income as this group
is small relative to filers for the period 1971-1996. For the period before 1971, the
fraction of filers is smaller and therefore we rely on National Accounts to estimate
our total income denominator. We simply take the denominator as 75% of
National Income. National Income is defined as the sum of personal income
(including government transfers) and corporate savings (after tax profits of
corporations after distribution of dividends). In 1971, our method starting from
total income reported from tax returns generates a total equal to 74.9% of
National Income so there is no discontinuity in our denominator estimation.
National Accounts are published in Annuaire Statistique de la Suisse (various
years) and also compiled in Siegenthaler (1996). Unfortunately, the breakdown of
National Income into personal income, government transfers, and corporate
savings is not available for all years and therefore we decided to adopt the
simple uniform 75% of National Income rule.9 Those National Income figures are
available starting in 1929. For the period 1901-1928 (reported on Table 1 but not
used in our estimations which start in 1933, we have used Maddisson GDP
estimates which we have pasted to year 1929). Column (5) reports our
9 This approach assumes that there has not been any significant trend prior to the 1970s in the share of government transfers plus corporate savings within national income. We do not have data to assess this assumption. However, as far as government transfers are concerned this assumption is conservative with regard to our main findings. Indeed, one might expect the trend (if any) to be increasing over time. This would mean that our total income denominator is under-estimated at the beginning of the period, and thus that our top income share are over-estimated. The secular decline of top income shares in Switzerland would then be even smaller. For instance if the “real” income total in 1933 were 90% of national income (small transfers, no savings during the Depression), the top 1% income share would be 8,3% and not 10%, compared with 8,0% in 1995-96.

12
denominator (in real 2000 Swiss Francs) and column (6) reports the average real
income per tax unit.
Our Consumer Price Index series, reported on column (7) of Table 1 is
obtained from Global Financial Data available online at www.globalfindata.com.
We estimate the CPI in any given year as the average of maximum and mininum
value for the CPI reported in the corresponding year.
As described above, income tax in Switzerland is based on the average of
the incomes earned in two consecutive years. Therefore, we average in the
same way our tax unit totals, denominator totals (for the pre-1971 period), and
Consumer Price Index series. Those estimates are presented in Table 2.
National Accounts in Switzerland do not report personal wealth estimates.
Therefore, we have estimated our total wealth denominator starting from total
wealth reported on tax returns. Fortunately, for a number of years (1913, 1919,
1940, 1969, 1981, 1991, 1997), the tabulations are based on the full population
(with positive net worth) and hence the total net worth reported is equal to total
personal net worth in the economy.10 For the remaining years, the fraction of
families covered is not complete but is over 10% (except for years 1934, 1936,
1938). As wealth is so concentrated, we estimate that the wealth of filers is over
80% of total wealth. From the wealth of filers, we estimate total wealth using the
closest years with complete coverage and assuming that the non-filers in the
non-complete year have the same wealth share as in the closest complete years.
More precisely, for year 1915, we use 1913 as the reference. For 1921,
we use 1919 as the reference. For 1925, 1929, 1932, 1934, 1936, we use the
mean of 1919 and 1940 as the reference. For years 1941, 1945, 1947, we use
1940 are the reference. For years 1949, 1951, 1953, 1955, 1957, we use the
mean of 1940 and 1969 as the reference. Again, as wealth is very concentrated,
even in the years where relatively few families are covered by the statistics, we
estimate that over 60% of total wealth (and over 80% except in the 1930s) is
10 We have no information on negative worth but we assume that total negative worth is negligible compared to total positive worth.

13
reported in the statistics so that our top wealth shares results are not very
sensitive to our denominator estimations. Our total wealth estimates are
presented in Table 3.11
2.3. Estimating Top Income and Wealth Shares
Top income and wealth shares are estimated using the standard Pareto
interpolation method. For recent years, the top bracket may contain more than
0.01% of tax units. In that case, we impute the very top shares assuming that the
distribution has a constant Pareto parameter in the top bracket and this Pareto
parameter is estimated using the ratio of average incomes in the top bracket to
the top bracket threshold. Table 2 presents the top income shares (along with the
reference totals) in Switzerland from 1933 to 1996 and Table 3 presents the top
wealth shares (along with the reference totals) from 1913 to 1997.
2.4. Non-Residents and Capital Income earned in Switzerland
Switzerland is a renowned place for bank secrecy and therefore is
believed to host large accounts on behalf of wealthy foreign individuals or
businesses interested in evading taxes in their own countries. Indeed, the
secrecy banking rules makes it very difficult for foreign fiscal administrations to
assess whether residents from their countries are evading capital income taxes
through Swiss accounts. Related, because Switzerland imposes moderate tax
rates on high incomes and high wealth Swiss residents, a number of celebrities
such as Sport stars and other wealthy individuals, most of them Europeans, have
11 The average wealth levels in the first two years 1913 and 1915 are much higher than from 1919 on. Both years 1913 and 1919 have full coverage and the inflation index more than doubles between 1913 and 1919., so nominal wealth levels are actually increasing by 30% from 1913 and 1919 (see Annuaire Statistique de la Suisse, 1921, p. 378, which presents both wealth distributions side to side). So it might be the case that the price indexes reported by Global Financial Data are narrow indices and provide a very imperfect measure of the general price increases. It seems hard to believe that wealth would increase only by 30% in nominal terms while all prices in the economy are doubling. Fortunately, wealth concentration estimates are completely independent of price indices.
14
chosen to live in Switzerland and become Swiss residents (for tax purposes) in
order to flee the high tax rates from their home countries. Swiss income tax
statistics can cast interesting light of both of these aspects of tax avoidance and
tax evasion.
First, in contrast to the popular view that returns on wealth invested
through Swiss accounts can escape completely taxation, the Swiss
administration imposes a flat 35% tax at source (called advance tax or Impot
Anticipé) on all returns earned through Swiss accounts. The fiscal administration
states clearly that this tax is very well enforced and that virtually all Swiss
financial institutions comply carefully with this rule. At the same time, the fact that
this tax is a flat rate tax allows Swiss financial institutions to keep the identity and
levels of each individual account secret. The 35% advance tax is refunded to
Swiss residents when they file their income tax (individual or corporate).12
For non-residents, the advance tax is refunded only if they show evidence
that they have reported those incomes for tax purposes in their country of
residency. The Swiss fiscal administration publishes every year in Recettes
fiscales de la Confédération the total amount of advance tax paid, and the
amounts refunded broken down by categories such as Swiss individual residents
(personnes physiques), Swiss corporations (personnes morales), and non-
residents (individuals or corporations). The difference between payments and
refunds corresponds to capital income earned through Swiss accounts by non-
residents and presumably never reported for tax purposes. Thus, we can use
those statistics to estimate how much capital income is earned by non-residents,
what fraction is reported in their countries and what fraction is never reported in
their countries. We also estimate by how much top income shares in France
would be increased if we added back to the French top income groups all the
capital income evaded through Swiss accounts. In reality, the French are not the
only foreigners to use Swiss accounts and there are many other tax haven
12 Paying the advance tax does not free Swiss residents from reporting those incomes on their tax returns. This, together with the fact that combined federal and local income tax rates in Switzerland very rarely reach 35%, implies that virtually all income earned by Swiss residents and

15
jurisdictions which are actively used to evade taxes on capital income (such as
Luxembourg, Monaco, Andorra, Monte-Carlo, to name a few along the French
border). However, our estimates are still instructive to get a sense of the
magnitudes and dissipate the myth that the sums earned through those secret
Swiss accounts are gigantic.
Second, the tabulations by size of income we use also provide a
breakdown of taxpayers that allows us to estimate an upper bound on the
number of non-residents filing income taxes in Switzerland or the number of
Swiss residents getting income from abroad. Presumably, all the wealthy
foreigners relocating in Switzerland for fiscal reasons will fall into those
categories. More precisely, the Swiss income tax statistics divide taxpayers into
normal cases and special cases. Special cases are 1) those taxpayers who did
not have regular incomes over the two year period taken into account for tax
purposes (and which are subject to different rules to compute average income for
tax purposes) or 2) taxpayers who are non-residents or residents with income
from abroad. This second category is called special cases (others) (cas
speciaux, autres) and is the category of interest for us.
From 1957 to 1992, this category is tabulated by size of income, allowing
us to compute the fraction of taxpayers (income weighted) in each top income
group, which falls in this special cases (others) category. For years 1949 to 1956,
only the total number of special cases (others) is reported with no breakdown by
size of income.
3. Top Income Shares
Figure 1 displays the average real income per tax unit (from our
denominator measure) and the Consumer Price Index in Switzerland from 1901
to 2000. Figure 1 shows that real incomes grew slowly before World War II,
rapidly from World War II to the early 1970s, and have stagnated since then. This
subject to the advance tax will be reported on their tax returns and hence be included in the statistics we are using.

16
broad pattern is quite similar to the French experience (see Piketty, this volume).
Since the beginning of the century, Switzerland has always been among the very
richest countries in the World. It should be noted that the business cycles and in
particular the Great Depression have been mild in Switzerland. Price inflation has
been moderate over the century, with sustained inflation only during World War I
and to a lesser extent during World War II and the 1970s.
Figure 2 displays the top 10% and top 5% income shares in Switzerland
from 1933 to 1996. Those top income shares are very stable over the period,
with the top 10% share varying between 30 to 33% and the top 5% share
between 20 to 24%. Figure 3 decomposes the top 10% into three groups: the top
1%, the next 4% (top 5-1%), and the second vintile (top 10-5%). The two bottom
groups are remarkably stable over the period. The top 1% income share
experiences somewhat larger fluctuations but never falls below 8% or goes
above 12%. Three elements should be noted. First, there is spike in top 1%
income share (but not in the other two groups) for years 1939-40, just at the eve
of World War II. It is conceivable that such a spike is due to an influx of wealthy
immigrants fleeing from the Nazis. Second, the top 1% income share does not
fall during World War II or in the decades following the war. Quite to the contrary,
the top 1% income share is the 1960s is actually slightly higher than in the
1930s. Finally, the top 1% income share falls in the early 1970s and again in the
1990s, so that it is a its lowest point in 1995-96, the last year we construct those
estimates.
Figure 4, decomposes again the top 1% group into three groups: the
bottom half to the top percentile (top 1-0.5%), the next 0.4% percent (top 0.5-
0.1%), and the top 1%. The figure shows that even the top 0.1% income share
did not experience large fluctuations over the century (except for a temporary
spike in 1939-40). Figure 5 shows the evolution of shares within shares, namely
the share of the top percentile within the top decile, and the share of the top 0.1%
within the top percentile. Shares within shares only rely on income tax data and
are thus immune against any biases in income control totals. The two series
exhibit a striking stability and similarity throughout the century fluctuating

17
between 30% and 35% almost over the entire period confirming the pattern
observed with simple income shares.
Figure 6 contrasts the experience of the top 0.1% income group in
Switzerland with the French (Piketty, this volume) and the American (Piketty and
Saez, this volume) experiences. In contrast to France and the United States,
there is no decline in the top income share from the pre-war period to the
decades following World War II. As a result, although the top 0.1% income share
in Switzerland was lower (around 3-4%) than in France or US (5-6%) in the
1930s, the top 0.1% income share was substantially higher in Switzerland in the
1960s (around 3.5%) than in the France and the United States (2-2.5%).
Therefore, the Swiss income share results show clearly that the large
decline in very top income shares from the pre-war period to the post-war
decades that has been found in all other countries studied in this volume did not
take place in Switzerland. There are two limitations in those income
concentration estimates for Switzerland. First, they start only in 1933, at a time
where top income shares in other countries (such as France, the United States,
or the United Kingdom) had already fallen significantly relative to their pre-World
War I levels, therefore it would important to know whether Switzerland
experienced substantial wealth and income de-concentration in the early part of
th 20th century. Second, the dramatic fall in very top income shares in other
countries was primarily a capital income phenomenon due to a drastic fall in top
fortunes. However, the Swiss income tax statistics do not provide information on
the composition of top incomes and therefore do not allow us to look separately
at the capital and labor income components.
Therefore, in order to overcome those two limitations, we now turn to
wealth statistics which are available since 1913 and allow us to focus directly on
the capital component of inequality.
4. Top Wealth Shares

18
Table 3 presents our top wealth shares estimates for Switzerland. Figure 7
displays the wealth shares of the top 1%, the next 4% (top 5-1%), and the
second vintile (top 10-5%). Those groups are defined relative to all families in
Switzerland (as for income shares) ranked according to net worth (gross wealth
minus liabilities). Figure 7 shows that top wealth shares have also been
remarkably stable over the full 20th century in Switzerland. In particular, the top
1% income share is about the same in 1969 and in 1915 (around 42%). Thus,
although the levels of income concentration were relatively low in Switzerland,
this evidence shows that wealth in Switzerland is actually quite concentrated. It is
notable that there was some reduction in wealth concentration from 1969 to 1981
with the top 1% wealth share falling from 42 to 33 percent.
Figure 8 decomposes the top percentile of wealth holders into the top
0.1%, the next 0.4% (top 0.5-0.1%), and the bottom half of the top percentile (top
1-0.5%). The figure shows that even very top wealth holders groups do not
experience a secular decline, at least not before the 1970s. The top 0.1% wealth
share stands at about 17% both in 1915 and in the 1960s.
Figure 9 compares Switzerland with the United States by displaying the
top 1% wealth share series in both countries since 1915. The estimates for the
United States are from Kopczuk and Saez (2004) and are estimated from estate
tax statistics using the estate multiplier technique (and hence are based on
individual wealth as opposed to family wealth in Switzerland). The figure shows
that wealth concentration was similar in the United States and Switzerland at the
beginning of the century, with the top 1% holding about 40% of total wealth.
However, wealth concentration declined drastically in the United States to about
25% by the 1960s while it remained above 40% in Switzerland as late as 1969.
This evidence, together with our previous results on top income shares,
shows that the reduction in income and wealth concentration documented for
most countries did not happen in Switzerland and hence is not a necessary
outcome of the development process of economically advanced countries. As we
discussed in introduction, the finding that wealth concentration did not decrease
in Switzerland, a country which never imposed very high tax rates on top income
19
earners and top wealth holders, is consistent with the explanation that
progressive taxation is the main reason which prevented large fortunes to
recover to the pre-World War I levels in other countries in the second part of the
20th century.
5. Foreign Capital Income and Foreigners in Switzerland
Table 4 presents the fraction of special cases (others) which contains all
non-resident taxpayers filing income taxes in Switzerland as well as all Swiss
residents with income abroad among our top income groups. Figure 10 depicts
those fractions for three tax periods, 1957-8, 1973-4, and 1991-2. First, the
fraction of such returns increases sharply as we move up the income distribution,
starting from negligible levels in the second vintile to significant fractions at the
very top. Second, those fractions increase substantially over time. By 1991-2, at
the very top 0.01% group, such taxpayers represent 20% of taxpayers while they
were only 8% of taxpayers in 1957-8. This suggests that the number of wealthy
foreigners living in Switzerland has probably increased sharply since the 1950s.
However, the important point to note is that they remain a minority even in recent
years and at the very top. Switzerland is a small country with moderate income
concentration in recent decades. As a result, the view that a very large fraction of
the wealthy in Europe and around the world relocate to Switzerland to escape
high taxation in their countries is clearly contradicted by the tax statistics.
Obviously, one would need to produce the same statistics for all potential tax
havens and not only Switzerland, to assess to what extent wealthy individuals in
high tax countries relocate to lower tax countries.
Table 5 displays the results obtained from the aggregate statistics on the
35% flat advance tax withheld at source on all capital income earned through
Swiss financial institutions. Those statistics are averaged by decades. They show
that the fraction of total capital income earned through Swiss financial institutions
by non-residents but reported to the fiscal administration in their country of
residency (and hence refunded by the Swiss fiscal administration) has indeed

20
increased substantially since the 1950s from 1% to about 20% in recent years.
The fraction of capital income whose advance tax is never refunded is an upper
bound on capital earned by non-residents and never reported for tax purposes in
their home countries (and hence presumably evaded). Table 5 show that this
upper bound is relatively modest and is lower than 10% of total capital income
earned in Switzerland in recent decades. It stands at around 7.25 billion of Swiss
Francs (around $5 billion) per year in recent years. This is extremely small
relative to total incomes reported by very top groups in the United States.13
Table 5 shows how this upper bound on capital income evaded through
Swiss accounts compares with total income reported in top income groups in
France. The table shows that those numbers are small relative to the top 1%
(around 7% in recent decades) or even the top 0.1% (around 30%), although,
they are comparable in magnitude to total incomes reported by the top 0.01%
taxpayers (the top 2,000 top French taxpayers). Therefore, if all this capital
income were added back to the top 0.01% French incomes, the top 0.01%
French income share would at most double from 0.5% to about 1% of total
French income. That would still be a modest level of top income concentration
relative to the almost 3% share of total income earned by the top 0.01% income
earners in the United States in 2000.
Therefore, evasion through secret Swiss accounts can clearly not account
for the gap in top income shares documented in this volume between continental
European countries and Anglo-Saxon countries. However, as we mentioned
above, it would be extremely useful to try to compile similar estimates of total
capital income evaded not only through Switzerland but through all other
potential tax havens.
6. Conclusion 13 For example, Bill Gates, the richest person in the United States, will earn almost $4 billion in 2004 due to extra-ordinary dividends from Microsoft. The top .01% US taxpayers (about 13,400 taxpayers) in 2000, earned in total about $175 billion even excluding realized capital gains (see

21
This paper has shown that in contrast to other countries studied in the
volume, Switzerland did not experience a reduction in income and wealth
concentration from the pre-World War I period to the decades following World
War II. We have tentatively argued that the absence of progressive income and
wealth taxation in Switzerland is the main factor explaining the discrepancy of the
Swiss experience, although more work is clearly needed to establish to what
extent taxation of top income and top wealth holders was lower in Switzerland
than in other countries. Interestingly, the pattern of economics growth in
Switzerland is very close to the French or American experience, albeit less
tumultuous. This suggests that the high concentration of wealth and low levels of
top tax rates that Switzerland experienced in the post-World War II period did not
provide a boost to its economic performance relative to other countries such as
France or the United States (which also grew very quickly after World War II). It
also suggests that the high wealth concentration levels were not an impairment
to achieve high growth in the post-World War II.14
Piketty and Saez, this volume). Those amounts clearly dwarf the at most $5 billion in capital income earned through Swiss accounts by wealthy foreigners who evade taxes in their country. 14 The experience from Latin America suggests that high wealth concentration might impair growth through political instability and subsequent poor government management of the economy. The high wealth concentration levels in Switzerland obviously did not generate political instability in that country.

22
References on data sources for Switzerland Virtually all statistical publications in Switzerland are bilingual, published in French and German (we give both titles wherever possible) General statistics about Switzerland: Siegenthaler, Hansjorg (1996) Statistique Historique de la Suisse / Historische Statistik der Schweiz (Zurich: Chronos) Switzerland. Eidgenossisches Statisches (annual 1891-2004). Annuaire Statistique de la Suisse / Statistisches Jahrbuch der Schweiz, (Verlag des Art: Zurich) Tax Statistics: Income and wealth tax burdens (by county and income and wealth levels): Switzerland, Statistisches Bureau (annual 1919-1929) Les Impots sur le Produit du travail et le capital dans les principales communes de la Suisse, Bulletin de Statistique Suisse, (Bern: Eidgenossisches Statistisches Amt) Switzerland, Statistisches Bureau (annual 1929-2004) Charge Fiscale en Suisse / Steuerbelastung in der Schweiz, (Bern: Eidgenossisches Statistisches Amt), ), published in the series (Statistiques de la Suisse / Statistische Quellenwerke der Schweiz) up to 1960. Income and wealth tax statistics (by size of income and wealth): Switzerland: Administration fédérale des contributions (1920) Statistique du 1er Impot Federal de Guerre 1916/1917 (Bern: Eidgenossisches Steuerverwaltung) Switzerland: Administration fédérale des contributions (1926, 1930, 1934) Statistique Concernant le Nouvel Impot Federal de Guerre Extraordinaire / Statistik der Neuen Ausserordentlichen Eidgenossischen Kriegssteuer volumes I, II, and III, (Bern: Eidgenossisches Steuerverwaltung) Switzerland: Administration fédérale des contributions (1937, 1939, 1941) Contribution Federale de Crise / Eidgenossische Krisenabgabe, Periods I, II, and III published in series (Statistiques de la Suisse / Statistische Quellenwerke der Schweiz)

23
Switzerland: Administration fédérale des contributions (every two years 1941-1980) Impot Federal pour la Defense Nationale / Eidgenossische Wehrsteuer: Statistik, periods I to XX, (Bern: Eidgenossisches Steuerverwaltung), published in the series (Statistiques de la Suisse / Statistische Quellenwerke der Schweiz) Switzerland: Administration fédérale des contributions (biannual 1982-1995) Impot Federal Direct. Statistique de la Periode de Taxation / Direkte Bundessteuer. Statistik der Veranlagungsperiode, (Bern: Eidgenossisches Steuerverwaltung) For years after 1992, the paper publication is no longer available but statistics have been made available online at http://www.estv.admin.ch Statistics on advanced flat tax on capital income (Impot Anticipe) Switzerland, Administration fédérale des contributions, Division Statistique fiscale et documentation, (2003), Recettes fiscales de la Confédération 2002 (Berne) References Atkinson, Anthony B. (this volume) “Top Incomes in the United Kingdom over the Twentieth Century.”, mimeo Nuffield College, Oxford. Atkinson, Anthony B. and A. J. Harrison (1978), Distribution of Personal Wealth in Britain, Cambridge University Press: Cambridge. Atkinson, Anthony B. ,Gordon, J. P. F. and Harrison A. J., (1989), “Trends in the Shares of Top Wealth Holders in Britain, 1923-1981'', Oxford Bulletin of Economics and Statistics, 51(3), 315-332. Dell, Fabien (in this volume) “Top Incomes in Germany throughout the Twentieth Century”. Kopczuk, Wojciech and Emmanuel Saez (2004) “Top Wealth Shares in the United States, 1916-2000: Evidence from Estate Tax Returns”, National Tax Journal, 57(2), Part 2, 445-487. Kuznets, Simon. (1953), Shares of Upper Income Groups in Income and Savings, National Bureau of Economic Research. Lampman, Robert J. (1962), The Share of Top Wealth-Holders in National Wealth, 1922-1956, NBER and Princeton University Press.

24
Lindert, Peter (2000), “Three Centuries of Inequality in Britain and America”, in Handbook of Income Distribution, edited by A. Atkinson and F. Bourguignon, 167-216, North-Holland. Piketty, Thomas (2001), Les hauts revenus en France au 20eme siecle – Inegalites et redistributions, 1901-1998, Paris : Editions Grasset (812p.) Piketty, Thomas (2003 and this volume), “Income Inequality in France, 1901-1998”, Journal of Political Economy, 111(5), 1004-1042. Piketty, Thomas, Gilles Postel-Vinay, and Jean-Laurent Rosenthal (2004), “Wealth Concentration in a Developping Economy : Paris and France, 1807-1994”, mimeo EHESS and UCLA. Piketty Thomas, and Emmanuel Saez (2003), “Income Inequality in the United States, 1913-1998”, Quarterly Journal of Economics, 118(1), 1-39. Piketty Thomas, and Emmanuel Saez (this volume), “Income Inequality in the United States, 1913-2002”. Saez, Emmanuel and Michael R. Veall (2004), “The Evolution of Top Incomes in Northern America: Lessons from Canadian Evidence”, forthcoming American Economic Review. Saez, Emmanuel and Michael R. Veall (this volume), “The Evolution of Top Incomes in Canada, 1920-2000.”

FIGURE 1Average Real Income and Consumer Price Index in Switzerland, 1901-2000
Source: Table 1, columns (6) and (7).
0
10,000
20,000
30,000
40,000
50,000
60,000
70,000
1901
1906
1911
1916
1921
1926
1931
1936
1941
1946
1951
1956
1961
1966
1971
1976
1981
1986
1991
1996
Inco
me
in 2
000
Swis
s Fr
ancs
1
10
100
CPI
(bas
e 10
0 in
200
0)
Average Real Income Consumer Price Index

FIGURE 2Top 10% and Top 5% income shares in Switzerland, 1933-1996
Source: Table 2, col. Top 10% and Top 5%
0%
5%
10%
15%
20%
25%
30%
35%
1933
1934
-35
1936
-37
1939
-40
1943
-44
1945
-46
1947
-48
1949
-50
1951
-52
1953
-54
1955
-56
1957
-58
1959
-60
1961
-62
1963
-64
1965
-66
1967
-68
1969
-70
1971
-72
1973
-74
1975
-76
1977
-78
1979
-80
1981
-82
1983
-84
1985
-86
1987
-88
1989
-90
1991
-92
1993
-94
1995
-96
Shar
e in
per
cent
Top 10% Top 5%

FIGURE 3Top 1%, Top 5-1%, and Top 10-5% income shares in Switzerland, 1933-1996
Source: Table 2, col. Top 1%, 5-1% and Top 10-5%
0%
2%
4%
6%
8%
10%
12%
14%
1933
1934
-35
1936
-37
1939
-40
1943
-44
1945
-46
1947
-48
1949
-50
1951
-52
1953
-54
1955
-56
1957
-58
1959
-60
1961
-62
1963
-64
1965
-66
1967
-68
1969
-70
1971
-72
1973
-74
1975
-76
1977
-78
1979
-80
1981
-82
1983
-84
1985
-86
1987
-88
1989
-90
1991
-92
1993
-94
1995
-96
Shar
e in
per
cent
Top 10-5% Top 5-1% Top 1%
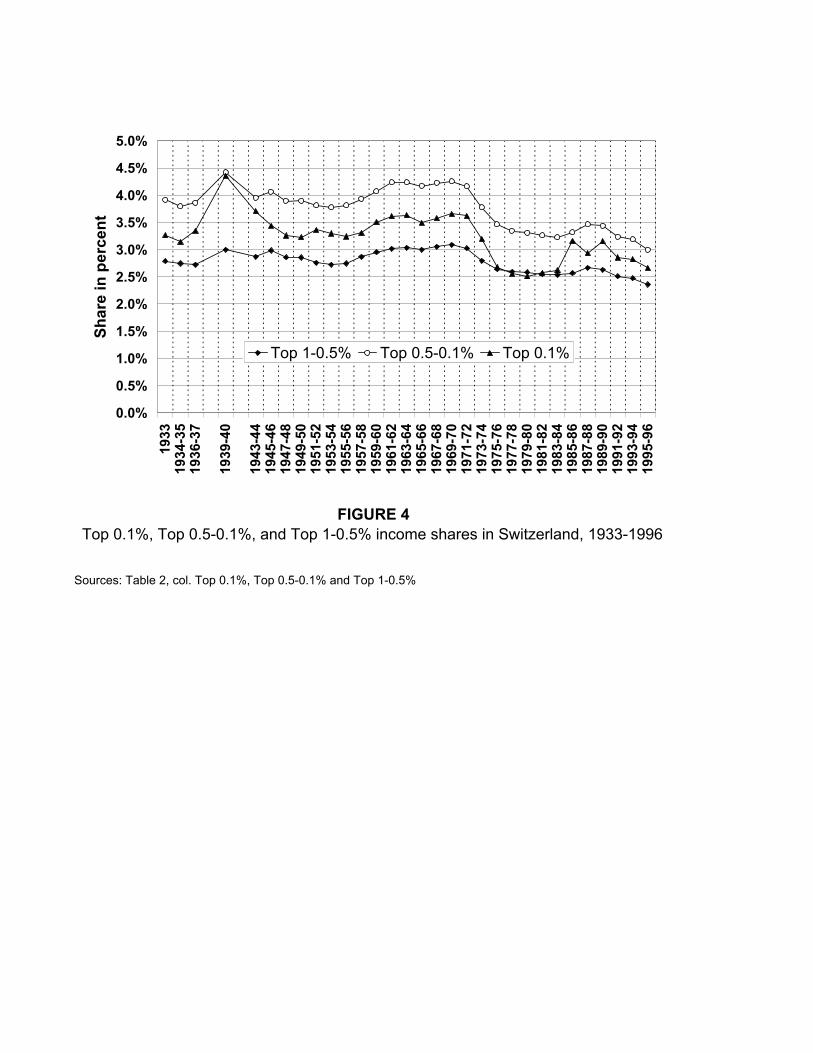
FIGURE 4Top 0.1%, Top 0.5-0.1%, and Top 1-0.5% income shares in Switzerland, 1933-1996
Sources: Table 2, col. Top 0.1%, Top 0.5-0.1% and Top 1-0.5%
0.0%
0.5%
1.0%
1.5%
2.0%
2.5%
3.0%
3.5%
4.0%
4.5%
5.0%19
3319
34-3
519
36-3
7
1939
-40
1943
-44
1945
-46
1947
-48
1949
-50
1951
-52
1953
-54
1955
-56
1957
-58
1959
-60
1961
-62
1963
-64
1965
-66
1967
-68
1969
-70
1971
-72
1973
-74
1975
-76
1977
-78
1979
-80
1981
-82
1983
-84
1985
-86
1987
-88
1989
-90
1991
-92
1993
-94
1995
-96
Shar
e in
per
cent
Top 1-0.5% Top 0.5-0.1% Top 0.1%

FIGURE 5Shares within shares in Switzerland
Sources: Tables 2, Columns 18 and 19.
0%
5%
10%
15%
20%
25%
30%
35%
40%
1933
1934
-35
1936
-37
1939
-40
1943
-44
1945
-46
1947
-48
1949
-50
1951
-52
1953
-54
1955
-56
1957
-58
1959
-60
1961
-62
1963
-64
1965
-66
1967
-68
1969
-70
1971
-72
1973
-74
1975
-76
1977
-78
1979
-80
1981
-82
1983
-84
1985
-86
1987
-88
1989
-90
1991
-92
1993
-94
1995
-96
Shar
e w
ithin
sha
re (i
n %
)
top 1% within top 10% top 0.1% within top 1%

FIGURE 6The Top 0.1% Income Share in the France, the United States, and Switzerland
Sources: United States, Piketty and Saez (this volume), Table A1, column Top 0.1%France: Piketty (2003 and this volume)Switzerland: Table 2, Column Top 0.1% income share
0%
1%
2%
3%
4%
5%
6%
7%
8%
1933
1938
1943
1948
1953
1958
1963
1968
1973
1978
1983
1988
1993
Inco
me
Shar
e (in
%)
France United States Switzerland

FIGURE 7Top 10-5%, Top 5-1%, and Top 1% wealth shares in Switzerland, 1913-1997
Source: Table 3, col. Top 10-5%, Top 5-1% and Top 1%
0%
5%
10%
15%
20%
25%
30%
35%
40%
45%
50%19
1319
1719
2119
2519
2919
3319
3719
4119
4519
4919
5319
5719
6119
6519
6919
7319
7719
8119
8519
8919
9319
97
Wea
lth s
hare
Top 10-5% Top 5-1% Top 1%

FIGURE 8Top 1-0.5%, Top 0.5-0.1%, and Top 0.1% wealth shares in Switzerland, 1913-1997
Source: Table 3, col. Top 1-0.5%, Top .5-.1% and Top 0.1%
0%
5%
10%
15%
20%
25%
1913
1917
1921
1925
1929
1933
1937
1941
1945
1949
1953
1957
1961
1965
1969
1973
1977
1981
1985
1989
1993
1997
Wea
lth S
hare
Top 1-.5% Top .5-.1% Top 0.1%

FIGURE 9The Top 1% Wealth Share in the United States and Switzerland
Sources: United States, Kopczuk and Saez (2004), Table B1, column Top 1%Switzerland: Table 3, Top 1% Wealth share Note: US wealth shares are based on individual adults while Swiss shares based on the family level
0%
5%
10%
15%
20%
25%
30%
35%
40%
45%
50%19
15
1920
1925
1930
1935
1940
1945
1950
1955
1960
1965
1970
1975
1980
1985
1990
1995
2000
Wea
lth S
hare
United States Switzerland

FIGURE 10The fraction of foreign income earners and non-residents in top income groups
Sources: Table 4. The figure displays for three tax years the fraction of special cases (others)defined as tax returns filed by non-residents (with income in Switzerland) or tax returns filedby Swiss residents with income from foreign (non Swiss) sources.
0%
5%
10%
15%
20%
25%
10-5
%
5-1%
1-.5
%
.5-.1
%
.1-.0
1%
0.01
%
1957-8 1973-4 1991-2

Inflation(1) (2) (3) (4) (5) (6) (7)
Adult Population Tax Units Tax returns Fraction Total Income Average Income CPI(aged 20+) filing (Millions Fr.) per tax unit (2000 base)
('000s) ('000s) ('000s) (percent) (2000 Fr.)
1901 1,997 1,447 - 24,214 16,732 8.8481902 2,022 1,464 - 24,611 16,813 8.8481903 2,047 1,481 - 24,989 16,879 8.9551904 2,072 1,497 - 25,359 16,938 8.9551905 2,097 1,514 - 26,134 17,264 9.0611906 2,123 1,530 - 26,073 17,036 9.2751907 2,148 1,547 - 26,417 17,075 9.7011908 2,173 1,564 - 26,761 17,113 9.9141909 2,198 1,580 - 27,091 17,142 10.0211910 2,224 1,597 - 27,407 17,161 10.2341911 2,242 1,611 - 27,744 17,217 10.5541912 2,261 1,626 - 28,054 17,255 10.7671913 2,279 1,640 - 28,344 17,280 10.6601914 2,298 1,655 - 28,128 16,999 10.6601915 2,317 1,669 - 28,506 17,078 11.8451916 2,335 1,684 - 28,418 16,880 13.7061917 2,354 1,698 - 25,278 14,887 17.0911918 2,373 1,712 - 25,238 14,738 21.4901919 2,391 1,727 - 26,976 15,622 23.3521920 2,410 1,741 - 28,667 16,464 23.7741921 2,440 1,761 - 27,960 15,876 20.8721922 2,469 1,781 - 30,688 17,231 17.8411923 2,499 1,801 - 32,386 17,984 17.1311924 2,528 1,821 - 33,484 18,391 17.6901925 2,558 1,841 - 35,802 19,452 17.5801926 2,587 1,860 - 37,385 20,095 17.0631927 2,616 1,880 - 39,151 20,822 16.7341928 2,646 1,900 - 41,003 21,579 16.8281929 2,675 1,920 - 43,121 22,459 16.8121930 2,705 1,940 - 43,487 22,418 16.5511931 2,730 1,955 - 42,110 21,539 15.6941932 2,755 1,970 - 40,154 20,379 14.5291933 2,780 1,986 272.4 13.7 42,638 21,475 13.7871934 2,806 2,001 42,817 21,401 13.5731935 2,831 2,016 42,790 21,225 13.3901936 2,856 2,031 41,885 20,620 13.6621937 2,881 2,046 44,419 21,706 14.1741938 2,906 2,062 - 44,382 21,527 14.3201939 2,931 2,077 44,339 21,349 14.5191940 2,956 2,092 43,943 21,004 15.8871941 2,982 2,107 42,924 20,369 18.1391942 3,014 2,125 41,465 19,517 20.1611943 3,047 2,142 42,528 19,857 21.2161944 3,080 2,159 43,569 20,182 21.6501945 3,113 2,176 46,148 21,208 21.7961946 3,145 2,193 50,697 23,116 21.7811947 3,178 2,210 54,426 24,623 22.7521948 3,211 2,228 54,905 24,648 23.4501949 3,244 2,245 53,443 23,809 23.1991950 3,277 2,262 57,108 25,248 22.8191951 3,322 2,287 59,670 26,094 23.8871952 3,367 2,312 61,672 26,678 24.4891953 3,412 2,337 64,824 27,742 24.3101954 3,457 2,362 68,499 29,006 24.5391955 3,502 2,386 72,551 30,401 24.7401956 3,547 2,411 76,517 31,731 25.0841957 3,592 2,436 79,609 32,676 25.6071958 3,637 2,461 81,591 33,150 26.0441959 3,682 2,486 87,619 35,242 25.9081960 3,727 2,511 93,289 37,151 26.2231961 3,790 2,546 101,494 39,859 26.9041962 3,852 2,582 108,828 42,156 27.8641963 3,915 2,617 114,578 43,786 28.8821964 3,977 2,652 122,438 46,169 29.7421965 4,040 2,687 127,209 47,339 30.8241966 4,102 2,722 130,534 47,948 32.3571967 4,165 2,758 133,842 48,535 33.594
no statistics
50.1
49.3
56.6
64 3
48.8
37.7
39.0
47.4
13.1
13.3
32.5
53.0
62.6
54.2
42.7
47.5
1,285.2
1,299.1
1,530.6
1 784 0
1,146.7
905.3
955.9
1,185.4
1,366.5
1,203.0
963.1
1,092.0
264.1
271.5
677.2
1,139.5
Adult population Personal Income
Table 1: Reference Totals for Population, Income, and Inflation in Switzerland, 1901-2002Tax years and tax returns

1968 4,228 2,793 140,118 50,170 34.5161969 4,290 2,828 148,192 52,400 35.3261970 4,353 2,863 158,323 55,294 36.7341971 4,381 2,890 169,477 58,650 39.0171972 4,409 2,916 178,891 61,348 41.6561973 4,437 2,942 178,997 60,835 45.7031974 4,465 2,969 180,570 60,825 49.8161975 4,493 2,995 172,611 57,632 52.7141976 4,521 3,021 172,890 57,222 53.7981977 4,549 3,048 178,523 58,575 54.4471978 4,577 3,074 183,150 59,579 54.9741979 4,605 3,100 184,980 59,662 56.6661980 4,633 3,127 188,947 60,428 59.3411981 4,699 3,181 192,181 60,424 62.8351982 4,766 3,234 192,601 59,550 66.5741983 4,832 3,288 195,565 59,478 68.7521984 4,899 3,342 201,526 60,306 70.6761985 4,965 3,395 198,472 58,452 73.0571986 5,032 3,449 207,395 60,129 73.5931987 5,098 3,503 209,033 59,674 74.8091988 5,164 3,557 218,325 61,385 76.1201989 5,231 3,610 222,919 61,744 78.8951990 5,297 3,664 228,669 62,408 82.9781991 5,322 3,685 231,186 62,739 87.5331992 5,346 3,706 226,798 61,202 91.0881993 5,370 3,727 225,319 60,464 93.7431994 5,394 3,747 227,158 60,619 94.8991995 5,419 3,768 216,562 57,472 96.3841996 5,443 3,789 217,253 57,339 97.4651997 5,467 3,810 226,274 59,394 97.9721998 5,491 3,831 232,159 60,608 98.0051999 5,515 3,851 236,379 61,376 98.7832000 5,540 3,872 247,376 63,886 100.3412001 239,564 101.3672002 237,895 101.951
Notes: All details in the text. Tax units defined as adult individuals (aged 20+) less half of married individuals.Population, adults, married individuals from decenal census from Annuaire Statistique de la Suisse, 1993 (p. 47) and linear interpolation.Year 2000 from http://www.statistik.admin.ch/stat_ch/ber01/fufr01.htmColumn (3) reports the number of tax returns for the Federal Income Tax and column (4) the fraction of filers. Starting in 1934, each tax year corresponds to two calendar year. For tax period 1934/35, income taxation is based on average income earned in 1934 and 1935, etc. Total income computed as total income on tax returns before deductions (Revenu Net) plus 20% of average income imputed to non-filers for period 1971-on. From 1929-1970, total income defined as 75% of net National Income.Total income in 1901-1920 imputed from Madison series on GDP per capita (pasted to 1929, 75% of National Income).Consumer Price Index from globalfindata.com (1) (average of maximum and mininum value for each year).
93.5
90.0
Transition to annual system
90.8
88.2
88.7
88.6
83.1
85.6
87.0
87.6
63.9
70.2
77.4
80.5
64.3
3,495.4
3,401.9
3,106.1
3,112.5
3,227.1
3,272.6
2,542.3
2,665.6
2,790.1
2,904.5
1,817.7
2,036.9
2,288.2
2,420.6
1,784.0

Consumer Number of Total Real Real Income % Tax UnitsPrice Tax Units Income per tax unit Covered 10% 5% 1% 0.5% 0.10% 0.01% 10-5% 5-1% 1-0.5% 0.5-0.1% 0.1-0.01% 0.01% top 1% within top 0.1% withinIndex ('000s) (millions Fr.) (2000 Fr.) in statistics top 10% top 1%(1) (2) (3) (4) (5) (6) (7) (8) (9) (10) (11) (12) (13) (14) (15) (16) (17) (18) (19)
1933 13.787 1,986 42,638 21,475 13.7 31.16 21.92 9.98 7.19 3.27 0.94 9.24 11.94 2.79 3.92 2.33 0.94 32.02 32.741934-35 13.573 2,008 42,515 21,169 13.2 30.92 21.59 9.69 6.94 3.14 0.91 9.33 11.90 2.75 3.80 2.23 0.91 31.34 32.441936-37 13.662 2,039 43,984 21,573 13.3 30.47 21.46 9.94 7.21 3.35 0.98 9.01 11.52 2.73 3.86 2.37 0.98 32.61 33.711939-40 14.519 2,085 46,212 22,169 32.5 32.94 23.77 11.78 8.78 4.36 1.52 9.17 11.99 3.00 4.42 2.84 1.52 35.77 36.991943-44 21.216 2,150 43,494 20,227 53.0 32.59 22.70 10.54 7.67 3.71 1.43 9.89 12.17 2.87 3.96 2.29 1.43 32.32 35.221945-46 21.796 2,185 48,404 22,157 62.6 33.24 23.36 10.49 7.50 3.44 1.10 9.89 12.87 2.98 4.06 2.34 1.10 31.54 32.831947-48 22.752 2,219 55,507 25,015 54.2 31.58 21.95 10.01 7.15 3.26 1.03 9.63 11.94 2.86 3.89 2.23 1.03 31.70 32.571949-50 23.199 2,253 54,808 24,324 42.7 32.29 22.22 9.99 7.13 3.23 0.96 10.07 12.23 2.85 3.90 2.27 0.96 30.93 32.371951-52 23.887 2,299 61,448 26,726 47.5 31.29 21.65 9.94 7.18 3.37 1.07 9.64 11.71 2.76 3.81 2.30 1.07 31.77 33.871953-54 24.310 2,349 66,984 28,515 48.8 30.33 21.16 9.80 7.08 3.30 1.05 9.17 11.36 2.73 3.78 2.25 1.05 32.32 33.651955-56 24.740 2,399 75,066 31,291 48.8 29.72 20.92 9.81 7.06 3.24 0.97 8.80 11.11 2.75 3.82 2.28 0.97 32.99 33.071957-58 25.607 2,449 81,297 33,199 38.2 30.99 21.79 10.11 7.24 3.31 1.03 9.20 11.69 2.87 3.93 2.28 1.03 32.61 32.731959-60 25.908 2,499 91,022 36,429 46.5 31.47 22.35 10.54 7.58 3.51 1.09 9.11 11.82 2.95 4.08 2.42 1.09 33.48 33.271961-62 26.904 2,564 107,103 41,773 48.9 31.56 22.70 10.87 7.85 3.62 1.06 8.87 11.83 3.02 4.23 2.56 1.06 34.43 33.281963-64 28.882 2,634 120,331 45,677 48.0 31.72 22.83 10.91 7.88 3.64 1.12 8.90 11.92 3.04 4.24 2.52 1.12 34.39 33.321965-66 30.824 2,705 132,118 48,845 55.7 31.60 22.60 10.67 7.67 3.50 1.05 9.01 11.92 3.00 4.17 2.45 1.05 33.77 32.781967-68 33.593 2,775 138,905 50,051 63.1 32.29 23.01 10.86 7.81 3.58 1.08 9.27 12.15 3.05 4.23 2.50 1.08 33.63 32.961969-70 35.326 2,846 156,414 54,965 62.8 32.70 23.32 11.00 7.92 3.66 1.14 9.38 12.32 3.09 4.26 2.52 1.14 33.65 33.251971-72 39.017 2,903 180,234 62,089 69.0 32.49 23.03 10.81 7.79 3.62 1.14 9.47 12.22 3.02 4.16 2.48 1.14 33.26 33.511973-74 45.703 2,956 187,907 63,578 76.0 30.96 21.51 9.77 6.98 3.20 1.04 9.45 11.75 2.79 3.78 2.16 1.04 31.55 32.751975-76 52.714 3,008 174,529 58,017 78.9 30.29 20.47 8.79 6.15 2.68 0.83 9.82 11.68 2.64 3.47 1.85 0.83 29.01 30.491977-78 54.447 3,061 181,723 59,369 81.4 29.93 20.12 8.49 5.90 2.56 0.79 9.80 11.63 2.59 3.34 1.77 0.79 28.38 30.131979-80 56.666 3,114 191,423 61,479 83.6 29.89 20.06 8.40 5.82 2.51 0.76 9.83 11.66 2.58 3.31 1.75 0.76 28.09 29.881981-82 62.835 3,207 198,122 61,770 86.9 29.87 20.02 8.40 5.85 2.58 0.84 9.85 11.62 2.55 3.27 1.75 0.84 28.12 30.731983-84 68.752 3,315 201,365 60,746 87.5 29.88 20.00 8.39 5.85 2.62 0.86 9.88 11.61 2.54 3.23 1.76 0.86 28.07 31.251985-86 73.057 3,422 203,694 59,519 90.7 30.35 20.64 9.05 6.48 3.16 1.25 9.72 11.59 2.57 3.32 1.91 1.25 29.82 34.911987-88 74.809 3,530 215,591 61,078 88.1 30.78 20.93 9.07 6.41 2.94 0.96 9.85 11.86 2.67 3.47 1.97 0.96 29.47 32.391989-90 78.895 3,637 231,711 63,705 88.6 30.78 20.96 9.22 6.59 3.15 1.15 9.81 11.74 2.63 3.44 2.01 1.15 29.95 34.201991-92 87.533 3,695 233,597 63,215 86.4 29.99 20.14 8.60 6.09 2.85 1.00 9.85 11.54 2.51 3.24 1.85 1.00 28.68 33.181993-94 93.743 3,737 227,639 60,916 90.8 29.65 19.87 8.48 6.01 2.82 0.98 9.78 11.39 2.47 3.19 1.84 0.98 28.61 33.271995-96 96.384 3,779 218,126 57,728 84.0 29.22 19.27 8.03 5.67 2.67 0.87 9.95 11.24 2.36 3.00 1.80 0.87 27.47 33.23
Notes: Computations by authors based on wealth tax return statistics. See text for details.Consumer Price Index from globalfindata.com (mean from Table 1 over corresponding years). Total income based on means from Table 1.Percentage of tax units covered by tax statistics reported on column (5).Columns (6) to (17) display the top of total income accruing to each upper income group for corresponding years.Top 0.1% and above estimates for years 1993-94, 1995-96 not precise because top bracket contains more than 1% of tax units.
Shares within shares
Table 2: Top Income Shares in Switzerland, 1933-1995/96
Top groups shares Intermediate groups sharesAggregate Series

Consumer Total Real Real wealth Tax returns % WealthPrice Wealth per family with postive wealth Covered 10% 5% 1% 0.5% 0.10% 0.01% 10-5% 5-1% 1-0.5% 0.5-0.1% 0.1-0.01% 0.01%Index (millions Fr.) (2000 Fr.) / total tax units in statistics(1) (2) (3) (4) (5) (6) (7) (8) (9) (10) (11) (12) (13) (14) (15) (16) (17)
1913 10.660 123,457 75,264 40.72 100.0 84.81 73.57 46.65 37.15 19.13 5.43 11.24 26.92 9.50 18.03 13.70 5.431915 11.845 138,587 83,028 16.57 90.6 80.46 68.62 42.25 33.56 17.68 5.50 11.84 26.37 8.69 15.89 12.18 5.501919 23.351 77,263 44,743 53.84 100.0 76.25 62.29 36.42 28.33 14.25 4.12 13.96 25.88 8.08 14.09 10.13 4.121921 22.538 90,548 51,415 16.59 85.8 77.02 63.98 38.05 29.44 14.56 4.26 13.04 25.93 8.61 14.88 10.29 4.261925 17.732 116,670 63,388 16.07 87.3 75.83 64.55 40.68 32.48 16.49 5.09 11.28 23.87 8.19 15.99 11.41 5.091929 16.854 133,760 69,667 15.07 88.3 76.71 66.50 41.95 32.93 17.14 5.96 10.20 24.56 9.02 15.79 11.18 5.961934 13.698 147,470 73,707 3.85 62.7 67.96 40.43 31.16 15.49 4.57 27.53 9.27 15.67 10.92 4.571936 13.552 142,804 70,305 3.67 61.8 68.14 40.10 30.81 15.24 4.42 28.04 9.29 15.56 10.82 4.421938 14.399 136,655 66,284 3.79 62.4 73.30 44.43 34.57 17.54 5.20 28.87 9.86 17.02 12.35 5.201940 15.067 156,472 74,791 42.05 100.0 80.84 67.58 40.39 31.20 15.73 4.82 13.26 27.19 9.19 15.47 10.91 4.821941 17.021 130,795 62,066 15.92 89.3 81.91 69.31 41.45 31.85 15.90 5.22 12.61 27.85 9.61 15.95 10.68 5.221945 21.786 145,357 66,800 22.43 93.3 78.25 64.31 37.14 28.40 14.35 4.92 13.94 27.17 8.74 14.05 9.44 4.921947 22.183 153,294 69,353 22.74 93.5 79.04 65.38 38.30 29.47 15.08 5.49 13.66 27.08 8.83 14.39 9.59 5.491949 23.378 155,046 69,072 23.66 94.0 78.77 65.06 37.82 29.10 14.99 5.22 13.71 27.23 8.73 14.11 9.77 5.221951 23.263 157,976 69,082 10.59 80.9 79.89 66.22 38.97 30.16 15.65 5.47 13.67 27.25 8.80 14.52 10.18 5.471953 24.353 164,779 70,520 10.89 81.4 79.85 66.63 39.99 31.23 16.46 5.78 13.22 26.64 8.76 14.77 10.68 5.781955 24.711 182,995 76,680 11.37 82.2 79.94 67.32 41.50 32.67 17.50 6.16 12.62 25.82 8.83 15.17 11.33 6.161957 25.385 202,305 83,037 12.46 83.8 79.90 67.35 41.85 33.05 17.89 6.36 12.55 25.50 8.80 15.16 11.52 6.361969 35.002 389,835 137,844 54.45 100.0 78.91 66.71 41.56 32.79 17.92 6.66 12.21 25.15 8.77 14.87 11.26 6.661981 61.142 508,318 159,822 66.99 100.0 69.58 56.63 33.04 25.56 13.45 5.18 12.96 23.59 7.48 12.11 8.27 5.181991 85.553 619,626 168,153 68.72 100.0 69.94 56.58 33.57 26.51 14.93 6.48 13.36 23.01 7.05 11.58 8.46 6.481997 97.980 765,423 200,913 70.23 100.0 71.31 57.98 34.80 27.64 15.98 7.29 13.33 23.19 7.16 11.66 8.69 7.29
Notes: Computations by authors based on wealth tax return statistics. See text for details.Number of tax units define fractiles same as in Table 1.Wealth tax assessed on total family net worth (wealth - liabilities) as of January 1st of each tax year.Consumer Price Index from globalfindata.com (as of January 1st of corresponding years). Total real wealth extrapolated using years with complete coverage.Column (4) reports the ratio of the number of tax returns with positive wealth to the total number of tax units (including non-filers).The percentage of total personal net worth in the economy covered by tax statistics reported on column (5) (estimated using years with 100% wealth coverage)Columns (6) to (17) display the top of total net-worth accruing to each upper wealth group on January 1st of each year.Top 0.01% estimates for years 1981, 1991, and 1997 not precise because top bracket contains more than 0.1% of tax units.
Table 3: Top Wealth Shares in Switzerland, 1913-1997
Top groups shares Intermediate groups sharesAggregate Wealth

number of FractionSpecial Special 10% 5% 1% 0.5% 0.10% 0.01% 10-5% 5-1% 1-0.5% 0.5-0.1% 0.1-0.01% 0.01%
taxpayers (percent)(1) (2) (5) (6) (7) (8) (9) (10) (11) (12) (13) (14) (15) (16)
1949-50 4,644 0.211951-52 5,234 0.231953-54 6,427 0.271955-56 6,964 0.291957-58 8,187 0.33 2.34 3.01 4.61 5.26 6.41 8.11 0.64 1.54 2.93 4.27 5.64 8.111959-60 10,231 0.41 2.42 3.08 4.7 5.23 6.52 9.65 0.69 1.56 3.31 4.1 5.11 9.651961-62 13,235 0.52 2.54 3.18 4.61 4.97 5.79 8.06 0.8 1.81 3.65 4.26 4.85 8.061963-64 15,569 0.59 2.91 3.61 5.21 5.54 6.63 9.38 0.98 2.06 4.33 4.59 5.4 9.381965-66 20,722 0.77 3.28 4.08 5.93 6.36 7.66 8.85 1.14 2.34 4.81 5.25 7.15 8.851967-68 25,630 0.92 3.73 4.56 6.28 6.6 8.3 11.5 1.55 2.95 5.45 5.14 6.91 11.51969-70 33,679 1.18 4.44 5.43 7.47 8.08 10.32 12.78 1.86 3.54 5.88 6.13 9.2 12.781971-72 44,359 1.53 4.85 5.94 8.13 8.94 11.95 14.19 2.2 4.00 6.04 6.32 10.92 14.191973-74 55,235 1.87 5.23 6.49 9.21 10.28 13.25 15.64 2.36 4.23 6.54 7.76 12.09 15.641975-76 64,950 2.16 5.4 6.86 10.19 11.41 15.15 20.38 2.36 4.36 7.35 8.52 12.81 20.381977-78 70,449 2.30 5.18 6.59 9.85 11.1 14.51 19.52 2.29 4.21 7.01 8.49 12.28 19.521979-80 81,731 2.62 5.57 7.08 10.58 12.08 16.42 22.03 2.49 4.56 7.2 8.79 13.98 22.031981-82 94,279 2.94 5.86 7.5 11.18 12.69 16.58 19.8 2.53 4.84 7.72 9.62 15.04 19.81983-84 94,615 2.85 5.56 7.08 10.89 12.55 16.46 20.1 2.48 4.33 7.06 9.38 14.69 20.11985-86 93,517 2.73 5.89 7.48 11.45 13.21 17.13 19.9 2.51 4.38 7.01 9.48 15.31 19.91987-88 71,160 2.02 4.1 5.33 8.46 9.84 12.86 14.41 1.49 2.94 5.14 7.28 12.1 14.411989-90 81,983 2.25 5.99 7.69 11.75 13.48 16.9 18.39 2.36 4.5 7.41 10.34 16.05 18.391991-92 88,072 2.38 6.35 8.18 12.35 14.11 18.06 20.07 2.61 5.07 8.08 10.63 16.98 20.071993-941995-96
Notes: Computations by authors based on wealth tax return statistics. See text for details.Table displays the fraction of taxpayers residents with income abroad and non-residents with income in Switzerland (called special cases, others in statistics).Column (1) report the total number of special cases (others) and column (2) the fraction of special cases (others) (relative to all tax units, col. (2) in Table 2).Columns (3) to (13) report the fraction of special cases (others) (income weighted) in all top income groups.Information not available after 1991/92.
Table 4: Fraction of non-residents and residents with income abroad in top income groups in Switzerland, 1949/50-1991/92
Fraction Special in Top groups Fraction Special in intermediate groups Aggregate Series

Total capitalTotal in As a % of Swiss Swiss Foreigners Advance income
Period (millions of total personal Corporations Individual tax never with no advance top 1% top 0.1% top 0.01%(2000 CH Fr.) income Residents refunded tax refund
(from Table 1) (mn 2000 CH Fr.)(1) (2) (3) (4) (5) (6) (9) (10) (11) (12)
1950-9 6,516 9.18 40.40 38.11 1.11 20.37 1,327 4.1 15.1 57.81960-9 13,347 10.94 41.61 36.89 2.66 18.83 2,514 4.3 17.4 68.91970-9 28,070 15.96 43.07 35.58 4.80 16.55 4,644 7.1 28.8 110.21980-9 40,464 19.96 50.12 29.17 8.55 12.16 4,919 7.3 29.8 114.61990-8 66,588 29.50 53.47 25.72 12.02 8.80 5,860 7.7 30.0 108.8
1999-02 85,826 35.72 57.40 13.62 20.53 8.46 7,258
Source: Recettes fiscales de la Confédération 2002 (Administration fédérale des contributions, Division Statistique fiscale et documentation, Berne, avril 2003)Column (1) displays the average annual real value of capital income earned through Swiss financial institutions (all subject to 35% withholding advance tax, except minor exemptions). Column (2) shows the amount as a percentage of personal income in Switzerland from Table 1, column (5).Columns (3) to (5) show the fraction of capital income earned by Swiss corporations (personnes morales), Swiss individual residents (personnes physiques), and non-residentsbased on refunds of the advance tax.Column (6) displays the fraction of capital income whose advance tax is never refunded and hence presumably evaded.Column (7) shows the average annual real amount of capital income (in 2000 million of Swiss Francs) whose tax is not refunded (col. (6) times col. (1)). This is an upper bound of capital income evaded by non-residents through Swiss accounts.Columns (7) to (9) show by what percentage would the top 1%, 0.1%, and 0.01% income shares in France would be increased if all the capital income whose advance tax is never refunded was allocated fully to those top income groups.
Table 5: Capital Income earned through Swiss accounts and tax evasion
Capital Income
Based on advance tax refunds
Percent of capital income accruing to
As a percent of top income groups in France