the increased concentration of wealth in paris 1807 …jlr/papers/ppvr2.pdf · the increased...
TRANSCRIPT

The increased concentration of wealth in Paris 1807-1912 Of Revolution and Demography
Thomas Piketty (EHESS, PSE), Gilles Postel Vinay (EHESS, INRA-LEA) Jean-Laurent Rosenthal (CalTech, PSE)
The authors gratefully acknowledge the support of NSF grant SES 0452081, and thank the
Archives de Paris for their generous access to the documents. Without the unstinting efforts
of Maria Chichtchenkova, Alena Lapatniova, and Asli Sumer these data could not have been
collected. We have benefited from the kind questions of seminar participants at Mannheim
University.
1
Introduction.
In Pikety et al. 2006 we noted that in the period of increasing inequality that runs at
least from 1807 to 1914, wealth came to be increasingly concentrated among the elderly and
that women’s share of all wealth increased over time. We return to these questions with an
augmented data set to examine the links between age, gender, and wealth at death in greater
detail. In doing so we revisit the impact of shocks on wealth inequality and show that the
Revolution sent ripples through the wealth distribution that only died out in the 1840s. We
also provide an estimate of the impact of changes in demography on the changes in wealth
inequality.
Paris even in 1807 was an extremely uneven society: three out of every four adults
did not leave a bequest and the richest 1% of the population held at least half of all assets.
The share of individuals who died poor remained almost constant through World War I
while the share of the top 1% increased to nearly three quarters. The Parisian pattern of
change over time is found in the rest of France though in a much more moderate fashion.
Moreover, Paris’ contribution to the evolution of the country’s wealth inequality was
substantial since it would come to account for about a quarter of the value of all estates in
France. Paris is important in other ways since it was at the forefront of both financial and
demographic changes.
There are multiple interpretations to the very large increase in inequality in Paris and
France. On one level, there is a literature that sees high levels of inequality as bad for
growth because it reduces the number of individuals rich enough to become entrepreneurs,
hence a very unequal society may be quite rich but it will be stagnant because most of the
talented are shut out of business opportunities (e.g. Gruner 2003, Piketty 1997). By this
light, large wealth shares for women and the elderly were bad for growth because they were
extremely unlikely to be entrepreneurs. A counter argument however would point out that
the talented have options other than entrepreneurship to deploy their talents. In particular,
they can combine their skills with the capital of the rich by becoming employees in existing
firms. Because large firms can reach many consumers, the talented may contribute more to
society by becoming employees than by starting their own firm. This view would
emphasize that the period where inequality increased was precisely the one when large
industrial and service firms became important in the French economy. The problem then
with high levels of wealth inequality is that it tends to reduce investment in human capital
2
(e.g. Benabou 2002). This for two reasons; first most of the population will be wealth
constrained when deciding their children’s education; second persistently high wealth
inequality implies a low wealth taxation and thus closes off the remedy of public education.
At this stage it is too early to evaluate the efficiency consequences of the changes in
inequality, rather we turn to examining the causes behind the changes. While this endeavor
is more modest, it is a necessary step to building an appropriate theory of the impact of
changes in inequality on economic performance. Indeed, to the extent that the levels of
inequality observed after 1860 were just a return to the state of affairs prior to the French
Revolution, then the case for greater redistribution to increase entrepreneurship would be
strengthened. We tend to view the very wealthy of the late eighteenth century as aristocrats
content to manage their landed estates and protect a political system where they benefited
from royal largesse rather than as transformative entrepreneurs. To the extent that the
process of wealth concentration was recreating a group of conservative plutocrats, then the
rising concentration would have little value to the economy. On the other hand, if the
growth in concentration was intimately connected to the growth of large scale firms and
with social mobility, then it would have some social value and the case for redistribution
would have to go through a human capital channel.
To use wealth at death data to answer these questions presupposes we must master
two difficulties. The first is that individuals only die once, a fact that makes it difficult to
address concerns with unobserved heterogeneity at the individual levels. There are very
good reasons to believe that many critical variables (talent, taste for children, and patience)
are not identical across all individuals in a population. That is particularly true for a city as
heterogeneous as Paris. The second problem is that the wealth one observes at a given
period is the result of accumulation over a number of prior decades and thus cross sectional
analyses that seem adequate for income provide very one sided pictures of the process of
wealth accumulation.
Given our interest in long term changes in inequality and wealth accumulation
processes we can sidestep issues of unobserved heterogeneity given that we are interested in
understanding why the wealth accumulation of one generation may have been different from
that of its grand parents. Recent work (Clark and Hamilton, 2006; Botticini and Eckstein
2005) has emphasized changes in cultural values to explain changes in wealth accumulation.
While these hypotheses are appealing, they remain extremely difficult to validate
3
empirically. In our case we will take such cultural changes as residual and focus on
observable changes in age and wealth at death.
The second question can be addressed provided that we consider wealth at death data
both for what they can tell us in cross section and what they can tell us about the fate of
birth cohorts. Doing so however requires an attention to the long term. Consider cohort of
individuals born between 1810 and 1819, its life expectancy at age 20 was about 35. Hence
one might imagine understanding its wealth at death by examining a cross section of data
around 1850. That cross section however contains relatively few individuals born in the
1810s but rather a collection of adults who where born as recently as 1830 and as long ago
as the 1760s. To capture the experience of that birth cohort requires collecting data from the
1830s all the way to the 1900s when that cohorts last members died in their 90s.
To tackle this problem, we have returned to the sources described in Piketty et al
2006, added new cross sections and more detail to the ones we had already collected. Thus
this paper reports findings based on data sets drawn from complete enumeration of
individuals who died with some wealth in Paris in every year ending in a 2 or 7 from 1807
to 1867 and 1877, 1887, 1902 and 1912. The data sets thus contain information on more
124,000 individuals. At the minimum we have their gender, age, moveable and real wealth.
Continuing with the procedure we put in place earlier we also have residence, occupation,
marital status and to whom the estate devolved for the individuals who accounted for at least
92% of the value of estates in each cross section. To these data, drawn from fiscal sources
we have added data drawn from the Annuaire Statistique de la Ville de Paris that provide
the total number of death by age and gender for all the relevant years after 1824.1 These
allow us to assign age and gender to all the individuals who died without leaving an estate.
Using these data this paper provides greater detail on the relationships between age,
gender, and wealth. Part 1documents the surprising links between life expectancy and
wealth accumulation and the dramatic improvement in life expectancy of the very rich. Part
2 returns to the issues we raised in Piketty et al 2006 and shows that in cross section
women’s wealth at death was generally less correlated with age, but that over time their age-
wealth patterns came to look more and more like men. Further using information about
asset values, we show that shocks generally dampened the age wealth relationship. Part 3 is
devoted to cohort analysis. There we document the dramatic and permanent effect of the
French Revolution on cohorts born prior to 1770. Indeed our analysis suggests that the years 1 For the cross sections of 1807 to 1822 we relied on the 1824 age by gender totals.

4
that these cohorts spent accumulating prior to 1799 (when the Revolution’s worst turmoil
ended) were either wasted or consumed. In part 4 we propose two decompositions of the
changes in inequality between demographic and economic sources that take advantage of
the fact that there seems to have been no changes in the age at death of 98% of the
population despite very large gains in wealth at death.
Part 1: Growing Rich and Old
Although we made every effort to attach an age to each individual with wealth we
were successful only in about 75% of the cases. Rather than try to attach an age to
individuals based on wealth; residence, or marital status, we opted to amputate each and
gender group by the same fraction. For example 1842 has ages reported for 79.8% of ages
among the rich. We found 146 women aged from 40 through 44. From the Annuaire
Statistique de Paris we know that 13400 individuals died in Paris that year of which 621
were women aged from 40 through 44. We then reduce that total to 516 (621*0.83) and find
the total number of women aged from 40 through 44 who died poor to be 516-146=370, and
add the required rows to the data base.2 This leaves us with 261,000 individuals and
104,000 individuals with wealth at death.
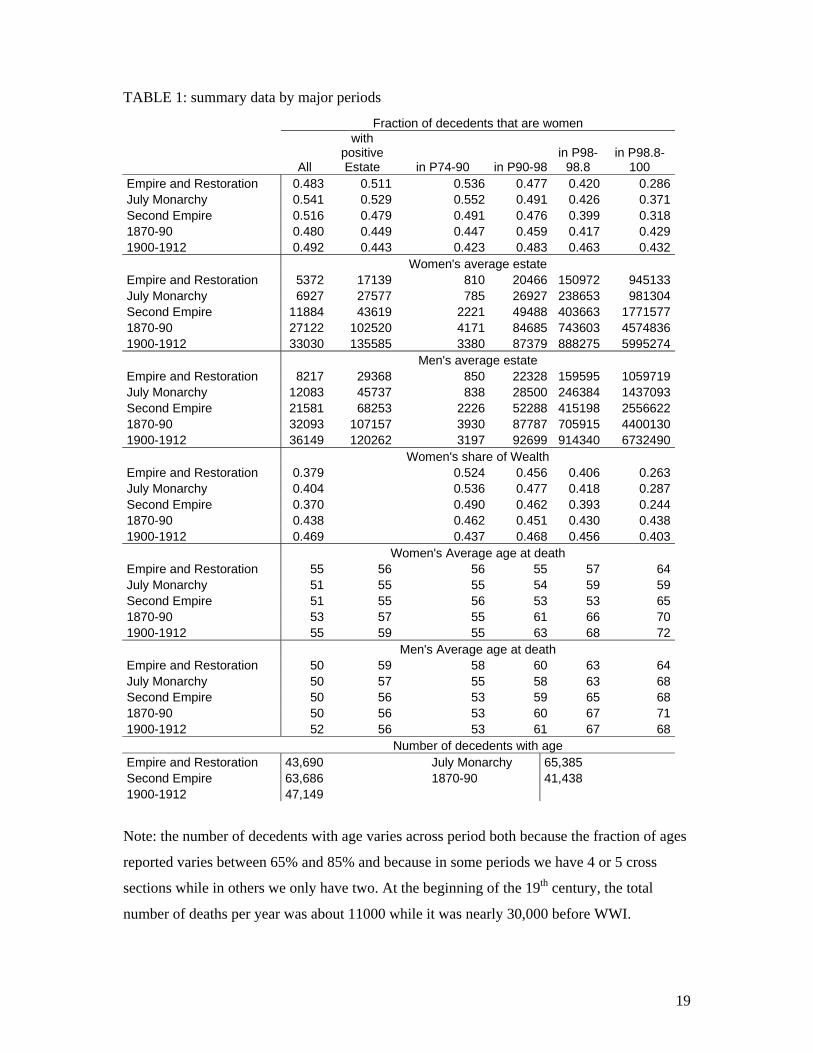
These data show that average value of wealth at death grew considerably between
1807 and 1912 (Table 1). The average estate rose from 6800 francs in 1810s and 1820s to
more than 34500 franc at the beginning of the twentieth century. This progress was
extremely unevenly distributed because the fraction of individuals leaving no estate
remained nearly constant: for the first 80 years of our study it was almost always more than
70% and rarely more than 74%, after 1902 when can rely both on self reported age in the
estate tax declarations and on the ages inscribed in the treasury’ nominal registry this allows
us to recover ages for more than 80% of decedents. Second while the positive estate below
the 98 percentile of the wealth distribution were multiplied by about 4, those in the top 2%
grew by a factor of 6 and those in the top two tenth of one percent by a factor of 6.3
When we consider the gender composition of decedents women typically make up
slightly less than half of those who died—a fact that is not surprising since Paris’
population, like that of other economies receiving immigrants had more men than women.
Further women were on average poorer than men when they died as their share of decedents
2 For gender we are only missing a few dozen observations.
5
was smaller in higher fractiles of the distribution than in lower ones. One of the big changes
over time concerns the increasing presence of women in top two tenths of one percent of the
distribution. While they made up on 3 in 10 of the super rich in the early years of the
nineteenth century, they would make up 43% of that group on the eve of WWI. As a
consequence while women’s wealth had been more evenly distributed than men, by the end
of the period the differences are small. The top 2% of women held 63.5% of female
resources in the early period while at the end they held 77.6%, by contrast the top 2% of
men had only increased their share of male wealth from 72 to 79%. By the dawn of the
twentieth century, Parisian women looked more like their male counterparts than ever
before. One consequence of this evolution was that women’s share of wealth increased over
time from 38% to 47%, that most of this gain was due to the growing number of women
among the super rich.
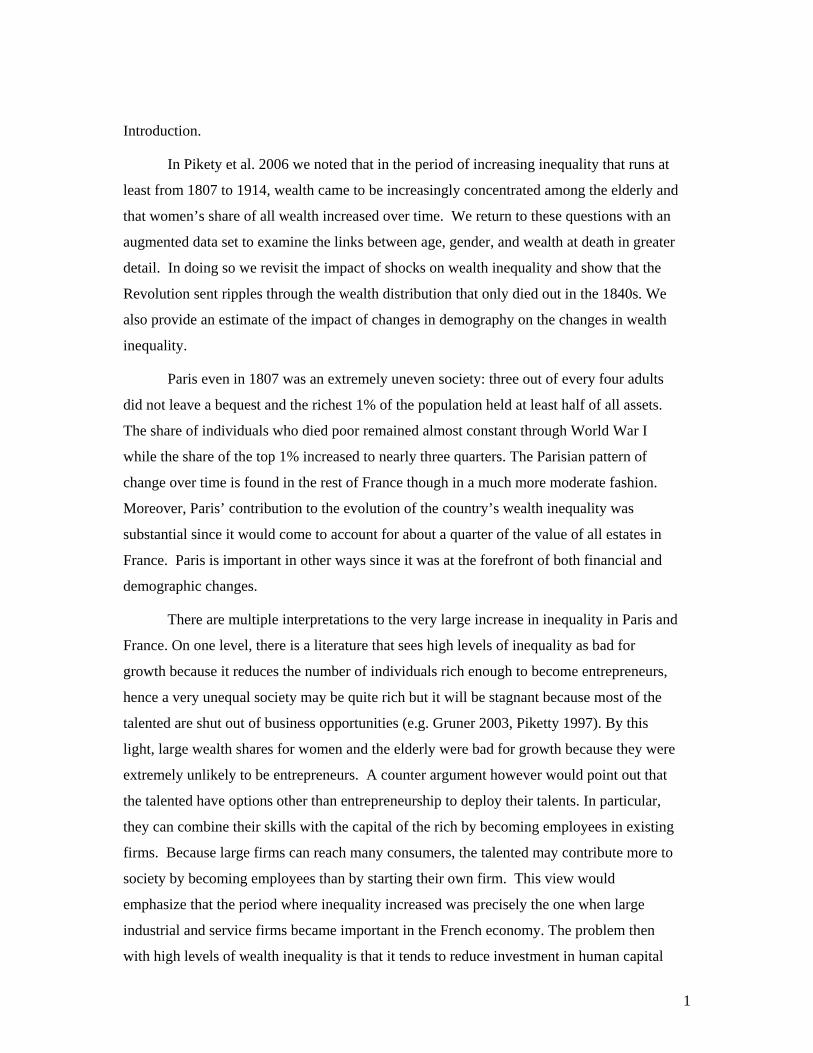
At the heart of this paper lies the question of age at death, and here the aggregate
data show remarkably little movement (Figure 1 and Table 1). People died fractionally older
in the early twentieth century (53.5) than a century earlier (52.5). If we consider the
individuals who died with no bequest, they experience some gain (from 50.1 to 52.25) while
those who died wealthy actually experienced a decline (from 58 to 57.25). Given the
uncertainties associated with measuring age, it seems prudent to consider these averages as
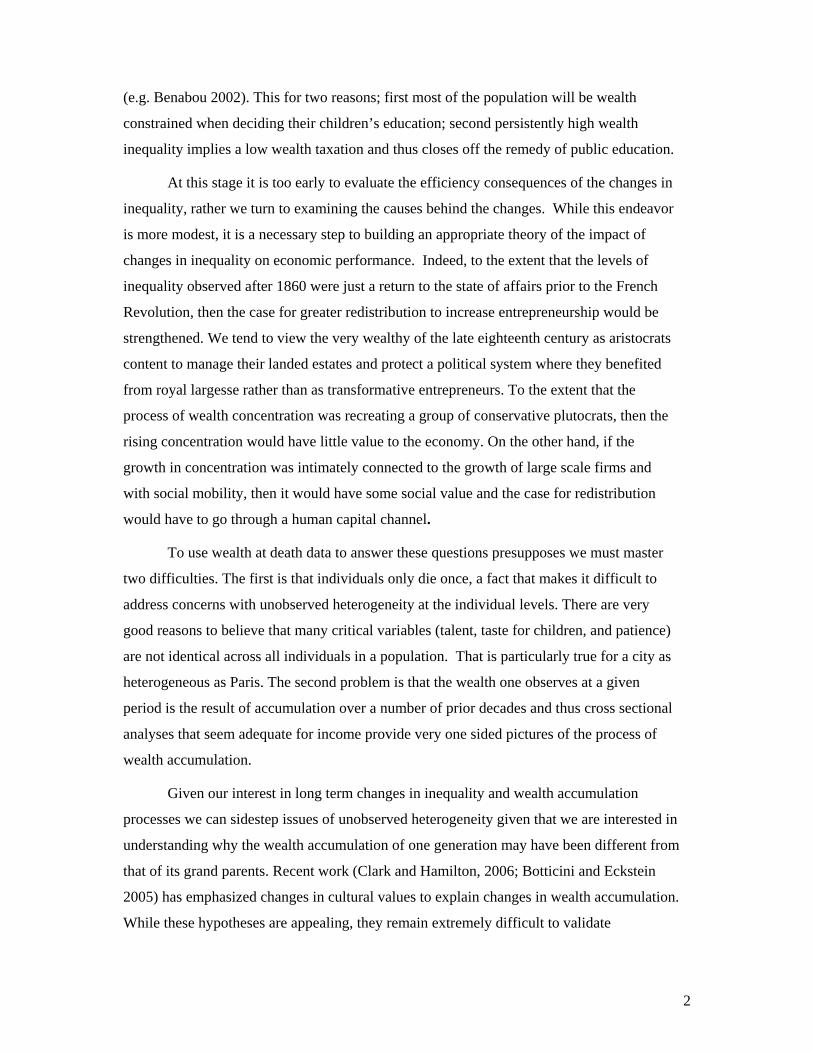
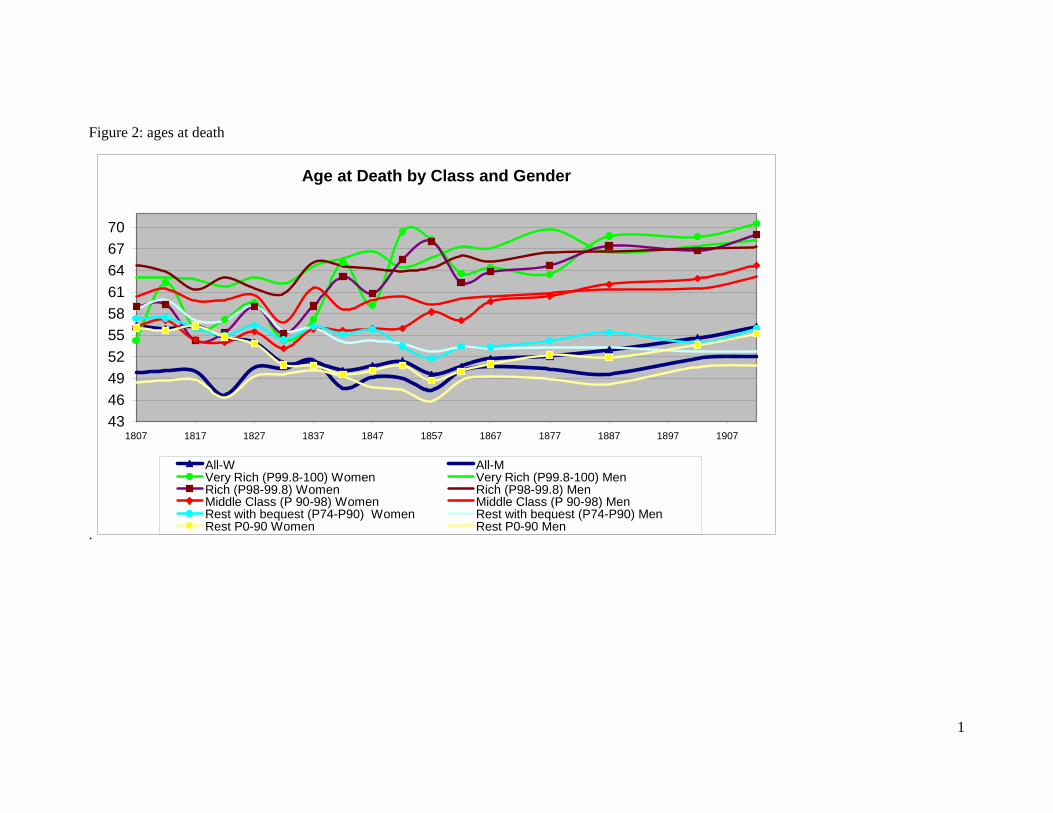
not suggesting much change at all. This is not the case when we break the data up by
gender and wealth class. Men on the whole did experience little gain save for the top 2% of
the distribution. This group lived out its poorer peers by more than a decade and the gap
increased over time as their life expectancy at 20 jumped from 63 to 67. Women died on
average younger and seem to have experienced a significant increase in life expectancy.
Again their gains are concentrated in the up tail of the wealth distribution. Rich women
(P90-98) died in their mid 50s in the first part of the 19th century and in their early 60s by
the start of the 20th century. Being in the top 2% afforded both an older age at death early
on and a large increase in age at death (from 58 to 68) over time (Figure 2).
These summary statistics offer suggestive evidence that age and wealth at death were
related. Yet there are two possibilities to consider. The first is that wealth bought life. The
second is that a long life gave individuals the time to produce large bequests. Those who
achieved sufficient wealth by their late 40s then lived longer either because they were able
to include life enhancing goods in their consumption, or retire from activities that were
dangerous in some fashion or another. What we can rule out is that sufficient wealth caused
6
individuals to retire to the countryside, because nearly all the people for whom we have age
information died in the bureau where they filed their taxes (in other words they were
Parisian residents when they died).3 Yet one might imagine that with sufficient wealth,
individuals were able to selectively exit the capital (in particular during the summer months
when the disease environment was worse due to increased water borne disease). Further,
rich individuals might have been able to privately provide some key elements of public
health, in particular better quality food, cleaner water and a lowered exposure to disease
through the consumption of residential space. Nevertheless, the extent to which wealth
enhanced longevity has to be limited for, as we noted above, it only applies to individuals
who were extremely wealthy by Parisian standards—the top two percent of the wealth
distribution.
The second channel reverse the causality: longer life gives individuals the time to
accumulate larger bequests. This kind of process is easy to imagine if we consider an
individual who faces no uncertainty. Then at the beginning of adulthood he can consider the
size of the bequest he wants to make in relation to his total human capital (the discounted
sum of his earning and transfers he will receive). As long as there is a positive relationship
between the value of total human capital and the size of the bequest the individual wants to
leave behind, then there will be a positive relationship between bequest and length of life.
This will obviously be true for all individuals who died before they retire, and it will still be
true for those who die retired, provided their consumption does not exceed their earning
from capital. This relatively mechanistic model can lead age to have a big impact on wealth
at death provided that rates of accumulation are large enough (i.e. 3 or 4% a year).
Obviously one needs to consider the fact individuals’ incomes are not constant over
time and thus that there are other motives for savings (life cycle and precautionary). Both of
those motivations would suggest that wealth would be bell shaped as a function of wealth,
peaking just about the time of retirement. Yet when we consider change over time two
opposite forces come into play. First, increases in life expectancy which should lead to
higher levels of wealth (at least over some part of the age wealth profile). Hence we might
expect to find important differences between men and women, because males experience
little change in their life expectancies whereas females did. Second, the increasing
availability of life contingent financial instruments should have lead to a declining
3 It is still possible that we underestimate the middle class’ wealth and life expectancy because in that group success meant retiring to the healthier provinces and those who persisted in Paris beyond a certain age were negatively selected.

7
likelihood of finding individuals with significant positive wealth at death (since their need to
hold assets for precautionary reasons declines). In other words, the bequest motivation
suggests that age wealth profiles should be increasing and that their slope should be related
to expected earnings, while the life cycle motivation would lead wealth profile to become
more bell shaped over time. To examine these questions we turn to regression analysis.
Part 2: Lessons from the Cross Sections
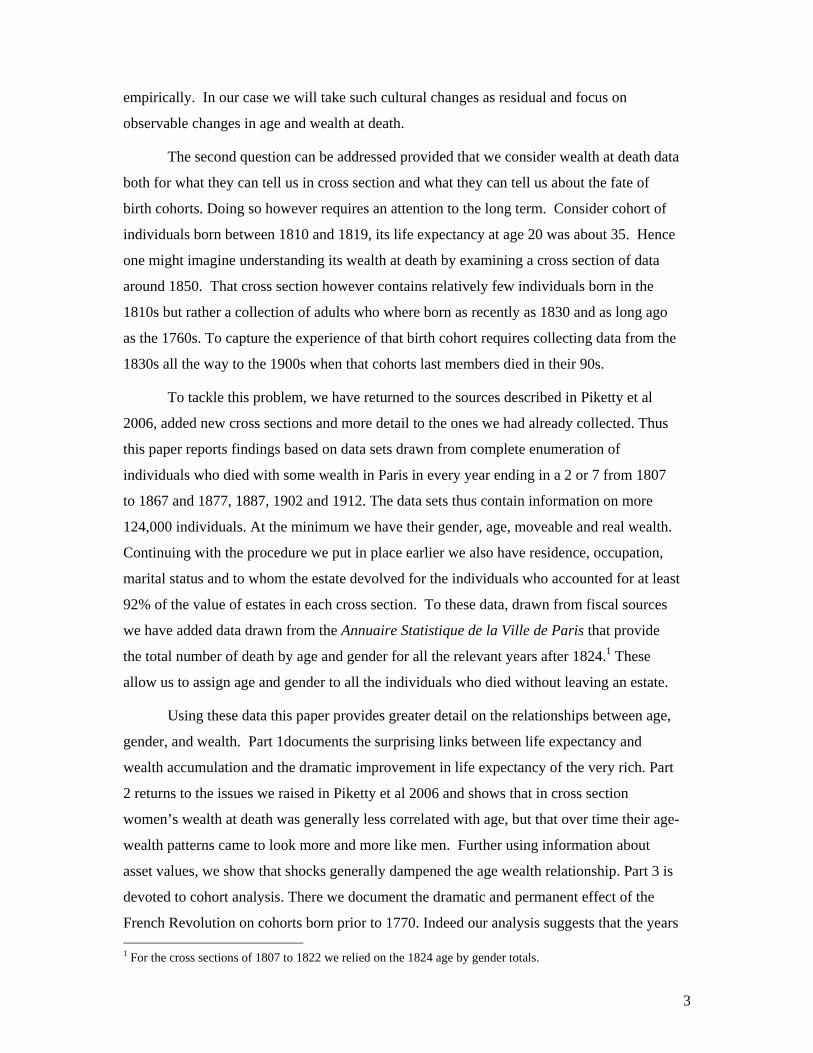
Figure 3 reproduces figures A from Piketty 2006. The shift between a first half of
the nineteenth century when the relationship between age and wealth was weak, and a
second half where it was strong appears dramatic. This shift, which we dated to the 1860s,
coincided with the acceleration of the rate of growth of inequality and the age wealth
relationship was strongest when inequality was at its peak. Yet at the time that article was
written we were rather poor in age information for the critical period namely 1842-1867.
The archival work accomplished since then has filled that gap in our knowledge and
because we now have twice as many cross-sections as before we can perform regression
analysis.
Rather than examine each cross section individually we group them by major
political periods, the Empire and Restoration (1807-27), the July Monarchy (1832-47), the
Second Empire (1852-67), the Early Third Republic (1877 and 1887) and the pre W.W.I.
period (1902 and 1912). While the first period has five cross sections and the last two have
only two, they all have roughly the same number of observation because of the growth of
the city of Paris. For the July Monarchy (1832-47) we run our statistical estimation both
with and without 1832. In that year, Paris experienced its last severe cholera epidemic; the
demographic crisis also had effects on asset prices as the capital’s markets were disturbed
by the death or flight of many of its key players. While the demographic effects were stark
(the number of dead almost doubled that year and was as large as it would be in the late
1860s) the financial shock seems to have been even more severe and assets values were
remarkably low. For the Second Empire (1852-67), we also net out 1857. In that year
France faced a sharp financial downturn linked to the intervention of Napoleon III in Italy,
once again asset prices tumbled. The crisis was severe enough that the Bank of France had
to raise the discount rate for the first time in decades.
8
In all cases we deploy three methods, logit analysis of the likelihood of leaving a
bequest (see Table 2), tobit analysis of the absolute value of wealth including all the
individuals who had no wealth at death (see Table 3), and an OLS analysis of the log of
wealth at death using only the top 26% of the wealth distribution (see Tables 4).4 None of
these approaches is perfect—even for conditional correlations. Indeed the tobit suffers from
the fact that 74% of the data is censored on average, while the logit dependent variable is
binary, finally the OLS suffers from potentially changing selection. Nevertheless it is
reassuring that each of these estimates provides qualitatively the same answer about the
links between age, wealth, and gender.
The logit estimates vary relatively little over time. Overall age becomes less
important over time in predicting whether men die wealthy or not. Women were both more
likely to die wealthy and always less sensitive to age. Finally, the differences between men
and women also decline.
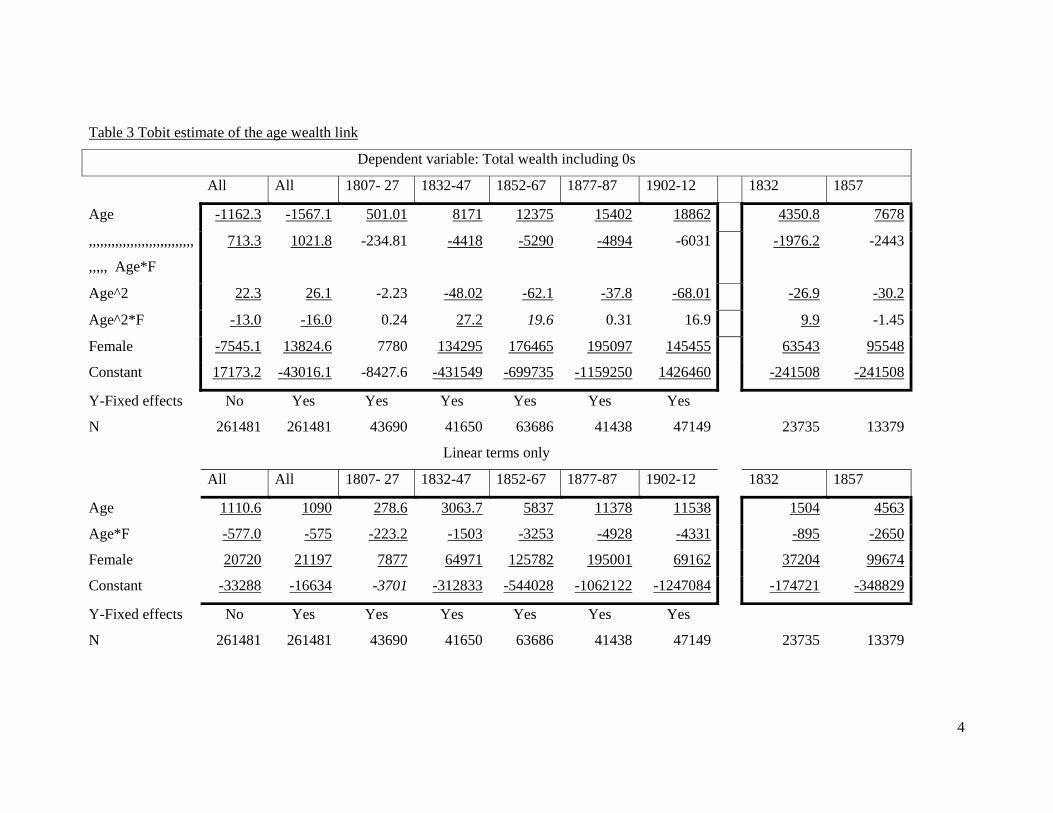
When we consider wealth as a continuous variable four types of results appear
consistently. To begin, the effect of age gets more pronounced in later cross sections. In the
Tobits the coefficient on age doubles while the negative coefficient on the square of age
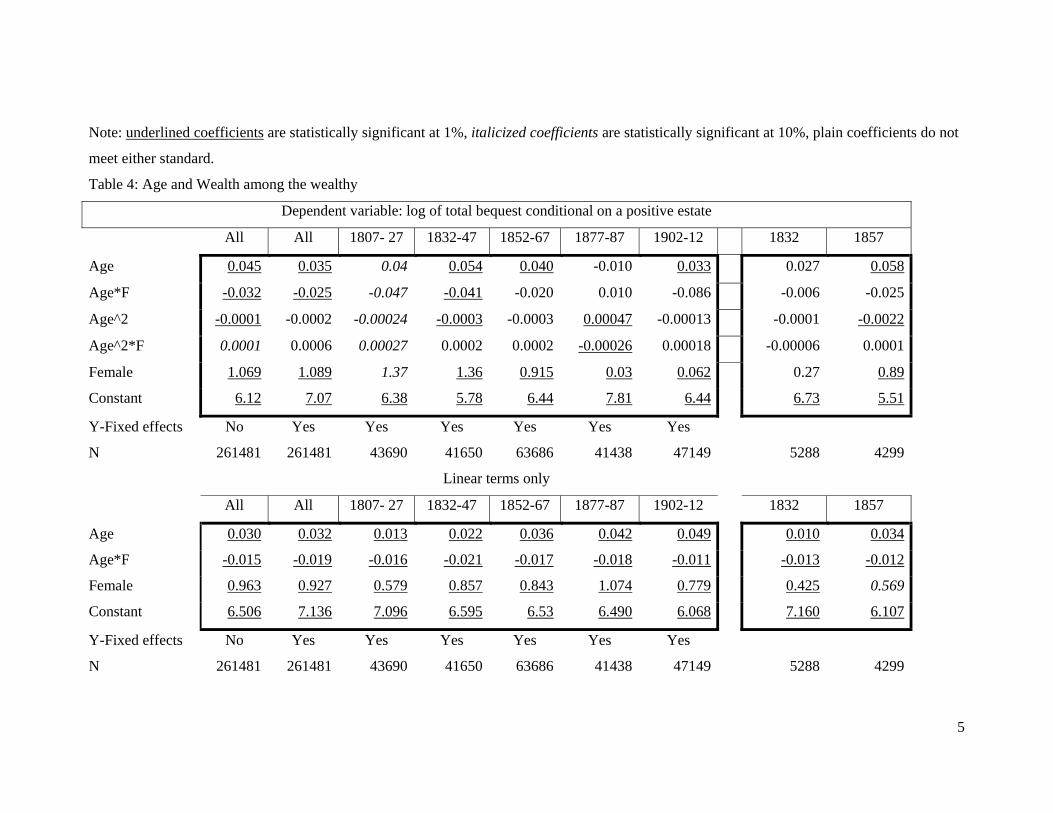
barely changes value.5 For the OLS estimates with a simple age term (Table 4 Panel B), an
additional year of life increases wealth by 1.3% in the early nineteenth century; by the early
twentieth century it increases wealth by nearly 5%. For many periods, when we include the
square of age, it is negative suggesting that the age-wealth relationship is concave as a life
cycle approach would predict (Table 5). Yet the peak occurs at ages of 100 or greater. In
effect the denizen of Paris either died poor and then relatively young, or if they accumulated
enough wealth to leave a bequest. If so then their wealth grew with age at death over the
entire range of observed wealth at death.
Second, crises -- even transitory ones -- reduce the relationship between age and
wealth. The effect of the Revolution, which was likely responsible for the tiny effect of age
on wealth at death, is echoed in two other smaller crises: 1832 and 1857 (see Table 4 Panel
B). In 1832, the effect of age on wealth is half that of what it would be in 1837 and
statistically smaller than what it is either for 1822 or 1827. For 1857, it is off by 25%, a
statistically significant difference. There are two interpretations to these results. The first
4 Effectively those who leave something behind but we use a constant selection rule. Including all decedents with positive estates makes no difference to the results. 5 This remains true if we drop the extremely wealthy (the top 0.2%)

9
emphasizes the demographic consequences of crises and argue that in the latter part of a
negative shock people who are relatively young die having just inherited large chunks of
wealth as some of the very wealthy get caught up in the crisis (cholera or guillotine). While
this argument fits well with our notions of the clustered nature of mortality due to cholera,
or to the redistributive effects of the Revolution it does not help much with explaining our
finding for 1857. A second argument would focus more on the impact of crises on asset
prices and argue that the very rich (and thus the very old) were more likely to own real
estate and publicly traded assets whose valuations would vary with the economic cycle. The
middle class held savings accounts and business assets whose reported value did not vary
with the economic cycle. A corollary to this argument would be that the very wealthy held
more variable portfolios of assets than the middle class. Nevertheless assessing these two
hypotheses will have to rely on portfolio information which we are gathering.
Third, women’s wealth was typically less sensitive to age than men’s. The
regressions all report coefficients for age and age squared interacted with a dummy variable
for female status. These coefficients must be added to those of the omitted category (men)
to obtain estimates for women. The interacted terms (age*women or age²*women) have the
opposite sign from the simple coefficient (age or age²) in the logits and all the continuous
estimates, and these differences are often precisely estimated. In other words although
women who died older died wealthier the impact of age was quite a bit smaller than men’s
(in the case of the tobits typically about half as strong).
Fourth, differences between men and women declined over time and by the
beginning of the twentieth century differences between men and women were no longer
statistically significant in terms of probability of dying with an estate (logit), or in terms of
the size of the estate estimated by tobit. For the OLS on the level of wealth the coefficient
for age*women is negative and statistically significant but one tenth the magnitude of the
coefficient for the period 1807-27. If we examine the estimates based only on a linear term
then male-female differences seem more persistent and statistically significant even though
their magnitude falls again in the same steady pattern. While the return to age for male
jumped from 1.2% to 4.9% between the first and last period that of women jumped from 0
(the coefficient age*women is -0.016) to 3.7%.
Again, a number of possibilities might explain both the male female differences and
the process of convergence in their wealth-age patterns. We are certainly a great distance
away from the republican ideal of community property and equal treatment of children. The
10
regression results suggest that there were numerous biases involved. To begin with, the
systematic pattern of a higher intercept for women implies that wealthy parents were far
more likely to provide dowries for their daughters than their sons and that the number and
value of these dowries remained substantial throughout the 19th century. Second, the equally
systematic lower slope of women’s wealth by age profiles suggests that either there was a
male biased disposition of household wealth (thus married women accumulated wealth at
lower rates than their husbands) or that unmarried and widowed women were the subject of
significant discrimination in labor and capital markets and entrepreneurial opportunities.
Needless to say, all these different biases may well have been at work. Efforts to disentangle
the importance of these different issues by including information on marital status at the
time of death failed. Third, the convergence of women and men’s wealth by age profile is
consistent with the notion that cultural change in the 19th century brought Parisian closer to
the republican ideal over time.
The regression analysis with augmented data set qualifies our findings in Piketty et
al 2006. Taking into account crises like 1857, the age wealth profiles now seem to have had
an increasing slope long before the second half of the twentieth century. In this sense, the
cross sectional pattern fits better with what we know about industrialization, financial
development and economic growth in France. These processes were not characterized by
either a Gerschenkronian cath up phase or a Rostovian acceleration. Instead they were slow
and steady and begin long before the Second Empire. Thus it seems that the rise in the slope
of the age wealth profiles was likely a by-product of economic growth (associated with the
growth in the scale of certain economic sectors, in particular finance) rather than simply a
return to an Old Regime of inequality. Further, as table 1 shows, although the distribution of
wealth at death became more skewed over time, the fraction of individuals who died poor
remained constant and all of the fractiles for which wealth was positive experienced
significant wealth growth.
Part 3: Recovering from the Revolution
The cross sectional analysis has some advantages, in particular that a few cross
sections can be collected quickly to provide a picture at different points in time.6 A cross
6 There is also the advantage that because deaths all occur in the same year, the asset prices can be taken to be constant across individuals. Because France used a fixed relationship to gold during the entire period changes in the price level were small and can be neglected.
11
section, however, lumps together individuals with radically different accumulation histories.
To the extent that we imagine our economies as steady states of some Solow style growth
process, then the cross section information is likely to provide reliable information about the
the wealth accumulation experience of cohorts. Yet history is not a succession of Solow
steady states but rather a tug of war between technical, financial, political, and demographic
shocks on the one hand and a remarkably persistent drive of individuals to accumulate
wealth. Each life span is thus composed of a particular sequence of shocks that either set
back or accelerate an individual’s accumulation experience. While some of these shocks are
anticipated by some individuals, others clearly are not. Hence it might well be that
differences in wealth inequality and in wealth-age profiles that one find between cross
sections are really the result of dramatic differences in the capacity of different cohorts to
accumulate wealth.
We can repeat our three pronged analysis (Logit, Tobit and OLS) by grouping
individuals by birth cohorts (those say born between 1760 and 1769 forming a coherent
group). For this presentation we concentrate on the OLS results. In doing so we particularly
want to distinguish between the cohorts born before 1770 (who entered the revolution as
adults) and those born after 1800 (who became adults after Napoleon’s fall in 1815), the
cohorts born between 1770 and 1800 form an intermediate group that started to accumulate
in earnest after the Revolution’s financial gyrations had come to a stop but their early years
would have been subject to adventures of Napoleon and to the difficulties of the political
transition between 1813 and 1815.
Because our death data span 1807-1912, we observe the complete wealth-age
profiles of individuals born (by complete we mean from 20 to 80) between 1787 and 1830,
our four decadal cohorts. We also observe partial age profiles for cohorts born as early as
1740 and as late as 1880; the early cohorts only appear as old while the latter cohorts only
appear young.
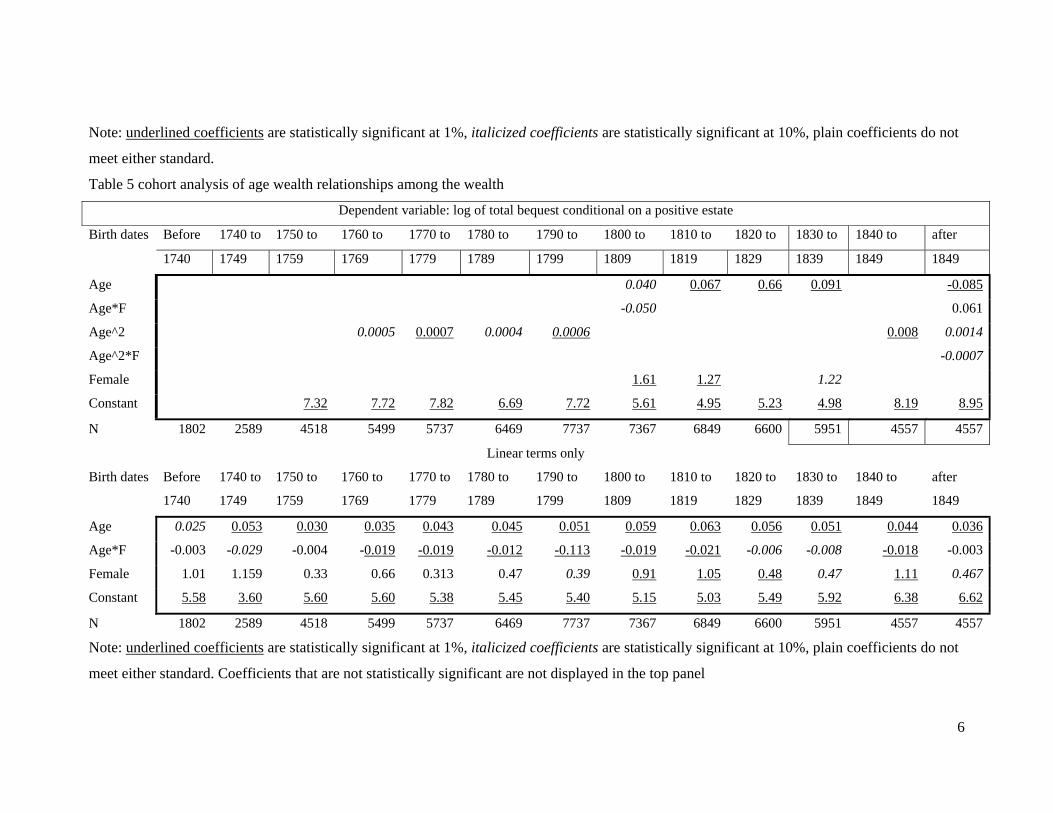
Regression analysis (Table 5) confirms some of the cross sectional analysis. Once
again, the age-wealth connection was less steep for men than women and, once again, the
differences between men and women were most marked in the early cohorts. By the late
cohorts they had faded into statistical insignificance.
The regressions, however, show that even for the early cohorts returns by age were
substantial. Cohorts born before 1770 experienced something like a 3% return to age despite
experiencing the full brunt of the Revolution. Cohorts born after 1770 have nearly twice the
12
return to age we found in the early cross sections for those cohorts born between 1770 and
1790 the return is nearly 5% while for cohorts born between 1800 and 1820 it is even
higher. Then, return decline for cohorts that are censored in the latter ages suggesting that
there may be a non linear aspect to the wealth-age relationship. Adding an age square term
does show that returns are exponential for some cohorts that we observe either old or
uncensored. However, some cohorts born after 1800 do not have a positive age squared term
even though we observe then from age 20 through 90.
Cohort analysis thus modifies our view of the changes in the wealth accumulation
process that comes out of the cross-sectional analysis. First, the members of every cohort
born after 1770 who died old were significantly wealthier than those who died young, even
if we eliminate the very rich from the analysis. Hence the age wealth relationship was not
an invention of an industrializing economy, but rather a long standing phenomenon. The
increased concentration that appears in cross section as the collateral effect of economic
growth now appears as the resurgence of an old order. Cohorts thus lean in the opposite of
the cross-sectional results. To fully allocate these differences we must return to the sources
to better understand the social origins of the very rich and the portfolios of the Parisian
population.
To what extent was the lower rate of accumulation of cohorts born after 1740 but
before 1790 the result of the Revolution? Had those cohorts had the same savings strategies
as the latter ones, they would have appeared poorer because of the Revolution’s turmoil.
The Revolution was a dramatic redistribution of wealth, but relative to the kinds of
nationalizations that followed the advent of socialist regimes in Russia and elsewhere it was
modest. The state remained deeply committed to private property and the loss of assets is
unlikely to have been more than half. But if we assume that the cohorts who became adults
prior to the Revolution lost half the wealth they had accumulated before 1790, then their
accumulation rates after the crisis was over were likely to have been higher than those of
later cohorts. Moreover not all was lost to private wealth accumulation between 1789 and
1812. In fact the Revolution and the Empire also afforded opportunities to get rich. The
opportunities, most famously Napoleon’s grants to his favored military officers and
administrators, could make individuals who were young but in the right place at the right
time quite rich. To the extent that these opportunities were important, the Revolution would
be churning the wealth distribution rather than simply leveling it.
13
The Revolution as a leveling experience has a long history, most stridently
articulated by A.D. White. Leaving aside the problem of individuals who fell personally
afoul of one or another political regime between 1789 and 1813, fortunes were reduced by
three different policies. The most famous perhaps was the default of two-thirds on
government debt in 1797. The government reduced its outstanding obligations to one-third
of what they had been and consolidated nearly all of them into perpetual annuities paying
5% (these then traded at a substantial discount until the 1820s). While this clearly would
have reduced individuals’ assets, it is not clear it would have made much of a difference to
the size of taxable estates since government debt was exempt from the estate tax.
When the government enacted the default of two-thirds it was really enacting a
resumption at one third of the face value of the public debt as it re-valued the currency from
worthless paper to a unit of account nearly identical to what had prevailed in 1789. In the
interim, the currency had depreciated by more than 99% and private lenders had taken
advantage of the devaluation to reimburse their debts at a fraction of what they had been
worth in 1789. Hoffman, Postel-Vinay, and Rosenthal (2001) estimate that private lender
lost between half and three fourths of the value of their private bonds. To the extent those
resources were transferred to borrowers, there is no change in aggregate wealth and it
should not affect our wealth by age calculation. Yet there are several reasons to think
otherwise. Assets were transferred from individuals who wanted to save to individuals who
had borrowed to invest but also to consume, thus a fraction of the transfer was probably
consumed leading to a decrease in total wealth. Further, borrowers were typically younger
than lenders suggesting that the redistribution at the very least disturbed the age-wealth
relationship. Finally and most important, the stock of financial assets ceased to grow.
The final policy that reduced the value of bequest involves the nationalization of the
Church’s assets. In Paris this implied the confiscation of a large ring of real estate owned
by monasteries and nunneries as well as other religious institutions. These were then
abruptly put on the market causing a very large decline in real estate prices. The extent to
which the total value of real estate assets in private hand actually declined may be
debatable. What is clear is the assets owed in 1789 fell significantly in value. It is the older
assets that were the most likely to be in the hands of the individuals who appear as
decedents in the early cross sections.
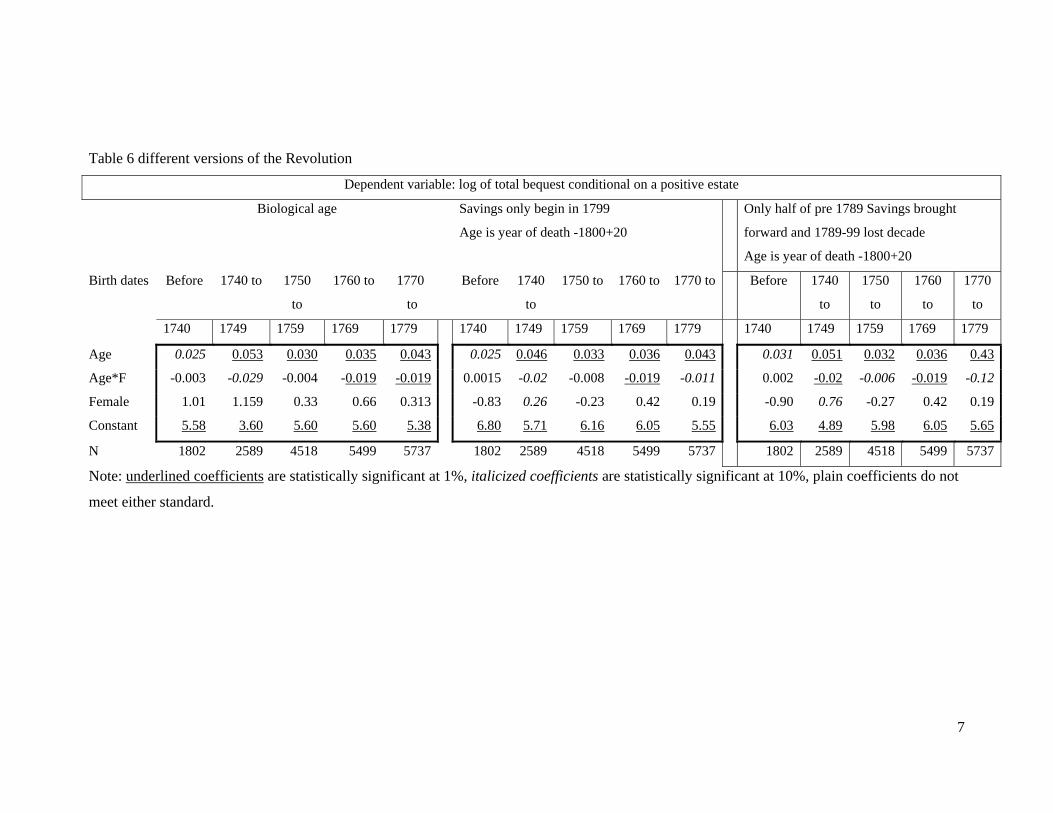
To examine the leveling versus churching impact of the Revolution we create two
alternative version of age. The first is what ever saving might have been accumulated prior
14
1799 were lost, leaving individuals with a saving period equal to the difference between the
year they died and 1800. A second version assumes that individuals had a wealth
accumulation period equal to half their adult years before 1789 plus the years after 1799,
leaving the 1790s as a lost decade.7 We can then estimate new returns to age for the early
period. The stark formulation typically performs worse than either biological age or the one
that accounts for the fact that losses were far from total. Yet the explanatory power of the
adjusted age is slightly better than biological age.8 For the cohort born in the 1760s the age
effects also increases when we use our imputed age as does the overall fit of the regression.
The later cohorts are obviously unaffected. The increase in the coefficient is modest,
however (from 2.5% to 3.1% prior to 1740 and from 3.5 to 3.6% for the cohort born in the
1760s).The failure of alternative formulations of age, suggest that by 1807 the churning
effects of the Revolution were at least as important as the leveling ones.
Even with the limited evidence we have, it is clear that the pattern of inequality that we
observe in the early part of the nineteenth century owes a lot to the Revolution. To some
extent the growth of inequality starting in the 1830s and the increased importance of age are
just a return to a normal state of affairs in a market economy where at least some individuals
have dynastic saving motivations.
Part 4: An Attempt to Deal with Causality
The other factor behind increasing inequality is demographic. As noted in Section 1
individuals who died rich died older and those who died extremely rich did so even more.
In this section we explore the extent to which increase life expectancy for the very rich
could explain the rise in wealth inequality.
Doing so supposes we can deal with the problem that increases in wealth can be used
to prolong life. One solution to this problem is to use the growth rates of estates as function
of age for the group 74-98, that is individuals with positive bequest who do not belong to
the super rich. Unlike the very rich this group experiences almost no change in average age
at death (its members died around 56.6 prior to 1840 and around 56.3 in the first decade of
7 We can also estimate a model where all the years prior to 1799 were lost. This model performs slightly better than using actual age but a good worse then our imputed measure. 8 We report the results for cohorts born prior to 1760 as a group, the impute age variable does better than biological age if we consider separately individuals born in each of the decades starting in 1730.

15
the twentieth century. Hence its increase in wealth was not matched by any increase in life
expectancy.
In contrast the top 2% experienced a jump in age at death from 60.4 to 67.7 or a gain
of 7 years. By how much did estates grow as a result? There are many ways to answer this
question. One takes the average size of estates in the early 19th century for the very rich, and
combines it with the growth rate of estates by age for the early cohorts to obtain a
counterfactual inequality in the early 19th century and see if it was similar to that obtained
around 1900. By the early part of the twentieth century, average wealth of the 74-98 was
30806 francs that of 98-100 group 1,352,000 francs nearly 44 times that of the other group.
Prior to 1840 the average wealth of the 74-98 was 7776 francs that of 98-100 group
260,000 francs or 33.43 times that of the other group. Had the top group lived not 60.4 years
but 67.7 and experienced the 2.8% growth per annum that the P74-98 group experienced in
cohorts that were born before 1770, it would have died with a wealth of 322,500 francs or
41.5 times more than the middle group. If we use the more generous 3.4% annual growth
rate experienced by the P74-98 in the cohort born in the 1770s then the rich would have had
nearly 43 times the wealth of the middle group. In fact 3.85% is within one standard
deviation of the wealth by age growth estimated for the P74-98 group born in the 1770s.
Obviously if we use cross sectional estimates of the returns to age (which for the
P74-98 were a tiny 0.7% per annum) then allowing the very rich to live to live an extra 7
years
One can vary the procedure and ask what would have happened if the P98-100 had
died as young in 1900-12 as it did before 1840. If we take the rapid wealth by age growth
rate of the cohort born in the 1820s (its members reach their eighties in the decade of 1900)
and net out 7.3 years of accumulation their wealth at death falls from 1.35 million francs to
1 million francs and the ration to the P74-90 falls to 32.5 less than it was prior to 1840. If
use the slower growth rate of 3.9% per year experience by the cohort born in the 1830s we
still arrive at a ratio that is smaller than the one we compute for the early nineteenth century.
In this perspective, demography alone can explain the increased inequality. In the
absence of any selection and in the absence of any capital market imperfection, the
increasing variance in ages generated some much larger bequests. This may have been
because they actively saved to increase the size of the fortunes they left behind; but it is not
unlikely that a large part of this increase came from a more passive process—having bought

16
an asset (e.g. a building) in their middle ages they kept it until they died and its value
steadily increased over time.
Conclusion
This first examination of the relationship between age and wealth at death within a
very unequal but quite dynamic economy is perforce partial, but it does afford a number of
striking conclusions.
To begin the very large numbers of individuals who died without leaving any
significant bequest raises questions about arguments that promote redistribution for efficacy
reasons. Given the uncertainties Parisians faced about their life spans and the availability of
a low cost saving mechanism in the Caisse d’Epargne de Paris (founded in 1818) we would
have expected a much larger number of positive bequest. And given the steady
improvement in the scope and efficiency of capital markets one would have expected an
increased diffusion of financial assets. It seems difficult to escape the conclusion that had
these individuals received some wealth in some redistributive scheme many would not have
consumed it—thus severely diluting any efficiency improvements. In this sense most 19th
century Parisians were resolutely modern, rather than save for bequest they would preferred
to tax future generations.
Perhaps more troubling from a historical perspective the relatively lower levels of
inequality that we found in the early nineteenth century seem to be the product of the
Revolution’s redistribution thus the inequality levels found in cross section after 1880 or in
the cohorts born around 1810 are likely to represent long term equilibria. In fact comparing
the impact of more moderate crises like 1832 or 1857 to the Revolution shows precisely that
the upheaval of 1789 had enduring consequences. Finally, demographic changes can play a
dramatic role in changing inequality. Here we have only looked at aging and the evolving
gender structure of wealth at death, but there were other changes of perhaps equal
importance involving the number of heirs and decisions about inter vivos transfers. What
remains to be understood is the extent to which the increasing concentration of the very rich
among the elderly was a random phenomenon or more of the slow process of recovering
from the Revolution.
The demographic evidence is not conclusive however. Indeed the next two steps
involve examining the social background of the very rich and their wealth portfolios. Were

17
they simply heirs of prior fortunes or did a number of them build the massive bequests they
left to their children through their own enterprise? Similarly, where the rich primarily
invested in safe low yield assets, or where they in a more modern vein willing to and take
positions in high risk-high return activities shunned by the middle class. The portfolios of
the very rich bear should, in time, allow us to answer these questions.

18
Bibliography (incomplete)
Benabou, R. 2002. "Tax and Education Policy in a Heterogeneous Agent Economy: What Levels of Redistribution Maximize Growth and Efficiency?" Econometrica, 70(2), March 2002, 481-517
Botticini, M. and z. Eckstein. 2005 “Jewish Occupational Selection: Education, Restrictions, or Minorities?" Journal of Economic History 65, no. 4 (December): 922-48.
Clark; G. and G Hamilton , 2006. “Survival of the Richest. The Malthusian Mechanism in Pre-Industrial England.” Journal of Economic History, 66(3) September.
Gruner, H-P, 2003. “Redistribution as a Selection Device,” Journal of Economic Theory 108, 2003, pp. 194-216.
Hoffman P., G. Postel-Vinay, and J-L Rosenthal (2001) Priceless Markets, the Political Economy of Credit in Paris. Chicago U.P. Piketty, T. 1997. “The Dynamics of the wealth distribution and the interest rate with credit-rationing,” Review of economic studies, vol. 64, no 2, 1997, p. 173-189. Piketty, T., Postel-Vinay G., Rosenthal J.L.: “Wealth concentration in a developing economy:
Paris and France, 1807-1994,” American Economic Review, vol. 96, no 1, 2006, p. 236-256.
19
TABLE 1: summary data by major periods
Fraction of decedents that are women
All
with positive Estate in P74-90 in P90-98
in P98-98.8
in P98.8-100
Empire and Restoration 0.483 0.511 0.536 0.477 0.420 0.286July Monarchy 0.541 0.529 0.552 0.491 0.426 0.371Second Empire 0.516 0.479 0.491 0.476 0.399 0.3181870-90 0.480 0.449 0.447 0.459 0.417 0.4291900-1912 0.492 0.443 0.423 0.483 0.463 0.432 Women's average estate Empire and Restoration 5372 17139 810 20466 150972 945133July Monarchy 6927 27577 785 26927 238653 981304Second Empire 11884 43619 2221 49488 403663 17715771870-90 27122 102520 4171 84685 743603 45748361900-1912 33030 135585 3380 87379 888275 5995274 Men's average estate Empire and Restoration 8217 29368 850 22328 159595 1059719July Monarchy 12083 45737 838 28500 246384 1437093Second Empire 21581 68253 2226 52288 415198 25566221870-90 32093 107157 3930 87787 705915 44001301900-1912 36149 120262 3197 92699 914340 6732490 Women's share of Wealth Empire and Restoration 0.379 0.524 0.456 0.406 0.263July Monarchy 0.404 0.536 0.477 0.418 0.287Second Empire 0.370 0.490 0.462 0.393 0.2441870-90 0.438 0.462 0.451 0.430 0.4381900-1912 0.469 0.437 0.468 0.456 0.403 Women's Average age at deathEmpire and Restoration 55 56 56 55 57 64July Monarchy 51 55 55 54 59 59Second Empire 51 55 56 53 53 651870-90 53 57 55 61 66 701900-1912 55 59 55 63 68 72 Men's Average age at death Empire and Restoration 50 59 58 60 63 64July Monarchy 50 57 55 58 63 68Second Empire 50 56 53 59 65 681870-90 50 56 53 60 67 711900-1912 52 56 53 61 67 68 Number of decedents with age Empire and Restoration 43,690 July Monarchy 65,385 Second Empire 63,686 1870-90 41,438 1900-1912 47,149
Note: the number of decedents with age varies across period both because the fraction of ages
reported varies between 65% and 85% and because in some periods we have 4 or 5 cross
sections while in others we only have two. At the beginning of the 19th century, the total
number of deaths per year was about 11000 while it was nearly 30,000 before WWI.
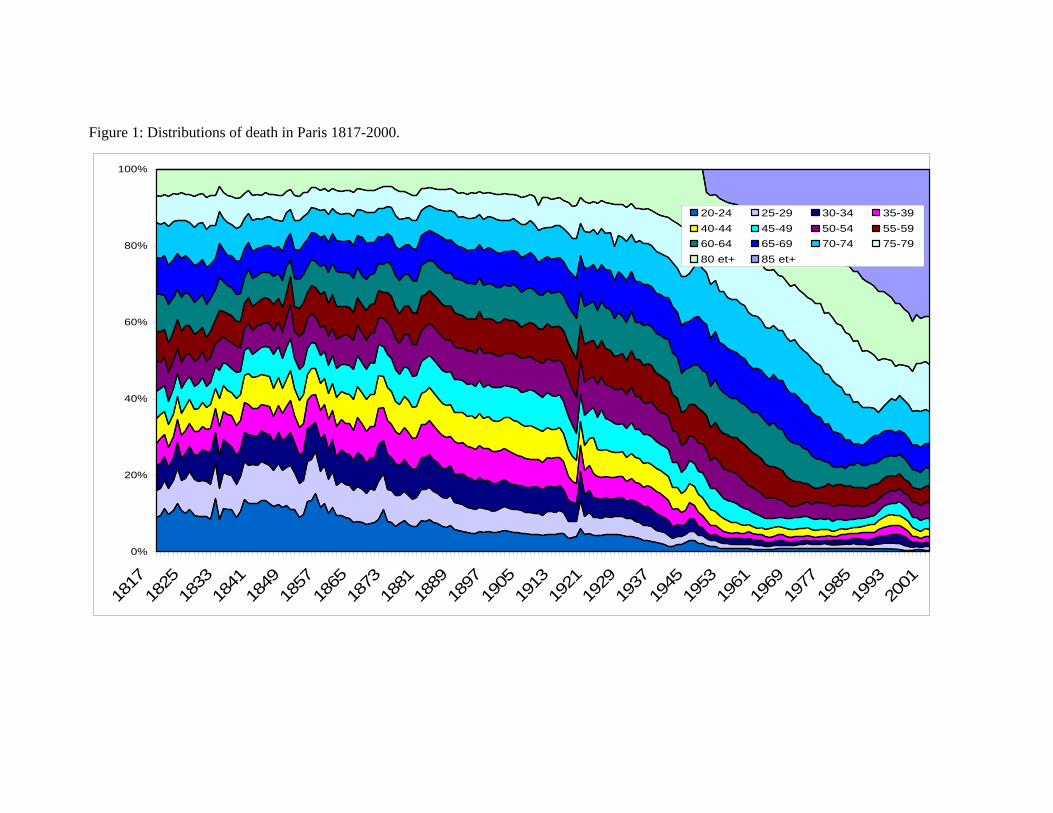
Figure 1: Distributions of death in Paris 1817-2000.
0%
20%
40%
60%
80%
100%
1817
1825
1833
1841
1849
1857
1865
1873
1881
1889
1897
1905
1913
1921
1929
1937
1945
1953
1961
1969
1977
1985
1993
2001
20-24 25-29 30-34 35-39
40-44 45-49 50-54 55-59
60-64 65-69 70-74 75-79
80 et+ 85 et+
1
Figure 2: ages at death
.
Age at Death by Class and Gender
43
46
49
52
55
58
61
64
67
70
1807 1817 1827 1837 1847 1857 1867 1877 1887 1897 1907
All-W All-MVery Rich (P99.8-100) Women Very Rich (P99.8-100) MenRich (P98-99.8) Women Rich (P98-99.8) MenMiddle Class (P 90-98) Women Middle Class (P 90-98) MenRest with bequest (P74-P90) Women Rest with bequest (P74-P90) MenRest P0-90 Women Rest P0-90 Men

2
Figure 3 : Wealth-Age Profiles

3
Table 2: logit estimate of who leaves wealth behind
Dependent variable 1 if bequest>0; 0 otherwise
All All 1807-27 1832-47 1852-67 1877-87 1902-12 1832 1857
Age 0.084 0.086 0.103 0.084 0.0964 0.0732 0.05 0.64 0.10
Age*F -0.044 -0.043 -0.046 -0.051 -0.048 -0.036 -0.0107 -0.29 -0.044
Age^2 -0.0005 -0.0005 -0.0006 -0.0005 -0.0006 -0.0004 -0.0003 -0.0004 -0.0006
Age^2*F 0.002 0.002 0.00008 0.0004 0.0003 0.0002 0.00002 0.0001 0.0002
Female 1.404 1.4 2.36 1.45 1.38 1.05 0.222 0.96 1.36
Constant -3.759 -3.824 -4.7 -3.69 -4.07 -3.52 -2.65 -3.43 3.97
Y-Fixed effects No Yes Yes Yes Yes Yes Yes
N 261348 261348 43690 41650 63686 41438 47149 23735 13379
Note: underlined coefficients are statistically significant at 1%, italicized coefficients are statistically significant at 10%, plain coefficients do not
meet either standard.
4
Table 3 Tobit estimate of the age wealth link
Dependent variable: Total wealth including 0s
All All 1807- 27 1832-47 1852-67 1877-87 1902-12 1832 1857
Age -1162.3 -1567.1 501.01 8171 12375 15402 18862 4350.8 7678
,,,,,,,,,,,,,,,,,,,,,,,,,,,,
,,,,, Age*F
713.3 1021.8 -234.81 -4418 -5290 -4894 -6031 -1976.2 -2443
Age^2 22.3 26.1 -2.23 -48.02 -62.1 -37.8 -68.01 -26.9 -30.2
Age^2*F -13.0 -16.0 0.24 27.2 19.6 0.31 16.9 9.9 -1.45
Female -7545.1 13824.6 7780 134295 176465 195097 145455 63543 95548
Constant 17173.2 -43016.1 -8427.6 -431549 -699735 -1159250 1426460 -241508 -241508
Y-Fixed effects No Yes Yes Yes Yes Yes Yes
N 261481 261481 43690 41650 63686 41438 47149 23735 13379
Linear terms only
All All 1807- 27 1832-47 1852-67 1877-87 1902-12 1832 1857
Age 1110.6 1090 278.6 3063.7 5837 11378 11538 1504 4563
Age*F -577.0 -575 -223.2 -1503 -3253 -4928 -4331 -895 -2650
Female 20720 21197 7877 64971 125782 195001 69162 37204 99674
Constant -33288 -16634 -3701 -312833 -544028 -1062122 -1247084 -174721 -348829
Y-Fixed effects No Yes Yes Yes Yes Yes Yes
N 261481 261481 43690 41650 63686 41438 47149 23735 13379
5
Note: underlined coefficients are statistically significant at 1%, italicized coefficients are statistically significant at 10%, plain coefficients do not
meet either standard.
Table 4: Age and Wealth among the wealthy
Dependent variable: log of total bequest conditional on a positive estate
All All 1807- 27 1832-47 1852-67 1877-87 1902-12 1832 1857
Age 0.045 0.035 0.04 0.054 0.040 -0.010 0.033 0.027 0.058
Age*F -0.032 -0.025 -0.047 -0.041 -0.020 0.010 -0.086 -0.006 -0.025
Age^2 -0.0001 -0.0002 -0.00024 -0.0003 -0.0003 0.00047 -0.00013 -0.0001 -0.0022
Age^2*F 0.0001 0.0006 0.00027 0.0002 0.0002 -0.00026 0.00018 -0.00006 0.0001
Female 1.069 1.089 1.37 1.36 0.915 0.03 0.062 0.27 0.89
Constant 6.12 7.07 6.38 5.78 6.44 7.81 6.44 6.73 5.51
Y-Fixed effects No Yes Yes Yes Yes Yes Yes
N 261481 261481 43690 41650 63686 41438 47149 5288 4299
Linear terms only
All All 1807- 27 1832-47 1852-67 1877-87 1902-12 1832 1857
Age 0.030 0.032 0.013 0.022 0.036 0.042 0.049 0.010 0.034
Age*F -0.015 -0.019 -0.016 -0.021 -0.017 -0.018 -0.011 -0.013 -0.012
Female 0.963 0.927 0.579 0.857 0.843 1.074 0.779 0.425 0.569
Constant 6.506 7.136 7.096 6.595 6.53 6.490 6.068 7.160 6.107
Y-Fixed effects No Yes Yes Yes Yes Yes Yes
N 261481 261481 43690 41650 63686 41438 47149 5288 4299
6
Note: underlined coefficients are statistically significant at 1%, italicized coefficients are statistically significant at 10%, plain coefficients do not
meet either standard.
Table 5 cohort analysis of age wealth relationships among the wealth
Dependent variable: log of total bequest conditional on a positive estate
Birth dates Before 1740 to 1750 to 1760 to 1770 to 1780 to 1790 to 1800 to 1810 to 1820 to 1830 to 1840 to after
1740 1749 1759 1769 1779 1789 1799 1809 1819 1829 1839 1849 1849
Age 0.040 0.067 0.66 0.091 -0.085
Age*F -0.050 0.061
Age^2 0.0005 0.0007 0.0004 0.0006 0.008 0.0014
Age^2*F -0.0007
Female 1.61 1.27 1.22
Constant 7.32 7.72 7.82 6.69 7.72 5.61 4.95 5.23 4.98 8.19 8.95
N 1802 2589 4518 5499 5737 6469 7737 7367 6849 6600 5951 4557 4557
Linear terms only
Birth dates Before 1740 to 1750 to 1760 to 1770 to 1780 to 1790 to 1800 to 1810 to 1820 to 1830 to 1840 to after
1740 1749 1759 1769 1779 1789 1799 1809 1819 1829 1839 1849 1849
Age 0.025 0.053 0.030 0.035 0.043 0.045 0.051 0.059 0.063 0.056 0.051 0.044 0.036
Age*F -0.003 -0.029 -0.004 -0.019 -0.019 -0.012 -0.113 -0.019 -0.021 -0.006 -0.008 -0.018 -0.003
Female 1.01 1.159 0.33 0.66 0.313 0.47 0.39 0.91 1.05 0.48 0.47 1.11 0.467
Constant 5.58 3.60 5.60 5.60 5.38 5.45 5.40 5.15 5.03 5.49 5.92 6.38 6.62
N 1802 2589 4518 5499 5737 6469 7737 7367 6849 6600 5951 4557 4557
Note: underlined coefficients are statistically significant at 1%, italicized coefficients are statistically significant at 10%, plain coefficients do not
meet either standard. Coefficients that are not statistically significant are not displayed in the top panel
7
Table 6 different versions of the Revolution
Dependent variable: log of total bequest conditional on a positive estate
Biological age Savings only begin in 1799
Age is year of death -1800+20
Only half of pre 1789 Savings brought
forward and 1789-99 lost decade
Age is year of death -1800+20
Birth dates Before 1740 to 1750
to
1760 to 1770
to
Before 1740
to
1750 to 1760 to 1770 to Before 1740
to
1750
to
1760
to
1770
to
1740 1749 1759 1769 1779 1740 1749 1759 1769 1779 1740 1749 1759 1769 1779
Age 0.025 0.053 0.030 0.035 0.043 0.025 0.046 0.033 0.036 0.043 0.031 0.051 0.032 0.036 0.43
Age*F -0.003 -0.029 -0.004 -0.019 -0.019 0.0015 -0.02 -0.008 -0.019 -0.011 0.002 -0.02 -0.006 -0.019 -0.12
Female 1.01 1.159 0.33 0.66 0.313 -0.83 0.26 -0.23 0.42 0.19 -0.90 0.76 -0.27 0.42 0.19
Constant 5.58 3.60 5.60 5.60 5.38 6.80 5.71 6.16 6.05 5.55 6.03 4.89 5.98 6.05 5.65
N 1802 2589 4518 5499 5737 1802 2589 4518 5499 5737 1802 2589 4518 5499 5737
Note: underlined coefficients are statistically significant at 1%, italicized coefficients are statistically significant at 10%, plain coefficients do not
meet either standard.

8
Table 9: Counterfactual wealth levels for the very rich in the absence of aging
Average Wealth Ratio P74-98 P98-100 Wealth before 1830 6,845 246,703 36.0Wealth 1900-1912 30,806 1,352,762 43.9 Counterfactual of early wealth of the very rich Wealth reached by P98-100 if died 67.7 Growth rate of P74-98 in cohorts born before 1770 2.8 299,313 43.7Growth rate of P74-98 in cohort born in 1770s 3.4 311,758 45.5 Growth rate of P74-98 1807-27 0.7 259,048 37.8 Counterfactual of Late Wealth of the very rich Wealth reached by P98-100 if died 64.4 Growth rate of P74-98 in cohort born in 1820s 4.2 1,014,255 32.9Growth rate of P74-98 in cohort born in 1830s 3.9 1,034,933 33.6 Growth rate of P74-98 1902-12 3.5 1,064,698 34.6 Note average age of death of P98-100 prior to 1830 was 60.7 Note average age of death of P98-100 after 1900 was 67.7