incidence of adverse biological effects within ranges of
TRANSCRIPT

Incidence of Adverse Biological Effects Within Ranges of Chemical Concentrations in Marine and Estuarine Sediments1
------.__._---------~-------EDWARD R LONG" Coastal Monitoring and Bioeffects Assessment Division
Natronal Oceanic and Atmospheric Administration
Bin C·t5700
7600 Sand Point Way NE
Seattle, Washington 98115, USA
DONALD O. MACDONALD
MacDonaid Environmental Sciences, Ltd.
2376 YeHow Point Road, RR #3
L.adysmith, British Columbia VOR 2EO, Canada
SHERRI L. SMITH
Environment Canada
351 S1. Joseph Blvd.
Hull, Quebec K1A OH3, Canada
FRED D, CAL.DER Florid<$ Department of Environmentai Protection
Douglas 81ag 3900 Commonwealth Blvd.
Tal!ahassee, Florida 32399, USA
ABSTRACT / Matching biological and chemical data vI/ere
complied from numerous modeling, laboratory, and field
Chemical analyses indicate that coastal sediments m some areas of North America are contaminated (Bolton and others 1985, O'Connor 1991. US NOAA 1991,WeHs and Rolston 1991, Goyette and Boyd 1989). However, data on the mixtures and concentra~
tions of contamin.ants in sediments, alone, do not pro-
KEY WORDS: Sediment quality guidelines; Ecological risk assessment; Contaminants, BiOlogical effects, Marine. Estuarine
'The methods and guidelines presented in this report do not necessarily represent the policy of the National Oceanic and Atmospheric Admmist,ation, Environment Canada, or Flonda Department of Environmental Protection.
'"Author to whom correspondence should be add,essed.
Environmental Management Vol. 19. No, 1, pp. 81-97
studies performed in marine and estuarine sediments
Using these data, two guideline values (an effects
range-lew and an effects range-median) were determined
for nine trace metals, total PCBs, two pesticides, 13
polynUclear aromatic hydrocarbons (PAHs), and three
dasses of PAHs. Trie two va~ues defined concentration
ranges that were: (1) rarely, (2) occaslonaBy, or (3)
frequently associated with adverse effects The values
generaily agreed within a factor of 3 or less with those
developed with the same methods applied to other data
and to those developed with other effects-based methods. l·rne<:1:rlclde.nceof···aoverse:efTects .·waS:::Clu2ntifiedwithin
eP.oh..·o.f:ttH~ ...tMree:odnoentn:itiqf:1J~mge§i~s::·the .:numbar of cas@~inW.b.i.oh·~fte.c.tsw~n.30bservaddividedby the total
nl)mp·f#J9t.9gB~rv~tions,.;:n}e.inoiden:ce···of·eftects
increag~¢rnart<~d!ywjth increasing concentratiqfls of all of the indivldua!·PAHs, the three classes of PAHs, and most
of the trace metals. Relatively poor relationships were
observed between the incidence of effects and the
concentrations of mercury, nickel, total PC8, total DDT and
p,p' -DOE. Based upon this evaluation, the approach
provided reilable guidelines for use In sediment Quality
assessments. This method is being used as a basis for
deveioping National sediment qua.lity guidelines tor
Canada and informal. sediment quality gUidelines for
Florida.
vide an effective basis for estimating the potential for adverse effects to bving resources. Moreover, interpretive tools are needed to relate ambient sediment chemistry data to the potential for adverse biological effects. A variety of biological measures (includin.g toxicity andlor bioaccumuladon tests) can be per~
formed to delermme the biological significance of sedimen1..~associated contaminants (Burton 1992). Furthermore, numerical. effects-based, sediment quality guidelines can be used as screening tools to
evaluate sediment chemistry data and to identify and prioritize potential problem areas (Di Toro and others 1991, Persaud 1992, MacDonald 1993, Long and Morgan 1990, Smith and MacDonald 1992, US EPA 1989a, 1992a). In this respect, effects-based guidelines can be used to help identify those areas in which the potential for biological effects is greatest.
© 1995 Springer-Veriag New york inc.

L()T19 arle: others
A variety of biological effects-based approaches to the development of sediment quality guidelines have been reviewed by many investigators (US EPA 1989a. 1992a, Adams and others 1992, Chapman 1989, MacDonaicl and others J992). These approaches can be grouped into three categories: equilibrium-partitioning modeling, laboratory bioassays, and field studies. Each approach has particular strengths and weaknesses and each defines guidelines in different ways. Thus far, there is no general agreement as to which approach wiE provide the most reliable, flexible, and credible guidelines for evaluating sediment quality, However, sediment quality guidelines derived from the combination of the results of multiple methods have been recommended for a broad range of applications (Adams and others 1992, US EPA 1989b, Lorenzato and others 1991).
Using data available from an the major approaches to the development of effects-based criteria, Long and Morgan (1990) prepared informal guidelines for use by the National Oceanic and Atmospheric Administration (NOAA}. Subsequently, the data base with which these values were prepared was updated and expanded and the approach was refined (MacDonald 1993, Smith and MacDonald 1992). In both the NOAA (Long and Morgan 1990) and Florida (MacDonald 1993) studies, two guideline values were developed for each chemical.' These values defined three ranges in chemical concentrations that were an
t,icipated to be: Ul,~i':::i,2~~1ftl~~¥)J~.~i~:5~~0E~~1;~r~H:~;i:·~t;V(l'~:~$~ Hi€:ntltlc;3;tJCm of
has been recommended in the development of sediment quality criteria (US EPA 1992b).
The objectives of the present study are: (1) to
present updated guideline values based upon the expanded data base, (2) to quantify the percent incidence of adverse biological effects associated with the guidelines, and (3) to compare the guidelines with those developed with other data or methods, In this paper we determined the percent incidence of effects as a measure of the "accuracy" of the guidelines.
Methods
The methods used in this study have been described in detail (Long and Morgan 199D, MacDonald 1993, Smith and MacDonald 1992, Long 1992) and win be only summarized here. Sediment chemistry and biologicai effects data from numerous reports were assembled to support the derivation of the guidelines. The data base used by Long and Morgan (I 990) was refined by excluding data from freshwater
studies and including data from additional sites, bio-logical test end points, and contaminants (MacDonald 1993, Smith and MacDonald 1992). Briefly. the approach involved three steps: 0) assemble, evaluate, and collate aU available information in which measures of adverse biological effects and chemical concentrations in sediments were reponed; (2) identify the ranges in chemical concentrations tha.t were rardy, occasionally, or frequently associated with effects; and (3) determine the incidence of biological effects within each of the ranges in concentrations for each chemical as an estimate of guideline accuracy,
Development of a Biological Effects Database for Sediments
A biological effects database for sediments (BEDS) was developed to compile and integrate chemical and biological data from numerous studies conducted throughout North America. Nearly 350 publications were reviewed and screened for possible inclusion in the BEDS. Data from equilibrium-partitioning modding, laboratory spiked-·sediment bioassays, and field studies of sediment toxicity and benthic community composition were critically evaluated. Only matching, synoptically coHeeted biological and chemical data from marine and estuarine studies were included in the database. Data were excluded if the methods were not dearly described. Data were excluded if sediments were frozen before toxicity tests were initiated or if toxicity of controls was higher than commonlY acceptable. 1£ there was less than a tenfold difference in the concentrations of aU contaminants among sampling statIons, all data from that particular field study were excluded. The tenfold criterion was selected to
ensure that data were induded in the BEDS only from studies in which significant contaminant gradients were reported. Furthermore, data were excluded if the chemical analytical procedures were inappropriate for determining total concentrations in bulk sediments; for example, trace metals data were excluded if strong add digestions were not used. The majority of the data sets that were excluded were those in which either no biological data or no chemica! data were reponed. A total of 89 reports met ail the screening criteria and were induded in the BEDS. The screening criteria and their use vv'ere described previoU!~iy (MacDonald 1993, Smith and MacDonald 1992), The potential limitations of using data "encountered" from many different studies have been described (Long 1992).
The data entered into the BEDS were expressed on a dry weight basis. Only a minority of the reports induded measures of factors that are thought to influ

ence bioavailability (e.g., grain size, total organic carbon, acid-volatile sulfides). Sediment quality guidelines derived from the equilibrium-partitioning approach (US EPA 1988) were converted from units of organic carbon to units of dry weight, assuming a total organic carbon (TOC) concentration of 1.0%. These conversions were based upon a TOe concentratiOn of 1.0% since the overail mean TOC concentration in the BEDS was 1.2%. Data from spiked-sediment bioassays were incorporated directly into the BEDS.
Guideline values derived using the apparent ef.fects threshold (AET Barrick and others 1988) and national (SLC approach, Neff and others 1986) were entered
into the BEDS as reported'i\~~!'~J!~,~~:·~ah.tesmepr~§r9+~f-:r;g~"Bm9N.Jlt$'0:Kdat(lc(')mpneH·~fr6m·tnultiple SUB%@Ys. Therefore, extremely high and extremely 'low concentrations in some parts of study areas used to produce these values may be ameliorated by highs and lows in other regions, resulting in intermediate concentrations. Raw data from other individual field surveys that passed the initial screening steps were evaluated in "co-occurrence analyses" with either of two methods (Long 1992). If the statistical significance of the data was reported, then the mean chemi·· cal concentrations in the statistical groups (i.e., toxic and nontoxic) were compared. If no such statistical evaluations were reported, the frequency distributions of the biological data were examined, and mean concentrations in subjectively determined groups of samples were compared (e.g., most toxic versus least toxic). The extreme high and low concentrations reponed in individual studies, generally performed over relatively small spatial scales, were not masked by merging data from other studies.
To maximize the broad applicability of the guidelines, a wide variety of measures of adverse biological effects was included in the BEDS. The kinds of adverse effects induded: (1) measures of aitered benthic communities (depressed species richness or total abundance), significantly or rdativdy elevated sediment toxicity, or hi.stopathoiogical disorders in demersal fish observed in fidd studies; (2) EC50 or LCso concentrations determined in laboratory bioassays of sediments spiked "''lith single compounds or dements; and (3) toxicity predicted by equilibrium-partitioning models. An of the measures of effects were treated as if equivalent. However, by screening prospective data sets and including only those biOlogical data that were in concordance with chemical gradients, the prevalence of data from relatively insensitive measures of effects was minimized.
Each entry was assigned an "effectsino-effects" descriptor. An entry was assigned an "effects" descriptor (identified with an asteriSK in the data tables) if: (1) an adverse biological effect, such as acute toxicity, was reponed; and (2) concordance was apparent between the observed biological response and the measured chemical concentration.
The documentation supporting each BEDS record included the citation, the type of test or biological effect observed or predicted, the approach that was used, the study area, the test duration (if applicable and reported), the species tested or the benthic community considered, the total organic carbon (TOC) and acid··volatHe sulfide (AVS) concentrations (if reported), and the chemical concentration.
In our co-occurrence analyses of field-collected data entered into BEDS, an effects descriptor was assigned to data entries in which adverse biological effects were observed in association with at least a twofold devation in the chemical concentration above reference concentrations. Either "no gradient," "small gradient," or "no concordance" descriptors were assigned when no differences between stations were reported in the concentration of the chemical of concern, when mean chemical concentrations differed by Jess than a factor of two between the groups of samples, or when there was no concordance between the severity of the effect and the chemical concentration, respectively. In these cases, we assumed that other factors (whether measured or not) were more important in the etiology of the observed effect than the concentration of the contaminant considered. Finally, a "no effects" descriptor was applied to bioiogical data from background, reference, or control conditions.
Collectively, the effects data sets from the modeling, laboratory, and field studies were assigned an asterisk in the ascending tables and used to derive the guidelines. AU of the effects data were given equal weight in the guidelines derivation. CoUectively, data assigned no gradient, sman gradient, no concordance, and no effects descriptors were regarded as the noeffects data set.
Derivation ot Sediment Quality Guideiines
For each chemical, the data from BEDS were retrieved and arranged in ascending order of concentration in a tabular formal. These ascending data tables, as reported by Long and Morgan (1990) and updated by MacDonald (1993) and Smith and MacDonaid (1992), summarized the available information for each chemical or chemical group that was considered,
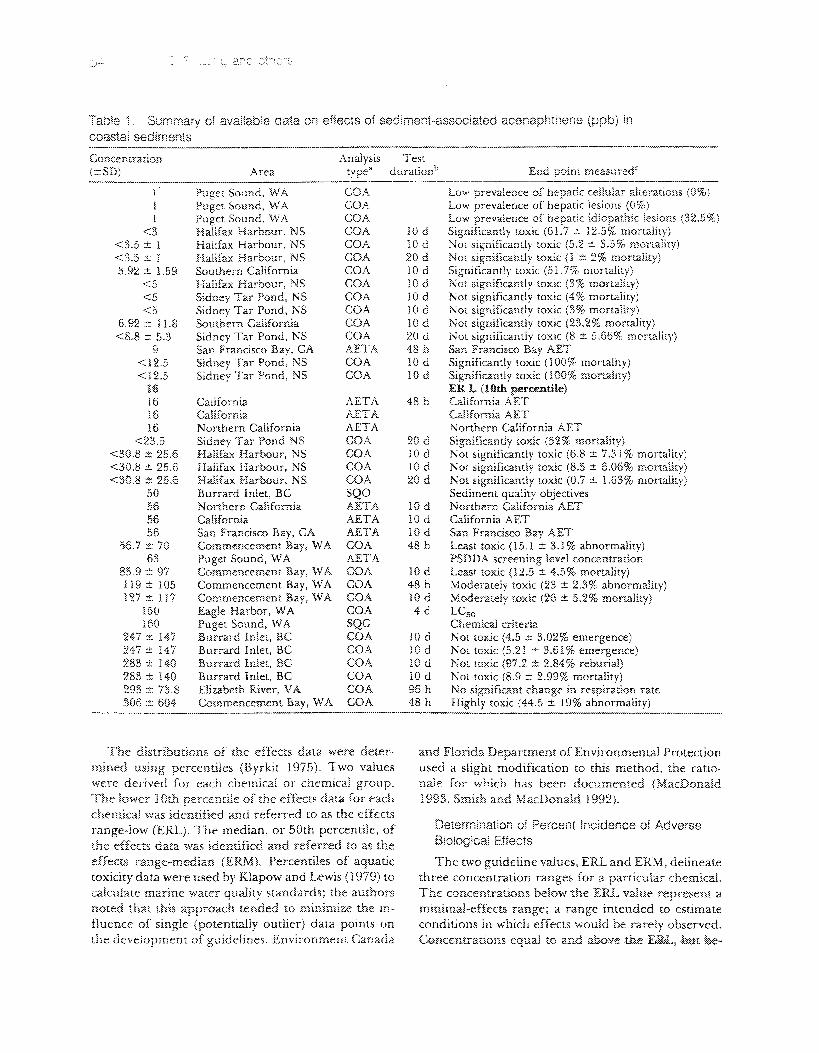
Table 1. Summary of avaHable data on effects of sediment-associated acenaphthene (ppo) in coastal sediments
Concent,atiofl Anaiysis Test (±SD) Area typea durationb End point measured"
Puget Sound, WA GOA Low Drevalence of henatic cellular alterations (0%) Puger Sound, WA GOA Low ~revalence of he~atic lesions (0%) Puget Sound, WA COA Lov-l prevalence of hepatic idiopathic lesions (32.5%)
<3 Halifax Harbour, NS COA lOd Significantly t.oxic (61.7 :t 12.5% mortaiity) <3.5 ± 1 Haiifax Harbour, NS eOA 10 d Not significantly toxic (5.2 ± 3.5% mortality) <3.5 ± J Halifax Harbour, NS eOA 20 d Not significantly toxic (l ± 2% mortality) 3.92 :t 1.59 Southern California eOA lOd Significantiy roxic (5 j .7% mortality)
<5 Halifax Harbour, NS COA lOd Not significantly toxic (3% mortality) <5 Sidney Tar Pond, NS COA 10 d Not significantly toxic (4% monality) <5 Sidney Tar Pond, NS eOA lOci Not significantly toxic (3% mortalit.y)
6.92 ::t 11.8 Southern California eOA lOci Not significandy toxic (23.2% mortality) <8.8 :t 5.3 Sidney Tar Pond, NS COA 20 d Not significantly toxic (8 ± 5.66% mortality)
9 San Francisco Bay, CA AETA 48 h San Francisco Bay AET <12.5 Sidney Tar Pond, NS COA 10 d Significandy toxic (l00% mortality) <12.5 Sidney Tar Pond, NS GOA 10 d Significantly toxic (100% mortality)
16 ."Ell L (10th percentile) 16 California AETA 48 h California AET 16 CaHfornia AETA California AET J6 Northern California AETA Northern California AET
<23.5 Sidney Tar Pond NS eOA 20 d Significantly toxic (52% mortality) <30.8 ± 25.6 Halifax Harbour. NS eOA lOci Not significantly toxic (6.8 ± 7.31 % mortality) <30.8.:t 25,6 Halifax Harbour, NS eOA 10 d Not. significantly toxic (8.5 ± 6.06% mortality) <30.8 ± 255 Halifax Harbour, NS eOA 20 d Not significantly toxic (0.7 :± 1.63% mortality)
50 Burrard Inlet, BC SQO Sediment quality objectives 56 Northern California AETA lOd Northern California AET 56 Caiifornia AETA 10 d California AET 56 San Francisco Bay, CA AETA 10 d San Francisco Bay AET
56.7 ± 70 Commencement Bay, W A eOA 48 h Least toxic (15.1 ± 3.1% abnormality) 63 Puget Sound, WA AETA PSDDA screening level concentration
85.9 ::t: 97 119 ± 105
Commencement Bay, WA Commencement Bay, WA
eOA COA
lOci 48 h
Least toxic (12 ..5 ± 4.5% mortality) Moderately toxic (23 ± 2.3% abnormality)
127±1l7 150
Commencement Bay, WA Eagle Harbor, WA
COA eOA
lOd 4d
Moderately toxic (26 ± 5.2% mortality) Leso
160 Puget Sound, WA SQG Chemical criteria 247 ± 147 Bu~rard Inlet, Be COA lOci Not toxic (4.5 ± 3.02% emergence) 247 :t 147 Burrard Inlet, BC eOA 10 d Not toxic (5.21 ± 3,61% emergence) 283 ± 140 Burrard Inlet, BC eOA 10 d Not toxic (97.2 ± 2.84% reburial) 283 ± 140 Burrard Inlet, BC eOA lOd Not toxic (8.9 ± 2.99% mortality) 293 ± 73.8 Elizabeth River, VA GOA 96 h No significant change in respiration rate 306 ± 604 Commencement Bay, WA eOA 48 h Highly toxic (44.5 ± 19% abnormality)
The distributions of the effects data were deter and Florida Department of Environmental Protection mined using percentiles (Byrkit 1975). Two values used a slight modification to this method, the ratio·· were derived for each chemical or chemical group. nale for which has been documented (MacDonald The lower 1Dth percentile of the effects data for each 1993, Smith and MacDonald 1992). chemical was identified and referred to as the effects
Determination of Percent Incidence of Adverse range-low (ERL). The median, or 50th percentile, of Biological Effects the effects data was identified and referred to as the
effects range·,median (ERM)" Percentiles of aquatic The two guideline values, ERL and ERM, ddineate toxicity data were used by Klapow and Lewis (1979) to three concentration ranges for a particular chemical. calculate marine water quality standards; the authors The concentrations below the ERL value represent a noted that this approach tended to minimize the In minimal-effects range; a range intended to estimate fluence of single (potentially outtier) data points on conditions in which effects would be Tardy observed. the development of guidelines. Environment Canada Concentrations equal to and above the ERLshut be

-._-_.~.--....~.~_..
Effects/no TOe effect;,{ (%)f Referenceg
NE NE NE NC 2 NE 2 NE 2 N" 3J 'oJ
NE 2 NE 2 NE 2 NE 3 NE 2
4'" 2* 2*
* 5
'" 5 5* 2
NE 2 Nf' 2 NE 2 NE 6
*
5 5
* *
4* NE 7 NE 8 NE 7
7 SG 7 * 9
0 NE 2.66 :t 2.15 1 NE 3.18 ± 2.1 1 NE 2.8 ± 1.96 1 NE 2.8 ± 1.96
'*
NE Cl L,
'" 7 ~~"-"..""~~"""'.~~""-"_."-------
(Continued)
An evaluation of the reliability of any proposed guidelines is essential to determine their applicability in ·sediment quality assessments, In this swdy, the reiiabiliry of the guidelines for each chemical was considered to be rdativdy high when: (1) agreed closely (wIthin factors of 3.0 or less) with those deveJ.oped with other methods and/or with guidelines developed with the same methods applied to different data; (2) the incidence of effects was low «25%) i.n the minimal-effects ranges; (3) the incidence of ef·· fects increased consistently and markedly in concordance with increasing chemical concentratsons; and
Speoes
Parophrys vetuLus (English sole) Parophrys vetulus (English sole) Parophrys vetulus (English sole) Rhepoxymu.s abronius (amphipod) Corophium volutator (amphipod) Neanthes sp. (polychaete) Grandulierella Japomca (amphlpod) Rhepoxymus abromus (amphipod) Corophium volutator (amphipod) Rhepoxymus abronzus. (amphipod) Grandidterella ]apomca (amphlpod) Neanthes sp, (polychaete) Oyster, mussel Corophium volutatoT (amphipod) Rhepoxymus abronius (amphipod) Mytil'US edulu (bivalve)
Benthic species Benthic species Nean,thes sp, (polychaete) Rhepoxyn~us abn)7uus (amphipod) Corophium voluiaio'r (amphipod) Neanthes sp, (polychaete) Aquatic biota Rhepoxymus abTomus (amphipod) Rhepoxynzus dmmtus (amphipod) Rhepoxynzus abmmus (amphipod) Oyster Aquatic biota Rhepoxymus abromus (amphiroa) Oyster Rhepoxymus abronzus (amphipod) Rhepoxymus abromus (amphipod) Benthic community Rhepoxymus abrontus (amphipod) Corophium 'Volutator (amphipod) Rhepoxynzus abromus (amphipod) Comphium volutator (amphipod) Palaemonetes pug-tO (grass shrimp) Oyster
low theERM,.~t;Pf~~erlt .apPMlple"effectsrange vyithjpwhicheffec~~wo:g~dQ9casioIl(illy()cqur:~Fim;~llX, the·coIlcentr(;ltior:tg.@Quivalent:to~2tnd.aJfJovetheERM v41w~•.re.pr;yse.p;~· ..a:pniJb§:bl~~~£fect~.xange within...wn;ch effect.sWQl;dclfrequerrtly'occur, The incidence of ad· verse effects. within each range was quantified by dividing the number of effects entries by the total number of entries and expressed as a percent. The ERL and ERM valu.es were derived with only the effects data set, whereas the calculations of the percent incidence of effects within each concentration range were based upon both the effects and no-effects data sets.
Life staged
ADT ADT ADT ADT ADT JOY JUV ADT ADT ADT JUY JOV LAR ADT ADT LAR
JUV ADT ADT JUV
ADT AD'I" ADT LAR
ADT LAR ADT ADT
ADT ADT ADT ADT ADT LAR

Table 1. (Continued)
Concentration Analysis Test (±SD) Area type" End point measured::: ._------ ----- durationD
350 ± 45.8 Burrard Inlet, BC eOA 10 d Not toxic (7.9 ± 5.12% mortality) 390 Bu,rare Inlet, BC eOA lOci Highly toxic (30.5% emergence) 390 Bunard lniet, BC eOA lOci Highly toxic (23 % emergence)
<403 Charleston Harbor, SC eOA High species richness (14.9 ± 2.04) SRUs <403 Charleston Harbor, se eOA Moderate species ,ichness (9.05 ± L33) SRUs <403 Charleston Harbor, SC COA Low species richness (5.16) SRUs <403 Ch.arleston Harbor, se eOA High species diversity (4.15 ± 0.59) SDUs <403 Charleston Harbor, SC COA Moderate species diversity (2.3 ± 0.2) SDUs <403 CharlestoD Harbor, SC eOA Low species diversity (1.16) SDUs
486 ± '714 Elizabeth River, VA eOA 96 h Not significantly toxic (4.5 ± 3.24% mortality) 500 Puget Sound, WA AETA 15 m j 986 Puget Sound AET 500 Puget Sound, WA AETA 48 h 1986 Puget Sound AET 500 ER. M (50th percentile) 500 Puget Sound, W A AETA 15 m 1988 Puget Sound AET 500 Puget Sound, WA AETA 48 h 1988 Puget Sound AET 500 Puget Sound, WA AETA 1986 Paget Sound AET 630 Puget Sound, WA AETA JOd 1986 Puget Sound AET 630
654 ± 1049 Puget Sound, WA Commencement Bay, WA
AETA eOA lOci
PSDDA maximum level criteria Highly toxic (78.5 :t 19.5% mortality)
679 ± 469 Elizabeth River, V A eOA 96 h Significantiy toxic (50.7 ± 39% mortality) 680 :t. 814 Elizabeth River, VA eOA 95 h Significant decrease in respiration rates
'730 Puget Sound, WA AETA 1988 Puget Sound AET 2000 Puget Sound, WA AETA 10 d 1988 Puget Sound AET
3031 ± 4271 Puget Sound, WA eOA 10 d High prevalence of hepatic lesions (26.7 ± 6,1%) 3031 ± 4271 Puget Sound, WA eOA High prevalence of hepatic idiopathic lesions
(88.0 :t 3.790) 3031 ± 4271 Puget Sound, WA COA High prevaience of hepatic cellular alterations
(44.1 ± 8.5%) 5599 ± 24,392 Eagie Harbor, WA eOA 10 d Least toxic (13 ± 7% mortality) 6522 ± 8915 Eagle Harbor, WA eOA 1{} d Moderately toxic (41 ± 9% mortality)
16,500 United States EqPA Chronic marine EqP threshold 39,557 ± 48,678 Eagie Harbor, WA eOA 10 d Highly toxic (955 ± 8.5 mortality) --------_.- _.,----_.----------
"Analysis type: eGA::.; co-occurrence analysis; AETA ::::: apparent effects threshold approach; EqPA = equilib,ium partitioning approach; SQO = sediment quality objective; SQG = sediment quality g-uideEne; SSBA "" spiked sediment bioassay approach; SLCA = screening level criteria approach,
bTest d:.Jration: d = day; h = hour; m = minute.
cEnd point measured; AET = apparent effects threshold; PSDDA "" Puget Sound dredge disposal analysis; LCso "" lethal concentratIon to
50% of the tested organisms; SRUs "" species richness units; SDUs = species diversity units.
dLife stage: ADT ::::: adult; LAR = larval; JVV = juvenile.
eEffectsfNo effects: NE = no effect; NC = no concordance; SG = small gradient; NG = no gradient; "' ::::: effects data used to calculate ERL and ERM values.
f1, Malins and others, 1985; 2, Tay and others, 1990; 3, Anderson and others, 1988; 4, Long and Morgan. 1990; 5, Becker and others. 1990: 6. Swain and Nijman. 1991; 7, Tetra-Tech, 1985; 8, US Army Corps of Engineers. 1988; 9, Swartz, and others. 1989; 10, Viashington Depanmem of Ecology. 1989; II. McLeay and others, 1991; 12, Alden and Butt, 1987; 13, Winn and others. 1989; 14, Beller and others, 1986; 15, PTI, Inc.. 1988; 16. CH2M·HiH, inc., 1989; 17, Bolton, 1985.
the incidence of effects was very high (>75%) in polynudear aromatic hydrocarbons (PAHs), three
the probable·effects ranges. The reliability of the dasses of PAHs (tmaI low moiecu1ar weight, total high guidelines t.hat failed to meet these evabation criteria molecular weight, and total PAH). and two pesticides was considered to be 1ower, (p,pl-DDE and total DDT). The data available for
acenaphthene and phenanthrene are shown in Tables 1 and 2, respectively, to iHustrate the format and con
Results tent of the ascending tables with which the guidelines ERL and ERM values were derived for 28 sub were derived. Space limitations preclude indusion of
stances: nine trace metais, total PCBs, 13 individual equivaient tables for all of the substances.

----------Life
Species staged
Rhepoxynius abronius (amphipod) ADT Rhepoxynlus abromus (amphipod) ADT COTophium volutator (amphipod) ADT Benthic species Bent.hic species Benthic species Benthic species Benthic species Benthic species Palaemonetes pugio (grass shrimp) ADT Microtox Crassostrea gigas (oyster) LAR
Microtox Cmssostrea gigas (oyster) LAR Benthic species Rhepoxyniw abronius (amphipod) Aquatic biota Rkepoxynius abronius (amphipod) ADT Palaemoneies pugio (grass shrimp) ADT Palaemonetes pugio (grass shrimp) ADT Benthic community R..hepoxynius abTonius (amphipod) ADT Parophrys vetulus (English sole) ADT
Parophrys vetulus (English sole) ADT
Paroj?hrys vetulus (English sole) ADT Rhepaxynius abronius (amphipod) ADT Rhepoxynius abronius (amphipod) ADT Aquatic biota . Rhepoxynius abronius (amphipod) ADT
Adverse effects measured in association with acenaphthene included high amphipod mortality in sediment toxicity tests, low species richness in benthic communities, high prevalence of liver lesions in demersal fish, and chronic toxicity preaicted by an equilibrium~partitioning model (Table 1). No data from spiked-sediment bioassays were available. As an exampie of the kinds of data analyses that were performed for entry into the BEDS, matching sediment chenlistry and amphipod mortality data from Commencement Bay (Washington) were evaluated in a cooccurrence analysis. The average concentration of acenaphthene was 85.9 ppb in the samples that were the ieast toxic to amphipods (12.5 ::t 4.5% mortaEty). This data entry was assigned a no-effects (ne) descriptor. In samples that were moderatdy toxic (26 ::t 5.2% mortality), the average concentration of acenaphthene was 127 ppb. The ratio of 127 ppb to 85.9 ppb was less than 2.0, therefore, the moderately toxic data entry was assigned a small-gradient descriptor. The
---_......•__...~._~.--_._._--
Effects/no Toe effectse (%)f Referenceg
NE 2.64 ± 2,14 11 SG 3.5 11 SG 3.5 11 NE 13 NG 13 NG 13 NE 13 NG 13 NG 13 NE 12 * 14
* 14
15*' 15 14* 14* 8*
'* 7 SG 12
12* 15*
* 15
*
*
1 NE 16 SG 16
>I< 17 16*
average acenaphthene concentration associated with highly toxic samples (78.5 ± 19.5% mortality) was 654 ppb, a factor 7J3-fold higher than the average concentration in the least toxic samples. It was assigned an asterisk and used in the calculation of the ERL and ERM values. A total of 30 data entries for acenaphthene were assigned effects designators. No biological effects were reported over the range of 1-8.8 ppb acenaphthene. The lower 10th percentile value of the effects data (the ERL) was 16 ppb and the median value (ERM) was 500 ppb, The percent incidence of adverse effects within the minimal-effects, possibleeffects, and probable-effects ranges >,'!ere 20%, 32%, and 84%, respectively.
Phenanthrene data were available from eguilibrium··partitioning studies, spiked sediment bioassays, and numerous field surveys performed in many different areas (Table 2). A total of 51 data entries were assigned effects designators in the phenanthrene database Adverse effects were not observed in asso

Table 2. Summary of available data on effects of sediment··associated phenanthrene (ppb) in coastal sediments
End point measun::dc
-------------------_. No significant change in liver somatic indices Not significantly toxic (3% mortality) Not significantly toxic (3% mortality) Sediment quality objectives Not significantly toxic (4% mortality) No signifcam change in kidney MFO induction Least toxic (23.3 ± 7.3% abnormal) No significant change in spleen condition indices San Francisco Bay AET 99% chronic marine criteria Not significant.ly toxic (23.2% mortality) Low occurrence of hepatic ceHular alterations (0%) Low prevalence of hepatic lesions ({}%) Low prevalence of hepatic idiopathic lesions (32.5%) Not significantly toxic (31.9 ± 15.5% abnormal) California AET Northern California AET Not significantly toxic (5,28 ± 3.04% mortality) Least toxic (18 ± 6.6% mortality) Not significantly toxic (18.4 :± 6.8% mortality) Significantly tox.ic (42.9 :± 19.2% mortality) Significantly toxic (5 L7% mort.a!lty) Not toxic (4.5 ± 3.02% emergence) Not toxic (5.21 :t 3.61% emergence) Moderately toxic (59.4 ± 11.3% abnormal) Moderately toxic (35.8 ± 4.7 mortality) Significantiy toxic (55.7 :± 22.7% abnormal) 95% chronic marine criteria ER L (lOth percentile) Highly toxic (67 :± 11.8% mortality) NSLC-marine California AET values Southern California AET values Southern California AET values Least toxic (15.1 ± 5.1% abnormality) No significant change in respiration rate PSSDA screening level concentration NSLC-marine Not significantly toxic (4.5 ± 3,24% mortality) Significant change in liver somatic indices High species richness (14.9 ± 2.04) SRUs Moderate species richness (9.05 :± 1.33) SRUs Low species richness (5.16) SRUs High species diversity (4.15 ± 059) snus Moderate species diversity (2.3 ±: 0.2) SDUs Low species diversity (l.16) SDUs Not significantly toxic (6.8 ± 7.31 % mortaEty) Not significantly toxic (0.7 ± 1.63% mortality) Not significantly toxic (8.5 :± 6.06% mortality) Highly toxic (92.4 ± 4.5% abnormal) Least toxic (12.5 ± 4.5% mortahty) Significant increase in kidney MFO inductIon Northern California AET California AET San Francisco Bay AET Moderately toxic (23 :t 2.3% abnormality)

Species--------------_. Pseudopleuronectes amencanus (flounder) Rhepo.~ynius abmnius (amphip~d) Rhepoxyni~ abronius (amphipod) Aquatic biota Corophium volutatoT (amphipod) Pseudopleuronectes amencanus (flounder) Bivalve Pseudopleuronectes americanus (flounder) Oyster, mussel Aquatic organisms GrandidiereUa japonica (amphipod) Farophyrs vetulus (English sole) Faraphyn vetulus (English sale) Parophrys vetulus (English sale) Bivalve Mytiius edulis (bivalve) Benthic species kmpeiisca abdita (amphipod) Rhepoxynius abronius (amphipod) Rhepoxynzus abronius (amphipod) Rhepoxynius abronius (amphipod) Grandidierella japonica (amphipod) Rhepoxynius abronius (amphipod) Corophium volu,tator (amphipod) Bivalve Rhepoxynius abroni1ts (amphipod) Bivalve Aquatic organisms
RhepoX'ynius abronius (amphipoa) Benthic species Benthic species Benthic species Rhepoxynius abromus {amphipod) Oyster Palaemonetes jrdglo (grass shrimp) Aquatic biota Benthic species Palaemonetes puglo (g,ass shrimp) Pseudopleuronectes amencanus (flounder) Benthic species Benthic species Benthic species Benthic species Benthic species Benthic species Rhepoxynius a/mmius (amphipod) Neanthes species (polychaete) COTophium volutatoT (amphipod) Bivalve Rhepoxynzus abroni:l1s (amphipoa) Pseudopleuronecte.:: amen-wnus (flounder) Rhepo;ynius abronius (amphipod) RhepoX'ymus abronius (amphirod) Rhepoxynius abronius (amphirod) Oyster
~~.*_.._--_..
Life Effects/no staged effectse
J\DT NE ADT NE ADT N£
N£ ADT NE ADT NE LAR NE ADT l"~E
LAR * ;;:
JVV NE ADT NE ADT NlI ADT NE LAR N"C'
~~
LAR * *
ADT NE ADT NE ADT NE ADT SG JUV SG ADT NE ADT NE LAR '" ADT SG LAR SG
*
ADT SG
*
ADT LAR NE ADT NE
NE *
ADT NE ADT *
NE NG NG NE NG NG
ADT NE JDV NE ADT NE LAR ADT NE ADT * ADT '" ADT * ADT * LAR '" -----
Toe (%) Reference f
18 2 2 6 2
18 4:
18 4
19 3 I 1 1 4 5 5
20 4 4 4 3
2.68 ± 2.15 11 3.18=2.1 11
4 4 4:
19
4 21
5 5 5 7
12 8
21 12 18 13 13 13 13 13 1~Iv
2 2 2 4 7
18 5 5 4 7
~-----_...._--_.~------~---
(Continued)

-------- -----
Table 2. (Continued) ~~~---..".""""'- ~"",~"""""",,,"""-"""''''~.''''"''''''.'"'''"'-''''
Concentration Analysis Test c(±SD) Area type" duration b End point measurea
597 Commencement Bay, VIA COA lOd Moderately toxic (26 :t 5.2% mortality) 670 Laboratory SSBA -4 rna Significant change in spleen condition indices
918 ± 1395 Burrard Inlet, BC COA 10 d Not toxic (97.2 ± 2.84% reburial) 918 :1: 1395 Burrara I Dlet, Be COA lOd Not toxic: (8.9 ± 2.99% mortality)
950 Eagle Harbor, W A COA 4d Leso 987 ± 1654 Elizabeth River, VA COA 96 h Significant decrease in respiration rates
1000 Puget Sound, WA SQG Chemical criteria 1020 Unhed States EQPA Interim marine sediment quality criteria (FeV)
1213 :;t 154'7 Burrard Inlet, BC eOA lOd Not toxic (7.9 ± 5.12% mortality) <1267 ± 2528 Halifax Harbour, NS eOA 20 d Not significantly toxic (1 ± 2% mortality) <1271 ± 2526 Halifax Harbour, NS eOA lOd Not significantly toxic (5.2 ::t 3.5% mortality)
1379 ± 2545 Commencement Bay, WA COA 18 h High tox.ic (44.5 ± 19% abnormality) 1500 Paget Sound, WA AETA 15 m 1986 Puget Sound AET I5DO Puget Sound, WA AETA 48 h 1986 Puget Sound AET 1500 Puget Sound, W A AETA 15 m 1988 Puget Sound AET 1500 ER M (50th percentile) 1500 Puget Sound, W A AETA 48 h 1988 Puget Sound AET
<1688 ± 2920 Halifax Harbour, NS eOA 96 h Significantly toxic (61.7 ± 12.5% mortal.ity) 1913 ::t 2693 Elizabeth River, VA eOA 10 d Significantly toxic (50.7% ± 39% mortality)
2142 Eagle Harbor, WA COA 10 d Moderately toxic (41 ::t 9% mortality) 2600 Eagie Harbor, WA COA 10d Least toxic (13 ± 7% mortality) 2838 Commencement Bay, WA COA 10 d Highly toxic (78.5 ::t J9.5% mortality) 3000 Burrard Inlet, BC COA 10 d Highly toxic (30.5% emergence) 3000 Burrard Inlet, BC eOA lOd Highly toxic (23% emergence) 32GO Puget Sound, W A AETA PSDDA maximum level criteria 3200 Puget Sound, WA AETA 1988 Puget Sound AET 3680 Eagle Harbor, WA COA 4d Leso 5400 Puget Sound, WA AETA 10 d 1986 Puget Sound AET 5400 Puget Sound,.W A AETA 1988 Puget Sound AET 6900 Puger Sound, WA AETA JOd i 988 Puget Sound AET
JO,OOO Laboratory SSBA JOd Significant toxicity 11,656 ± 14,472 Puget Sound, WA COA High prevalence of hepatic lesions (26.7 :;t 6.4%) 11,656 :t 14,472 Puget Sound, WA COA High prevalence of hepatic idiopathic lesions
(8RO ± 3.7%) 11,656 :2: 14,472 Puget Sound, WA GOA High prevalence of hepatic cellular alt.erations
(44.2 :±: 8.5%) 14,000 United States EqPA Chronic marine EqP threshold 14,000 Unhed States EqPA EPA acute marine EqP threshold
>30,000 Laboratory SSBA 14 d LCso >30,000 Laboratory SSBA 14 d IJC 50
33,603 Eagle Harbor, W A eOA JOd Highly toxic (95.5 ::t 8.5% mortality) <45,903 ± 64,909 Sidney Tar Pond, NS eOA 20 d Not significandy toxic (8 ± 5.66% mortality)
91,800 Sidney Tar Pond, NS eOA IOd SignifICantly toxic (lOO% mortality) 91,800 Sidney Tar Pond, NS eOA JOd Significantly toxic (100% mortality)
105,500 Elizaheth River, VA eOA 28 d LC50 484,000 Sidney Tar Pond, NS eOA 20 d Significantly toxic (52% mortality)
2,363,200 Elizabeth River, VA eOA 24 h LC50
4,220,000 Elizabeth River, VA COA 2h Highly toxic (100% mortality) ____~~_·u.~ ---_. dAnalyslS type: eGA == co-ocurrence analysis; AETA = apparent effects threshold approach; EqPA = equilibrium parutiomng approach, SQO =sediment quaiity objective; SQC = sediment quality guideline; SSBA ::z spike sediment bioassay approach: SLCA = screenin.g level criteria approach.
bTest duration- d = d3_Y; 11 ::z hour: min == minme; mo:::: f11onth.
cEnd poim measured: ER L = effects range low; ER M = effects ran.ge-median; AET =apparent effects threshold; PSDDA = Puget Sound dredge disposal analysis; organisms; SRUs = species richness units; SDUs = species diversity units; MFO = mixed-function oxidase; Fev '" fir;al chronic value; LCs{) '" lethal concentration to 50% of the tested organisms: EPA == Environmental Protection Agency

-----------, ...._.~....._._---_._._..._.~_ .._--Life Effects/no Toe
Species staged effectse (%) Reference f
--..~..._-.~-_ ..._.._--------------_._-------------Rhepoxymus abromus (amphipocl) ADT '" 7 Pseudopleuronectes amencanus (flounder) ADT * 18 Rhevox'Vniu..s abronius (amphipod) ADT NE 2.8 ± 1,96 11 Cor~phium volutator (amphipod) ADT N~ 2.8 ± L96 1]
Rhepoxynw.s abram/us (amphipod) jUV/ADT * 9 Palaemonetes puglo (grass shrimp) ADT * 12 Benthic community '* 10 Benthic community NE 1 22 Rhepoxynius ab1'Onius (amphipod) ADT NE 2.64 ± 2.14 l'leanthes species (polychaete) JUV NE 2 Corophium volutator (amphipod) ADT NE 2 Oyster LAR >\: 7 MiCfotox '" 14 Crassostrea gzgflS (oyster} LAR * lli Microtox *
Crassostrea gigas (oyster) LAR * 15 Rhepoxynius abronius {amphipoa) ADT '" 2 Palaemonetes pugio (grass shrimp) ADT '" 12 Rhepoxynius abronius (amphipod) ADT NC 16 Rhepoxymus aV1'Onius (amphipod) ADT NE 16 Rhepoxynius abnmius (amphipod) ADT * 7 Rhepoxynius abromus (amphipoa) ADT * 3.5 11 Corophium volutator (amphipod) ADT * 31':· 11 Aquatic biota 8 Benthic species * 14 Rhepoxynius abronius (amphipod) JUV/ADT * 9 Rhepoxynius abronius (amphipod) ADT 14 Benthic community ADT '" 15 Rhepoxynius o.,bromus (amphipoa) ADT * 15 Rhepoxynius abronius (amphipoa) ADT * 0.9 23 Po.,nJphrys vetulus (English sale) ADT '* 1 Po:roph'rys vetulus (English sale) ADT * 1
Parophrys vetulus (English sole) ADT *
Aquatic biota * 1 17 Aquatic biota '* 1 24 GranduiiereLl:z japonica (amphipoa) ADT 0.1 25 Grandidierella japonica (amphipod) ADT 25 Rhepoxynius abronius (amphipod) ADT * 16 Neanthes species (polychaete) JUV NE 2 Corophium volutator (amphipod) ADT '* 2 Rhepoxynius ahronius (amphipod) ADT '* 2 Leiostomu,s xanth'uras (spot) JUV * 26 Neanthes species (polychaete) JUV * 2 Leiastomus xanthurus (spot) JUV * 26 Lewstomus xanthurus (spot) JUV * 26 (jLTf~:-;-t~ge: ADT:= adult; LAR = Jarval;jUV = juvenile. . _ __._-_.. ..---.- ---
eEffects/no effects: NE = no effect; NC = no concordance; SG "" small gradient; NG := no gradient; * "" effects data used to cakulate ERL and ERM values.
Malins and others, 1985: 2, Tay and others, 1990; 3, Anderson and others, 1988; 4, Long and Morgan, 1990; 5, Becker and others, 1990; 6, Swain and Nijman, 1991; 7, Tetra-Tech, 1985; 8, US Army Corps cfEngineers, 1988; 9, Swartz and others, 1989; J.O, Washington Department of Ecology. J989; 1j, McLeay and others, 1991; 12, Alder: and Butt, ;98'1: 13, Winn and others. 1989:. 14, BeHar and others. 1986; 15, PTl, Inc, 1988; 16, CH2M-Hi!l, Inc., 1989; 17, Bolton, 1985; 18, Payne and others, 1988; 19, Paviou and others, 1987; 21, Neff and others, 1986; 22, US EPA, 1988; 23, P!esha and others, 1988; 24, Lyman and others, 1987; 25, SCCWRP, 1989; 26, Roberts and others, 1989.
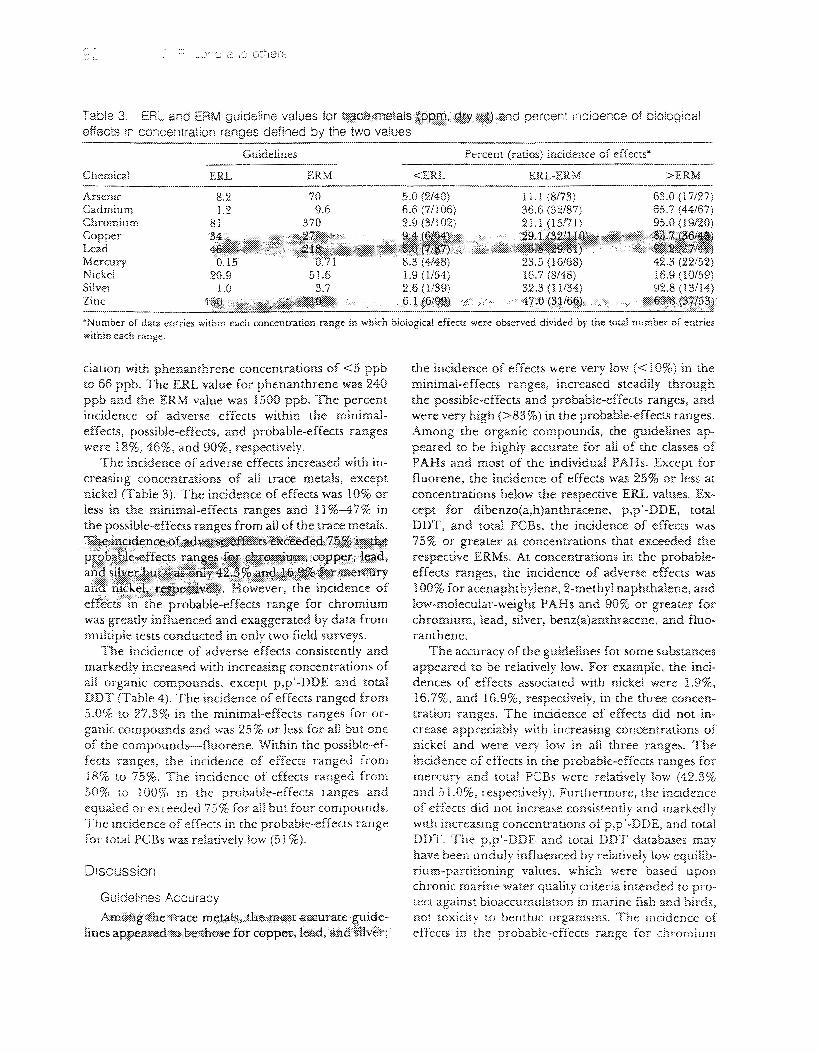
Table 3. ERL and ERM guideline values for tH~.oe mlf3tlalstt\w~tltfl.>H~m>i}w.~f;~)~a! percent incidence of biological effects In concentration ranges defined by the two
Guidelines Percent (ratios) incidence of effectsa
Chemical ERL ERM <ERL ---~"---~-""'--------------------ArsenIC Cadmium Chromium Copper Lead Mercury Nickel 20.9 51,6 1,90/54) Silver 1.0 3.7 2.6 (1/39) Zinc
ERL-ERM >ERM
11.1 (8/73) 36.6 (32/87) '>'...... l.
16.7 (8/48) 16.9 (10/59) 32.3 (11/34) 92.8 (l
"Number of d.ata entries withm each concentration range in which biological effects were observed divided by the total number of entries within each range.
ciation with phenanthrene concentrations of <5 ppb to 66 ppb. The ERL value for phenanthrene was 240 ppo and the ERM value was 1500 ppb< The percent incidence of adverse effects within the minimaleffects, posslble··effects, and probable-effects ranges were 18%,46%, and 90%, respectivdy.
The incidence of adverse effects increased with increasing concentrations of aU trace metals, except nickel Cfable 3). The incidence of effects was 10% or less in the minimal-effects ranges and 11 %-47% in the possible-effects ranges from aU of the trace metals.
mC!C1e:nce of probable-effects range for chromium
was greatly influenced and exaggerated by data from multiple teSts conducted in only two fidd surveys.
The incidence of adverse effects consistently and markediy increased with increasing concentrations of aU organic compounds, except p,pl-DDE and total DDT Crable 4). The incidence of effects ranged from 5.0% to 27.3% in the minimal-effects ranges for organic compounds and was 25% or less for an but one of the compounds-fluorene. Within the possible-effects ranges, the incidence of effects ranged from 18% to 75%. The incidence of effects ranged from 50% to 100% m the probable-effects ranges and equaled or exceeded 75% for aU but four compounds. The mcidence of effect.s in the probable-effects range for total PCBs was relatively low (51 %).
Discussion
Guidelines Accuracy
Am0ftg .•thettacei~~ta:ls, .. th~··111~~tep.(}llrate·quide~ linesappeal'ed.tobe>thQse:rorcoppcr,lead, anclsHver;···
the incidence of effects were very low « 10%) in the minimal-effects ranges, increased steadily through the possible-effects and probable-effects ranges, and were very high (>83%) in the probable-effects ranges. Among the organic compounds, the guidelines appeared to be highiy accurate for all of the dasses of PAHs and most of the individual PAHs. Except for fluorene, the incidence of effects was 25% or less at concentrations below the respective ERL vatues. Except for dibenzo(a,h)anthracene, p,p'-DDE, total DDT, and total PCBs, the incidence of effects was 75% or greater at concentrations that exceeded the respective ERMs. At concentrations in the probableeffects ranges, the incidence of adverse effects was 100% for acenaphthylene, 2-methyl naphthalene, and low-molecular-weight PAHs and 90% or greater for chromium, lead, sHver, benz(a)anthracene, and fluoranthene.
The accuracy of the guidelines for some substances appeared to be relatively low. For example, the incidences of effects associated with nickel were 1.9%, 16.7%, and 16.9%, respectively, in the three concentratiDn ranges. The incidence of effects did not increase appreciably with increasing concentrations of nickel and were very low in aU three ranges. The incidence of effects in the probable-effects ranges for mercury and total PCBs were relativdy low (42.3% and 51.0%, respectively). Furthermore, the incidence of effects did not increase consistently and markedly With increasmg concentrations of p,p'-DDE, and totai DDT, The p,pl-DDE and total DDT databases may have been unduly influenced by relativdy low equilibrium-partitioning values, which were based upon chronic marine water quality criteria intended to protect against bioaccumulation in marine fish and birds, not toxicity to benthIc orgamsms. The mcidence of effects in the probable-effects range for chromium

Tabio 4. ERL and ERM guideline values for organic compounds (ppb, dry vvt) and percent inclc·ence of biological effocts in concentraton ranges defined by the two values
Chemical ---.~.~.~-.~
Acenaphthene Acenaphthylene Anthracene Fluorene 2-MethyI naphthalene N,apht.h~lene Pnenanmrene Low-molecular weight PAH Benz{a)anthracene Benzo(a)pyrene Chrysene Dibenzo(a,h)amhracene Fluoranthene Pyrene High molecular weight. PAH Total PAH p,p'~DDE
Total DDT Total PCBs -~ ..~~............,......,.
Guidelmes Percent (ratios) incidence of effects"
ERL ERM <ERL ERL-ERM >ERM ~~~~,....~.~-,.~-------~-----,",-~-~...,.._--~.,.
16 500 20,0 (3/15) 32.4 (l U34) 84.2 06/19) 44 640 14.3 (117) 17.9 (5/28) 100 (9/9) 85.3 1100 25.0 (4/1 6) 44.2 (19/43) 85.2 (23/27) 19 540 27.3 (31ll) 36.5 (19/52) 86.7 (26/30) 70 670 12.5 (2!l6) 73.3 (11115) 100 (15/15)
160 2100 16,0 (4/25) 41.0 (16/39) 88.9 (24/27) 240 1500 18.5 (5/27) 46.2 (18/39) 90.3 (28/31) 552 3160 13.0 (3/23) 48.1 (13/27) 100 (16/16) 261 1600 21.1 (4/19) 43.8 (14/32) 92.6 (25/27) 430 1600 10.3 (3/29) 63.0 (17/27) 80.0 (24/30) 384 2800 19.0 (4/21) 45.0 (18/40) 88.5 (23/26)
63.4 260 1 i ..5 (3/26) 54..5 (12/22) 65.7 (16/24) 600 5100 20.6 (7/34) 63.6 (28/44) 92.3 (36/39) 665 2600 17.2 (5/29) 53.1 (17/32) 87.5 (28/32)
1700 9600 10.5 (2/19) 40,0 (10/.25) 81,2 (13/16) 4022 44792 14.3 (3/21) 36.1 (13/36) 85.0 (17/20)
2.2 27 5.0 (1/20) 50.0 (1O/20) 50.0 (12/24) 1.58 46.1 20.0 (2/10) 75.0 (l2n6) 53.6 (15/28)
22.7 180 18.5 (5/27) 40.8 (20/49) 51.0 (25/49) ~ ..~~~ ........~~...
"Number of dat.a entries within each concentration range in which biologicai effects were observed divided by the total number of entries within each range.
ostensibly appeared to be very high but was unduly exaggerated by data from multiple tests performed in oniy two studies.
Comparisons with Other Guidelines
Agreement within a factor of 3 or less among guidelines developed with different methods has been recommended by a pand ofexperts as an indication of good precision (Lorenzato and others 1991), In the foHowing discussion, the comparisons of guidelines were conducted by determining the ratios between them, i.e., the larger of the two values was divided by the smaller vaiue.
The ERL and ERM values reponed in Tables 3 and '1 were based upon a considerable expansion and revision of the database used by Long and Morgan (1990). The quantities of data used to derive the present values exceeded those used previously by factors of 1.4 to 2.6. About 30%-50% of the data used in the present analysis came from the database used previously. Furthermore, the considerable amounts of freshwater data in the previous database were deleted in the present analysis. Of the 25 ERL values derived in the two analyses, seven remained unchanged, nine decreased, and nine increased. The ratios between the two sets of ERL values ranged from 1.0 to 9.4 (average of 1.88, N = 25), The ERL values for only two su.bstances changed by factors greater than 3.0 x:
arsenic (decreased by 4.2x); and acenaphthene (decreased by 9.4 X). The ratios bet·ween the two sets of ERM values ranged from LO to 7.6 (average of L63, N = 25). The average ratios between the two sets of ERM values was 1.2 for the individual PAHs and 1.5 for the trace metals; seven remained unchanged, seven decreased, and eight increased. Only one ERM value changed by a factor greater than 3.0: total DDT (decreased by 7.6x). The ERL and ERM values for p,p'-DDE increased by factors of 1.1 and 1.8, respectively. The ERL value for total PAHs remained unchanged and t.he ERM value increased by a factor of 1.3. The results of these comparisons indicate that the guidelines are relatively insensitive to changes in the database, once the minimum data requirements have been satisfied.
The national sediment quality criteria proposed by the US Environmental Protection Agency for fluoranthene, acenaphthene, and phenanthrene in salt water are based upon equilibrium-partitioning models (US EPA 1993a-e). The proposed mean criterion for fiuoranthene is 300 tJ.-g/g organic carbon (with 95% confidence limits of 140 and 640 f.Lg/goc). For acenaphthene the mean criterion is 240 tJ.-g/goc (with 95% confidence limits of 110 and 500 Il.g/goc). For phenanthrene the mean criterion is 240 jJ..g/goc (with 95% confidence limits of 110 and 510 lLg/goc). Assuming 3 TOC concentration of 1%, these criteria

values are eqmvalent to 3000 (1400-·-6400) ppb dry weight for fluoranthene; 2400 (1 J00-5000) ppb dry weght for acenaphthene; and 2400 (1100-·5100) ppb dry weight ~or phenanthrene. The mean criteria ex~
ceeded the ERM values of :500 ppb for acenaphthene and 1500 ppb for phenanthrene by factors of 4,8, and 1.6, respectively. The criterion for fluoranthene was lower than the ERM by a factor of 1.7. The criteria expressed in units of dry weight would increase with increasing TOe concentrations.
The ERL and ERM values generany agreed within factors of two to three with freshwater effects-based criteria issued by Ontario (Persaud and others 1992). Lowest effect levels and severe effect levels were reported, based upon a screening level concentration (SLC) approach applied to matching benthic community and sediment chemistry data. The ratios between the present ERL values and the lowest effect levels for Ontario ranged from 1.25 to 3.1 (average of 1.7) for eight trace metals (As, Cd, Cr, Cu, Pb, Hg, Ni, Zn). The ratios between the present ERM values and the severe effect levels for Ontario ranged from 1.0 to 3.4 (average of2.0) for the same eight trace metals. Of the 16 comparisons, the ERUERM values were lower than the respective values for Ontario in six cases and higher in ten cases.
Among aU of these comparisons, most of the guidelines agreed within the recommended factor of 3.0 or less, In the worse case, two values (previous and present ERL values for acenaphthene) differed by a factor of 9.4.
Merits of the Approach
This approach attempts to identify the concentrations of toxicants that are rarely associated with adverse biological effects and those usually associated with effects, based upon data from many studies. The advantages of this approach are that guidelines can be developed quickly with existing information and that they are based upon data gathered from many different studies.
from an available sources were considered in this study, including those from equilibrium-partitioning models, spiked sediment bioassays, and numerous field surveys. The modeling and bioassay methods differ considerably from those used in the field studies, since they generally are performed with single chemicals as if they were acting alone. The field studies invariably involve complex mixtures of con
taminants, acting synergistically, additively, or antagonistically. Whereas the modeling stl+dies and spiked sediment bioassays can be used to establish causeeffect relationships for single chemicals, the data from field studies cannot establish such relationships. However, the data from field studies of comptex mixtures reflect real-world, natural conditions in ambient sediments. We believe that the most meamngful assessment tools are those that are based upon evidence from and agreement among aU three of these methods. If data compiled from different study areas with different pollution histories and physical-ehemical properties converge upon ranges of contaminant concentrations that are usually associated with effects, then guidelines derived from those studies should be broadiy applicable to many other areas and situations. Therefore, in this report, the data from numerous studies were used to identify the concentrations of mdividual chemicals that were rarely. occasionally, and usually associated with effects.
The bio£ogical data compiled for derivation of the guidelines included a variety of different taxonomic groups and toxicological end points, The sensitivities of the taxa to toxicants may have differed considerably, and, therefore, contributed to variability in the data base. However, we beheve that. the inclusion of data. from multiple taxa ensures the broad appEcability of the guideHnes and the protection of a diversity of organisrns,
The bioavailability of sediment-associated contaminants is controBed to a large degree by certain physical-chernical properties of the sediments. For example, high acid-volatile sulfide (AVS) concentrations appear to reduce the bioavailability of cadmium, and, possibly, other trace metals in sediments (DI Toro and others 1990). Similarly, the influence of increasing TOC concentrations in reducing the bioavailability of many nonionic organic compounds has been demonstrated in modeling and laboratory studies (Di Toro and others 1991, Swartz and others 1990, Pavioli and others J987). Significant differences in tOXICity can occur at similar toxicant concentrations over relativdy sman ranges in TOe andlor AVS concentrations (Ad-ams and others 1992). It has been argued that sediment quality cnteria are indefensible if they do not account for factors that control bioavailabihty (Di T oro and others 1991). The data evaluated in the present analysis were not normalized to eIther TOe or AVS concentrations, since only a sman minority of the reports that were encountered included results for these parameters. Nevertheless, the present eval.uation indicates that the guidelines derived using the approach reported herein are accurate for most
chemicals and agree reasonably wen with other guidelines. Therefore, they are likely to be reliable tools in sediment quality assessments.
While factors that are thought to control bioavailabiEty were not considered explicity, surely they were operative in the tests of field-collected sediments and influenced the bioavailability of all of the potential toxicants. However, the data that were encountered indicated that TOe concentrations usually ranged from 1% to 3% in most study areas. In contrast, the concentrations of some chemicals differed by several orders of magnitude among the same samples. These observations suggest that, over these large concentration gradients, the relatively small differences in TOe and/or A VS concentrations may have been relatively unimportant in controlling toxicity or, otherwise, were masked in the data analyses.
Since the data bases used to develop the present guidelines induded data from many field studies, the guidelines may tend to be more protective than those based upon only single-chemicai approaches. The cumulative (e.g., synergistic) effects of mixtures of toxi~
cants in ambient sediments, including those not quan~
tified may tend to drive the apparent effective concentrations of individual toxicants downward (i.e., wward lower concentrations).
Condusions
Based upon an evaluation of existing data, three ranges in chemical concentrations were determined for 28 chemicals or chemical classes. These ranges were defined by two guideline values: the lower 10th percentile (ERL) and the 50th percentile (ERM) of the effects data distribution. The incidence of biological effects was quantified for each of these ranges as an estimate of the accuracy of the guidelines. The ind·· deuce of effects usuaHy was less than 25% at concentrations below the ERL values. For most chemicals, the incidence of effects increased markedly as the concentrations increased. Furthermore, the incidences of effects often were greater than 75% (occasionally 100%) at concentrations that exceeded the ERM values. However, for a few chemicals (especially mercury, nickel, total PCBs, total DDT, and p,p'DDE) there were relatively weak relationships between their concentrations and the incidepce of effects, The guideline values reported herein generally agreed within factors of 3 x or less with guidelines derived earEer using the same methods applied to a different data base and with guidelines developed with other methods. The numericai guidelines shouid be used as informal screening tools in environmentai
assessments. They are not intended to preclude the use of toxicity tests or other measures of biological effects. The guidelines should be accompanied by the information on the incidence of effects. The percent incidence data may prove useful in estimating the probability of observing similar adverse effects within the defined concentration ranges of particular contaminants.
,A.cknovvledgments
Encouragement, suggestions, and advice were provided by: Mary Baker-Matta (NOAA); Herb Windom (Skidaway Institute of Oceanography); Steve Schropp (Taylor Engineering); Chris IngersoH (US Fish and Wildlife Service); Mike Wong, A, Brady, D. McGirr (Environment Canada); M,L Haines, K. Brydges, B. Moore, B.L. Charlish (MacDonald Environmental Sciences Ltd,); and Gail Sloane and Tom Seal (Florida Department of Environmental Regulation), Initial drafts of the manuscript were reviewed by: Douglas Wolfe, Andrew Robertson, Thomas O'Connor, Mary Baker-Matta, Peter Landrum, William Conner, and Suzanne Bolton (NOAA).
Literature Cited
Adams, W. j., R. A. Kimerle, and J. W. Barnett, Jr. 1992. Sediment quality and aquatic Efe assessment. Environmental Science and Technology 26(10):1863-1876,
Alden, R. W., HI, and A.j. Butt. 1987. Statistical dassification of the toxicity and polynudear aromatic hydrocarbon contamination of sediments from a highly industrialized seaport. Envirvnmemal Toxicology and Chemistry 6:673-684.
Anderson, J. M., S. M. Bay, and B. E. Thompson. 1988. Characteristics and effects of contaminated sediments from southern California. SCCWRP Contribution No. G·297 Long Beach, California. Southern California Coastal Water Research Project, 120 pp.
Barrick, R., S. Becker, L. Brown, H. Bdler, and R. PastoroK. 1988. Volume 1. Sediment quality vaiues refinement: 1988 update and evaluation of Puget Sound AET. EPA Contract No. 68-01-4341. PTI Environmental Services, Bellevue, Washington, 144 pp.
Becker, H., R. Barrick, and L. B. Read, ]990. Evaluation of the AET approach for assessing contammation of marine sediments in California. Report No. 90-S·WQ. Prepared by PTI Environmental Servic:e5, Bellevue, Washington. California State Water Resources Control Board, Sacramento, California, 258 pp.
BeHar, H., R. Barrick, and S. Becker. 1986. Devdopment of sediment qual~ty values for Puget Sound. Prepared by Tetra Tech, Inc., for Resource Pianning Associates/US ATmy Corps of Engineers, Seattle District for the Pugel ~oun~ Dr~dged ?~sposaJ Analysis Program. Tetra Tech. me., beattie, Washmgton.

96 E. R. Long and others
Bohon, H. S., R.J. Breteler, B. W. Vigon,]. A. Scanlon, and?L. Clark. 1985. National perspective on sediment qual~
!ty. Prepared by BatteEe Institute, Washington, DC, for US EPA Contract No. 68-0 1~6986. US Environmental Protection 'Agency, Washington, DC.
Burton, G. A., Jr. 1992. Sediment toxicity assessment. Lewis Pubhshers, Chelsea, Massachusetts, 457 pp.
Eyrkit, D. R 1975. Elements of statistics, 2nd ed. D. Van Nostrand, New York, 431 pp.
Chap:uan, P. M. 1989. Current approaches to developing sedIment quality criteria. Environmental Toxicology and Chemistry 8:58S-599.
CH2M-Hill, Inc. 1989. Data report. Volu.me 1, sediment data part 1 of 3. Remedial investigation Eagle Harbor site. Kitsap County, Washington. US EPA Hazardous Site Control Division Contract No. 68-01-7251. Bellevue, Washington, 151 pp.
Di Toro, D. M., J. D. Mahony, D. J. Hansen, K. J. Scott, M. B. Hicks, S. M. Mayr, and M. S. Redmond. 1990. Toxicity of cadmium in sediments: The role of acid volatile sulfide. Environmental Toxicology and Chemistry 9: 1487-1502.
Di Toro, D. M., C. S. Zarba, D.J. Hansen, W.]. Berry, R. C. Swartz, C. E. Cowan, S. P. Pavlou, H. E. ABen, N. A. Thomas, and P. R. Paquin. 1991. Technical basis for estabhs~ing sediment quality criteria for nonionk organic chemicals using equHibrium partitioning. Environmental ],oxi.cology artd Chemistry 10: 1--43.
Goyette, D., and J. Boyd. 1989. Distribution and environ~
mental impact of selected benthic contaminants in Vancouver Harbour, British Columbia. Conservation and Protection, Environment Canada, Vancouver, British Coiumbia, 99 pp.
Klapow, L A., and R. H. Lewis. 1979. Analysis of toxicity data for California marine water quality standards. Journal of the Water Pollution Control Federation 51 :20512070.
Long, E. R. 1992. Ranges in chemical concentrations in sediments aSSOciated with adverse biological effects. Marine Pollution Bulletin 24( 1): 38-45.
Long, E. R., and L G. Morgan. 1990. The potential for biological effects of sediment-sorbed contam\nants tested in the National Status and Trends Program. NOAA Tech. Memo. NOS OMA 52. US National Oceanic and Atmospheric Administration, Seattle, Washington, 175 pp.
Lorenzato S. G., A. J. Gunther, and J. M. O'Connor. 1991. Summary of a workshop concerning sediment quality assessment and development of sediment. quality objectives. California State V,Jater Resources Control Board, Sacramento, California, 31 pp.
Lyman, W.J., k E. Glazer,]. KOng, and S. F. Coons. 1987. An overview of sediment quality in the United States. Final Report. Contract No. 68-01-6951. Task 20. PB88251384. US Environmental Protection Agency, Washing~
ton, DC, 204 pp.
MacDonald, D. D 1993. Development of an approach to the assessment of sediment quality in Florida coastal ..vaters. Prepared by MacDonald Environmental Sciences, Ltd .. Ladysmith, Bntish Columbia. Prepared for Florida De~ E?·rtment of Environmental Regulation, Tallahassee, j<lOnda, VoL 1, 128 pp., Vol. 2, n 7 pp.
MacDonal?, D. D., S. L Smith, M. P. Wong, and P, Mudroch. 1992. The development of Canadian Marine Environmental Quality Guidelines. Ecosystem Sciences and Evaluation Directorate, Conservation and Protection, Environment Canada, Ottawa, Ontario. 32 Pg. + appendices. '
MaIins, D. c., M. M. Krahn, M. S. Myers, L. D. Rhodes, D. W. Brown, C. k Krone, B, B. McCain, and S.-L. Chan. 1985. Toxic chemicals in sediments and biota from a creosote-polluted harbor: relationships with hepatic neoplas:ns and o~her hepatic lesions in'English ro1; (Parophrys vetutus). Car-cznagenesis 6(10): 1463-1469.
McLeay, D., S. Vee, K. Doe, and S. Wade. 1991. Phase-II and phase-III studies by EC laboratories of lO-day tests for sediment toxicity using marine or estuarine infaunal amphipods. Final Report.. Prepared for Environment Canada and the Inter-Governmental Aquatic Toxicity Group. Ottawa, Canada, 39 pp.
Neff, J. M., D. J. Bean, B. W. Cornaby, R. M, Vaga, T. C. Gulbransen, and J. A. Scanlon. 1986. Sediment quality criteria methdology and validation: Cakuiation of Screening level concentrations from field data. 1Nork Assignment 56, Task IV. BatteHe Institute. Prepared for US Environmental Protection Agency, Washington, DC, 225 pp.
O'Connor, T. P. 1991. Concentrations of organic contaminants in mollu.sks and sediments at NOAA National Status and Trends sites in the coastal and estuarine United States. Environmental Health Perspectives 90:69-·-73.
Pavlou, S., R, Kadeg, A. Turner, and M. Marchiik. 1987. Sediment quality criteria methodology validation: Uncertainty analysis of sediment normalization theory for nonpolar organic contaminants. SeD No. 14. US Environ~
mental Protection Agency, Washington, DC.
Payne. j. F., J. Kiceniuk, L L Fancey, U. Williams, G. L Fletcher, A. Rahimtu!a, and B. Fowler. 1988, What is a safe level of polycyclic aromatic hydrocarbons for fish: Subchronic toxicity study of winter flounder (PseudopleuToneEtes america.nus). Ca.nadian ] ournai of Fis.henes and Aquatic Sciences 45; 1983-1993.
Persaud, D., R. Jaagumagi, and A. Hayton. 1992. Guidelines for the protection and management of aquatic sediment quality in Ontario. ISBN 0-7729-9248-7, Ontario Ministry of the Environment, Toronto, Canada, 23 pp,
Plesha, P. D., J. E. Stein, M. H. Schiewe, B, B. McCain, and U. Varana,si. Hj~8. Toxicity of marine sediments supplemented wlth m~xtures of selected chlorinated and aromatic_hydroc~rbonsto the infaunaI amphipod Rhepoxymus a!rm'fi,Zus. Ma.nne EnviTGnmental Research 25:85-97.
vn, Inc. 1988. Sediment quality values refinement: 1988 update and evaluation of Puget Sound AET, Vol. 1. Prepared for Washington Department of Ecology. PTI Environmental Services, Bellevue, Washington, 173 pp.
Roberts, M. H., Jr., W. J. Harris, C. T. Strobel. and P. F. DeLisie. 1989. Acme toxicity of PAH contaminated sedi .. ments to the estuarine fish, Lewstomus xanthurus. BuUetzn of Envrronmental Contammatwn and Toxlcolagy 42: 142·-149.
SCG"Y~P..1989.1nf~uenceofsediment type on phenanthrene tOXICity. in AnnUal Report. Southern California Coastal V/ater Research Project, Long Beach, Califorma, 4 pp.
Smith, S. L., and D, D, MacDonald, 1992, The development and use of Canadian sediment quality guidelines for the protection of aquatic life. Prepared for the Inteniepartmental Working Group on MEQ Guidelines and the Canadian Council of Ministers for the Environment Task Group on Water Quality Guidelines, Ottawa, Ontario,
Swain, t, G., and R. A, Nijman. 1991. An approach to the development of sediment quality objectives for Burrard Iniet. Pages 1026--1937 in P, Chapman, F, Bishay, E. Power, K. HaH, L Harding, D, McLeay, M. Nassichuk, and W. Knapp (eds.), Proceedings, 17th Annual Aquatic Toxicity Workshop. Canadian Techical Report of Fisheries and Aquatic Sciences No. 1774, Vol. 2. 5·_·7 November 1990, Vancouver, British Columbia, 1213 pp.
Swartz, R. c., P. F. Kemp, D, W. Schuhs, G. R. Ditsworth, and R. J. Ozretich. 1989. Acute toxicity of sediment from Eagle Harbor, Washington, to the infaunal amphipod RhefJoX'Vunius abronius. Environmental Toxicology and Chemis·· try 8jd5····222,
Swartz, R. c., D. W. Schults, T. H. DeWitt, G. R. Ditsworth, and J. O. Lamberson. 1990. Toxicity of fluoranthene in sediment to marine amphipods: A test of the equilibrium partitioning approach to sediment quality criteria. Environmental Tax1,:;ology and Chemistry 9: 1071-1080.
Tay, K. L., K. G, Doe, S. J. Wade, J. D. A. Vaughn, R. E. Berrigan, and M. J. Moore. 1990. Biological eff~cts of contaminants in HaHfax Harbour sediment. Pages 383427 in P. Chapman, F. Bishay, E, Power, K. Hall, L Harding, D. McL.eay, M. Nassichuk, and W. Knapp. (eds')J Proceedings, 17th Annual Aquatic Toxicity Workshop. Canadian Technical Report of Fisheries and Aquatic Sciences No. 1774, VoL 2.5-7 November, 1990. Vancouver, British Columbia, 1213 pp.
Tetra-Tech, Inc. 1985. Commencement Bay nearshore/ tidefiats remedial investigation, Vol 3, Appendices l~V;
and VoL 4, Appendices VI~XV. Bellevue, Washington. Prepared for US EPA Region 10 and WashinglOn Department of Ecology, Seattle, Washington, 916 pp.
US Army Corps of Engineers. 1988. Evaluation procedures technical appendix--phase I (Central Puget Sound), Puget Sound Dredged Disposal Analysis Reports~ Seattle, Washington, Washington State Department of Natura! Resources, Seattle, Washington, 476 pp.
US EPA (US Environmental Protection Agency). 1988. Interim sediment criteria values for nonpolar hydrophobic organic contaminants. Office of Water Regulation and S<::andards. Crir.eria and Standards Division, US Environmental Protection Agency, Washington, DC, 22 pg.
US EPA (US Environmenta! Protection Agency). 19892.. Sediment classification methods compendium. Final draft report. US Environmental Protectio'n Agency, Washington, DC, 243 pp.
US EPA (US Environmental Protection Agency). 1989b. Briefing report to the EPA Science Advisory Board on the equilibrium partitioning appmach to generating sediment quality crite!'ia. US 440/5-89-002, US Environmen' tal Protection Agency, Washington, DC, 140 pp.
US EPA (US Environmental Protection Agency). 19933. Pmposed sediment quality criteria for the protection of benthic organisms: Fluoranthene. EPA-822-R-93-012. US Environmental Protection Agency, Office of Water-, Washington, DC, 54 pp.
US EPA (US Environmental Protection Agency), 1993b, Proposed sediment quality criteria for the protection of benthic organisms: Acenaphthene. EPA~822,R·93~OI3.
US Environmental Protection Agency, Office of Water, Washington, DC, 57 pp.
US EPA (US Environmental Protection Agency). 1993c. Proposed sediment quality criteria for the protection of benthic organisms: Phenanthrene. EPA-822-R-93~O14. US Environmental Protection Agency, Office of Water, Washington, DC, 49 pp.
US EPA (US Environmental Protection Agency). 1992a, Sediment dassification methods comoendium. EPA 823R~92-006. US Environmental Protection Agency, Office of Water, Washington, DC, 222 pp.
US EPA (US Environmental Protection Agency). 1992b. An SAB Report: Review of sediment criteria development methodology for non-ionic organic contaminants. Prepared by the Sediment Quality Subcommittee of the Eco~
logical Processes and Effects Committee. EPA-SABEPEC-93-002. US Environmental Protection Agency, Science Advisory Board, Washington, DC, 12 pp.
US NOAA (US National Oceanic and Atmospheric Administration). 1991. National Status and Trends Program for marine environmental quality. Progress report. Second summary of data on ch.emical contaminants in sediments from the National Status and Trends Program. US Na~
tional Oceanic and Atmospheric Administration, Rockville, Maryland, 29 pp.
Washington Department of Eco~ogy. 1989. Interim sediment quality evaluation process for Puget Sound. WDE, Olympia, Vlashington, 21 pp.
Wells, P. G., and S. J. Rolston, 1991. Health of Our Oceans. A status report on Canadian Marine Environmental Quality. Conservation and Protection, Environment Canada, Ottawa and Dartmouth, Canada, 166 pp.
Winn, R. N., R. F. Van Dolah, A. Frankenburg, and T. W. Kana. 1989. Benthic and sedimentological studies of ocean dredged material disposal site (ODMBS) for Charleston, South Carolina. Final report South Carolina M.arine Research Center, Charleston: South Carolina, 177 pp.