incentives for innovation and centralized versus delegated...
TRANSCRIPT

Incentives for Innovation and Centralized versus Delegated
Capital Budgeting
Sunil Dutta∗
Haas School of Business
University of California, Berkeley
and
Qintao Fan
Haas School of Business
University of California, Berkeley
Forthcoming in the Journal of Accounting and Economics
∗We thank Jonathan Glover (the referee) and Ross Watts (the editor) for detailed comments. We also
thank seminar participants at UCLA, Carnegie Mellon, UT Austin, British Columbia, and 2012 Management
Accounting conference.

Incentives for Innovation and Centralized versus Delegated
Capital Budgeting
Abstract
We study a setting wherein a divisional manager undertakes personally costly ef-
fort to improve the profitability of an investment project. The manager’s choice of
innovation effort is subject to a holdup problem because of the ex post opportunism
on the part of headquarters. We analyze and contrast the performance of centralized
and delegated forms of investment decision-making. We find that delegation improves
the manager’s innovation incentives. We identify conditions for each of the two or-
ganizational forms to emerge as the optimal choice, and relate these conditions to
characteristics of firms’ investment opportunity sets.
Key Words: capital budgeting; centralization; delegation; innovation; holdup problem

1 Introduction
A key decision variable in designing an effective organizational structure is the assignment
of capital investment decision rights. In practice, investment decisions are either centralized
at the corporate level or delegated to business unit managers. An extensive literature based
on agency theory (e.g., Harris et al. 1982 and Antle and Eppen 1985) has examined the
optimal centralized capital budgeting mechanisms in which corporate headquarters make
investment decisions based on reports submitted by privately informed divisional managers.
Other papers (e.g., Baldenius et al. 2007 and Dutta and Reichelstein 2002) have investigated
the conditions under which delegated decision-making can replicate the performance of an
optimal centralized capital budgeting mechanism. These papers show that when divisional
managers are given autonomy over their investment decisions and compensated on the basis
of residual income, delegation can indeed replicate the performance of centralized capital
budgeting under certain circumstances.
A limitation of this stream of research is that firms’ investment opportunities are assumed
to be entirely exogenous. In most contexts, however, managers must undertake extensive
efforts to identify, develop, and improve investment opportunities. For example, launch-
ing a new product or entering a new market requires considerable resources and efforts to
come up with new ideas, develop processes to implement those ideas, and identify poten-
tial customers. The rapid pace of technological progress has increased the importance of
innovation in modern business organizations. Consequently, there is a need to understand
how the allocation of investment authority impacts managers’ innovation incentives, and in
turn how that relationship affects firms’ preferences for centralized control versus delegated
decision-making.
We conduct a theoretical investigation of these questions. We model a firm consisting
of a headquarters representing the interests of shareholders and a single division run by a
self-interested manager. The manager influences the firm’s set of investment opportunities
through his choice of innovation activities. Specifically, the manager can expend a person-
ally costly effort to improve the mean profitability of an investment project. During this
1

innovation phase, the manager also becomes privately informed about the project’s payoff
prospects. This informational advantage enables the manager to derive private benefits (i.e.,
informational rents), which in turn motivate him to exert upfront innovation efforts. An ef-
fective organizational structure for capital budgeting must strike a balance between limiting
managerial rents and providing innovation incentives. Our paper investigates how centralized
and delegated forms of investment decision-making fare in providing innovation incentives to
the manager, and characterizes conditions for each of these organizational designs to emerge
as the optimal choice.
To model centralization and delegation, we adopt the following perspective. While cen-
tralized control requires making information available to those with residual decision rights
(i.e., corporate headquarters), decentralization entails transferring these decision rights to
those with the best information (i.e., divisional managers). We assume that if the firm
chooses to exercise central control over the division’s investment decisions, it establishes a
central monitoring system to gather information about divisional investment opportunities.
The firm does not install a monitoring system under a decentralized organization. In the
latter case, the division is structured as an investment center with autonomy over its capital
investment decisions. To ensure that the self-interested manager makes desirable investment
decisions, the firm ties managerial compensation to divisional residual income.
As is typical in models with asymmetric information, the manager derives rents from his
private information. Though informational rents are often viewed as private benefits that
accrue to self-interested managers at the expense of shareholders, they serve a useful role in
our model: providing the manager with ex ante incentives to exert innovation effort. We focus
on settings where innovation activities span over long time horizons. For instance, major
undertakings such as developing new products or entering new markets often begin years
in advance of their eventual implementations. A complete contract in such settings would
require the firm to precommit to precise ways in which the manager would be compensated
and investment projects would be evaluated for all periods during the manager’s planning
horizon. In practice, however, managerial incentive plans are often governed by short-term
contracts and investment criteria (e.g., hurdle rates) are frequently subject to revisions in
2

light of new information. To formalize this tendency for flexible investment and compensation
rules, we assume that headquarters commits to an incentive contract—and hence to an
investment criterion—after the manager has contributed his innovation effort.
Taking the manager’s earlier choice of innovation activity as sunk and given, headquarters
chooses (induces) the sequentially optimal investment decision that maximizes its ex post
payoffs by limiting managerial rents. For instance, if headquarters had precise information
about the projects’s rate of return, it would extract all the rents from the manager and
implement the first-best investment decision. A consequence of this ex post opportunism is
that the manager faces a classic holdup problem with regard to his ex ante choice of innovation
activity: the manager anticipates headquarters’ opportunistic behavior, and so curtails his
innovation effort. The manager’s holdup problem is more severe under centralization because
headquarters exploits the information provided by the central monitoring system to curtail
managerial rents. Under delegated capital budgeting, headquarters effectively commits to
providing the manager with more returns (i.e., more rents) from his innovation efforts by not
installing any monitoring technology. We thus find that the equilibrium level of innovation
activity is higher under delegation than that under centralization.
Our analysis highlights an essential tradeoff between ex post investment efficiency and ex
ante innovation incentives. Centralized control allows headquarters to use the information
provided by the central monitoring system to improve the ex post efficiency of the investment
decision, but only at the expense of weakening the manager’s ex ante innovation incentives.
In contrast, delegation provides the manager with stronger innovation incentives at the
expense of a less efficient investment decision. Our analysis characterizes this tradeoff, and
explains how the optimal choice of organizational design depends on certain characteristics
of the firm’s investment opportunities such as the sensitivity of payoffs to innovation, size,
risk, and ex ante profitability.
When a project’s payoffs are relatively insensitive to innovation, the manager’s innovation
effort is not only less effective at improving the project’s rate of return, but such effort is
also more difficult to motivate. Consequently, limiting managerial rents is more critical
and centralized control outperforms delegation. In contrast, when the manager’s innovation
3
effort is a crucial determinant of investment payoffs, it is optimal to delegate the investment
decision authority.
The marginal benefit of innovation activity increases with the scale of investment; hence,
for large projects, it is relatively easy as well as productive to motivate innovation. Our
analysis thus predicts that divisions with relatively large investment opportunities are more
likely to be organized as decentralized units with autonomy over their capital investments.
This result contrasts with the finding of Harris and Raviv (1996) who show that larger
projects are more likely to be centralized than smaller projects. Unlike our paper in which
the project’s rate of return is endogenously determined by the manager’s choice of innovation
effort, Harris and Raviv (1996) consider a setting in which the project’s rate of return is
exogenous. In the absence of an innovation incentive problem, the firm would always choose
central control if monitoring were costless. With costly monitoring, delegation dominates
(is dominated by) centralization for small (large) projects. Our analysis shows that this
result no longer holds when the firm has to balance the conflicting objectives of providing
innovation incentives and curtailing managerial rents.
Taken together, our results predict that (i) delegation of investment authority improves
managers’ innovation incentives, and (ii) the investment decision-making authority will be
delegated to divisions that have relatively large investment opportunities, operate in environ-
ments where innovation is critical to future performance, or have investment opportunities
that are neither too risky nor too profitable. In addition, we derive a number of empirically
relevant comparative statics regarding firms’ optimal choices of investment hurdle rates.
This analysis demonstrates that hurdle rates will be higher for divisions that have larger
investment opportunities, operate in more innovation-intensive environments, or have more
autonomy over their capital investment decisions. We believe that these predictions are
empirically testable, provided that one has access to data on internal hurdle rates.1
We focus on costs (i.e., weakened innovation incentives) and benefits (i.e., reduced man-
1The empirical results of Kastl, Martimort, and Piccolo (2010) support our finding that delegation im-
proves incentives for innovation. Acemoglu et al. (2007) also provide evidence for a positive association
between delegation and innovation.
4

agerial rents) of centralization from an incentive standpoint, and abstracts from other con-
siderations such as cost of gathering and processing information and opportunity cost of
delayed decision-making under centralized capital budgeting. In the absence of these latter
costs, our analysis predicts that the investment decision authority will be centralized for
divisions with more uncertain investment projects. This contrasts with the conventional
textbook wisdom (e.g., Kaplan and Atkinson 1998) that decentralization is more desirable
for business units operating in more uncertain environments. Even if this conventional wis-
dom is valid, our analysis shows that a demand for decentralization cannot arise because of
the need to provide incentives for innovation, since such incentives are explicitly considered
in our model. A demand for delegation in uncertain environments must then arise from
other considerations such as the need for divisional managers to react quickly to changing
local conditions, or to economize on information collection and processing costs.2
Our paper is related to the research of Aghion and Tirole (1997), who also study a
capital investment setting wherein an agent exerts a personally costly effort to search for
information about investment opportunities. Similar to one of our findings, they show that
the delegation of investment authority can motivate search efforts. Their analysis, however,
relies on some restrictive assumptions. First, they do not explicitly model a conflict between
the investment objectives of the principal and agent. Instead, they rely on reasons such as pet
projects to motivate a conflict of interest between the parties. Our paper adopts a standard
agency-theoretic approach to introduce a divergence of preferences: the manager has private
information and prefers leisure (slack) to work. Second, and more significantly, they assume
that the principal cannot use performance-based compensation contracts because the agent
does not respond to monetary incentives.
Another closely related paper is by Arya et al. (2000), who examine a firm’s choice
of information system in a capital budgeting setting. Without relying on an exogenous
divergence of preferences, they show that the firm may prefer to install a coarse information
2Christie et al. (2003) investigate a tradeoff between information communication costs and control costs
in the firm’s choice of decentralization and find evidence consistent with communication costs being relatively
more important than control costs in the decentralization decision.
5

system to mitigate the holdup problem associated with the agent’s project search effort.3 A
common theme in Aghion and Tirole (1997), Arya et al. (2000), and our own paper is that
too much information can hurt a principal who is limited in her ability to commit.4 However,
neither Aghion and Tirole (1997) nor Arya et al. (2000) consider performance-based incentive
contracts. Given this restriction, it is difficult to generalize their main insights to more
realistic settings in which the agent’s compensation can be based on realized performance.
Our paper addresses this limitation by investigating the problem of organizational design
in a framework that integrates the design of performance measurement and compensation
systems with the allocation of decision authority. Advocating this perspective, Zimmerman
(2006) writes:5
Centralization and decentralization revolve around the issues of partitioning decision rights
between higher versus lower levels of the organization and linking knowledge and decision
rights. Ultimately all organizations must construct three systems: (i) a system that measures
performance, (ii) a system that rewards and punishes performance, and (iii) a system
that assigns decision rights.
We treat the three systems identified above along with an information (i.e., central monitor-
ing) system as interrelated components of the organizational structure.
Our paper makes two important contributions relative to Aghion and Tirole (1997) and
Arya et al. (2000). First, our analysis confirms that the main insight of these papers
(restricting the principal’s access to information can enhance managerial incentives) extends
to settings which permit incentive contracts. Second, and more importantly, our analysis
generates novel testable predictions that cannot be obtained from the models of these two
papers. Specifically, our analysis predicts how certain observable characteristics of a firm’s
investment opportunity set affect its preference for centralization versus delegation. We also
3Unlike Aghion and Tirole (1997) and our paper, they also investigate the incentive effects of coarsening
self-reported information and varying the timing of information available to the principal.4For a similar result in contexts different from ours, see Cremer (1995), Riordan (1990), and Sappington
(1986).5See Chapter 4, p.170.
6

derive empirically relevant comparative statics concerning the optimal investment hurdle
rates.
Baiman and Rajan (1995) and Harris and Raviv (1996) also consider the choice between
centralization and delegation in capital investment settings. Unlike our paper in which
innovation activities determine the project’s mean payoffs, both of these papers assume
that the project’s rate of return is exogenous. In the model of Baiman and Rajan (1995),
delegation eliminates managerial perks derived from private information, whereas in our
model delegation increases managerial perks and motivates innovation effort. In Harris and
Raviv (1996), as in our paper, centralization entails monitoring of divisional investment
opportunities.6 While they model exogenous monitoring costs, we focus on the endogenous
cost of monitoring via ex post opportunism on the part of headquarters. Also, unlike our
model which incorporates performance-based contracts, Harris and Raviv (1996) assume
that the agent does not respond to monetary incentives.
Dutta and Fan (2009) analyze a capital budgeting setting wherein a manager can improve
the expected quality of an investment project through a costly action. While our models
are similar in this respect, they focus on characterizing the circumstances under which the
optimal incentive scheme induces under- or over-investment. They do not consider the
organizational design problem examined in our paper. They also assume that the firm
commits to an incentive scheme for the manager at the outset; hence, the holdup problem,
central to our analysis, is absent from their paper. Bernardo et. al. (2009) also consider a
model in which a project’s expected payoff depends on the manager’s costly effort and the
firm can commit to a managerial incentive plan at the outset. Baiman and Rajan (1998),
Laffont and Tirole (1993), and Laux and Mittendorf (2011) all consider settings in which
the agent’s type is endogenously determined through his choice of a costly action. While
our analysis and these studies share this modeling feature, our paper is quite different from
these studies in terms of its research focus and other modeling choices.
6Harris and Raviv (1998) consider an extension in which the division has access to multiple investment
projects. Kim (2006) extends Harris and Raviv (1996) by assuming that the agent must exert effort to
acquire private information on the investment payoffs of a project.
7

There is an extensive literature in accounting and economics on the choice between del-
egation versus centralization in organizations. A central theoretical result is that delegation
can never outperform centralization because of the revelation principle. For its validity, the
revelation principle relies on complete contracts, unlimited commitments, and the absence of
communication or information processing costs. In our model, the revelation principle does
not apply for the entire game because the firm does not commit to an incentive contract at
the outset. Melumad et al. (1992) establish the dominance of delegation over centralization
by relaxing the assumption of unrestricted and costless communication.7
The remainder of the paper proceeds as follows. Section 2 describes the model. The
equilibrium choices of investment decision and innovation activity for the centralized setting
are characterized in Section 3. Section 4 characterizes the same choices for the delegated
setting. Section 5 compares the performances of the centralized and delegated organizational
forms, and identifies sufficient conditions for each of these organizational structures to emerge
as the optimal choice. Section 6 summarizes the testable implications of our analysis. Section
7 concludes the paper.
2 Model
We consider a one-period model of a firm consisting of headquarters and a single division.
Headquarters represents the interests of the firm’s shareholders and has access to capital.
The division manager has no capital of his own. Headquarters and the manager are both
risk-neutral. The division has access to a potentially profitable project. Undertaking this
project requires an initial cash outlay of k dollars, and generates gross cash earnings of
(1 + r) · k dollars at the end of the period. Therefore, r denotes the project’s rate of return.
Without loss of generality, we normalize the firm’s cost of capital to zero, and hence the
project’s npv is simply equal to k · (1 + r) − k = k · r .
7See Mookherjee (2006) for a review of the related literature.
8

The division’s earnings (or, net cash flows) are given by:
c = k · r · I + x − b, (1)
where I ∈ {0, 1} is an indicator variable that denotes whether the project is undertaken
and x denotes earnings from the firm’s existing assets. While the project’s rate of return r
is the manager’s private information, x is a commonly known parameter. For brevity, we
normalize x to zero without loss of generality.
To introduce a divergence of preferences between headquarters and the manager, we
assume that the manager, if he chooses, can spend divisional resources on perquisites. In
equation (1), b ≥ 0 denotes the amount of divisional resources diverted by the manager
for personal consumption of perquisites. When the project is undertaken (i.e., I = 1) and
r is the manager’s private information, managerial consumption of perquisites cannot be
verifiably separated from the regular operating expenditures. In contrast, the manager’s
perquisite consumption can be directly detected when the project is not undertaken (i.e.,
I = 0), since the earnings from the division’s existing assets, x , are commonly known.
Headquarters observes the aggregate earnings in expression (1), but not its individual
components. Inability to distinguish between the regular operating expenditures and man-
agerial perquisite consumption, combined with the manager’s private information regarding
the project’s rate of return r , creates an agency problem that prevents headquarters from
achieving the first-best outcome. Specifically, the manager has a natural incentive to con-
sume perks and then ascribe the resulting poor performance to low investment returns.8
The distribution of the project’s rate of return r is endogenously determined by the
manager. Specifically, the manager can undertake a personally costly action to improve the
project’s expected profitability. Many investment projects, such as launching new products
or entering new markets, require extensive innovation efforts at the outset. To formalize this,
we follow Dutta and Fan (2009) and assume that the expected rate of return is increasing
in the level of innovation effort undertaken by the manager. In particular, the project’s rate
8Alternatively, we could assume that the manager contributes a personally costly and unobservable effort
a to enhance divisional earnings; e.g., c = k · r · I + a . See, for instance, Dutta and Fan (2009).
9

of return r is given by:
r = m · e + µ + ε, (2)
where e ≥ 0 denotes the level of innovation activity chosen by the manager, m > 0 denotes
the marginal productivity of innovation, µ ≥ 0 is the project’s ex ante expected rate of
return, and ε is the realization of a normally distributed random variable with mean zero
and variance σ2 .9 The managerial innovation effort e shifts the mean of the project’s rate of
return from µ to µ+m · e . Let Φ(·) and φ(·) denote the distribution and density functions,
respectively, of the standard normal distribution. The distribution and density functions of
r are then given by Φ(
r−m·e−µ
σ
)
and 1σ·φ
(
r−m·e−µ
σ
)
, respectively. We note that the standard
normal distribution satisfies the usual monotone inverse hazard rate condition; i.e.,
H(·) ≡ 1 − Φ(·)φ (·)
is decreasing.
Headquarters seeks to maximize the divisional earnings net of the manager’s compensa-
tion, s:
k · r · I − b − s.
Letting v(e) = 12· e2 denote the manager’s disutility of effort e , his net utility is given by:
V = s + w · b− v(e), (3)
where w ∈ (0, 1) denotes the compensation that the manager will accept in exchange for
giving up a dollar of perk consumption. The assumption w < 1 reflects that the manager
assigns a higher value to direct compensation, which allows him unrestricted consumption
choices, than to an equivalent amount of divisional resources consumed as perquisites.
We now describe the sequence of events in the game between the manager and head-
quarters. At the outset, headquarters decides on the division’s organizational form, which
specifies whether capital investment decisions will be centrally controlled, or delegated to the
9The assumption of µ ≥ 0 is required only for Proposition 4 and part (b) of Proposition 2. Other results
hold for all positive as well as negative values of µ .
10

division. If headquarters chooses to exercise central control, it installs a central monitoring
system to gather information on the division’s investment opportunities. The monitoring
system generates an unverifiable signal, θ , of the project’s rate of return r . If headquarters
chooses a decentralized organizational form, it does not install any monitoring system. Under
this “hands-off” approach, the division is structured as an investment center with autonomy
over its investment decisions. Our modeling here is consistent with the notion that while
centralization requires central information systems to assist those with decision rights (i.e.,
corporate headquarters), decentralization entails transferring these decision rights to those
with information (i.e., divisional managers).10
It will also become apparent that consistent with the theory of Aghion and Tirole (1997),
the crucial distinction between centralization and delegation relates to the structure of infor-
mation; specifically, the informational endowment of headquarters. Aghion and Tirole (1997)
formalizes the idea that, regardless of the formal authority (i.e., decision rights) structure,
real authority (i.e., effective control over decisions) belongs to those who possess the relevant
information. Likewise, our analysis will show that headquarters can exercise real authority
over divisional investment decisions only when it has the pertinent information.
It will be generally costly to establish and maintain the corporate infrastructure neces-
sary to monitor divisional investment prospects. However, we ignore this exogenous cost
of information collection and focus on the endogenous cost of opportunism on the part of
corporate headquarters. Our analysis shows that the firm may choose not to install any
monitoring system even when it is costless to do so. When monitoring costs are taken into
account, the case for delegation becomes even more compelling.
Given the organizational form chosen by headquarters, the manager chooses a level of
project innovation activity e , and privately learns the project’s rate of return r . Subse-
quently, headquarters observes the signal from the monitoring system if such a system is in
place. Next the parties sign a contract that specifies the manager’s compensation rule, a
performance measure for the manager, and an investment decision rule I if headquarters
10See, for instance, Chapter 4 in Zimmerman (2006) for a discussion of how the location of information
within an organization influences, and is influenced by, its choice of delegation versus centralization.
11

HQ chooses
whether toinstall a
monitoringsystem
Manager
chooses e
Manager
learns r
HQ observessignal θ , ifmonitoring
installed
Contractsigned
Investmentdecision I
implemented
Cash flow c
realized
Figure 1: Sequence of Events
retains the investment authority. We will discuss the contracting stage in more details in the
next section. Finally, the investment decision is implemented, cash flows are realized, and
the manager is paid according to the contract in place. This sequencing of events is depicted
in Figure 1.
We model a one-period setting to focus on our main research question. In reality, how-
ever, the incentive problem modeled here is likely to span multiple time periods in most
contexts. For instance, innovation activities for projects such as introduction of a new prod-
uct often begin years in advance of their eventual implementations. A complete long-term
contract in such settings would require headquarters to precommit to precise ways in which
the manager will be compensated and investment projects will be evaluated for all future
periods during the manager’s planning horizon. Such contracts are, however, not descriptive
of compensation and investment policies in most firms. In practice, managerial compensa-
tion plans are often governed by short-term contracts and investment policies are frequently
revised. To capture this limited commitment ability in our reduced form one-period model,
we assume that the firm commits to an investment policy (through its choice of an incen-
tive contract) after the completion of the project innovation phase. A consequence of this
“delayed” contracting is that headquarters chooses a contract to maximize the firm’s ex post
payoff, taking the manager’s innovation effort choice as sunk and given. This opportunistic
behavior by headquarters creates a holdup problem with respect to the manager’s ex ante
12

choice of innovation effort.11
Aghion and Tirole (1997), Arya et al. (2000), and Baiman and Rajan (1995) examine
similar holdup problems arising from incomplete contracts.12 Arya et al. (2000) provide
an example in which delayed contracting emerges as an optimal response. Based on the
insights of Hermalin and Katz (1991), they show that delayed contracting allows the parties
to condition contracts on unverifiable information that may become available during the
innovation phase. It seems reasonable to expect that certain “soft” characteristics of the
investment project would become known only gradually as the project takes a progressively
more concrete form during the innovation phase.
3 Centralized Investment Setting
We first examine the centralized organizational form in which the firm sets up a monitoring
technology to assess the profitability of the division’s investment project. We presume that
the monitoring system reveals the project’s rate of return r (i.e., θ = r ) with probability
q > 0, and generates an uninformative signal with the complementary probability of 1 − q .
The signal θ is assumed to be inherently “soft” and cannot be directly used for contracting.
The manager chooses a level of innovation activity e anticipating the headquarters’ sub-
sequent choice of investment decision rule. At the contracting stage, headquarters acts in
a sequentially rational manner taking the manager’s innovation effort choice as sunk and
given. To construct an equilibrium of the game, we first characterize the optimal solution to
the headquarter’s problem of choosing an incentive scheme for the manager.
11In comparing internal capital markets with external financing (such as bank loans), Gertner et al. (1994)
argue that diminished managerial incentives are an inevitable consequence of internal capital allocation
processes because managers are vulnerable to opportunistic behavior by corporate headquarters.12In different contexts, Cremer (1995), Riordan (1990), Sappington (1986), and Stole and Zwiebel (1996)
also investigate similar holdup issues.
13

3.1 Headquarters’ Optimal Strategy
Taking the manager’s innovation effort e as given, headquarters chooses an incentive scheme
that is sequentially optimal; that is, it maximizes the firm’s ex post expected profit. This
implies that when the monitoring system reveals the value of r , headquarters implements
the first-best investment decision; that is, the project is undertaken if and only if its rate of
return r exceeds the firm’s cost of capital. In this case, the manager receives a simple forcing
contract under which he is paid a fixed amount equal to his reservation utility provided that
the realized earnings equal k · r · I(r).
We now turn to the other case in which the monitoring system generates an uninformative
signal. We first characterize the optimal direct revelation scheme in which the manager
submits a report r̃ about the project’s rate of return. A direct revelation scheme specifies
the manager’s compensation s(r̃), required performance c(r̃), and investment decision rule
I(r̃), all as functions of the manager’s report r̃ . When the project’s true rate of return is r
but the manager reports r̃ , let b(r̃, r) denote the maximum amount of perquisites that the
manager can consume, and yet generate performance consistent with his report r̃ . That is:
b(r̃, r) ≡ max{b|k · r · I(r̃) − b ≥ c (r̃)} = k · r · I (r̃) − c (r̃) (4)
Contingent on the reported return of r̃ and the true return of r , the manager’s interim
utility (i.e., utility gross of the cost of innovation effort) becomes:
U(r̃, r) = s(r̃) + w · b(r̃, r).
Let U(r) denote the manager’s utility when he reports his private information truthfully;
that is,
U(r) ≡ U(r, r).
Similarly, define b (r) ≡ b(r, r). Given the definition in (4), a direct revelation scheme can
be equivalently represented by the triplet {I(r̃), b (r̃) , s (r̃)} .
It follows from the Revelation Principle that we can restrict our attention to incentive
schemes that induce the manager to reveal his private information truthfully. For a given
14

conjecture e about the manager’s innovation effort, headquarters’ optimization problem can
be written as follows:13
max{I(·),b(·),s(·)}
∫ ∞
−∞[k · r · I(r) − b(r) − s(r)] dΦ
(
r − m · e − µ
σ
)
subject to:
U(r) ≥ U (r̃, r) for all r and r̃, (i)
U(r) ≥ 0 for all r. (ii)
For a given conjecture on the manager’s choice of innovation effort e , the above opti-
mization program is a standard adverse selection problem. Its objective function reflects
the expected value of the the firm’s ex post payoff. The incentive compatibility constraints
in (i) ensure that the manager finds it in his self-interest to report his private information
truthfully. The participation constraints in (ii) guarantee that the manager will earn at least
his reservation utility, which has been normalized to zero without loss of generality.
We note that the manager has a natural incentive to understate the project’s rate of re-
turn. By understating the rate of return, the manager can consume perks and yet deliver the
required level of performance. To counteract the manager’s incentives for such misreporting,
he must be provided with information rents.
Since the manager puts a higher value on an unrestricted compensation payment than
on the equal amount of perk consumption (i.e., w < 1), it can never be optimal to induce
b > 0. Applying the standard arguments from the adverse selection literature, it can be
shown that the manager’s information rent takes the form:14
U (r) = k · w ·∫ r
−∞I (u) du. (5)
13Since both parties are risk-neutral, all of our results would continue to hold if the terminal cash flows
were subject to an additional random noise term; i.e, c = k · r · I − b + η with E(η) = 0. See Laffont and
Tirole (1986).14See the proof of Proposition 1 in the Appendix for details
15
This first-order condition combined with the monotonicity requirement that I(r) is non-
decreasing (i.e., the investment policy is upper-tailed) ensures that the mechanism is globally
incentive compatible. Equation (5) shows that if the project is approved, the manager will
earn more than his reservation utility of zero; i.e., the manager will earn information rent.
Using integration by parts, the expected information rent becomes:
E[U (r)] = k · w ·∫ ∞
−∞
[
1 − Φ
(
r − m · e − µ
σ
)]
· I (r) dr, (6)
and hence headquarters’ maximization problem simplifies to:
maxI(·)
∫ ∞
−∞k · I (r) ·
[
r −w · σ · H(
r − m · e − µ
σ
)]
dΦ
(
r − m · e − µ
σ
)
.
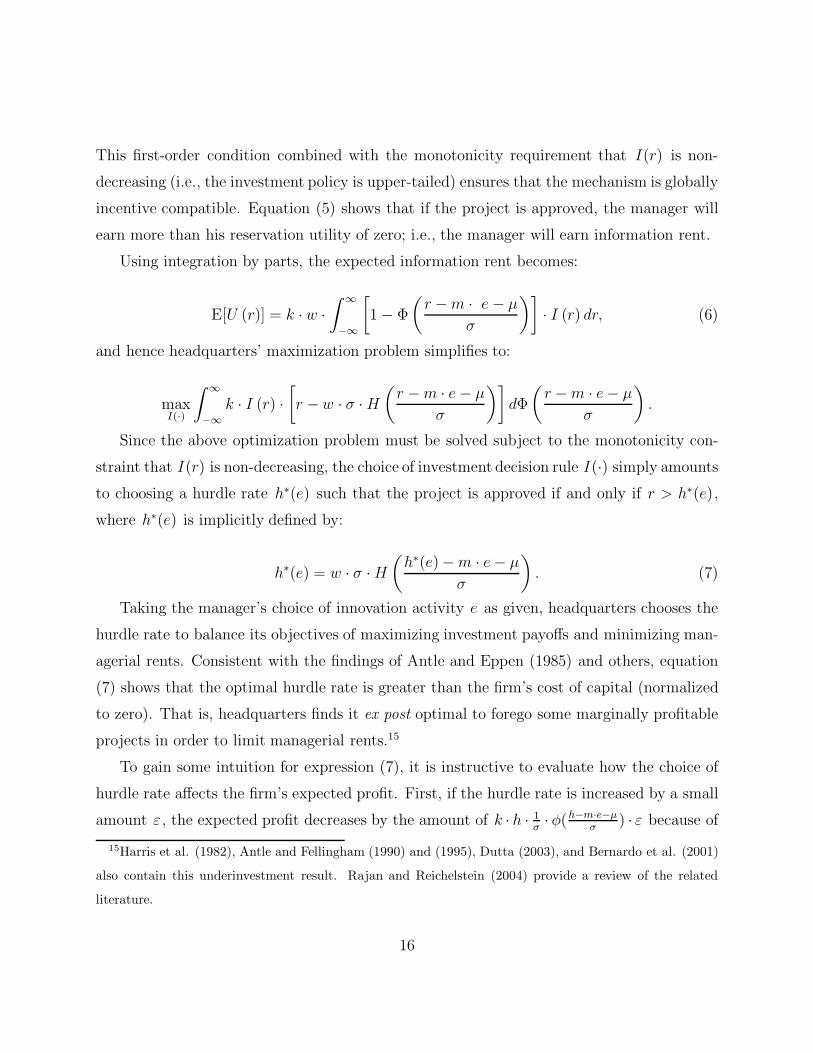
Since the above optimization problem must be solved subject to the monotonicity con-
straint that I(r) is non-decreasing, the choice of investment decision rule I(·) simply amounts
to choosing a hurdle rate h∗(e) such that the project is approved if and only if r > h∗(e),
where h∗(e) is implicitly defined by:
h∗(e) = w · σ · H(
h∗(e)− m · e − µ
σ
)
. (7)
Taking the manager’s choice of innovation activity e as given, headquarters chooses the
hurdle rate to balance its objectives of maximizing investment payoffs and minimizing man-
agerial rents. Consistent with the findings of Antle and Eppen (1985) and others, equation
(7) shows that the optimal hurdle rate is greater than the firm’s cost of capital (normalized
to zero). That is, headquarters finds it ex post optimal to forego some marginally profitable
projects in order to limit managerial rents.15
To gain some intuition for expression (7), it is instructive to evaluate how the choice of
hurdle rate affects the firm’s expected profit. First, if the hurdle rate is increased by a small
amount ε , the expected profit decreases by the amount of k · h · 1σ· φ(h−m·e−µ
σ) · ε because of
15Harris et al. (1982), Antle and Fellingham (1990) and (1995), Dutta (2003), and Bernardo et al. (2001)
also contain this underinvestment result. Rajan and Reichelstein (2004) provide a review of the related
literature.
16

the net present value forgone. At the same time, such an increase in the hurdle rate reduces
the manager’s information rent by k · w · ε for each type above h. Therefore, the expected
compensation cost decreases by k · w · [1 − Φ(h−m·e−µ
σ)] · ε . The optimal hurdle rate in (7)
equates the marginal cost of increasing h to its marginal benefit.
The optimal revelation scheme characterized above defines the maximum attainable pay-
off. In our model, however, it is not necessary to implement the optimal mechanism via
direct revelation. The optimal performance can also be attained by mechanisms requiring
no explicit communication of information. For instance, consider an incentive scheme based
on linear compensation plans of the following form:
s = α + β · c, (8)
where α denotes a fixed payment and β is a bonus rate applied to the realized cash flow. A
contract in this incentive scheme specifies the triplet {α, β, I} . Suppose headquarters offers
the following menu of contracts: (i) {0, w, 0} , and (ii) {−w·k·h, w, 1} . It is easy to verify that
the manager will select the first contract if r < h, and the second one if r ≥ h. Under either
of these two contracts, the manager chooses b to maximize, w·[k·r·I−b]+w·b = w·k·r·I , and
hence has no incentive to consume perks. Moreover, it is easy to check that the manager will
earn the same amount of rents in this incentive scheme as in the optimal revelation scheme.
This indirect incentive scheme thus attains the same performance as the optimal revelation
mechanism.
3.2 The Manager’s Optimal Strategy
Now we turn to the manager’s ex ante problem of choosing a level of innovation activity.
At the innovation stage, the manager rationally anticipates headquarters’ subsequent choice
of incentive scheme and chooses e to maximize his ex ante expected utility. The preceding
analysis shows that when headquarters learns the project’s true rate of return, which hap-
pens with probability q , the manager’s utility U(r) is equal to zero for each r . When the
monitoring system generates an uninformative signal, the manager’s expected utility is given
17

by equation (6). Consequently, if the manager’s conjecture on headquarters’ choice of hurdle
rate is h, he will choose his innovation effort to maximize his ex ante expected utility:
(1 − q) · k · w ·∫ ∞
h
[
1 −Φ
(
r − m · e − µ
σ
)]
dr − v(e). (9)
The first term of the manager’s objective function represents the expected information
rent for a given hurdle rate h, whereas the second term is the manager’s disutility of effort.
To characterize the optimal choice of innovation effort, we impose the following technical
assumption:
Assumption A1 : max φ(·) < σk·w·m2 .
This assumption ensures that the manager’s marginal benefit of e increases at a sufficiently
low rate so that the manager’s objective function is concave in e . Given A1, therefore, the
following first-order condition characterizes the manager’s optimal choice of e :
e∗(h) = (1 − q) · k · w · m ·[
1 −Φ
(
h − m · e∗(h) − µ
σ
)]
. (10)
The right-hand side of (10) represents the marginal information rent and measures the
manager’s marginal benefit from innovation. The marginal information rent, and hence the
optimal level of innovation activity, are increasing in the productivity parameter m , project
size k , and probability of investment 1 − Φ(
h−m·e−µ
σ
)
.
3.3 Equilibrium
We now turn our attention to characterizing the equilibria of the game between the manager
and headquarters. A pure strategy equilibrium (hc, ec) is given by a point at which the two
reaction curves, h∗(e) and e∗(h), intersect. That is, hc = h∗(ec) and ec = e∗(hc).
To understand a key property of the manager’s response curve h∗(e), it is helpful to
express the information rent in equation (5) as follows:
U(r) = k · w · max{0, r − h}. (11)
18

The above expression shows that the manager’s information rent can be interpreted
as a “call option” on the investment payoffs. The value of a call option increases in the
expected value of the underlying asset. Analogously, for a given hurdle rate h, the manager’s
information rent increases in the expected rate of return of the project. In response to an
increase in the expected rate of return, headquarters thus optimally adjusts the hurdle rate
upwards to curtail managerial rents. Since the expected rate of return, m ·e+µ, is increasing
in e , headquarters’ response function h∗(e) is upward-slopping.
Since the probability of investment decreases in the hurdle rate h, equation (10) implies
that the optimal innovation effort e∗ decreases in h. We are now ready to state the result
below.
Proposition 1 Under centralization, the unique equilibrium is characterized by:
ec = (1 − q) · k · w ·m ·[
1 − Φ
(
hc − m · ec − µ
σ
)]
(12)
hc = w · σ · H(
hc −m · ec − µ
σ
)
(13)
Proof: All proof are in the Appendix.
The equilibrium is unique because the reaction curve slopes upwards for headquarters
and downwards for the manager. The next result characterizes how the equilibrium levels of
innovation effort and hurdle rate vary with certain parameters of the model.
Proposition 2 (a) The innovation activity ec and hurdle rate hc are:
(i) increasing in the scale of investment, k ,
(ii) increasing in the productivity parameter, m, and
(iii) increasing in the project’s ex ante profitability, µ.
(b) The innovation activity ec is decreasing in the project risk σ .
19

The manager’s innovation effort increases in the scale of investment k , since k amplifies
the marginal productivity of managerial effort. Hence, as depicted in Figure 2, the manager’s
response curve e∗(h) shifts upwards as k increases. Further, headquarters’ reaction function
h∗(e) in (7) is independent of k . Consequently, the equilibrium level of innovation effort hc
increases in project size k . The equilibrium hurdle rate hc increases in k because higher k
increases the manager’s innovation effort, which in turn induces headquarters to adjust the
hurdle rate upwards. Figure 2 provides a graphical depiction of this intuition.
An intuitive explanation for the second comparative statics is as follows. The optimal
level of innovation activity increases in the productivity parameter m ; that is, the response
function e∗(h) shifts upwards as m increases. In addition to this direct effect, however,
there is a countervailing strategic effect. Specifically, as can be verified from (7), higher m
increases headquarters’ optimal choice of hurdle rate; that is, h∗(e) shifts to the right as m
increases. Intuitively, higher m increases the mean profitability of the project, and hence
the manager’s information rent. Consequently, headquarters optimally adjusts the hurdle
rate upwards to curtail managerial rents. This strategic effect tends to reduce the innovation
effort, since e∗(h) is a decreasing function. Nonetheless, as illustrated in Figure 3, the direct
effect dominates the strategic effect and the equilibrium level of innovation activity ec is
increasing in m . The equilibrium hurdle rate hc also increases in m because the direct
and strategic effects reinforce each other: the optimal hurdle rate is increasing in m for any
given e (i.e., direct effect); and a higher m induces a higher innovation effort, which in turn
results in a higher hurdle rate (i.e., strategic effect). A similar reasoning applies for the third
comparative statics.
Intuition for the last comparative statics is as follows. For a project that is ex ante
positive npv (i.e., µ ≥ 0), the probability of investment decreases as the distribution of
investment payoff becomes more spread out; i.e., as σ increases. Consequently, the manager’s
innovation incentives decline; i.e., the response curve e∗(h) shifts downwards. In addition,
an increase in σ increases the manager’s information rent (which represents a call option
on the investment payoffs), and hence the optimal hurdle rate, which, in turn, induces the
manager to lower his choice of innovation effort. Consequently, the equilibrium innovation
20

effort ec is unambiguously decreasing in σ .16
To conclude this section, we briefly revisit the assumption of delayed contracts. A direct
consequence of this assumption is that headquarters chooses a sequentially optimal mech-
anism and ignores its impact on the manager’s ex ante innovation incentives. This oppor-
tunism on the part of headquarters creates a holdup problem with respect to the manager’s
ex ante choice of innovation activity. An immediate question is whether the firm can some-
how mitigate this holdup problem and attain a higher level of ex ante payoff. Specifically,
can the firm achieve a higher level of ex ante payoff by committing to a reporting system
in which the manager submits coarse (rather than precise) information about r? As shown
in Section 3.1, however, the firm can also attain the ex post optimal payoff through an indi-
rect incentive scheme based on contracts of the form in (8). Since such an indirect incentive
scheme does not rely on any communication of information from the manager, a commitment
to coarse reporting system cannot be beneficial in our model. In contrast, Arya et al. (2000)
consider a setting in which the capital budgeting process must be implemented via direct
revelation because compensation cannot be contingent on realized performance (which rules
out indirect incentive schemes based on menus of contracts). Therefore, a coarse reporting
system can be beneficial to the firm because it effectively serves as a substitute for the firm’s
inability to commit.17
4 Delegated Investment Setting
We now examine the alternative capital budgeting process in which headquarters does not
install any corporate infrastructure to monitor divisional investment prospects. Instead,
headquarters structures the division as an investment center with autonomy over its in-
16The sign of ∂hc
∂σis, however, ambiguous because of countervailing direct and strategic effects. The
optimal hurdle rate increases in σ for any given e (i.e., direct effect). At the same time, however, higher σ
reduces e , which decreases the hurdle rate (i.e., strategic effect). See also the discussion following Proposition
4 in the next section.17See also Arya et al. (1997).
21

vestment decisions. To ensure that the manager makes the desirable investment decision,
headquarters ties managerial compensation to residual income of the division.
We first derive the optimal investment decision rule for a direct revelation game in which
headquarters makes the investment decision based on the manager’s report on the project’s
rate of return. We then show that the performance of such a revelation game can be replicated
by a delegated incentive scheme with a linear compensation contract based on residual income
as the performance measure.
In our model, the difference between the two organizational forms is that headquarters
sets up the project monitoring technology under centralization, but not under delegation.
An optimal revelation scheme in the delegated setting is, therefore, simply a limiting case of
a corresponding scheme in the centralized setting with q = 0. As a consequence, the result
below follows directly from Proposition 1.
Lemma 1 Under delegated capital budgeting, the unique equilibrium(
hd, ed)
is character-
ized by:
ed = k · w · m ·[
1 − Φ
(
hd − m · ed − µ
σ
)]
hd = w · σ ·H(
hd − m · ed − µ
σ
)
We now show that the performance of the optimal revelation scheme in Lemma 1 can
be replicated by an incentive scheme in which the manager is compensated on the basis of
divisional residual income. We consider linear compensation contracts of the form:
s = α + β · RI, (14)
where α denotes a fixed salary, β is a bonus parameter, and RI is the residual income
performance measure. Unlike operating income, which does not charge for the use of capital,
residual income has the advantage that headquarters can tailor the capital charge rate so
that the manager internalizes the firm’s investment objective. In our one-period model,
22

operating income equals net cash flow k · r · I − b . Therefore, residual income corresponding
to the capital charge rate of r̂ becomes:
RI = k · (r − r̂) · I − b. (15)
A compensation contract of the form in (14) is said to generate optimal incentives if
there exists compensation coefficients (α, β) such that the resulting contract satisfies the
manager’s participation constraints and generates the same expected payoff for the firm as
the optimal revelation scheme.
Proposition 3 The linear compensation contract in (14) generates optimal incentives if the
capital charge rate is set equal to hd .
Under the delegation scheme identified above, headquarters allocates the investment
decision right to the manager and compensates the manager on the basis of the linear com-
pensation contract in (14). For a given level of innovation effort e , the manager will choose
his investment decision I to maximize α + β · [k · (r − r̂) · I − b] + w · b , and thus imple-
ment the optimal investment policy provided that the capital charge rate r̂ is set equal to
hd . Furthermore, the manager will not consume any perks (i.e., he will choose b = 0) if
the bonus coefficient β is set equal to w . An appropriate choice of α then ensures that
the linear contract in (14) will provide the manager with information rent in the amount of
k · w · max{0, r − hd} , which is equal to his payoff from the optimal revelation scheme.
Proposition 3 shows that if headquarters does not have information about the project’s
profitability, its expected payoffs are the same when the investment decision is centralized
as when it is delegated. Likewise, when the monitoring system generates an uninformative
signal in the centralized setting of Section 3, headquarters can rely on a delegated incentive
scheme of the form in (14) to attain the same payoffs as attained by the optimal centralized
scheme. These observations illustrate that the key distinction between centralization and
decentralization relates to the structure of information (specifically, the information endow-
ment of headquarters), and not to the allocation of decision rights per se. In other words,
headquarters is indifferent to the choice of formal authority structure for the investment
23

decision when it does not have the information necessary to exercise real authority over that
decision. This “informational” perspective of centralization versus delegation is consistent
with the theory of Aghion and Tirole (1997). They formalize the notion that real authority
over a decision belongs to the agent who possesses the relevant information for that decision
irrespective of the formal authority structure.18
We note that all of the comparative statics results in Proposition 2 remain valid in the
delegated setting, since they hold for all values of q including q = 0. The result below
characterizes how the optimal hurdle rate varies with project risk.
Proposition 4 The hurdle rate hd decreases (increases) in project risk σ for small (large)
values of σ .
For a given innovation effort e , higher project risk increases the level of information
rent because the manager’s compensation, as shown in (11), represents a call option on
the investment payoffs. In response to an increase in σ , this direct “rent” effect induces
headquarters to adjust the hurdle rate upwards to curtail managerial rents. At the same
time, however, project risk also affects the manager’s innovation incentives. Specifically,
an increase in σ leads to a decrease in the marginal informational rent, which reduces the
manager’s incentives for innovation. The reason is that the marginal information rent is
proportional to the probability of investment 1 − Φ(h−m·e−µ
σ), which is decreasing in σ for
a project that is ex ante positive npv (i.e., µ ≥ 0). This strategic “incentive” effect reduces
the project’s expected profitability, and hence headquarters’ optimal choice of hurdle rate.
Consequently, the sign of ∂hd
∂σdepends on the relative strengths of these two countervailing
effects. For small values of σ , the incentive effect dominates and the hurdle rate is decreasing
in σ . However, for large values of σ , the probability of investment becomes largely insensitive
to σ , and therefore the rent effect dominates and the hurdle rate increases in σ .19
18Since formal authority structure does not affect the firm’s payoff in the absence of information, we
continue with the convention that investment decision rights are (formally) centralized when the firm installs
the monitoring system, and delegated when it does not.19It can be shown that the result in Proposition 4 also applies to the centralized setting provided that
24
5 Performance Comparison of Centralized and Dele-
gated Capital Budgeting
This section compares the centralized and delegated capital budgeting systems along three
dimensions: (1) innovation incentives, (2) investment hurdle rates, and (3) ex ante expected
profits. The result below compares the innovation efforts and hurdle rates under the two
forms of capital budgeting.
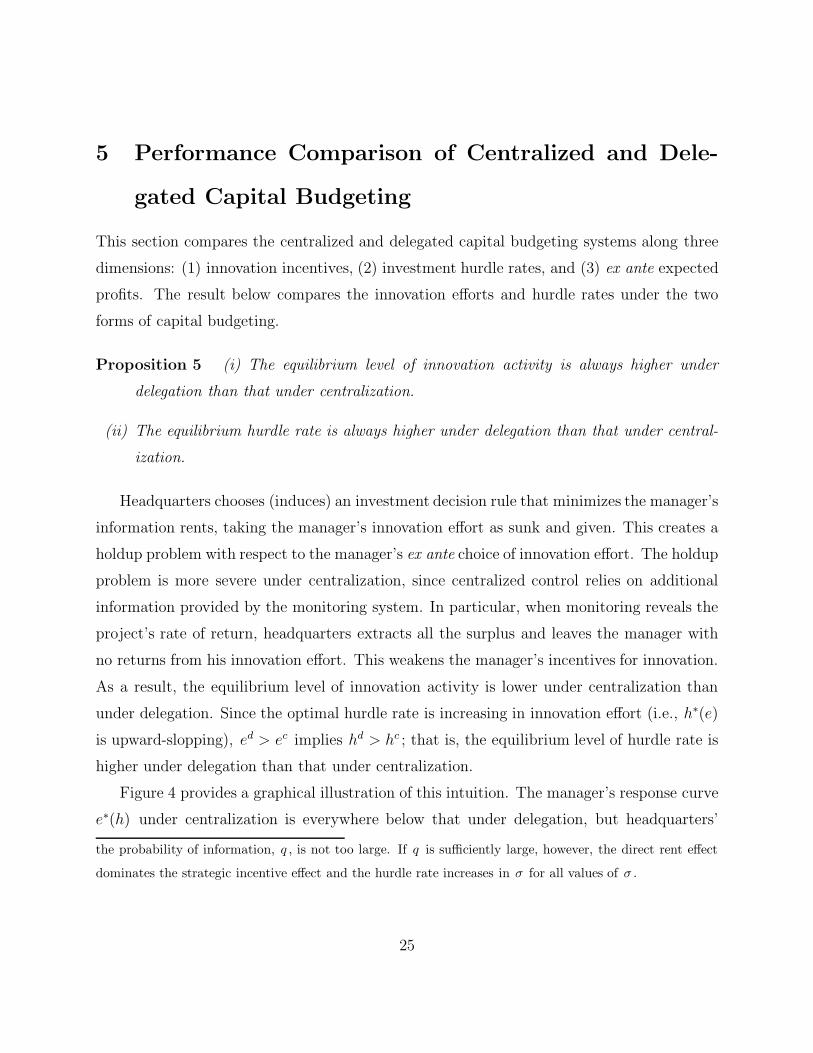
Proposition 5 (i) The equilibrium level of innovation activity is always higher under
delegation than that under centralization.
(ii) The equilibrium hurdle rate is always higher under delegation than that under central-
ization.
Headquarters chooses (induces) an investment decision rule that minimizes the manager’s
information rents, taking the manager’s innovation effort as sunk and given. This creates a
holdup problem with respect to the manager’s ex ante choice of innovation effort. The holdup
problem is more severe under centralization, since centralized control relies on additional
information provided by the monitoring system. In particular, when monitoring reveals the
project’s rate of return, headquarters extracts all the surplus and leaves the manager with
no returns from his innovation effort. This weakens the manager’s incentives for innovation.
As a result, the equilibrium level of innovation activity is lower under centralization than
under delegation. Since the optimal hurdle rate is increasing in innovation effort (i.e., h∗(e)
is upward-slopping), ed > ec implies hd > hc ; that is, the equilibrium level of hurdle rate is
higher under delegation than that under centralization.
Figure 4 provides a graphical illustration of this intuition. The manager’s response curve
e∗(h) under centralization is everywhere below that under delegation, but headquarters’
the probability of information, q , is not too large. If q is sufficiently large, however, the direct rent effect
dominates the strategic incentive effect and the hurdle rate increases in σ for all values of σ .
25
response curve h∗(e) is invariant to the choice of centralization versus delegation. Conse-
quently, the innovation activity and hurdle rate are both higher under delegation.
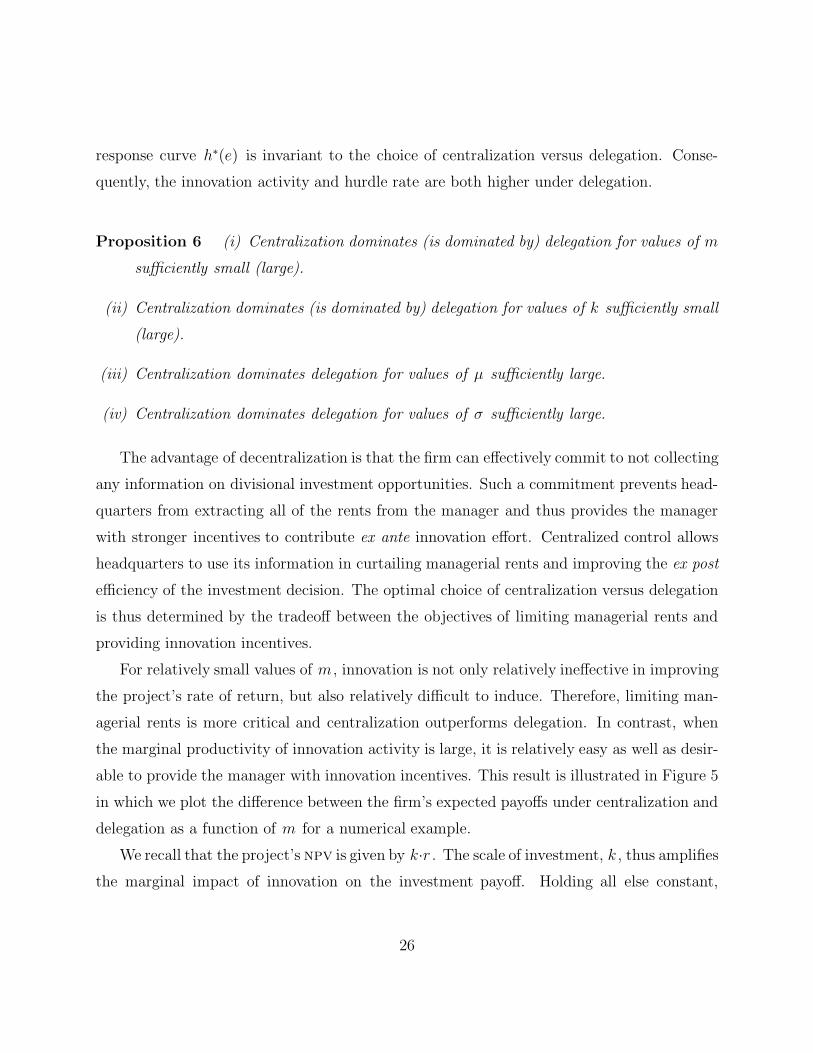
Proposition 6 (i) Centralization dominates (is dominated by) delegation for values of m
sufficiently small (large).
(ii) Centralization dominates (is dominated by) delegation for values of k sufficiently small
(large).
(iii) Centralization dominates delegation for values of µ sufficiently large.
(iv) Centralization dominates delegation for values of σ sufficiently large.
The advantage of decentralization is that the firm can effectively commit to not collecting
any information on divisional investment opportunities. Such a commitment prevents head-
quarters from extracting all of the rents from the manager and thus provides the manager
with stronger incentives to contribute ex ante innovation effort. Centralized control allows
headquarters to use its information in curtailing managerial rents and improving the ex post
efficiency of the investment decision. The optimal choice of centralization versus delegation
is thus determined by the tradeoff between the objectives of limiting managerial rents and
providing innovation incentives.
For relatively small values of m , innovation is not only relatively ineffective in improving
the project’s rate of return, but also relatively difficult to induce. Therefore, limiting man-
agerial rents is more critical and centralization outperforms delegation. In contrast, when
the marginal productivity of innovation activity is large, it is relatively easy as well as desir-
able to provide the manager with innovation incentives. This result is illustrated in Figure 5
in which we plot the difference between the firm’s expected payoffs under centralization and
delegation as a function of m for a numerical example.
We recall that the project’s npv is given by k·r . The scale of investment, k , thus amplifies
the marginal impact of innovation on the investment payoff. Holding all else constant,
26

provision of innovation incentives becomes more crucial, and hence delegation becomes more
compelling as k increases. Figure 6 illustrates this result through a numerical example.
The above result predicts that divisions with relatively large investment opportunities
are more likely to be organized as decentralized units with autonomy over their capital
investments. In contrast, Harris and Raviv (1996) show that larger projects are more likely
to be centrally controlled than smaller projects. The reason for this difference is that the
distribution of investment payoffs is endogenously determined by the manager’s choice of
innovation activity in our model. In contrast, investment payoffs are exogenous in Harris
and Raviv (1996). It is instructive to consider the choice of delegation versus centralization
in our model for the case when m = 0 (i.e., when investment payoffs are exogenous). In
deciding whether to centralize or not, headquarters would now simply compare the benefit
of centralization, namely reduced managerial rents, with the cost of monitoring. Clearly,
headquarters would choose central control if monitoring were costless. Suppose now that
headquarters can monitor the project at a fixed cost. Since the manager’s information
rent—and hence the marginal benefit of monitoring—increases in the scale of investment,
we recover the result in Harris and Raviv (1996) that the investment decision would be
centralized (delegated) for larger (smaller) projects.
Figure 7 uses a numerical example to illustrate our next result that centralization out-
performs delegation for values of µ sufficiently large. To gain some intuition, note that the
manager’s innovation incentives depend on the marginal informational rent, which, as noted
earlier, is proportional to the probability of investment. As µ increases, the investment like-
lihood approaches one, and hence the marginal informational rent approaches a constant.
On the other hand, the level of informational rent increases without bound as µ increases.
For sufficiently large values of µ, therefore, limiting managerial rents becomes more critical
than providing innovation incentives, and hence centralization dominates delegation. When
µ is relatively small, the optimal choice of organizational form depends on the values of k
and m .
An intuitive explanation for the last result of Proposition 6 is as follows. Holding all else
constant, an increases in the dispersion of investment payoffs (i.e., a larger σ ) increases the
27

manager’s information rent. At the same time, the firm becomes less concerned about in-
novation incentives because its payoff becomes less sensitive to the mean-shifting innovation
effort e . As a result, the rent minimization objective dominates and centralization outper-
forms delegation. Figure 8 plots the difference between the firm’s expected profits under the
two organizational forms for a numerical example.
It is worth pointing out that the centralized and delegated capital budgeting systems
would be essentially identical if headquarters could credibly commit to not use its informa-
tion opportunistically. The result that delegation can outperform centralization is a direct
consequence of the assumption that headquarters cannot commit to do so; that is, it cannot
refrain from extracting all the surplus from the manager when it knows the project’s rate
of return. Headquarters can prevent itself from such ex post opportunism by choosing not
to install any central monitoring system. This allows headquarters to credibly leave the
manager with more returns from his innovation effort (i.e., more rents).
Finally, we discuss an alternative commitment scenario. Suppose that in the delegated
setting (i.e., when the firm does not install a project monitoring system), the firm can
credibly commit to a long-term incentive contract before the innovation phase begins. This
alternative form of decentralization provides the firm with the additional benefit of early
contracting, and hence it would (weakly) dominate the performance of the delegated system
modeled in our paper. Consequently, delegation would continue to dominate centralization
for sufficiently large values of k or m . It can also be shown that our other comparative
results in Proposition 6 also continue to remain valid.20
6 Empirical Implications
Our analysis generates several novel predictions about firms’ optimal choices of internal
hurdle rates and investment authority structures. For instance, Proposition 2 predicts that
20Of course, if headquarters were able to make a similar long-term commitment when it chose to install the
monitoring system, we would be back to complete contracts with unlimited commitments, and centralization
would always outperform delegation.
28

hurdle rates will be higher for projects that are larger in scale, depend more crucially on
innovation, or have higher expected returns. These predictions apply to firms that exercise
central control over their capital investment decisions as well as to firms that delegate them
to divisional managers. The second part of Proposition 5 predicts how hurdle rates would
differ between centralized and decentralized firms. Specifically, it shows that investment
hurdle rates will be higher for firms with more decentralized investment decision-making.
To the extent one has access to data on firms’ internal hurdle rates, these predictions are
empirically testable.
In addition, the first part of Proposition 5 predicts that delegation provides stronger inno-
vation incentives than centralization. The findings of Kastl, Martimort, and Piccolo (2010)
support this prediction. Using internal management data from a sample of Italian manufac-
turing companies, they document a positive and causal relationship between delegation of
decisions and incentives for innovation as measured by “soft” r&d investments.
Our analysis also identifies the conditions under which it is optimal to centralize capital
investment decisions or to delegate them to divisional managers. These conditions relate to
the observable characteristics of firms’ investment opportunity sets. Specifically, Proposition
6 predicts that the investment decision authority is more likely to be (i) decentralized for
divisions that operate in innovation-intensive environments, or have relatively large invest-
ment projects, and (ii) centralized for divisions with more profitable and more uncertain
investment opportunities.
7 Conclusion
To investigate how organizational form impacts managers’ incentives to develop investment
opportunities, we have considered a capital budgeting setting in which a divisional manager
can exert personally costly effort to improve the expected quality of an investment project.
Our analysis compares the incentive properties and performance of centralized and delegated
investment decision-making. The key difference between the two forms of organizational
29

structure is that the firm installs a central monitoring system to collect information on
divisional investment opportunities under centralization, but not under delegation.
Our analysis highlights an essential tradeoff between ex post investment efficiency and ex
ante innovation incentives. Centralized control allows headquarters to utilize its information
to limit managerial rents and improve the ex post efficiency of investment decision, at the
expense of ex ante innovation incentives for the manager. Delegation allows the firm to
compromise on ex post investment efficiency in order to provide the manager with stronger
innovation incentives. Consistent with this intuition, we find that the equilibrium level of
innovation activity is always higher under delegation than under centralization. Our analysis
also identifies conditions under which it is optimal to centralize or delegate capital investment
decisions, and relates these conditions to characteristics of the firms’ investment opportunity
sets.
30

APPENDIX
For some of the proofs, we rely on certain properties of the standard normal distribution,
which are listed below.
(i) Φ (−ε) = 1 − Φ(ε)
(ii) φ′ (ε) = −ε · φ (ε)
(iii) 0 <
∫ +∞
a
Φ(−ε) dε =
∫ +∞
a
εdΦ(ε) − aΦ(−a) = E [max {ε − a, 0}] = φ (a) − a · Φ(−a)
(iv) 0 > H ′ (ε) = −1 + ε · H (ε) = −φ (ε)−1 [φ (ε) − ε · Φ(−ε)]
(v) 0 < H ′′ (ε) = H (ε) + ε · H ′ (ε)
Proof of Proposition 1:
The manager’s utility payoff contingent on the true probability parameter r and the reported
r̃ can be written as:
U(r̃, r) ≡ s(r̃) + w · b(r̃, r), (16)
where b(r̃, r) = k · r · I(r̃)− c(r̃) denotes the amount of perks that the manager can consume
and yet generate cash flows consistent with his report r̃ . It can be shown with standard
techniques that any incentive compatible mechanism has to satisfy the following “local”
condition:d
drU(r) =
∂
∂rU(r̃, r)|r̃=r.
Differentiating equation (16) with respect to r gives:
∂
∂rU(r̃, r)|r̃=r = w · k · I(r).
Since the participation constraint U(r) ≥ 0 will hold with equality for the lowest type
(i.e., U(−∞) = 0), the above equation implies that the manager will earn the following
informational rents:
U(r) = w · k ·∫ r
−∞I(u)du. (17)
31

Since U(r) = s(r) + w · b(r) by definition, it follows that s(r) + b(r) = U(r) + (1−w) · b(r).Using the expression in (17) for U(r) and integrating by parts yield:
∫ ∞
−∞[s(r) + b(r)]dΦ(
r − me − µ
σ)
=
∫ ∞
−∞
[
(1 − w) · b(r) + w · k · σ · H(r −me − µ
σ) · I(r)
]
dΦ
(
r − me − µ
σ
)
.
Since w ∈ (0, 1), it is clearly optimal to set b(r) = 0 for all r . Consequently, headquar-
ter’s problem simplifies to the following unconstrained optimization problem:
maxI(r)
∫ ∞
−∞
[
r − w · σ · H(
r − me − µ
σ
)]
· k · I(r)dΦ(r − me − µ
σ),
By pointwise maximization, it follows that headquarters will choose I(r) = 1 if and only
if r ≥ h∗ , where the hurdle rate h∗ is given by:
h∗(e) = w · σ · H(
h∗(e)− me − µ
σ
)
.
It needs to be verified that the above incentive scheme is globally incentive compatible. As
shown by Mirrlees (1971), a mechanism is incentive compatible provided it is locally incentive
compatible, and ∂∂r
U(r̃, r) is (weakly) increasing in r̃ . For the above mechanism:
∂
∂rU(r̃, r) = w · k · I(r̃),
which is increasing in r̃ since the optimal I(·) is an upper-tail investment policy.
By the implicit function theorem,
dh∗
de=
−w · m ·H ′ (h∗−me−µ
σ
)
1 − w · m · H ′(h∗−me−µ
σ).
Since H ′ (·) < 0 by assumption, we have dh∗
de> 0.
Let V (e) = E[U (r) |e]− e2
2denote the manager’s ex ante expected utility (i.e., expected
informational rents net of innovation effort) as a function of e . The manager chooses his
innovation effort to maximize V (e) and the first-order condition is given by:
32

dV
de= (1 − q) · k · w · m ·
[
1 − Φ
(
h − me − µ
σ
)]
− e = 0.
Assumption A1 implies that:
d2V
de2= (1 − q) · k · w ·m2 · σ−1 · φ
(
h − me − µ
σ
)
− 1 < 0.
Hence, V is globally concave in e and the second order condition is satisfied. Consequently,
the manager’s optimal response function is as given by (10).
By the implicit function theorem:
de∗
dh=
(1 − q) · k · w · m · σ−1 · φ(
h−me∗(h)−µ
σ
)
(1 − q) · k · w · m2 · σ−1 · φ(
h−me∗(h)−µ
σ
)
− 1< 0.
The manager’s best response e∗(h) is given by (10), whereas (7) describes headquarters’ best
response function h∗ (e). An equilibrium is the pair {hc, ec} identified by a point at which
the two best response functions intersect. There exists a unique {hc, ec} ∈ R2+ because (i)
e∗ (h) is strictly decreasing in h and h∗ (e) is strictly increasing in e , (ii) e∗ (0) > 0 and
limh→∞
e∗ (h) = 0, and (iii) h∗ (0) > 0 and lime→∞
h∗ (e) = +∞ .
Proof of Proposition 2:
The equilibrium values of hc and ec can be written as:
ec = (1 − q) · k · w · m · Φ(−z), (18)
hc = w · σ · H (z) , (19)
where we define z ≡ hc−mec−µ
σ. Substituting (18) and (19) into the definition of z yields
z = w · H (z) − σ−1 ·[
(1 − q) · w · m2 · k · Φ(−z) + µ]
. (20)
33

Differentiating the above expression gives
dz
dm= 2 · (1 − q) · w · m · k · σ−1 · Φ(−z) · Λ (z)
−1< 0,
dz
dk= w · m2 · k · σ−1 · Φ(−z) ·Λ (z)
−1< 0,
dz
dµ= σ−1 · Λ (z)−1
< 0,
dz
dσ= −σ−2 ·
[
(1 − q) · w · m2 · k ·Φ(−z) + µ]
· Λ (z)−1> 0,
where we have used the fact that Λ (z) ≡ w ·H ′ (z) + (1 − q) · w ·m2 · k · σ−1 · φ (z)− 1 < 0
because of assumption A1.
Since Φ (−z) decreases in z , the above inequalities imply that ec (i) increases in m , k ,
and µ; and (ii) decreases in σ . Because H(·) is a decreasing function, the above inequalities
also imply that hc increases in m , k , and µ.
Proof of Proposition 3:
Since the capital charge rate is equal to hd , equation (15) shows that the manager will invest if
and only if r ≥ hd . If the bonus coefficient β is set equal to w , the manager has no incentives
to consume perks. If headquarters chooses α = 0, the manager’s compensation is equal to
max{
0, k · w ·(
r − hd)
· I (r)}
. As a consequence, for each value of r , this delegated scheme
generates the same information rent for the manager as the optimal revelation mechanism.
This implies that the manager’s participation constraints are satisfied and the firm’s expected
payoffs are the same as under the optimal revelation scheme.
Proof of Proposition 4:
Differentiating (19) with respect to σ yields
dhd
dσ= w ·H (z) + w · σ · H ′ (z) · dz
dσ. (21)
When q = 0, the expression for z in (20) simplifies to z = w·H (z)−σ−1·[w · m2 · k · Φ(−z) + µ] .
Differentiating with respect to σ yields
∂z
∂σ= −σ−2 ·
[
w · m2 · k ·Φ(−z) + µ]
· Λ(z)−1,
34

where Λ (z) ≡ w · H ′ (z) + ·w · m2 · k · σ−1 · φ (z) − 1 < 0. Substituting the above into (21)
and simplifying, we get:
dhd
dσ= −w · Λ (z)−1 ·
{
H (z)− w ·m2 · k · σ−1 · Φ(−z) − z · H ′ (z)}
.
Since Λ (z) < 0, it follows that:
sgn
[
dhd
dσ
]
= sgn [λ (σ)] ,
where λ(σ) ≡ H (z) − w · m2 · k · σ−1 · Φ(−z) − z · H ′ (z).
Now observe that for z > 0,
λ (σ) = H (z)− w ·m2 · k · σ−1 ·Φ(−z) − z · H ′ (z) > 0.
When z ≤ 0, we have
λ′ (σ) =[
w · m2 · k · σ−1 · φ (z) − z · H ′′ (z)]
· dz
dσ+ σ−2 · w · m2 · k · Φ(−z) > 0,
where the inequality follows from the facts that z increases in σ and H ′′(·) > 0. These two
observations, combined with the fact that dzdσ
> 0, imply that either (i) λ (σ) > 0 for all σ ,
or (ii) the sign of λ(σ) changes from negative to positive as σ increases.
To prove the proposition, therefore, it suffices to show that λ(σ) < 0, where σ denotes
the minimum value of σ consistent with assumption A1; i.e., σ ≡ w·m2·k√2π
. Denote the
corresponding values of z(σ) and λ (σ) as z and λ, respectively:
z = w · H (z) −√
2πΦ(−z) −(
w · m2 · k)−1 ·
√2π · µ, (22)
λ = H (z) −√
2πΦ(−z) − z · H ′ (z) . (23)
When w = 1 and µ = 0, equation (22) simplifies to z = H(z) · [1 −√
2πφ(z)]. Since
φ(0) = 1√2π
, we obtain z = 0 for w = 1 and µ = 0. Now,
∂z
∂w=
H (z) + w−2 · (m2 · k)−1 ·
√2π · µ
1 − w · H ′ (z) −√
2πφ (z)> 0
35

and∂z
∂µ=
−(w ·m2 · k)−1 ·√
2π
1 − w · H ′ (z) −√
2πφ (z)< 0.
Consequently, it follows that z < 0 for all w < 1 and µ ≥ 0.
We note from equation (23) that dλ
dz=
√2πφ (z) − z · H ′′ (z) > 0, since H ′′(·) > 0 and
z < 0. It therefore follows that λ < H(0) −√
2πΦ(0) = 0. This implies that λ (σ) must
change sign once from negative to positive, and hence hd decrease (increases) in σ for small
(large) σ.
Proof of Proposition 5:
We implicitly differentiate (20) with respect to q and obtain:
dz
dq= −w · m2 · k · σ−1 · Φ(−z) · Λ (z)−1
> 0,
Consequently,dec
dq= −w · k · m ·
[
Φ(−z) + (1 − q) · φ(z) · dz
dq
]
< 0, (24)
anddhc
dq= w · k · m · H ′ (z) · dz
dq< 0.
This proves that hc and ec are both higher under delegation (i.e., q = 0) than under
centralization (i.e., q > 0).
Proof of Proposition 6:
Let Π̂ denote the firm’s expected profit in the equilibrium under the centralized setting. To
show that centralization dominates delegation, it suffices to prove that ∂Π̂∂q
> 0. Conversely,
∂Π̂∂q
< 0 implies that delegation dominates centralization.
Let Π(h, e, q) denote the firm’s expected profit for given e and h; and parameterized by
36

q . Then:
Π ≡ q · k ·∫ +∞
−me−µ
(me + µ + ε) dΦ( ε
σ
)
+ (1 − q) · k ·∫ +∞
h−me−µ
(
me + µ + ε − w · σ · H( ε
σ
))
dΦ( ε
σ
)
= q · k ·∫ +∞
−me−µ
(me + µ + ε) dΦ( ε
σ
)
+ (1 − q) · k · σ ·∫ +∞
zo
(
ε
σ− zo − w · H
( ε
σ
)
+h
σ
)
dΦ( ε
σ
)
= q · k · Eε [max {me + µ + ε, 0}] + (1 − q) · k · σ ·[
(1 − w) · Eε
[
max{ ε
σ− zo, 0
}]
+h
σ· Φ(−zo)
]
,
where zo ≡ h−me−µ
σand the last equality uses the fact that
∫ +∞
zo
(
εσ− zo
)
dΦ(
εσ
)
=
∫ +∞
zo
H(
εσ
)
dΦ(
εσ
)
=
E[
max{
εσ− zo, 0
}]
.
Note that the firm’s equilibrium expected profit, Π̂, is equal to Π(h∗(ec), ec, q). By the
Envelope Theorem, we get∂Π̂
∂q=
∂Π
∂q+
∂Π
∂e· ∂ec
∂q.
Note that
∂Π
∂q= k ·
[
Eε [max {mec + µ + ε, 0}] − σ ·[
(1 − w) · Eε
[
max{ ε
σ− z, 0
}]
+hc
σ· Φ(−z)
]]
> k · [Eε [max {mec + µ + ε, 0}] − Eε [max {mec + µ + ε − hc, 0}]]
> 0,
and∂Π
∂e= m · k ·
[
q · Φ(
mec + µ
σ
)
+ (1 − q) · Φ(−z)
]
> 0,
where, as before, we define z ≡ hc−mec−µ
σ. Furthermore, ∂ec
∂q< 0 is given by (24).
Proof of Parts (i) and (ii):
When m = 0, ∂Π∂e
and ∂e∂q
are both equal to zero. As a consequence,
∂Π̂
∂q
∣
∣
∣
∣
∣
m=0
=∂Π
∂q
∣
∣
∣
∣
m=0
> 0.
By continuity, it follows that ∂Π̂∂q
> 0 for small m . Hence, centralization dominates delegation
when m is sufficiently small.
37

When k = 0, we note that Π̂ = 0, ec = 0, and z is implicitly given by z = w · H (z) −σ−1µ. Since ∂
∂k∂q
[
∂Π∂e
· ∂e∂q
]∣
∣
∣
k=0= 0 and h > 0, we have
∂Π̂
∂k∂q
∣
∣
∣
∣
∣
k=0
=∂Π
∂k∂q
∣
∣
∣
∣
k=0
> 0
Because Π̂ increases in k , by continuity, it must be true that Π̂ (q > 0) > Π̂ (q = 0) when
k is sufficiently small. That is, centralization dominates delegation when k is sufficiently
small.
We now prove the result that delegation dominates centralization when either m or k is
sufficiently large. Since hc > 0 and σ · z = hc − mec − µ > −mec − µ, we have
∂Π
∂q< k · Eε[max {mec + µ + ε, 0}] − k · σ · (1 − w) · Eε
[
max{ ε
σ− z, 0
}]
< k · Eε[max {mec + µ + ε, 0}] − k · (1 − w) · Eε [max {mec + µ + ε, 0}]
= w · k · Eε [max (mec + µ + ε, 0)] .
Since ∂z∂q
> 0, equation (24) implies that ∂ec
∂q> −m · k · ec
1−q. Consequently,
∂Π
∂q< w ·k ·Eε [max (mec + µ + ε, 0)]−m ·k ·
[
q · Φ(
mec + µ
σ
)
+ (1 − q) · Φ(−z)
]
· ec
(1 − q).
As either k or m approaches infinity, ec converges to (1 − q) · k · w · m . Hence, the first
term on the right hand side of the above inequality goes to w · k · [(1 − q) · k · w · m2 + µ] =
(1 − q) ·w2 ·m2 · k2 +w · k ·µ, whereas the second term converges to w ·m2 · k2 . It therefore
follows that dΠ̂dq
< 0 when either k or m is sufficiently large. This completes the proof of
parts (i) and (ii).
Proof of Part (iii):
In the proof of Proposition 2, we show that dzdµ
< 0. Furthermore, it follows from (20)
that z → −∞ as µ → ∞ . Hence, z monotonically decreases in µ without bound. We also
have:
limµ→∞
ec = (1 − q) · k ·w · m limµ→∞
Φ(z)
= (1 − q) · k ·w · m,
38

and therefore limµ→∞
∂ec
∂µ= 0 and lim
µ→∞∂ec
∂q= −k · w ·m .
Because σ · z = hc − mec − µ > −mec − µ, we note that
∂Π
∂q= k · Eε [max {mec + µ + ε, 0}] − k · σ ·
[
(1 −w) · Eε
[
max{ ε
σ− z, 0
}]
+hc
σ· Φ(−z)
]
> k · σ ·[
Eε
[
mec + µ + ε
σ
∣
∣
∣
∣
ε
σ> z
]
− hc
σ· Φ(−z)
]
− k · σ · (1 − w) · Eε
[
max{ ε
σ− z, 0
}]
= k · σ · Eε
[
max{ ε
σ− z, 0
}]
− k · σ · (1 − w) · Eε
[
max{ ε
σ− z, 0
}]
= w · k · σ · Eε
[
max{ ε
σ− z, 0
}]
.
The right hand side of the last equality increases without bound in µ because z decreases
without bound in µ. Furthermore,
limµ→∞
∂Π
∂e· ∂ec
∂q= −w · k2 · m2
is independent of µ. This proves that ∂Π̂∂q
> 0 for sufficiently large values of µ.
Proof of Part (iv):
We note from equation (20) that limσ→∞
z = z0 where z0 solves z0 = w · H (z0). From (18),
we have
limσ→∞
ec = (1 − q) · k · w · m · Φ(
−z0)
.
It thus follows that limσ→∞
∂ec
∂σ= 0, lim
σ→∞hc
σ= z0 , and lim
σ→∞∂ec
∂q= −k · w · m · Φ(−z0).
Now observe that:
∂Π
∂q= k · σ · Eε
[
max
{
mec + µ + ε
σ, 0
}]
− k · σ ·[
(1 −w) · Eε
[
max{ ε
σ− z, 0
}]
+hc
σ· Φ(−z)
]
= k · σ ·[
φ
(
mec + µ
σ
)
+mec + µ
σ· Φ
(
mec + µ
σ
)]
− k · σ ·[
(1 − w) · (φ (z) − Φ(−z) · z) +hc
σ· Φ(−z)
]
.
39

Consequently,
limσ→∞
[
1
σ· ∂Π
∂q
]
= k · φ (0) − k ·[
(1 −w) · φ(
z0)
+ w · z0 · Φ(
−z0)]
= k · [φ (0) − φ(
z0)
] + k · w ·[
φ(
z0)
− Φ(
−z0)
z0]
= k · [φ (0) − φ(
z0)
] + k · w · Eε
[
max{ ε
σ− z0, 0
}]
> 0.
Hence, ∂Π∂q
increases without bound in σ . On the other hand,
limσ→∞
∂Π
∂e· ∂ec
∂q= −w · k2 · m2[q · Φ(0) + (1 − q) ·
(
1 − Φ(
z0))
][
1 −Φ(
z0)]
is independent of σ . We thus have ∂Π̂∂q
> 0 for large enough σ .
40
REFERENCES
Acemoglu, D., P. Aghion, C. Lelarge, J. Van Reenen, and F. Zilibooti. 2007. Technology,
information, and the decentralization of the firm. Quarterly Journal of Economics 4:
1759–1799.
Aghion, P., and J. Tirole. 1997. Formal and real authority in organizations. Journal of
Political Economy 105: 1–29.
Antle, R., and G. Eppen. 1985. Capital rationing and organizational slack in capital bud-
geting. Management Science 31 (2): 163–174.
Antle, R., and J. Fellingham. 1990. Resource rationing and organizational slack in a two-
period model. Journal of Accounting Research 28: 1–24.
Antle, R., and J. Fellingham. 1995. Informational rents and preferences among information
systems in a model of resource allocation. Journal of Accounting Research 33: 41–58.
Arya, A., J. Glover, and K. Sivaramakrishnan. 1997. Commitment issues in budgeting.
Journal of Accounting Research 33: 41–58.
Arya, A., J. Fellingham, J. Glover, and K. Sivaramakrishnan. 2000. Capital budgeting, the
hold-up problem, and information system design. Management Science 46 (2): 205–216.
Baiman, S., and M. Rajan. 1995. Centralization, delegation, and shared responsibility in
the assignment of capital investment decision rights. Journal of Accounting Research
33: 135–164.
Baiman, S., and M. Rajan. 1998. Optimal cost targets and incentives for acquiring expertise.
Review of Accounting Studies 3 (3): 231–259.
Baldenius, T., S. Dutta and S. Reichelstein. 2007. Cost allocation for capital budgeting
decisions. The Accounting Review 82 (4): 837–867.
Bernardo, A., H. Cai, and J. Luo. 2001. Capital budgeting and compensation with asym-
metric information and moral hazard. Journal of Financial Economics 61 (3): 311–344.
Bernardo, A., H. Cai, and J. Luo. 2009. Motivating entrepreneurial activity in a firm.
Review of Financial Studies 22 (3): 1089–1118.
Christie, A., M. Joye, and R. Watts. 2003. Decentralization of the firm: Theory and
evidence. Journal of Corporate Finance 9: 3–36.
41

Cremer, J. 1995. Arm’s length relationships. Quarterly Journal of Economics 110 (2):
275–296.
Dutta, S., and S. Reichelstein. 2002. Controlling investment decisions: Depreciation and
capital charges. Review of Accounting Studies 7 (2-3): 253–281.
Dutta, S. 2003. Capital budgeting and managerial compensation: Incentive and retention
effects. The Accounting Review 78 (1): 71–93.
Dutta, S. and Q. Fan. 2009. Hurdle rates and project development efforts. The Accounting
Review 84 (2): 405–432.
Gertner, R., D. Scharfstein, and J. Stein. 1994. Internal versus external capital markets.
The Quarterly Journal of Economics 109 (4): 1211–1230.
Harris, M., C. Kriebel, and A. Raviv. 1982. Asymmetric information, incentives, and
intrafirm resource allocation. Management Science 28 (6): 604–620.
Harris, M., and A. Raviv. 1996. The capital budgeting process: Incentives and information.
Journal of Finance 51 (4): 1139–1174.
Harris, M., and A. Raviv. 1998. Capital budgeting and delegation. Journal of Financial
Economics 50 (3): 259–289.
Hermalin, B., and M. Katz. 1991. Moral hazard and verifiability: The effects of renegotiation
in agency. Econometrica 59 (6): 1735–1753.
Kaplan, R., and A. Atkinson. 1998. Advanced Management Accounting. Upper Saddle
River: Prentice Hall.
Kastl, J., D. Martimort, and S. Piccolo. 2010. Delegation and r&d spending: Evidence
from Italy. Working paper. Stanford University
Kim, D. 2006. Capital budgeting for new projects: On the role of auditing in information
acquisition. Journal of Accounting and Economics 41 : 257-270.
Laffont, J., and J. Tirole. 1986. Using cost observation to regulate firms. Journal of Political
Economy 94 (3): 614–641.
Laffont, J., and J. Tirole. 1993. A Theory of Incentives in Procurement and Regulation.
Cambridge, MA: The MIT Press.
Laux, V., and B. Mittendorf. 2011. Board Independence, executive pay, and the adoption
42

of pet projects. Contemporary Accounting Research 28: 1467–1483.
Melumad, N., D. Mookherjee, and S. Reichelstein. 1992. A theory of responsibility centers.
Journal of Accounting and Economics 15: 445–484.
Mirrlees, J. 1971. An exploration in the theory of optimum income taxation. Review of
Economic Studies 38: 175–208.
Mookherjee, D. 2006. Decentralization, hierarchies, and incentives: A mechanism design
perspective. Journal of Economic Literature XLIV: 367–390.
Rajan, M., and S. Reichelstein. 2004. A perspective on asymmetric information, incentives
and intrafirm resource allocation. Management Science 50 (12): 1615–1623.
Riordan, M. 1990. What is vertical integration? in Aoki, M., B. Gustafson, and O. E.
Williamson (Eds.), The firm as a nexus of treaties. Thousand Oaks, CA: Sage Publica-
tions.
Sappington, D. 1986. Commitment to regulatory bureaucracy. Information Economics and
Policy 2 (4): 243–258.
Stole, L., and J. Zwiebel. 1996. Organizational design and technology choice under intrafirm
bargaining. American Economic Review 86 (1): 195–222.
Zimmerman, J. 2006. Accounting for Decision Making and Control. Boston: McGraw-Hill.
43

e*(h)
h*(e)
h
e
0hc
ec
Increase in k shifts
e*(h) upward.
Figure 2: Innovation Effort, Hurdle Rate, and Project Size
44

e*(h)
h*(e)
h
e
0
hc
ec
Increase in m shifts
h*(e) to the right.
Increase in m shifts
e*(h) upwards.
Figure 3: Innovation Effort, Hurdle Rate, and Importance of Innovation
45

e*(h) under
delegation
h*(e)
h
e
0hc
ec
e*(h) under
centralization
hd
ed
Figure 4: Delegation versus Centralization: Innovation Effort and Hurdle Rate
46

0 0.2 0.4 0.6 0.8 1 1.2 1.4 1.6 1.8 2 0.25
0.2
0.15
0.1
0.05
0
0.05
0.1
Importance!of!innovation:!m
Difference!in!firm!profits:
πc
πd
Figure 5: Delegation versus Centralization and Importance of Innovation
47

0 0.2 0.4 0.6 0.8 1 1.2 1.4 1.6 1.8 2 4
2
0
2
4
6
8
10x!10
3
Size!of!investment!project:!k
Difference!in!firm!profits:
πc
πd
Figure 6: Delegation versus Centralization and Project Size
48

0 0.2 0.4 0.6 0.8 1 1.2 1.4 1.6 1.8 2 0.015
0.01
0.005
0
0.005
0.01
0.015
Ex!ante!project!profitability:!µ
Difference!between!firm!profits:
πc
πd
Figure 7: Delegation versus Centralization and Ex Ante Profitability
49

0 0.2 0.4 0.6 0.8 1 1.2 1.4 1.6 0.2
0.15
0.1
0.05
0
0.05
Variance!of!investment!payoff: σ
Difference!in!firm!profits:
πc
πd
Figure 8: Delegation versus Centralization and Project Risk
50