in this issue, we discuss recently developed features for ... · a) driven pile sand (mosher) the...
TRANSCRIPT

Index Table
Report Generator for Building
Customized Client Reports
Page 2
New Axial (Skin, Tip) Resistance Curves
Page 8
Lateral Stability Analysis for
Minimum Pile Tip Embedment of
Substructures within Bridge Models
Page 13
Program Status
Page 19
FB-MultiPier v5.6.0FB-Deep v2.06
Atlas v7.1
Contact BSI
Page 20
Bridge Software InstituteUniversity of Florida
PO Box 116580Gainesville, FL 32611
Online: bsi.ce.ufl.eduEmail: [email protected]
FALL 2019
Issue #25 Bridge Software Institute - Newsletter
In this issue, we discuss recently developed features for FB-MultiPier v5.6.0
Engineers making use of software produced by the Bridge Software Institute (BSI) are encouraged to communicate suggestions for new features and program improvements to BSI. These suggestions may be general or very specific to project needs. We firmly believe that you are in the best position to know what those needs are!
In this release of FB-MultiPier, the enhancements listed below were largely a result of YOUR suggestions:
a) A standalone Report Generator has been developed for creating customized client reports;b) Six additional t-z and q-z curves have been added; and,c) Minimum pile tip embedment (lateral stability) analysis of substructures has been extended to full bridge models.
The FB-MultiPier v5.6.0 enhancements are highlighted below.
Page 1
Index Table
Report Generator for Building
Customized Client Reports
Page 2
New Axial (Skin, Tip) Resistance Curves
Page 8
Lateral Stability Analysis for
Minimum Pile Tip Embedment of
Substructures within Bridge Models
Page 13
Program Status
Page 19
FB-MultiPier v5.6.0FB-Deep v2.06
Atlas v7.1
Contact BSI
Page 20
Bridge Software InstituteUniversity of Florida
PO Box 116580Gainesville, FL 32611
Online: bsi.ce.ufl.eduEmail: [email protected]
FALL 2019
Issue #25 Bridge Software Institute - Newsletter
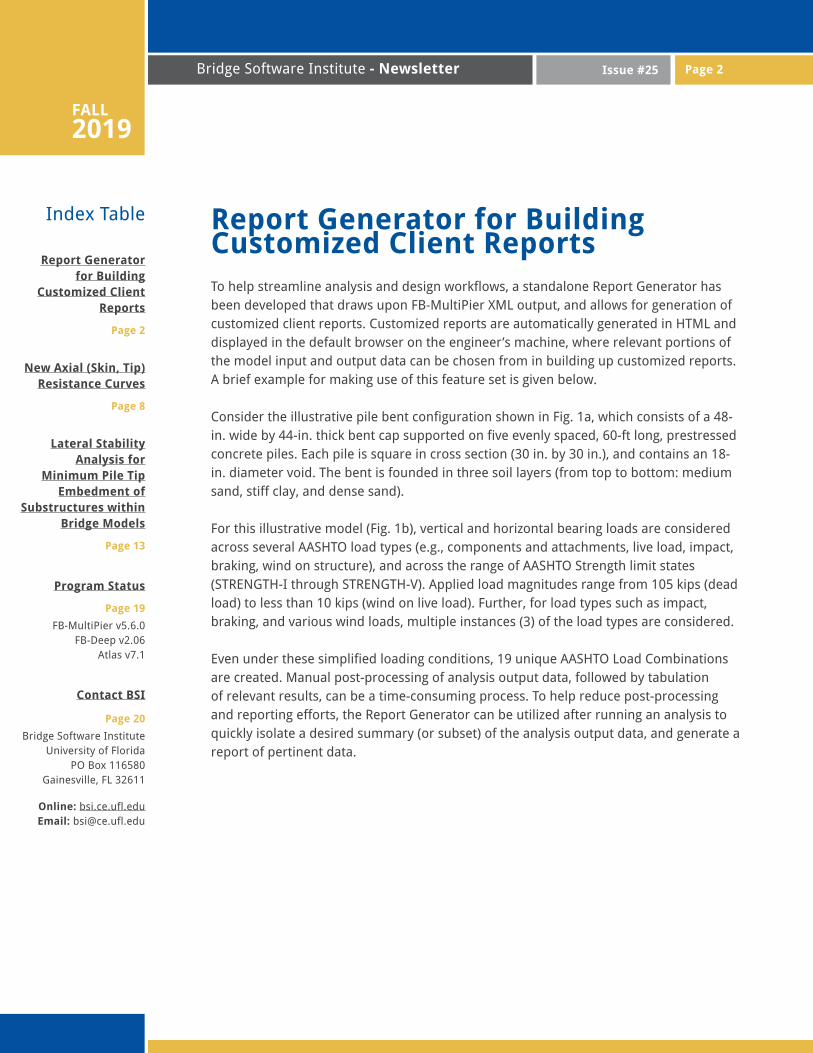
Report Generator for Building Customized Client ReportsTo help streamline analysis and design workflows, a standalone Report Generator has been developed that draws upon FB-MultiPier XML output, and allows for generation of customized client reports. Customized reports are automatically generated in HTML and displayed in the default browser on the engineer’s machine, where relevant portions of the model input and output data can be chosen from in building up customized reports. A brief example for making use of this feature set is given below.
Consider the illustrative pile bent configuration shown in Fig. 1a, which consists of a 48-in. wide by 44-in. thick bent cap supported on five evenly spaced, 60-ft long, prestressed concrete piles. Each pile is square in cross section (30 in. by 30 in.), and contains an 18-in. diameter void. The bent is founded in three soil layers (from top to bottom: medium sand, stiff clay, and dense sand).
For this illustrative model (Fig. 1b), vertical and horizontal bearing loads are considered across several AASHTO load types (e.g., components and attachments, live load, impact, braking, wind on structure), and across the range of AASHTO Strength limit states (STRENGTH-I through STRENGTH-V). Applied load magnitudes range from 105 kips (dead load) to less than 10 kips (wind on live load). Further, for load types such as impact, braking, and various wind loads, multiple instances (3) of the load types are considered.
Even under these simplified loading conditions, 19 unique AASHTO Load Combinations are created. Manual post-processing of analysis output data, followed by tabulation of relevant results, can be a time-consuming process. To help reduce post-processing and reporting efforts, the Report Generator can be utilized after running an analysis to quickly isolate a desired summary (or subset) of the analysis output data, and generate a report of pertinent data.
Page 2
Index Table
Report Generator for Building
Customized Client Reports
Page 2
New Axial (Skin, Tip) Resistance Curves
Page 8
Lateral Stability Analysis for
Minimum Pile Tip Embedment of
Substructures within Bridge Models
Page 13
Program Status
Page 19
FB-MultiPier v5.6.0FB-Deep v2.06
Atlas v7.1
Contact BSI
Page 20
Bridge Software InstituteUniversity of Florida
PO Box 116580Gainesville, FL 32611
Online: bsi.ce.ufl.eduEmail: [email protected]
FALL 2019
Issue #25 Bridge Software Institute - Newsletter Page 2 Page 3
Figure 1. 3D View of illustrative pile bent: a) configuration; b) numerical model with
example of applied nodal loads
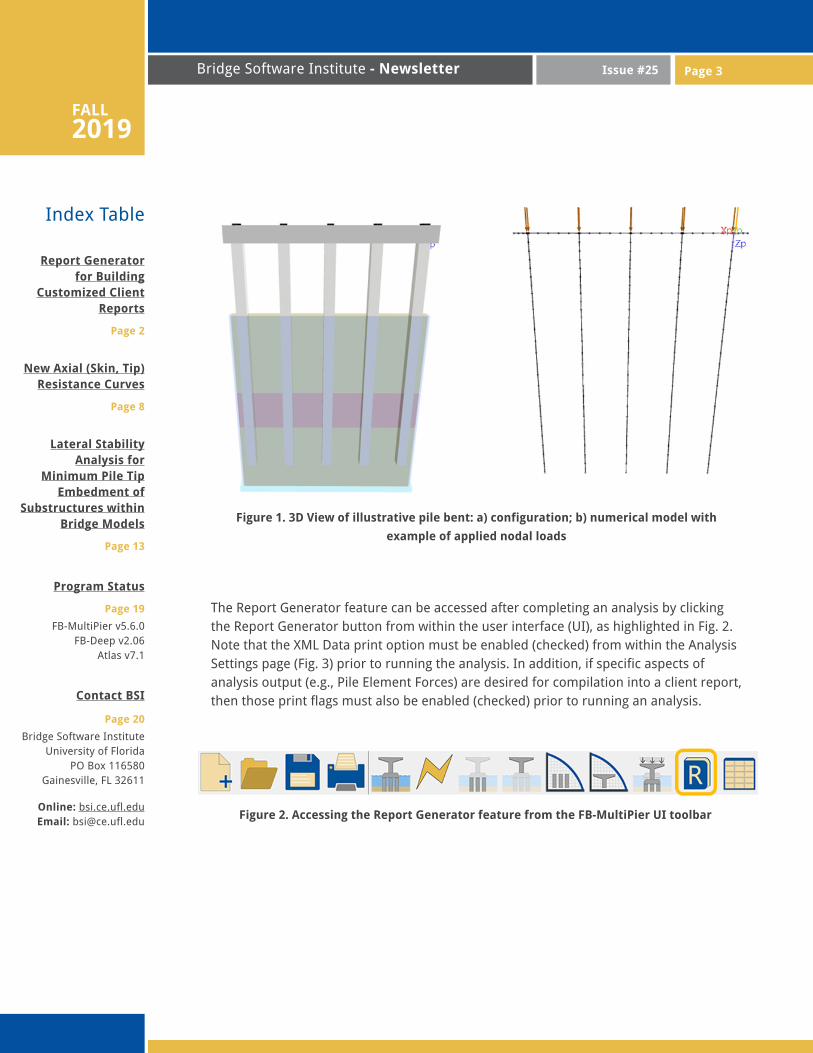
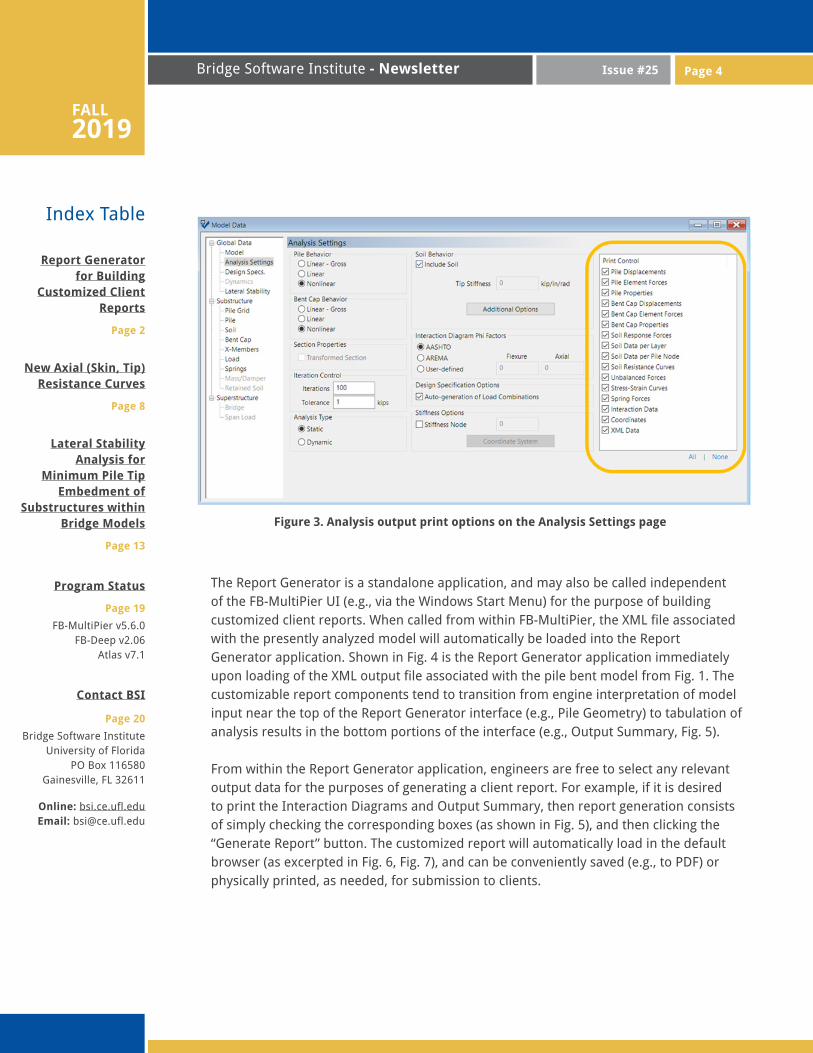
The Report Generator feature can be accessed after completing an analysis by clicking the Report Generator button from within the user interface (UI), as highlighted in Fig. 2. Note that the XML Data print option must be enabled (checked) from within the Analysis Settings page (Fig. 3) prior to running the analysis. In addition, if specific aspects of analysis output (e.g., Pile Element Forces) are desired for compilation into a client report, then those print flags must also be enabled (checked) prior to running an analysis.
Figure 2. Accessing the Report Generator feature from the FB-MultiPier UI toolbar
Index Table
Report Generator for Building
Customized Client Reports
Page 2
New Axial (Skin, Tip) Resistance Curves
Page 8
Lateral Stability Analysis for
Minimum Pile Tip Embedment of
Substructures within Bridge Models
Page 13
Program Status
Page 19
FB-MultiPier v5.6.0FB-Deep v2.06
Atlas v7.1
Contact BSI
Page 20
Bridge Software InstituteUniversity of Florida
PO Box 116580Gainesville, FL 32611
Online: bsi.ce.ufl.eduEmail: [email protected]
FALL 2019
Issue #25 Bridge Software Institute - Newsletter
Figure 3. Analysis output print options on the Analysis Settings page
Page 4
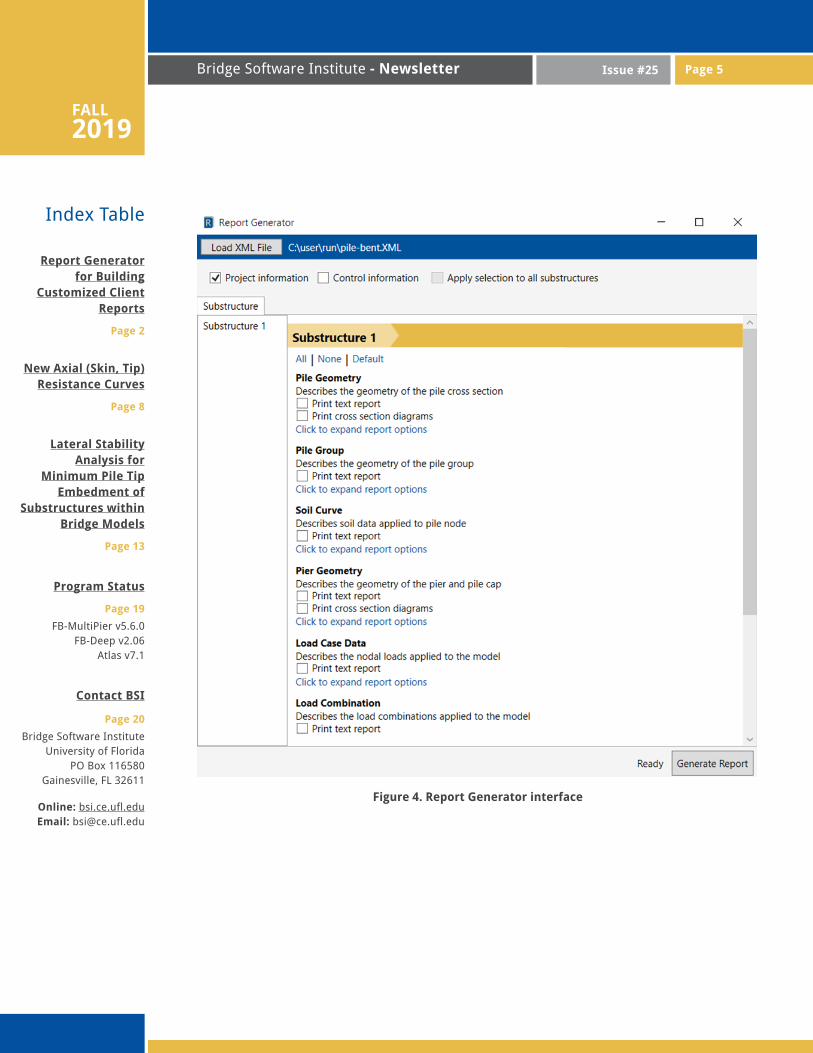
The Report Generator is a standalone application, and may also be called independent of the FB-MultiPier UI (e.g., via the Windows Start Menu) for the purpose of building customized client reports. When called from within FB-MultiPier, the XML file associated with the presently analyzed model will automatically be loaded into the Report Generator application. Shown in Fig. 4 is the Report Generator application immediately upon loading of the XML output file associated with the pile bent model from Fig. 1. The customizable report components tend to transition from engine interpretation of model input near the top of the Report Generator interface (e.g., Pile Geometry) to tabulation of analysis results in the bottom portions of the interface (e.g., Output Summary, Fig. 5).
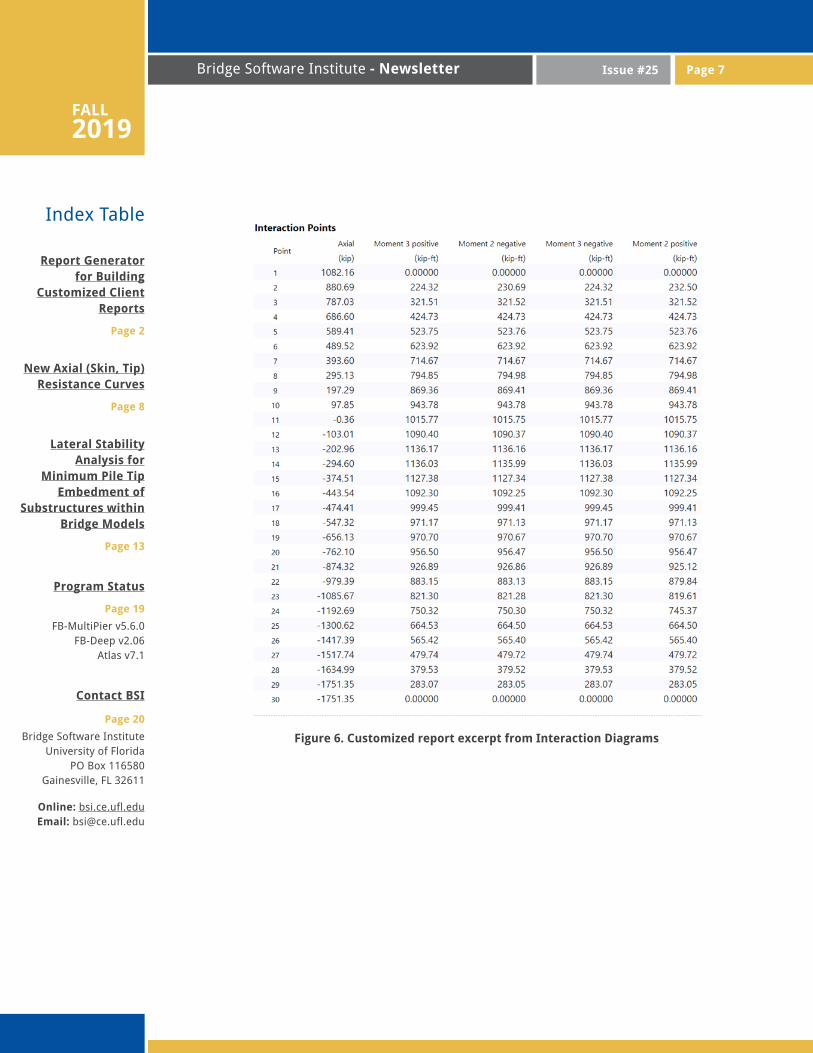
From within the Report Generator application, engineers are free to select any relevant output data for the purposes of generating a client report. For example, if it is desired to print the Interaction Diagrams and Output Summary, then report generation consists of simply checking the corresponding boxes (as shown in Fig. 5), and then clicking the “Generate Report” button. The customized report will automatically load in the default browser (as excerpted in Fig. 6, Fig. 7), and can be conveniently saved (e.g., to PDF) or physically printed, as needed, for submission to clients.
Index Table
Report Generator for Building
Customized Client Reports
Page 2
New Axial (Skin, Tip) Resistance Curves
Page 8
Lateral Stability Analysis for
Minimum Pile Tip Embedment of
Substructures within Bridge Models
Page 13
Program Status
Page 19
FB-MultiPier v5.6.0FB-Deep v2.06
Atlas v7.1
Contact BSI
Page 20
Bridge Software InstituteUniversity of Florida
PO Box 116580Gainesville, FL 32611
Online: bsi.ce.ufl.eduEmail: [email protected]
FALL 2019
Issue #25 Bridge Software Institute - Newsletter Page 5
Figure 4. Report Generator interface

Index Table
Report Generator for Building
Customized Client Reports
Page 2
New Axial (Skin, Tip) Resistance Curves
Page 8
Lateral Stability Analysis for
Minimum Pile Tip Embedment of
Substructures within Bridge Models
Page 13
Program Status
Page 19
FB-MultiPier v5.6.0FB-Deep v2.06
Atlas v7.1
Contact BSI
Page 20
Bridge Software InstituteUniversity of Florida
PO Box 116580Gainesville, FL 32611
Online: bsi.ce.ufl.eduEmail: [email protected]
FALL 2019
Issue #25 Bridge Software Institute - Newsletter Page 6
Figure 5. Report Generator interface with selection of Interaction Diagrams and Output
Summary report components
Index Table
Report Generator for Building
Customized Client Reports
Page 2
New Axial (Skin, Tip) Resistance Curves
Page 8
Lateral Stability Analysis for
Minimum Pile Tip Embedment of
Substructures within Bridge Models
Page 13
Program Status
Page 19
FB-MultiPier v5.6.0FB-Deep v2.06
Atlas v7.1
Contact BSI
Page 20
Bridge Software InstituteUniversity of Florida
PO Box 116580Gainesville, FL 32611
Online: bsi.ce.ufl.eduEmail: [email protected]
FALL 2019
Issue #25 Bridge Software Institute - Newsletter
Figure 6. Customized report excerpt from Interaction Diagrams
Page 6 Page 7
Index Table
Report Generator for Building
Customized Client Reports
Page 2
New Axial (Skin, Tip) Resistance Curves
Page 8
Lateral Stability Analysis for
Minimum Pile Tip Embedment of
Substructures within Bridge Models
Page 13
Program Status
Page 19
FB-MultiPier v5.6.0FB-Deep v2.06
Atlas v7.1
Contact BSI
Page 20
Bridge Software InstituteUniversity of Florida
PO Box 116580Gainesville, FL 32611
Online: bsi.ce.ufl.eduEmail: [email protected]
FALL 2019
Issue #25 Bridge Software Institute - Newsletter Page 8
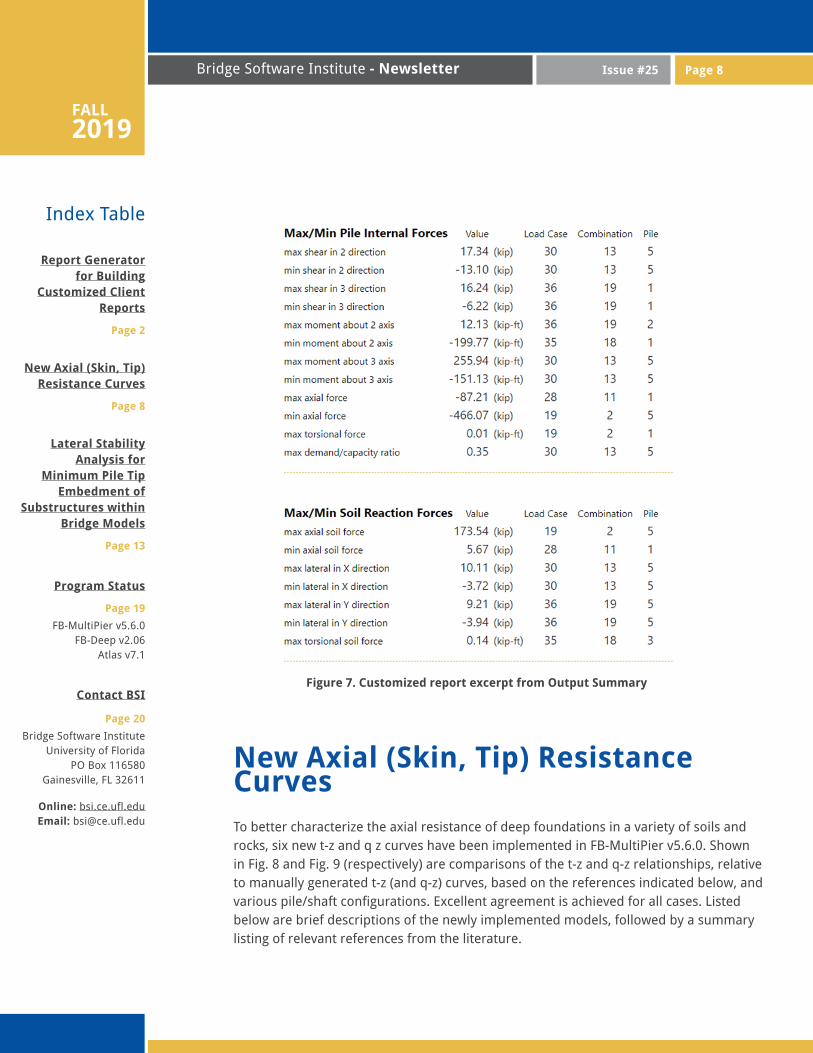
Figure 7. Customized report excerpt from Output Summary
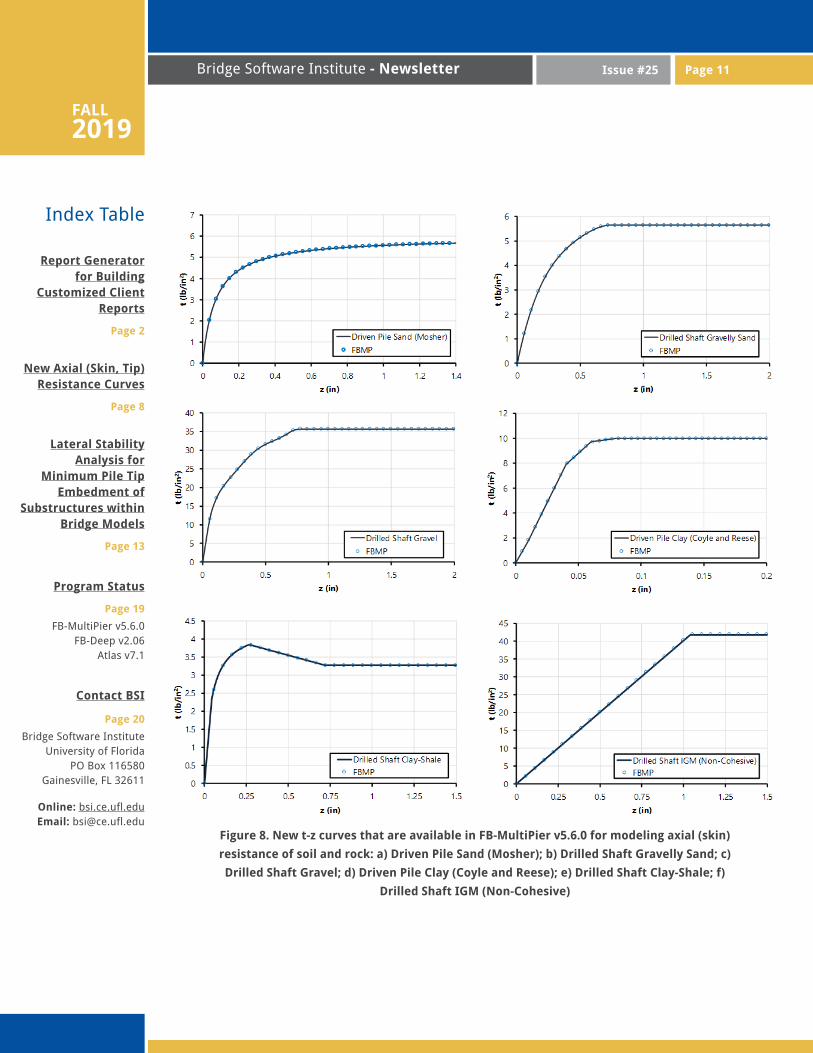
New Axial (Skin, Tip) Resistance CurvesTo better characterize the axial resistance of deep foundations in a variety of soils and rocks, six new t-z and q z curves have been implemented in FB-MultiPier v5.6.0. Shown in Fig. 8 and Fig. 9 (respectively) are comparisons of the t-z and q-z relationships, relative to manually generated t-z (and q-z) curves, based on the references indicated below, and various pile/shaft configurations. Excellent agreement is achieved for all cases. Listed below are brief descriptions of the newly implemented models, followed by a summary listing of relevant references from the literature.
Index Table
Report Generator for Building
Customized Client Reports
Page 2
New Axial (Skin, Tip) Resistance Curves
Page 8
Lateral Stability Analysis for
Minimum Pile Tip Embedment of
Substructures within Bridge Models
Page 13
Program Status
Page 19
FB-MultiPier v5.6.0FB-Deep v2.06
Atlas v7.1
Contact BSI
Page 20
Bridge Software InstituteUniversity of Florida
PO Box 116580Gainesville, FL 32611
Online: bsi.ce.ufl.eduEmail: [email protected]
FALL 2019
Issue #25 Bridge Software Institute - Newsletter Page 8
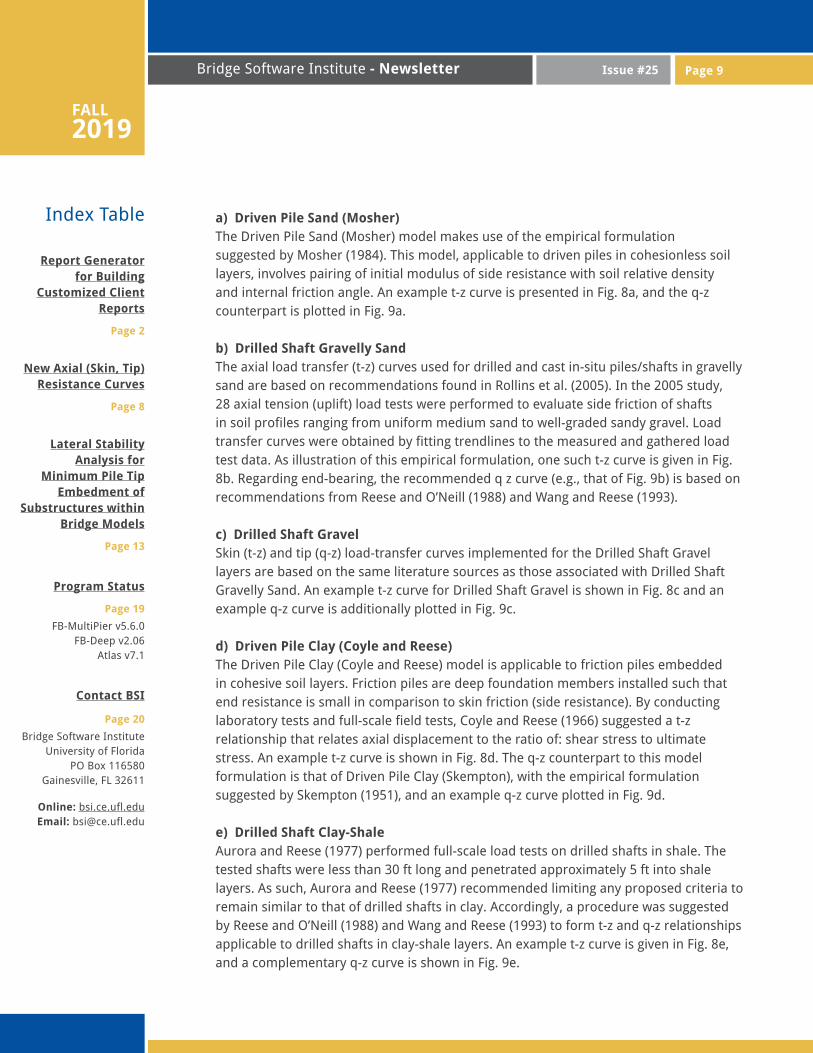
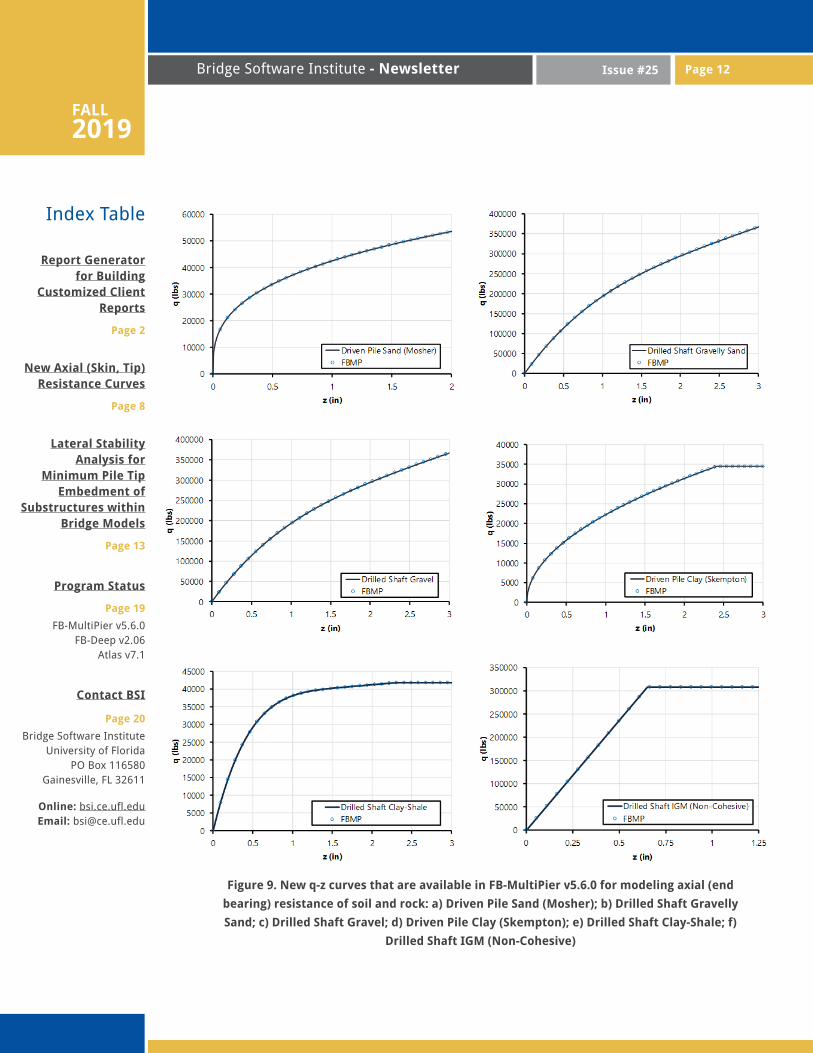
a) Driven Pile Sand (Mosher)The Driven Pile Sand (Mosher) model makes use of the empirical formulation suggested by Mosher (1984). This model, applicable to driven piles in cohesionless soil layers, involves pairing of initial modulus of side resistance with soil relative density and internal friction angle. An example t-z curve is presented in Fig. 8a, and the q-z counterpart is plotted in Fig. 9a.
b) Drilled Shaft Gravelly SandThe axial load transfer (t-z) curves used for drilled and cast in-situ piles/shafts in gravelly sand are based on recommendations found in Rollins et al. (2005). In the 2005 study, 28 axial tension (uplift) load tests were performed to evaluate side friction of shafts in soil profiles ranging from uniform medium sand to well-graded sandy gravel. Load transfer curves were obtained by fitting trendlines to the measured and gathered load test data. As illustration of this empirical formulation, one such t-z curve is given in Fig. 8b. Regarding end-bearing, the recommended q z curve (e.g., that of Fig. 9b) is based on recommendations from Reese and O’Neill (1988) and Wang and Reese (1993).
c) Drilled Shaft GravelSkin (t-z) and tip (q-z) load-transfer curves implemented for the Drilled Shaft Gravel layers are based on the same literature sources as those associated with Drilled Shaft Gravelly Sand. An example t-z curve for Drilled Shaft Gravel is shown in Fig. 8c and an example q-z curve is additionally plotted in Fig. 9c.
d) Driven Pile Clay (Coyle and Reese)The Driven Pile Clay (Coyle and Reese) model is applicable to friction piles embedded in cohesive soil layers. Friction piles are deep foundation members installed such that end resistance is small in comparison to skin friction (side resistance). By conducting laboratory tests and full-scale field tests, Coyle and Reese (1966) suggested a t-z relationship that relates axial displacement to the ratio of: shear stress to ultimate stress. An example t-z curve is shown in Fig. 8d. The q-z counterpart to this model formulation is that of Driven Pile Clay (Skempton), with the empirical formulation suggested by Skempton (1951), and an example q-z curve plotted in Fig. 9d.
e) Drilled Shaft Clay-ShaleAurora and Reese (1977) performed full-scale load tests on drilled shafts in shale. The tested shafts were less than 30 ft long and penetrated approximately 5 ft into shale layers. As such, Aurora and Reese (1977) recommended limiting any proposed criteria to remain similar to that of drilled shafts in clay. Accordingly, a procedure was suggested by Reese and O’Neill (1988) and Wang and Reese (1993) to form t-z and q-z relationships applicable to drilled shafts in clay-shale layers. An example t-z curve is given in Fig. 8e, and a complementary q-z curve is shown in Fig. 9e.
Page 9

Index Table
Report Generator for Building
Customized Client Reports
Page 2
New Axial (Skin, Tip) Resistance Curves
Page 8
Lateral Stability Analysis for
Minimum Pile Tip Embedment of
Substructures within Bridge Models
Page 13
Program Status
Page 19
FB-MultiPier v5.6.0FB-Deep v2.06
Atlas v7.1
Contact BSI
Page 20
Bridge Software InstituteUniversity of Florida
PO Box 116580Gainesville, FL 32611
Online: bsi.ce.ufl.eduEmail: [email protected]
FALL 2019
Issue #25 Bridge Software Institute - Newsletter
f) Drilled Shaft IGM (Non-Cohesive)Mayne and Harris (1993) investigated the resistance and load-settlement behavior of axially loaded drilled shafts socketed in non-cohesive intermediate geomaterials (IGM). The formulation proposed by Mayne and Harris (1993) is based on an approximate elasticity solution and correlations of geomaterial properties with standard penetration test results in cohesionless geomaterials. O’Neill et al. (1996) revised the formulation after conducting load tests on several full-scale drilled shafts. The resulting formulations lead to t-z and q-z curves such as those plotted in Fig. 8f and Fig. 9f, respectively.
References:Aurora, R., and Reese, L. C. (1977). “Field Tests of Drilled Shafts in Clay-Shales.” Ninth International Conference on Soil Mechanics and Foundation Engineering, Tokyo, Japan, 371-376.
Coyle, H. M., and Reese, L. C. (1966). “Load transfer for axially loaded piles in clay,” Journal of Soil Mechanics and Foundations Division, Proceedings Paper 4702, American Society of Civil Engineers, Vol 93(SM6).
Mayne, P. W., Harris, D. E. (1993). Axial Load-Displacement Behavior of Drilled Shaft Foundations in Piedmont Residium. FHWA-RD41-30-2175.
Mosher, R. L. (1984). Load Transfer Criteria for Numerical Analysis of Axially Loaded Piles in Sand. Technical Report K-84-1, U. S. Army Waterways Experiment Station, Automatic Data Processing Center, Vicksburg, Mississippi.
O’Neill, M. W., Townsend, F. C., Hassan, K. M., Buller, A., and Chan, P. S. (1996). Load Transfer for Drilled Shafts in Intermediate Geomaterials. FHWA-RD-95-172.
Reese, L. C., and O’Neill, M. W. (1988). Drilled Shafts: Construction Procedures and Design Methods. Publication No. HI-88-042, Federal Highway Administration, McLean, Virginia, 564.
Rollins, K. M., Clayton, R. J., Mikesell, R. C., and Blaise, B. C. (2005). “Drilled Shaft Side Friction in Gravelly Soils.” Journal of Geotechnical and Geoenvironmental Engineering, 131(8).
Skempton, A. W. (1951). “The Bearing Capacity of Clays.” Proceedings, Building Research Congress, Vol I, Part IIV, 180-189.
Wang, S. T., and Reese, L. C., (1993) COM624P – Laterally loaded pile analysis for the microcomputer, ver. 2.0. FHWA-SA-91-048, Springfield, VA.
Page 10
Index Table
Report Generator for Building
Customized Client Reports
Page 2
New Axial (Skin, Tip) Resistance Curves
Page 8
Lateral Stability Analysis for
Minimum Pile Tip Embedment of
Substructures within Bridge Models
Page 13
Program Status
Page 19
FB-MultiPier v5.6.0FB-Deep v2.06
Atlas v7.1
Contact BSI
Page 20
Bridge Software InstituteUniversity of Florida
PO Box 116580Gainesville, FL 32611
Online: bsi.ce.ufl.eduEmail: [email protected]
FALL 2019
Issue #25 Bridge Software Institute - Newsletter Page 10 Page 11
Figure 8. New t-z curves that are available in FB-MultiPier v5.6.0 for modeling axial (skin)
resistance of soil and rock: a) Driven Pile Sand (Mosher); b) Drilled Shaft Gravelly Sand; c)
Drilled Shaft Gravel; d) Driven Pile Clay (Coyle and Reese); e) Drilled Shaft Clay-Shale; f)
Drilled Shaft IGM (Non-Cohesive)
Index Table
Report Generator for Building
Customized Client Reports
Page 2
New Axial (Skin, Tip) Resistance Curves
Page 8
Lateral Stability Analysis for
Minimum Pile Tip Embedment of
Substructures within Bridge Models
Page 13
Program Status
Page 19
FB-MultiPier v5.6.0FB-Deep v2.06
Atlas v7.1
Contact BSI
Page 20
Bridge Software InstituteUniversity of Florida
PO Box 116580Gainesville, FL 32611
Online: bsi.ce.ufl.eduEmail: [email protected]
FALL 2019
Issue #25 Bridge Software Institute - Newsletter Page 12
Figure 9. New q-z curves that are available in FB-MultiPier v5.6.0 for modeling axial (end
bearing) resistance of soil and rock: a) Driven Pile Sand (Mosher); b) Drilled Shaft Gravelly
Sand; c) Drilled Shaft Gravel; d) Driven Pile Clay (Skempton); e) Drilled Shaft Clay-Shale; f)
Drilled Shaft IGM (Non-Cohesive)
Index Table
Report Generator for Building
Customized Client Reports
Page 2
New Axial (Skin, Tip) Resistance Curves
Page 8
Lateral Stability Analysis for
Minimum Pile Tip Embedment of
Substructures within Bridge Models
Page 13
Program Status
Page 19
FB-MultiPier v5.6.0FB-Deep v2.06
Atlas v7.1
Contact BSI
Page 20
Bridge Software InstituteUniversity of Florida
PO Box 116580Gainesville, FL 32611
Online: bsi.ce.ufl.eduEmail: [email protected]
FALL 2019
Issue #25 Bridge Software Institute - Newsletter
Lateral Stability Analysis for Minimum Pile Tip Embedment of Substructures within Bridge ModelsIt is typically necessary to list minimum pile penetration (embedment lengths) in bridge plan documents so as to satisfy lateral loading requirements. However, assessing lateral stability involves modeling, analyzing, and post-processing numerous structural configurations to find optimal pile embedment lengths. To streamline this process, the “Minimum Pile Tip Embedment” (MPTE) feature in FB-MultiPier v5.6.0 automates incremental modification of pile lengths and post-processing of lateral load analysis results for all model types containing soil (even bridge models).
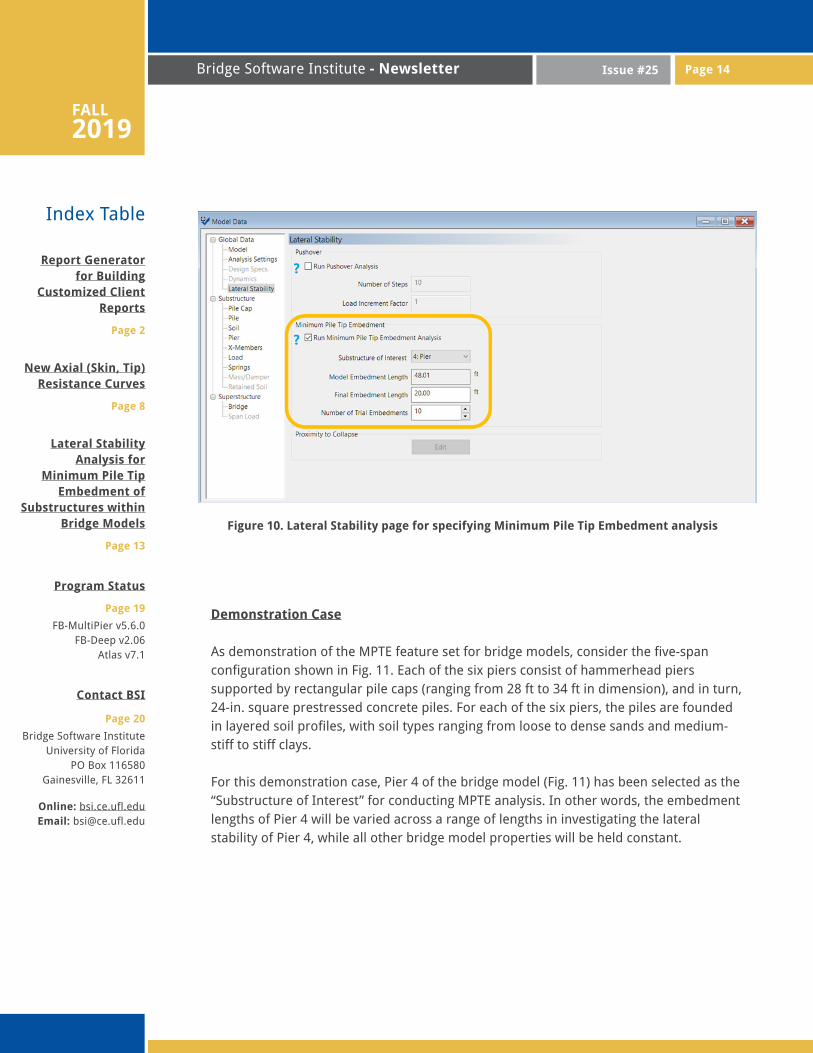
The MPTE feature is accessible from the “Lateral Stability” page (Fig. 10) within the FB-MultiPier UI, and is complementary to other lateral-load analysis modes, such as “Pushover” analysis. When the MPTE feature is enabled, pile lengths are automatically incremented and analyzed over a specified range of candidate embedment lengths. When the MPTE feature is desired for use with bridge models, the Substructure (pier, bent) of interest must be selected from among the MPTE controls on the “Lateral Stability” page. Note that, when operating on a bridge model, the MPTE feature parametrically varies the embedment length for only those piles/shafts located within the substructure of interest. The determination of minimum pile tip embedment is applicable for numerous conditions of loading and soil support. One typical case, involving a bridge model, is demonstrated below.
Page 12 Page 13
Index Table
Report Generator for Building
Customized Client Reports
Page 2
New Axial (Skin, Tip) Resistance Curves
Page 8
Lateral Stability Analysis for
Minimum Pile Tip Embedment of
Substructures within Bridge Models
Page 13
Program Status
Page 19
FB-MultiPier v5.6.0FB-Deep v2.06
Atlas v7.1
Contact BSI
Page 20
Bridge Software InstituteUniversity of Florida
PO Box 116580Gainesville, FL 32611
Online: bsi.ce.ufl.eduEmail: [email protected]
FALL 2019
Issue #25 Bridge Software Institute - Newsletter
Figure 10. Lateral Stability page for specifying Minimum Pile Tip Embedment analysis
Demonstration Case
As demonstration of the MPTE feature set for bridge models, consider the five-span configuration shown in Fig. 11. Each of the six piers consist of hammerhead piers supported by rectangular pile caps (ranging from 28 ft to 34 ft in dimension), and in turn, 24-in. square prestressed concrete piles. For each of the six piers, the piles are founded in layered soil profiles, with soil types ranging from loose to dense sands and medium-stiff to stiff clays.
For this demonstration case, Pier 4 of the bridge model (Fig. 11) has been selected as the “Substructure of Interest” for conducting MPTE analysis. In other words, the embedment lengths of Pier 4 will be varied across a range of lengths in investigating the lateral stability of Pier 4, while all other bridge model properties will be held constant.
Page 14

Index Table
Report Generator for Building
Customized Client Reports
Page 2
New Axial (Skin, Tip) Resistance Curves
Page 8
Lateral Stability Analysis for
Minimum Pile Tip Embedment of
Substructures within Bridge Models
Page 13
Program Status
Page 19
FB-MultiPier v5.6.0FB-Deep v2.06
Atlas v7.1
Contact BSI
Page 20
Bridge Software InstituteUniversity of Florida
PO Box 116580Gainesville, FL 32611
Online: bsi.ce.ufl.eduEmail: [email protected]
FALL 2019
Issue #25 Bridge Software Institute - Newsletter
Figure 11. 3D View of illustrative bridge model
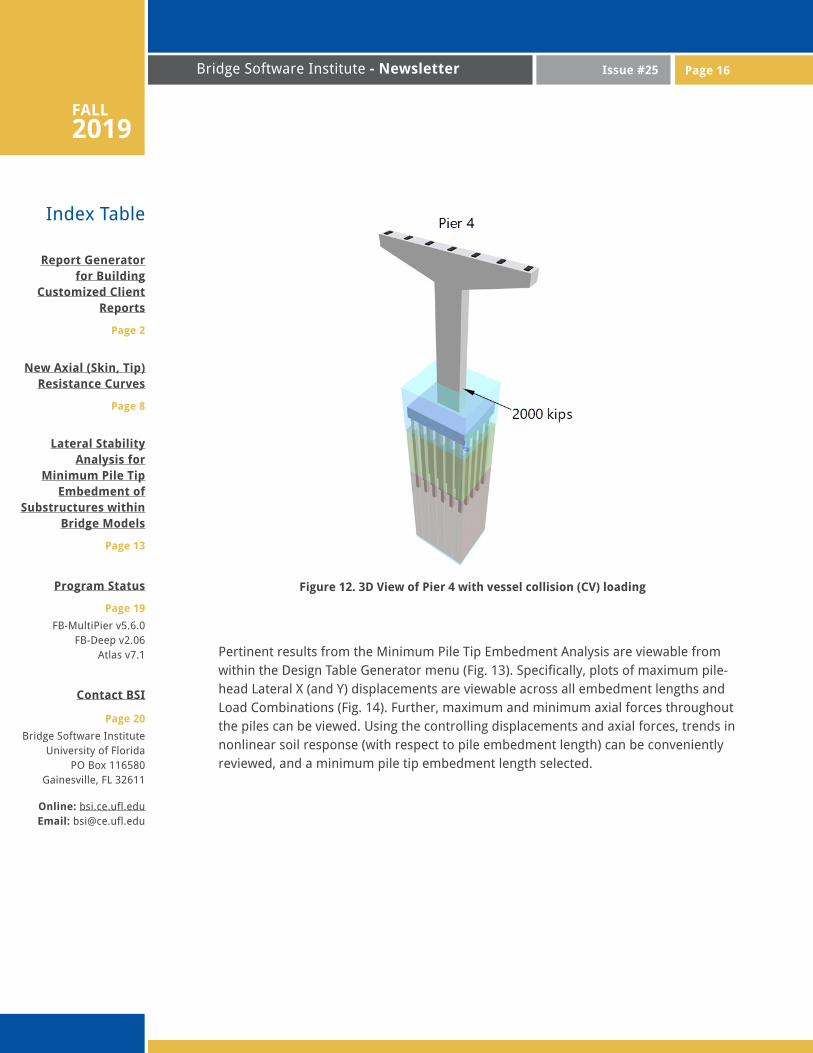
For this demonstration case, the minimum pile embedment length will be determined to satisfy lateral stability under AASHTO Extreme-II loading. Further, in this demonstration, a 2000-kip lateral load has been applied to the pier column of Pier 4 (Fig. 12), mimicking a static vessel collision impact load (i.e., an AASHTO load of type CV). For the bridge considered, it is assumed that the contractor will drive the piles so that the required axial capacity is attained. Therefore, soil tip resistance (q-z) in the model is increased to a magnitude that will not allow compressive failure at the already-attained ultimate axial soil capacity. For the substructure of interest (Pier 4), embedment lengths ranging from 48 ft to 20 ft are investigated over eleven unique trial embedment depths (base model plus 10 variations, recall Fig. 10).
Page 15
Index Table
Report Generator for Building
Customized Client Reports
Page 2
New Axial (Skin, Tip) Resistance Curves
Page 8
Lateral Stability Analysis for
Minimum Pile Tip Embedment of
Substructures within Bridge Models
Page 13
Program Status
Page 19
FB-MultiPier v5.6.0FB-Deep v2.06
Atlas v7.1
Contact BSI
Page 20
Bridge Software InstituteUniversity of Florida
PO Box 116580Gainesville, FL 32611
Online: bsi.ce.ufl.eduEmail: [email protected]
FALL 2019
Issue #25 Bridge Software Institute - Newsletter
Figure 12. 3D View of Pier 4 with vessel collision (CV) loading
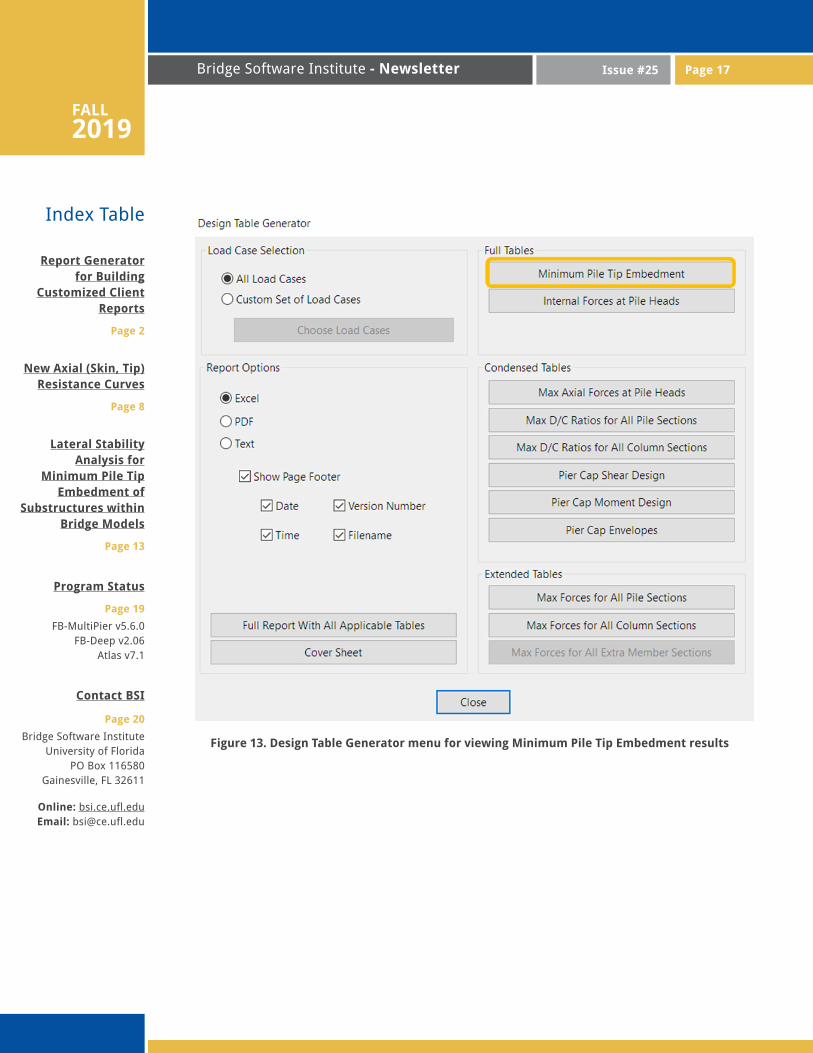
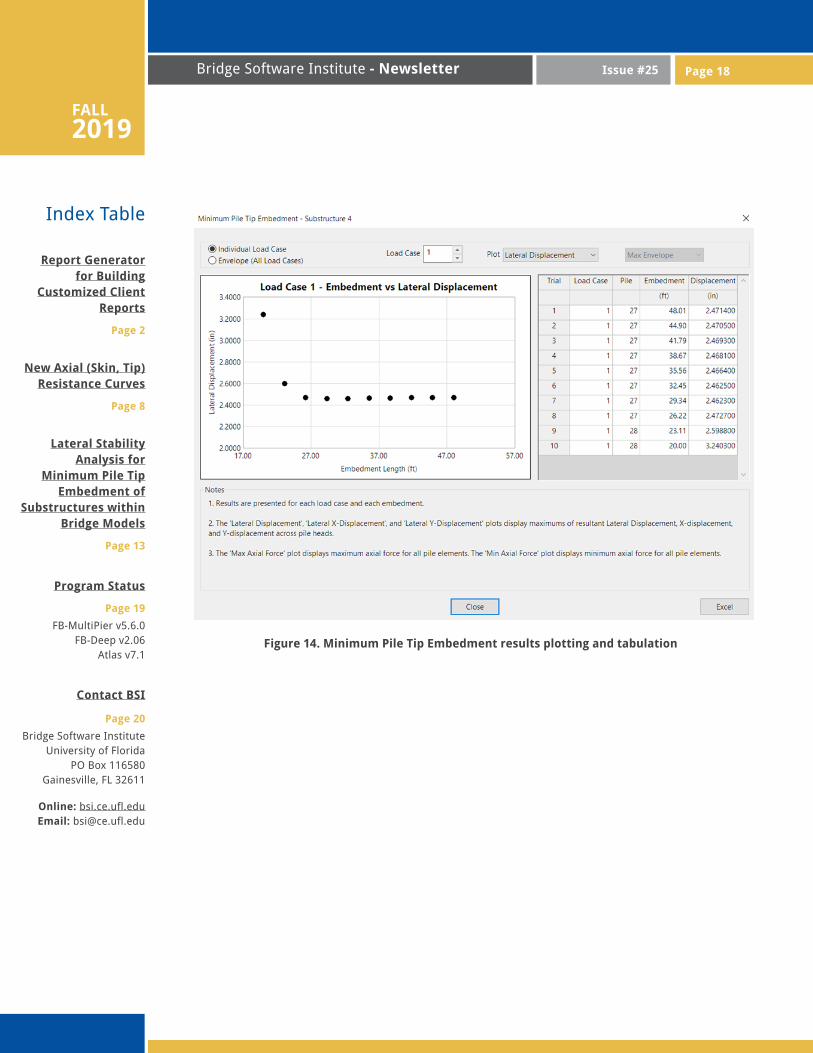
Pertinent results from the Minimum Pile Tip Embedment Analysis are viewable from within the Design Table Generator menu (Fig. 13). Specifically, plots of maximum pile-head Lateral X (and Y) displacements are viewable across all embedment lengths and Load Combinations (Fig. 14). Further, maximum and minimum axial forces throughout the piles can be viewed. Using the controlling displacements and axial forces, trends in nonlinear soil response (with respect to pile embedment length) can be conveniently reviewed, and a minimum pile tip embedment length selected.
Page 16
Index Table
Report Generator for Building
Customized Client Reports
Page 2
New Axial (Skin, Tip) Resistance Curves
Page 8
Lateral Stability Analysis for
Minimum Pile Tip Embedment of
Substructures within Bridge Models
Page 13
Program Status
Page 19
FB-MultiPier v5.6.0FB-Deep v2.06
Atlas v7.1
Contact BSI
Page 20
Bridge Software InstituteUniversity of Florida
PO Box 116580Gainesville, FL 32611
Online: bsi.ce.ufl.eduEmail: [email protected]
FALL 2019
Issue #25 Bridge Software Institute - Newsletter
Figure 13. Design Table Generator menu for viewing Minimum Pile Tip Embedment results
Page 17
Index Table
Report Generator for Building
Customized Client Reports
Page 2
New Axial (Skin, Tip) Resistance Curves
Page 8
Lateral Stability Analysis for
Minimum Pile Tip Embedment of
Substructures within Bridge Models
Page 13
Program Status
Page 19
FB-MultiPier v5.6.0FB-Deep v2.06
Atlas v7.1
Contact BSI
Page 20
Bridge Software InstituteUniversity of Florida
PO Box 116580Gainesville, FL 32611
Online: bsi.ce.ufl.eduEmail: [email protected]
FALL 2019
Issue #25 Bridge Software Institute - Newsletter
Figure 14. Minimum Pile Tip Embedment results plotting and tabulation
Page 18
Index Table
Report Generator for Building
Customized Client Reports
Page 2
New Axial (Skin, Tip) Resistance Curves
Page 8
Lateral Stability Analysis for
Minimum Pile Tip Embedment of
Substructures within Bridge Models
Page 13
Program Status
Page 19
FB-MultiPier v5.6.0FB-Deep v2.06
Atlas v7.1
Contact BSI
Page 20
Bridge Software InstituteUniversity of Florida
PO Box 116580Gainesville, FL 32611
Online: bsi.ce.ufl.eduEmail: [email protected]
FALL 2019
Issue #25 Bridge Software Institute - Newsletter
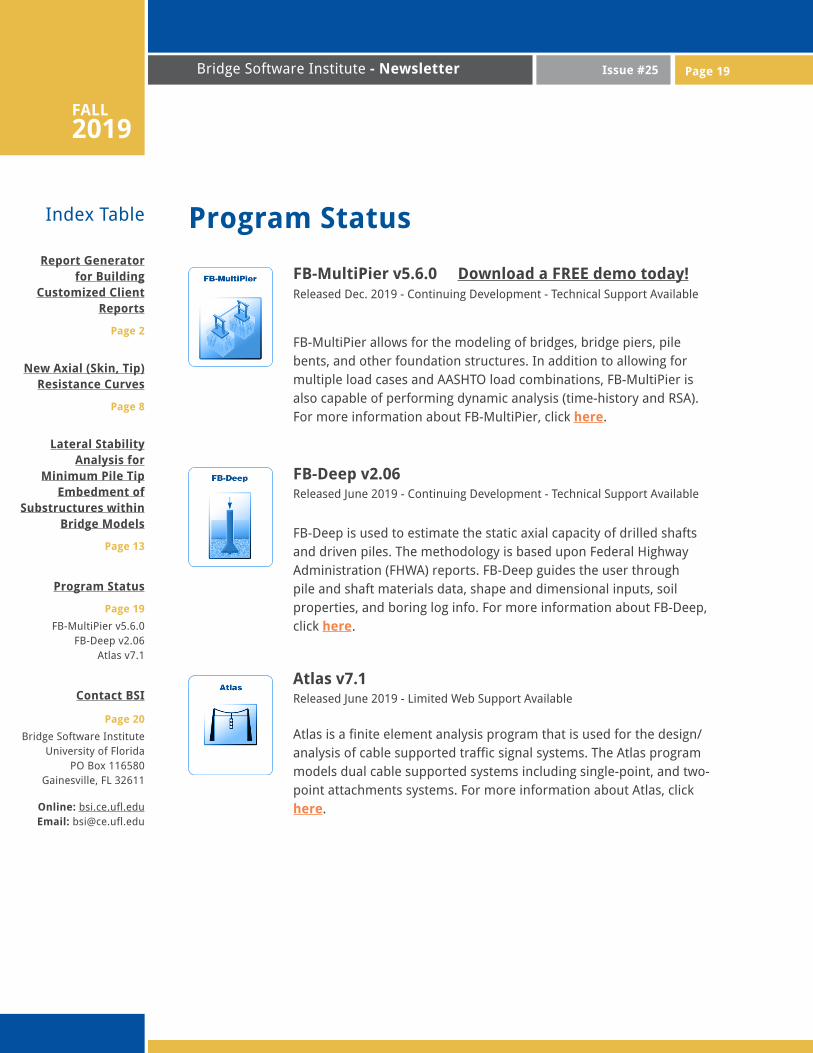
FB-MultiPier v5.6.0 Download a FREE demo today!Released Dec. 2019 - Continuing Development - Technical Support Available
FB-MultiPier allows for the modeling of bridges, bridge piers, pile bents, and other foundation structures. In addition to allowing for multiple load cases and AASHTO load combinations, FB-MultiPier is also capable of performing dynamic analysis (time-history and RSA). For more information about FB-MultiPier, click here.
Program Status
FB-Deep v2.06 Released June 2019 - Continuing Development - Technical Support Available
Atlas v7.1Released June 2019 - Limited Web Support Available
FB-Deep is used to estimate the static axial capacity of drilled shafts and driven piles. The methodology is based upon Federal Highway Administration (FHWA) reports. FB-Deep guides the user through pile and shaft materials data, shape and dimensional inputs, soil properties, and boring log info. For more information about FB-Deep, click here.
Atlas is a finite element analysis program that is used for the design/analysis of cable supported traffic signal systems. The Atlas program models dual cable supported systems including single-point, and two-point attachments systems. For more information about Atlas, click here.
Page 19

Index Table
Report Generator for Building
Customized Client Reports
Page 2
New Axial (Skin, Tip) Resistance Curves
Page 8
Lateral Stability Analysis for
Minimum Pile Tip Embedment of
Substructures within Bridge Models
Page 13
Program Status
Page 19
FB-MultiPier v5.6.0FB-Deep v2.06
Atlas v7.1
Contact BSI
Page 20
Bridge Software InstituteUniversity of Florida
PO Box 116580Gainesville, FL 32611
Online: bsi.ce.ufl.eduEmail: [email protected]
FALL 2019
Issue #25 Bridge Software Institute - Newsletter
Contact BSIIf you need to contact BSI for any reason you can use any of the methods below: Online: bsi.ce.ufl.eduEmail: [email protected]
Mailing Address: Bridge Software InstituteUniversity of FloridaPO Box 116580Gainesville, FL 32611
Page 20