in this issue editor’s corner - earth observing system · 2017-01-26 · the earth observer •...
TRANSCRIPT

Ear
thObserving System
THE EARTH OBSERVER
July / August 2003, Vol. 15, No. 4
In this issue ...Meeting/Workshop Summaries
Minutes of the Aqua Science WorkingGroup Meeting .............................. 3
Report on the PO.DAAC User WorkingGroup Meeting ............................ 19
ORNL DAAC for Biochemical Dynam-ics Working Group Meeting ........ 20
Other Items of Interest
Third Annual Earth Science TechnologyConference a Success .................. 23
The CERES S’COOL Project .......... 24
Kudos ............................................... 28
Global Garden Gets Greener ........... 29
Regular Features
Earth Science Education ProgramUpdate ......................................... 32
EOS Scientists in the News ............. 34
Getting to Know ESTO ................... 36
Science Calendars ............................ 37
The Earth Observer Information/Inquiries ........................ Back Cover
Continued on page 2
EDITOR’S CORNER
Michael King
EOS Senior Project Scientist
I’m pleased to share with you exciting new science discoveries utilizingdata from multiple EOS instruments. Recent data comparisons between theGeoscience Laser Altimeter System (GLAS) on ICESat and the ModerateResolution Imaging Spectroradiometer (MODIS) on Terra show very goodagreement in the determination of cloud occurrence, even in Polar regions,especially during the daytime. But not all the news is good to excellent.For example, ICESat has been experiencing problems with its laser altimetersystem, and is currently in “safe mode” pending the implementation of acorrective solution. The final report on ICESat’s status and recommendedresolutions is due out as you read this, which is too late for an additionalcoincident imaging opportunity with Terra.
The next opportunity for coincident data acquisition with Terra, Aqua, andICESat is in 2004, but this depends on ICESat’s laser lifetime and opera-tional plans. ’Planning is underway for several other multi-platform datasets utilizing data from these and other EOS missions. The EOS formationflying “A-Train” will synchronize orbits and data acquisition from sensorson Aqua, Aura, PARASOL, and three Earth System Science Pathfinder(ESSP) missions. Combined data sets are already utilizing MODIS datafrom both Terra and Aqua, and the EOS Research Strategy calls for addi-tional emphasis on multi-sensor data analysis. Watch The Earth Observer formore information on exciting new science discoveries as new missionsbecome operational.
Despite the anomalies with ICESat’s first laser, data quality is excellent andvalidation is well underway for this and other new EOS missions. Inaccordance with the evolving laser situation and operational plans, newreference orbits are being calculated for ICESat, and, once generated, will beincorporated into the data processing and ground control systems. Addi-

THE EARTH OBSERVER • July/August 2003 Vol. 15 No. 4
2
tional validation is being conducted forprecise ground track repeats and offnadir pointing and to avoid coinci-dences with the Hubble Space Tele-scope.
Aura is scheduled for launch in early2004, and its Validation Plan involvesuse of the NASA WB-57 aircraftoutfitted with simulator instruments,the Intercontinental Chemical Trans-port Experiment (INTEX), and fieldexperiments in Costa Rica, Darwin,Australia, and Guam. There will alsobe coordination with the ConvectionAnd Moisture Experiment (CAMEX),and the possible use of unmannedaircraft towards the end of the valida-tion phase.
The Grand Teton rises to 13,770 feet (about 4,200 meters), and twelve of the Teton peaks in the range rise above 12,000 feet (3,660 m), more than a mileabove the valley below (known as Jackson Hole). They form the youngest section of the Rocky Mountains, yet conversely their uplifting exposes some of theoldest rock formations in North America. The gradual slope on the western side of the peaks reflects the uplifting and tilting of the section of the NorthAmerican crust shown here. This visualization combines imagery from the Landsat 7 Enhanced Thematic Mapper Plus (ETM+) instrument with elevationdata derived from the Shuttle Radar Topography Mission (SRTM) and the United States Geological Survey’s Digital Terrain Elevation Data (DTED). Theelevation extrusion shown here is to proper scale with no vertical exaggeration. The view shown simulates the view of the park and its immediatesurroundings from an elevated camera looking at the park to the south and west. These ETM+ data were acquired on September 23, 2002.
The Advanced Microwave ScanningRadiometer-EOS (AMSR-E) validationplan includes eight aircraft flights overthe Weddell Sea and BellingshausenSea in and around Antarctica thisSeptember for the purpose of validat-ing AMSR-E’s sea ice algorithms. Inaddition to the P-3B airborne sensors,this experiment includes in situ andhigh-resolution observations from shipas well as Landsat 7, MODIS on Terraand Aqua, Envisat, and Radarsat.
Finally, special sessions on EOS arebeing planned for the upcomingAmerican Geophysical Union (AGU)meeting in December. The AGU fallmeeting in San Francisco is one of thelargest multi-disciplinary Earth sciencemeetings in the world, typically
attracting over 6,000 attendees fromacademia, government and thecommercial sector. A special hydrologysession emphasizing data from Aquahas been accepted, as well as sessionson the solar spectrum and its impact onlife on Earth utilizing SORCE data anda Union session on human-inducedclimate variations linked to urbaniza-tion (see www.agu.org/meetings/fm03)There will be several other talks,posters, and exhibits highlighting thelatest EOS scientific achievements aswell. I encourage you to participate inthis important meeting, and takeadvantage of the opportunity to learnmore about these exciting EOS activi-ties.
THE EARTH OBSERVER • July/August 2003 Vol. 15, No. 4
3
Opening Plenary Session
The May 28-29, 2003, Aqua ScienceWorking Group meeting was openedby Aqua Project Scientist and sessionchair Claire Parkinson, who com-mented on the striking contrastbetween the state the Aqua team was in13 months ago, anxiously awaiting thelaunch of the Aqua spacecraft, and thestate we are in today, with the space-craft in orbit and a year’s worth of datacollected. In honor of the one-yearanniversary since launch, Parkinsonpresented the five Aqua science teamleaders with plaques thanking them fortheir leadership and for their manycontributions to the Aqua programover the past decade. These plaqueswent to Moustafa Chahine, Leader ofthe Science Team for the AtmosphericInfrared Sounder (AIRS), the AdvancedMicrowave Sounding Unit (AMSU),and the Humidity Sounder for Brazil(HSB), commonly referred to collec-tively as the AIRS Science Team; AkiraShibata, Leader of the Japanese ScienceTeam for the Advanced MicrowaveScanning Radiometer for the EarthObserving System (AMSR-E), aninstrument provided by Japan’sNational Space Development Agency(NASDA); Roy Spencer, Leader of theU.S. AMSR-E Science Team; VinceSalomonson, Leader of the ModerateResolution Imaging Spectroradiometer(MODIS) Science Team; and BruceWielicki, Leader of the Clouds and theEarth’s Radiant Energy System
(CERES) Science Team. (The CERESplaque was presented to Norman Loebfor Wielicki, who was unable to attendbecause of other commitments.)Parkinson also presented a plaque toBill Guit, the Aqua Mission Director, inrecognition of the superb job that Guitand the Mission Operations Team havedone in getting the data down from thespacecraft and to the data centersthroughout the first year of Aqua datacollection.
Parkinson then thanked Al Chang forhis many years of service as the AquaDeputy Project Scientist, lastingthrough launch, and introduced StevePlatnick as the new Deputy ProjectScientist, as of January 1, 2003.
Parkinson showed the first page of a 4-page list of internet links where Aquadata and/or images are available andasked for anyone having additions tothe list to contact her, Steve Graham, orSteve Platnick. Next she showed a copyof the recently published Aqua SpecialIssue of the IEEE Transactions on
Geoscience and Remote Sensing andpointed to the pile of copies in the backof the room, intended for each of theattendees. This special issue, edited byParkinson, Chahine, Salomonson, andChris Kummerow, has 330 pages and29 articles devoted to the Aquamission. Copies are available from theEOS Project Science Office (sendrequests [email protected]).
Aqua Spacecraft Status
Parkinson introduced Aqua MissionDirector Bill Guit, who spoke on theAqua spacecraft and instrument status,data capture, and Level 0 data process-ing. As explained by Guit, the space-craft and all subsystems are workingwell. The ninth and tenth routine dragmake-up maneuvers for Aqua, tomaintain the desired ground track,were performed on March 19 and April24. These maneuvers have successfullykept the Aqua ground track well withinthe original ± 20-km specifications and,in fact, generally within the morestringent ± 10-km specifications desiredonce the other satellites of the EOSAfternoon Constellation (often referredto as the “A-Train”) are launched in2004.
Guit mentioned a command anomalythat occurred on May 2, 2003, whenground system development teamtesters accidentally sent 100 commandsto the spacecraft. Fortunately, thesewere commands that did not involveoperations (called “no-op commands”)and therefore had no impact onspacecraft operations. Nevertheless,Mission Operations personnel haveimplemented a number of correctiveactions to prevent a repeat of this event.Also, on May 12 there was an operatorerror (unusual in the Aqua experience),resulting in a 12-minute data loss.There are two ongoing spacecraftanomaly investigations, one dealing
Minutes of the Aqua Science Working Group Meeting,May 28-29, 2003
— Claire L. Parkinson, [email protected], Goddard Space Flight Center— Moustafa T. Chahine, [email protected], Jet Propulsion Laboratory— Steven Platnick, [email protected], Goddard Space Flight Center

THE EARTH OBSERVER • July/August 2003 Vol. 15 No. 4
4
with performance of the propulsionsystem and the other with the solararray drive assembly (SADA) potenti-ometer.
With the exception of the HSB, all Aquainstruments are doing well. The HSBhad been experiencing minor synchro-nization problems with a frequency ofabout twice a week, when on February5 a greater error was detected, suggest-ing that the motor had stalled. Guitbelieves the problem is likely electricalin nature since there is no indication ofmechanical difficulties. Nine attemptshave been made to resuscitate the HSB,so far without success.
A much lesser problem occurred onMarch 8 when one of the two CERESinstruments (CERES-Aft) temporarilyslipped into safe mode. The instrumentremained in safe mode for several daysbut has been operating successfullysince then.
Guit emphasized the need for the Aquascientists to work together with the
Mission Operations team, for mutualbenefit. For example, Mission Opera-tions personnel are able to make someadjustments in the timing of maneu-vers and other operations to avoidinterfering with validation campaigns,as long as they are informed before-hand of the timing of these campaigns.It is also important for the scientists toinform Guit and/or Angie Kelly whenthey observe possible instrumentanomalies in the data sets, such as therecently observed non-random noise inthe AMSU-A1 Channel 7 performanceand the radio-frequency interference inthe AMSR-E C-band receiver. TheAMSU-A1 Channel 7 noise appearscorrelated with latitude/orbitalposition; Roy Spencer mentioned thatsimilar problems have been observedwith the NOAA 17 AMSU-A1 as well.
Guit concluded by providing theimpressive overall data capture ratethat the Aqua flight operations teamhas accomplished: 99.9910791%.
MODIS Science Team Update
The MODIS Science Team Leader Vince
Salomonson began the MODISpresentation by giving a brief overviewof the Terra and Aqua MODIS repro-cessing efforts before turning thepresentation over to Shaida Johnston
to present more details on the status ofthe MODIS data products and thereprocessing. The data products arelabeled “beta,” “provisional,” or“validated,” depending on the stage ofthe validation effort. Beta products areminimally validated, early releaseproducts that enable users to gainfamiliarity with data formats andparameters; provisional products arepartially validated and are useful forexploratory and process scientificstudies; and validated products arehigh-quality products with welldefined uncertainties, suitable forsystematic scientific studies andpublication.
Johnston indicated that: (1) Level 1products for the Aqua MODIS are nowall at provisional status; (2) oceanproducts are all either provisional or, inthe case of SST, validated; (3) many ofthe atmosphere products are alsoprovisional; and (4) the land productsinclude a mixture of provisional andbeta products.
MODIS data products are grouped intomajor “Collections,” with the currentAqua MODIS products constitutingCollection 3. The upcoming Collection4 data will incorporate several im-provements, including geolocationimprovements, band 26 corrections,algorithm alternatives to avoid the useof band 6 (which has several faileddetectors) in the cloud mask and snowproducts, and improvements in theatmospheric profiles. Johnston ex-plained that the MODIS Team is in the
On March 19, 2003, fire in southern Mexico and Central America billowed a cloud of smoke out overthe Gulf of Mexico. In this Moderate Resolution Imaging Spectroradiometer (MODIS) image, fireshave been marked in gray rectangles, with the highest density occurring in northern Guatemala.
THE EARTH OBSERVER • July/August 2003 Vol. 15, No. 4
5
midst of MODIS Collection 4 reprocess-ing for Terra and will not begin theAqua Collection 4 reprocessing untilthe Terra reprocessing is completed,freeing the computers to proceed withAqua. Current expectations are that theAqua Collection 4 reprocessing willbegin in November 2003 at the earliest.Johnston explained that becausereprocessing requires considerableeffort, reprocessing is only done whenthe software changes are consideredsignificant. Salomonson furtherexplained that major science softwarechanges for the MODIS data are quiterare and that minor changes such asmetadata changes are considerablymore frequent. Johnston proceeded toexplain that each time the reprocessinghas been done, it was done faster thanthe previous reprocessings. Sheanticipates Collection 4 for Aqua to becompleted in 2004, Collection 5 in the2004/2005 time frame, and Collection 6in the 2006 time frame. Earlier dataCollections are deleted about sixmonths after the Collection becomesoutdated. The MODIS Science Teamhopes to have at least a three-yearoverlap between Terra and Aqua data.
Japanese AMSR-E Science Team Update
Team Leader Akira Shibata gave theoverview for the Japanese AMSR-EScience Team, starting by indicating thestability of the instrument and showingplots of the radiometric noise. He thenlisted the standard data products forthe Japanese Team, in each caseindicating whether the product isvalidated, working but not validated,or not yet calibrated. Three of theproducts were listed as validated: thewater vapor product of Takeuchi andthe sea surface wind speed (SSW) andsea surface temperature (SST) productsof Shibata. Products listed as workingbut not validated were precipitation,
sea ice, and snow. Soil moisture isexpected to be calibrated by the end of2003.
Shibata showed charts for water vaporvalidation under clear and cloudyconditions, followed by charts on SSTand SSW validation. Major fieldexperiments have included a WakasaBay snowfall experiment in the winterof 2003, Mongolian soil moistureexperiments, radiometer observationson small islands, and rain gaugeobservations around an Ishigaki radar.The Wakasa Bay experiment involvedthe NASA P-3B aircraft as well asJapanese aircraft, ship, and groundobservations. Ground measurements inthe soil moisture experiment weretaken by automatic stations installedsystematically within a 120-km x 160-km grid in central Mongolia.
The official AMSR-E Level 1 dataproducts are expected to be released tothe public soon, following a May 28,2003, data review at NASDA. Opera-tional transmission should begin inJune, and NASDA’s geophysicalproducts should be available within thenext few months.
Shibata concluded his presentationwith four impressive animations of theAqua AMSR-E and ADEOS II AMSRdata, starting with an animation ofglobal, 10-day-averaged AMSR-E SSTdata for the period June 2002 to May2003. This was followed by animationsof precipitation from ADEOS II AMSRdata for a typhoon in 2003, sea ice fromAMSR-E data for the period June 2002to January 2003, and a Ross Sea icebergfrom AMSR-E data for the period June2002 to May 2003.
U.S. AMSR-E Science Team Update
Roy Spencer, the U.S. AMSR-E ScienceTeam Leader, began his Team’s
presentation by indicating how pleasedhe is with the success of the AMSR-E sofar. He then turned the presentationover to Elena Lobl, the Science TeamCoordinator. Lobl presented a timelineof the planned public release of AMSR-E data products, beginning with theexpected initial release of calibratedLevel 1 data by the Japanese in June2003. Team member Frank Wentz’sgroup will need about 3 months afterreceiving the calibrated Level 1 databefore beginning the release of Level2A products in September 2003. Initialrelease of Level 2B and Level 3 AMSR-E products is expected in March 2004.In the meantime, near-real-time AMSR-E data have been, and will continue tobe, available to people doing fieldcampaigns. Prior to the release of theofficial Japanese calibration, theavailable data have incorporated apreliminary calibration devised byFrank Wentz.
Lobl gave an overview of the impres-sive, wide-ranging AMSR-E validationprogram. This program began in 2003with a January/February precipitationcampaign over Wakasa Bay andsurrounding land areas, followed inFebruary by a sea ice campaign in theSea of Okhotsk. These campaigns useda heavily instrumented NASA P-3Baircraft, with an AMSR simulator (thePolarimetric Scanning Radiometer, orPSR), a 183/220 GHz radiometer, a 21/37 GHz upward viewing radiometer, a2-frequency precipitation radar, a cloudradar, Langley Research Center ‘sTurbulent Air Motion MeasurementSystem (TAMMS), an infrared radiom-eter, and a digital camera, all of whichperformed successfully. The WakasaBay campaign also included twoJapanese C-band dual-polarizedDoppler radars, Japanese ground- andship-based observations, including
THE EARTH OBSERVER • July/August 2003 Vol. 15 No. 4
6
radiosondes, and a JapaneseGulfstream II aircraft with cloudphysics payload. Weather conditionsallowed nearly all types of extra-tropical precipitation to be measuredover both water and land, and approxi-mately 60 hours of science flights weresuccessfully completed. The validationdata are expected to be released in fullby the end of 2003 and will be archivedat the U.S. National Snow and Ice DataCenter (NSIDC). Lobl listed 11 specificscience investigations expected to bedone with the Wakasa Bay validationdata set.
Lobl next described Arctic 2003, anaircraft-based validation campaignover the sea ice of the Bering, Beaufort,and Chukchi seas in March 2003. Thiscampaign also used the NASA P-3Baircraft, and it was aimed at validatingthe three AMSR-E standard sea iceproducts: sea ice concentration, sea icetemperature, and snow depth on seaice. Flights were coordinated withsurface measurements at Barrow,Alaska, and at an ice camp in theBeaufort Sea. The aircraft portion wascoordinated by Don Cavalieri andThorsten Markus, while Lobl met withteams on the ground and on the ice.
Lobl then described the Cold LandProcesses Field Experiment (CLPX), ledby Don Cline. This experiment in-cluded several field campaigns inColorado and measurement of acomprehensive range of snow andfrozen soil characteristics. Once againthe NASA P-3B was involved, alongwith a NASA DC-8, a NOAA AC690,and ground measurements. The goalwas to validate the passive radiometerdata products and also to look at activemeasurements. CLPX has nested studyareas, with people digging pits andmeasuring snow in three regions ofnorthwest Colorado.
Upcoming validation campaignsinclude, most prominently, SoilMoisture Experiments 2003 (SMEX 03),led by Tom Jackson, and an AntarcticAMSR-E Sea Ice Validation campaign,led by Joey Comiso. The field portionof SMEX 03 begins in June and July,with in situ measurements in Okla-homa, Georgia, and Alabama, andcontinues with a 10-day intensivemeasurement period in Brazil inSeptember. Ground, aircraft, andsatellite measurements will be made tovalidate AMSR-E soil moistureproducts for a range of landcovertypes. SMEX 03 will be followed nextyear by the SMEX 04 North AmericanMonsoon Experiment (NAME).
The Antarctic AMSR-E Sea Ice Valida-tion campaign will take place August23 - September 15, 2003, and, like theArctic2003 campaign, will involve theNASA P-3B aircraft and the primarygoal of validating the three AMSR-Estandard sea ice products, although thistime for the Antarctic ice rather than forthe Arctic ice. P-3B flights will beconducted over the Weddell Sea andthe Bellingshausen Sea, on oppositesides of the Antarctic Peninsula, andthe aircraft measurements will becomplemented by ship-based andground measurements of ice thickness,salinity, and conductivity, and snowtemperature, granularity, salinity, andliquid content.
AIRS/AMSU/HSB Science Team Update
AIRS/AMSU/HSB Science TeamLeader Mous Chahine began thescience team presentation with a briefcomment explaining that although thecurrently non-operating HSB is missed,the key requirements of the AIRS/AMSU can still be attained. Prominentamong these is the requirement ofattaining atmospheric temperature
accuracies of 1 K in 1-km layers of thetroposphere. Chahine then turned tohis colleagues Tom Pagano and GeorgeAumann to present the AIRS/AMSU/HSB (abbreviated AIRS) Science Teamupdate.
Tom Pagano acknowledged the manygroups supporting the AIRS program.He then showed radiometric sensitivitycurves for AIRS and AMSU andexplained that the HSB scanner, whichceased operation on February 5, 2003,appears to have experienced ananomalously high current. The AIRSTeam is looking into the documentationthat has been received from the HSBmanufacturer, in the hopes of findinginformation that might help theMission Operations Team to resuscitatethe instrument. Fortunately, as Chahinementioned, the loss of the HSB does notaffect the central AIRS/AMSU dataproducts.
Pagano proceeded to comparisons ofAIRS data with other data sources.Comparison of the AIRS spectra withspectra from the European Centre forMedium Range Weather Forecasts(ECMWF) looks very good. Compari-sons of the AIRS data with GOES 10data and MODIS data also both showgood matches in the Level 1 radianceproducts. The Level 2 products alsolook good, and retrieval accuracies areapproaching the 1-K-per-1-km goal, asillustrated by Pagano with a plot for atypical day in September 2002. Paganoannounced that the first public releaseof the AIRS data will be in July 2003, atwhich time both validated andunvalidated data will be released, withflags to indicate whether the product isvalidated or not and with a validationreport accompanying each product.The Project will not restrict access tothe data.
THE EARTH OBSERVER • July/August 2003 Vol. 15, No. 4
7
There are three distribution modes forthe AIRS/AMSU data: throughNOAA’s National EnvironmentalSatellite Data and Information Service(NESDIS), the Goddard DistributedActive Archive Center (DAAC), andthe Direct Broadcast system. NOAA isproviding data to numerical weatherprediction (NWP) centers within 2hours and 50 minutes of initial datareceipt by NOAA. ECMWF has foundthat the AIRS/AMSU data have asmall, predominantly positive impacton the ECMWF forecasts, and they planto go operational with incorporatingthe AIRS/AMSU data sometime thissummer. To conclude his portion of theAIRS Team presentation, Paganoreiterated that AIRS and AMSU are ingood health, the instrument calibrationfor AIRS looks good, and the data arebeing used.
George Aumann then presented anAIRS/AMSU/HSB Project ScienceAssessment for one year after launch.He announced that the AIRS radiomet-ric performance is excellent, as is theAIRS spectral performance. The AIRSSST values match results from theNational Centers for EnvironmentalPrediction (NCEP) to within 2 Kthrough most of the globe. Each daythere are about 7000 clear footprintsfrom the AIRS. Spectral calibration isextremely important for the non-window channels, with long-termstability critical for the Level 2 prod-ucts, and the AIRS spectral calibrationstability is strong. The AIRS absolutespatial calibration also meets specifica-tions, by being within 3-km of the trueposition, but there is a position jitterthat needs to be explained. The AMSUcalibration is similar to that for AMSU-A on NOAA 16, both showing somebiases that have an effect in degradingthe microwave retrieval. Prior to theFebruary 5 demise of HSB, six monthsof AIRS, AMSU, HSB data were
collected that are now available toevaluate the impact of the HSB 183GHz channels on moisture retrievals.
Aumann indicated that a majorchallenge at present for the AIRS Teamis to get the Level 2 retrievals workingover land. Major algorithm upgradesare being limited to twice a year, asspecified in the AIRS Team LeaderProposal. The validation timeline isgraduated from tropical day/nightocean to polar day.
Aumann then turned to the use ofAIRS/AMSU data in weather forecast-ing. ECMWF is ingesting 16% of theavailable AIRS/AMSU data overtropical oceans for trial assimilation.They are only using some channels andonly for relatively clear pixels. Theexpectation is that the impact on theforecasts will be increased as theamount of AIRS data used is increased.Assimilating the AIRS data is a difficulttask but should be worth the effort.
Stating that improved weather predic-tion is only one of the AIRS Team goals,Aumann turned to another key goal,namely the incorporation of AIRS/AMSU data into climate records, usingLevel 3 products. In view of the largenumber of AIRS channels, to enableworkable data access there is a need tocreate carefully constructed “deci-mated” products. There is also theequally important need to familiarizethe user community with the data sets.
In conclusion, Aumann stated that theAIRS Team has done an excellent job sofar. The current challenges are todevelop the software to use the data tofull potential, to familiarize thenumerical weather prediction (NWP)and climate research communities withthe data, and to decimate the dataappropriately. During the discussionperiod, Joel Susskind of the AIRS Teamnoted that the NWP centers are usingradiance data, not the derived standardproducts.
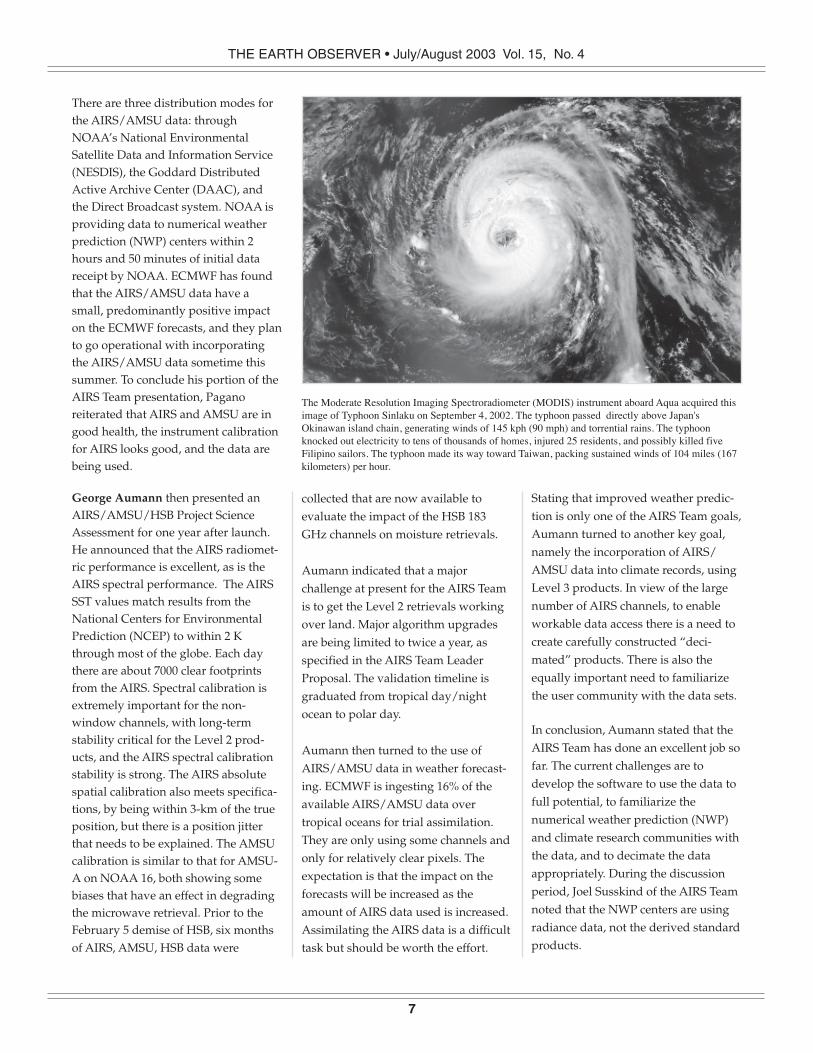
The Moderate Resolution Imaging Spectroradiometer (MODIS) instrument aboard Aqua acquired thisimage of Typhoon Sinlaku on September 4, 2002. The typhoon passed directly above Japan'sOkinawan island chain, generating winds of 145 kph (90 mph) and torrential rains. The typhoonknocked out electricity to tens of thousands of homes, injured 25 residents, and possibly killed fiveFilipino sailors. The typhoon made its way toward Taiwan, packing sustained winds of 104 miles (167kilometers) per hour.
THE EARTH OBSERVER • July/August 2003 Vol. 15 No. 4
8
CERES Science Team Update
Norman Loeb presented the update forthe CERES Science Team, reviewing, inturn, results from the Terra deep-spacecalibration, the status of the AquaCERES instrument, and recent resultsfrom the Terra CERES angular distribu-tion models. The Terra deep-spacecalibration maneuver was executedflawlessly in March 2003. Results showthat the offsets determined prior to thedeep-space maneuver were very good,so that the differences produced byincorporating the new results are small.In fact, the changes from pre-launchmeasurements of scan angle dependentoffsets are minimal, and because of thenegligible impact to the CERES Earth-Radiation-Budget-Experiment (ERBE)-like products, these are not beingreprocessed. The primary benefit of apossible third maneuver (following theMarch deep-space maneuver and theApril lunar maneuver) would be thecollection of additional biaxial data. Asthis would be an important benefit, theCERES Team supports the execution ofa third Terra maneuver, with no strongpreference regarding whether it be alunar maneuver or a deep-space one.
Loeb showed preliminary results of anAqua/Terra inter-calibration overGreenland. Comparing Flight Model 1(FM1) on Terra and FM4 on Aqua, theshortwave and longwave nighttimeagreement is better than 0.4 %, and thelongwave daytime agreement is betterthan 0.7%. Loeb indicated that theAqua CERES Edition 1 Bi-DirectionalScan (BDS) products were availableand that the Edition 1 ERBE-likeproducts would be released in June2003, as indeed occurred.
Loeb then turned to his personalspecialty, which is the CERES angular
distribution models (ADMs). Forclimate studies, the radiative fluxesneed to be known accurately, andADMs are needed in order to attainhigh accuracy levels. The CERES Teamcreates the ADMs empirically, usingMODIS data for scene identification.Loeb explained that the CERES Team isdeveloping ADMs for scene typesbased on MODIS-derived parametersthat have a strong influence on theanisotropy of the Earth’s scenes. Loebshowed several sample ADMs for awide range of scene types. For cloudyscenes, the ADMs are a function ofcloud phase, fraction, and opticaldepth. For clear-land scenes, ADMs arebeing developed for specific regions ona month-by-month basis. Loeb showedresults for one month of clear-landCERES reflectances over 1-degreeequal-area regions stratified by solarzenith angle and top-of-the-atmosphere(TOA) Normalized Difference Vegeta-tion Index (NDVI). Loeb comparedADM results for June 2000 clear landshortwave TOA fluxes from the CERESinstruments on Terra and the TropicalRainfall Measuring Mission (TRMM).Shortwave ADMs have also recentlybeen developed for snow and iceconditions, and Loeb showed plots ofanisotropic factor versus viewingzenith angle for conditions of freshsnow, permanent snow, and sea ice. Hethen compared TRMM and TerraADMs for longwave radiation. Natu-rally, ADMs developed for the tropicscan be expected to show greater errorsover the polar regions, especiallybecause of major differences in watervapor amounts. To estimate instanta-neous TOA flux errors, CERES ADM-derived TOA fluxes from a scene arecompared at different viewing anglesusing multiangle CERES observations.Plots of instantaneous shortwave TOAflux errors show a significant improve-
ment for the CERES Single ScannerTOA Surface Fluxes (SSF) versus ERBE-like products. In summary, the TerraCERES angular distribution modelinghas produced the first set of globalADMs from CERES. The Terra CERESADMs should be completed in Septem-ber 2003, while the Aqua ADMs await alonger Aqua data set.
In response to a question from JimDodge concerning whether the ADMsvary with time, Loeb explained thattemporal changes over a region areaccounted for implicitly in the ADMsbecause the ADMs use MODIS forscene identification. If there are realclimatological changes with time in theMODIS-derived properties, the ADMsused to infer CERES TOA fluxes overthe region will also change since theADMs are a function of the MODISparameters. At the moment, there is alarge set of ADMs, for many differentsituations.
EOS Validation
The EOS Validation Scientist, David
Starr, presented a brief overview of thecurrent state of the EOS ValidationProgram. This program supports theHigh Resolution Transmission(HITRAN) molecular spectroscopicdatabase, the Aerosol Robotic Network(AERONET), the Marine Optical Buoy(MOBY), the Micro-Pulse LidarNetwork (MPL-Net), radiosondelaunches for validation of AIRS/AMSU/HSB data products, airbornesimulators, including a MODIS/ASTERsimulator (MASTER), and many fieldexperiments, including the Strato-spheric Aerosol and Gas Experiment III(SAGE III) Ozone Loss and ValidationExperiment (SOLVE-II) and the CirrusRegional Study of Tropical Anvils andCirrus Layers - Florida Area CirrusExperiment (CRYSTAL-FACE) in 2002,
THE EARTH OBSERVER • July/August 2003 Vol. 15, No. 4
9
and seven validation deployments ofthe NASA P-3B aircraft for AMSR-E in2003, the golden year of AMSR-Evalidation. The program has alsosupported two NASA ResearchAnnouncements (NRAs), including onefocused in large part on Aqua valida-tion, and will support the NorthAmerican Monsoon Experiment(NAME) and the participation ofAMSR-E team members in it. However,there is an anticipated decrease invalidation funding available from theEOS Project Science Office, and thiswould reduce the amount of supportpossible in the future.
Jack Kaye, Director of the Office ofEarth Science Research Division atNASA Headquarters, clarified the newfunding situation from the Headquar-ters perspective, explaining that theperceived upcoming decrease invalidation funding is simply a redistri-bution of the money and that, in fact,the money for validation has increased.Kaye added that decisions remain to bemade on how to distribute the addi-tional money. At that point a questionwas asked regarding whether a newannouncement soliciting validationproposals would be forthcoming. JimDodge, EOS Coordinator of the Officeof Earth Science Research Division atNASA Headquarters, answered thatsuch an announcement would beunnecessary, as many of the over 600NRA proposals currently under reviewinclude validation efforts.
HSB Substitute
Recognizing that the HSB is currentlynot operational, Jim Weinman broughtup the important point that some of thescience efforts with the HSB can still beundertaken by using data from theAMSU-B on the NOAA 16 satellite as asubstitute for the HSB data. The
AMSU-B contains each of the HSBchannels and, although the Aqua andNOAA 16 orbits are different, they dohave NOAA 16 frequently collectingdata over a region within 20 minutes ofthe Aqua data collection. AIRS Teammembers were aware of this coinci-dence, but some of the others in theaudience were not.
A Proposed New Data Gateway
David Herring, the NASA EarthObservatory Chief Editor, described aproposed new data gateway calledNASA Earth Observations (NEO). NEOwill be a central web interface thatmerges the ability to easily browse andaccess georeferenced satellite imageswith the ability to order their matchingdata files within the DAACs. The goalof NEO is to increase significantly theawareness of, and use of, NASA remotesensing data by NASA’s communica-tion partners as well as the “scienceattentive” public (non-traditional datauser communities). The idea originatedfrom collaborations and discussionswith several groups interested in easieraccess to NASA data, includingmuseums in Washington, D.C., NewYork, and Tokyo, mass media contentproviders, StormCenter Communica-tions, Inc., and National Geographic.The gateway project is aimed athelping to enable NASA partners andothers to gain access to NASA imagesand data, focusing initially on the datafrom MODIS, CERES, and AMSR-E.NEO will augment the Earth Observa-tory web site and be linked to it. TheNEO effort will benefit from theexisting close working relationshipbetween the Earth Observatory groupand the MODIS Rapid Response teamthat makes MODIS images availablewithin hours. Ideally, the data gatewaywill provide an interface that enablesready ordering of Earth science data
and many advanced help features toassist those who are unfamiliar withobtaining NASA data. A white paperscoping NEO is now in review, and thehope is to have a NEO version 1available on line within 1-2 years. Theprocess of scaling up NEO to include afull range of Earth Science Enterprisedata, model data, and GeographicInformation System (GIS) data isexpected to begin about June 2005.
The NEO concept addresses keypreferences indicated in the responsesto a recent survey conducted by theEarth Observatory. In that survey, 85%of the scientist respondents indicated“easy access to data” as the changethey would most like to see on theEarth Observatory site. Moreover,roughly two-thirds of lay publicrespondents said that given easy accessto satellite data and easy-to-usesoftware, they would be interested intaking up Earth observations as ahobby. The NEO gateway would enablethis ready access.
Mini-Workshop on Aqua Sea Surface
Temperatures
After a break for lunch, Parkinson
briefly introduced the afternoonsession, which was a mini-workshoporganized by Mous Chahine tocompare the sea surface temperature(SST) results being obtained by three ofthe Aqua instruments: the AIRS,MODIS, and AMSR-E. Parkinsonindicated that this was the first timethat the Aqua Science Working Groupwas devoting a session tointercomparisons of a single variable,making it an important milestone. Shethen turned the session over toChahine.
Chahine began by mentioning the threequestions that he asked each speaker toaddress: What are we measuring (skin

THE EARTH OBSERVER • July/August 2003 Vol. 15 No. 4
10
temperature, bulk temperature)? Howis the accuracy determined? Who arethe customers/users of the data? Heindicated that the AIRS, MODIS, andAMSR-E are all doing very well and areall being used to derive high-qualityproducts.
MODIS SSTs
Chahine then introduced Peter
Minnett to present the MODIS SSTstatus and results. Minnett began bymentioning that the Marine-Atmo-spheric Emitted Radiance Interferom-eter (M-AERI) is producing excellentskin temperature measurements to usein the SST validation efforts. He thenidentified several conditions essentialfor accurate infrared measurements ofSST from space, the first being that theinstrument needs to be well calibrated.
The infrared SST measurements, whichcan only be made in cloud-freeconditions, are taken in “windows”where the atmosphere is relativelytransparent, although within thesewindows there are potential problemswith varying concentrations of variousatmospheric constituents, especiallywater vapor. This makes the resultsmore complicated in regions with highwater vapor amounts, like the tropics.MODIS is extraordinarily complicated,being designed to provide accuratemeasurements from 0.4 to 14 µm, withat least 10 detectors for each spectralband. There is some risk of crosstalkamongst the channels, although in thewindow channels used for the SSTmeasurements this seems not to be aproblem. The instrumental problemsare much less severe with the Aqua
MODIS than with the earlier TerraMODIS.
Minnett presented the equation used inthe MODIS SST derivation. Thisequation includes empirical coefficientsthat are constant both temporally andspatially. There are two approaches forderiving the coefficients: numericalsimulations of the brightness tempera-ture measurements, and collocated andcontemporaneous matchups with insitu measurements. To date, thealgorithms based on the matchups withbuoys and M-AERI provide moreconsistent and accurate retrievals.Clouds are also an issue for the infraredmeasurements, and cloud screening isdone separately for daytime andnighttime conditions. For nighttime,the cloud screening involves looking at
On October 28, 2002, the Moderate Resolution Imaging Spectroradiometer (MODIS) on NASA's Aqua satellite captured this image of the ongoing eruptionof Europe's largest and most active volcano, Mt. Etna, on the island of Sicily. The volcano's thermal signature was detected by MODIS and is marked with agray dot. On the northern slopes of the volcano, the thermal signature detected could be a forest fire caused by the eruption. A dense plume of what is likelyash and smoke is streaming southward from the volcano and out over the Mediterranean Sea.
THE EARTH OBSERVER • July/August 2003 Vol. 15, No. 4
11
the difference between the SSTsmeasured at 4 µm and those measuredat 11 µm. To date there are 63,433 datapoints throughout the globe for theMODIS buoy and M-AERI validationdata set. The skin temperature can beinferred from the buoy measurements,to an estimated accuracy of 0.15 K(Donlon et al., J. Climate, vol. 15, pp.353-369, 2002).
Minnett showed MODIS statistics forDecember 2002, plus MODIS monthlySST fields for the three MODIS SSTproducts: daytime SSTs derived from 11µm data, daytime SSTs derived from 4µm data, and nighttime SSTs derivedfrom 4 µm data. The nighttime SSTsglobally are 0.054 K warmer using the 4µm data versus using the 11 µm data.Combining Aqua and Terra data helpsreduce the obscuration from clouds, asthe clouds move, develop and decay.The differences between Terra andAqua MODIS SSTs are largely ex-plained by the diurnal cycle, althoughnot entirely. Comparing the AquaMODIS and AMSR-E SSTs, the matchesare “extraordinarily” good according toMinnett, who further concluded thefollowing: Most of the instrumentalartifacts for the Aqua MODIS arecorrected; the empirical atmosphericcorrection algorithms provide a betterproduct than those derived from firstprinciples; accuracy is established bycomparison to buoy and M-AERImeasurements (ideally the MODISteam would prefer to use just M-AERIdata but these are too few compared tothe large buoy data set); and cloudscreening requires additional attention(there are plans to use comparisonsbetween Aqua MODIS and AMSR-ESSTs for catching remaining cloudcontamination). SST accuracies werepresented at this meeting as globalaccuracies, although eventually theaccuracies will be examined regionally
also. Surprisingly, the SST accuraciesseem to be better in the tropical regionsthan in the polar regions.
Minnett then provided answers, for theMODIS instruments, to each of anexpanded list of questions Chahine hadrequested that the speakers address.Specifically:
• What have we learned so far? Agreat deal about MODIS,including that the AquaMODIS is much improvedover the Terra MODIS.
• What are we measuring? Skintemperature.
• How much model information is
injected? None.• How is accuracy determined? By
using National Institute ofStandards and Technology(NIST) traceable M-AERI andnumerous buoys.
• Who are the specific customers/
users for the data? The researchcommunity.
• What are we trying to achieve
that is new or different? What
message should we/the EOS
deliver to the research commu-
nity? MODIS SSTs are at leastas good as Advanced VeryHigh Resolution Radiometer(AVHRR) Pathfinder SSTs,can be used in similar typesof analyses, and are measuredat a finer spatial resolution.
• Where do we go from here?
Resolve and correct diurnaleffects and regional, seasonalbiases; create merged infraredand microwave SSTs toovercome cloud issues;provide the wider usercommunity with uniformgridded data.
Parkinson asked if consideration wasgiven to the fact that SSTs underneath
clouds might be biased (cooler indaytime than in clear surroundingregions), thereby biasing globalaverages based on the MODIS SSTs,which tend to be calculated only inrelatively clear areas. Minnett acknowl-edged the difficulty and explained thatthe M-AERI measurements, which aretaken in cloudy as well as clear areas,will be used to help address this issue.He also pointed out that in situationswith broken cloud fields, the spacecraftradiometer is not viewing the surfacewith the same geometry as the solarillumination and therefore does notnecessarily view only the sunlit seasurface. Furthermore, in terms of theskin effect, the influence of cloudscould be expected to be small, espe-cially in the tropics. Chahine ques-tioned whether the skin surfacetemperature could be derived to 0.15 Kaccuracies from the buoy data, precipi-tating a productive further discussionbetween Chahine and Minnett.
Japanese AMSR-E SSTs
Akira Shibata presented the SST statusand results from the Japanese AMSR-EScience Team. Corrections made by theJapanese team include an atmosphericcorrection, wind speed correction, winddirection correction, land contamina-tion removal, sun glitter removal, seaice removal, incident angle correction,and salinity correction. Shibata showeda global image for December 1, 2002,for atmospheric correction for 6.9 GHzvertical polarization. Although theAMSR-E microwave measurementsallow SST derivations under mostweather conditions, this does notinclude conditions of precipitatingclouds. Shibata then showed a globalimage of the wind speed correction,followed by an image for the winddirection correction. A local winddirection correction from AMSR-E in

THE EARTH OBSERVER • July/August 2003 Vol. 15 No. 4
12
the Australia vicinity was then com-pared with wind analyses by theJapanese Meteorological Agency (JMA).Global images were shown of theAMSR-E SST descending December 1,2002, data and the AMSR-E SSTascending December 1 data, followedby monthly AMSR-E SST December2002 data, for daytime, nighttime, andday/night combined data. Shibataindicated overall SST retrieval accura-cies of 0.649 K for July-September 2002,0.702 K for October - December 2002,and 0.741 K for January - March 2003,noting that the degradation in accuracyover time is not fully understood.
U.S. AMSR-E SSTs
Minnett took center stage again, thistime to present the SST status andresults for the U.S. AMSR-E ScienceTeam, stepping in for Frank Wentz andChelle Gentemann, who were unable toattend. Wentz and Gentemann havedevised a correction for the uncertain-ties in the measurements of thetemperature of the AMSR-E hot loadand have based the SST algorithm forAMSR-E on the SST algorithm for theSpecial Sensor Microwave Imager(SSM/I). The AMSR-E ocean dataproducts are produced on a near-real-time basis, and daily, three-daily,weekly, and monthly averages are allavailable to team members via FTP, forwind speed, SST, and other variables.Normally, on-orbit calibration formicrowave instruments is performedby interpolating between a hot loadand a deep-space (2.7 K) temperature.Because of uncertainties with theAMSR-E hot load temperatures, thisprocedure is inverted to calculate thehot load values. Radiative transfermodeling is used, driven by geophysi-cal fields derived from the measure-ments of microwave radiometers onother satellites and using the Opti-
mally-Interpolated (OI) SSTs ofReynolds poleward of the 40° limit ofthe Tropical Rainfall MeasuringMission (TRMM) Microwave Imager(TMI) SSTs. Roy Spencer furtherexplained Frank Wentz’s use of theSSMI and TMI measurements fortuning the AMSR-E products.
Coefficients for the AMSR-E SSTcalculations change daily, creating aconcern raised by Joel Susskindregarding the use of the SST product inclimate studies. Spencer clarified thatthe calibration changes continuouslybecause of changes in the sun angle.The root-mean-square (RMS) differencebetween AMSR-E and Reynolds SSTs is0.71 K. Minnett explained that theAMSR-E measures sub-skin tempera-ture, through approximately the top 1cm of the ocean surface. He showedAMSR-E versus MODIS SST compari-sons and indicated that the AMSR-ESSTs have shed light on the MODIS SSTquality, establishing that the MODIScloud screening needs to be revisited.Differences between the MODIS andAMSR-E are apparent, and Minnettconcluded that we do not yet knowenough to establish which SST productis better. Furthermore, there is adigitizer issue with AVHRRs, creating alikely possible error in the Reynolds OIfields, in particular in the high southernlatitudes. This issue with AVHRR hasbeen recognized just within the pastyear, partly as a result of comparisonswith MODIS data. Much discussionthen ensued, involving AMSR-E,MODIS, and AIRS science teammembers, plus NASA Headquarters.
AIRS SSTs
The session then turned to the SSTsderived from the AIRS instrument.Chahine introduced this segment bymentioning that the AIRS team has
selected almost a perfect windowchannel to derive the SSTs. He thenturned to George Aumann to give thepresentation on “AIRS Sea SurfaceObservations.”
Aumann explained that the AIRS SSTis derived from the 2616-wavenumber(3.8-µm) channel, restricted to night-time cloud-free ocean conditions. TheSST is inferred from first principlesusing an atmospheric transmission andsurface emissivity correction. Althoughthe atmospheric absorption in the 2616-wavenumber channel is less than 0.5 Keven under particularly bad conditions,measurement accuracy at the 0.1 Klevel for climate studies mandates acareful correction for atmospherictransmission. Aumann listed threemethodologies for atmosphericcorrections. The best method usestemperature and moisture profilesinferred from the AIRS data, andresults derived from this method willbe available soon. Until then, theatmospheric correction can be made towithin 0.1 K either through a method ofLarrabee Strow using temperature andhumidity profiles from ECMWF orthrough a method of George Aumannusing the depth of weak water lines inthe AIRS spectrum. In all cases, theMasuda model ocean emissivitycorrection is used.
The global map of AIRS-derived SSTfor December 2002 shows the expectedlarge-scale global patterns. However,when the SST field is compared withthe Real-Time-Global SST (RTG SST)produced by NCEP using buoy data,ship observations, and SST retrievalsfrom spacecraft, interpolated with aglobal circulation model (GCM) on a0.5-degree global grid, two intriguingeffects emerge. First, AIRS SSTs agreewith the RTG SSTs with a standarddeviation of 0.44 K and a global bias of
THE EARTH OBSERVER • July/August 2003 Vol. 15, No. 4
13
only 0.65 K. Second, in areas as large asAustralia, AIRS measures skin tem-peratures up to 2 K colder than theRTG SST. Aumann explained that aglobal bias of 0.65 K would be anexcellent agreement for a measurementbased on first principles, but that theagreement is, in fact, even better. Sincethe RTG SST represents the day/nightaverage of the bulk (buoy) tempera-ture, not the skin temperature mea-sured by AIRS, 0.3 K of the measured0.65 K bias was expected on that basis.The remaining 0.35 K bias was notexpected and has the characteristic ofan absorbing layer in the atmosphere,possibly aerosols. With the growingattention to aerosol absorption over theoceans in climate research, the ability tocharacterize this absorber spatially andspectrally at night through use of theAIRS data opens a new researchavenue. Aumann explained thatalthough the spectral signature ofcirrus clouds is virtually omnipresentin the “cloud-free” data, the effect ofcirrus clouds on the SST derived fromthe 2616-wavenumber channel (SST2616) is minimal. A second unexpectedeffect relates to the large areas wherethe AIRS SST is up to 2 K colder thanthe RTG SST. It is possible that both theAIRS 2616 (skin) SST and the RTG(bulk) SST are correct but that the skintemperature is simply much colderthan expected.
Joel Susskind, also a member of theAIRS Science Team, made an importantclarification: The SST measurementsdiscussed by Aumann are not thestandard AIRS SST product. Themeasurements discussed were basedon one channel of AIRS data, wereinitially intended for the diagnostic ofthe AIRS radiometric calibration, andwere optimized for cloud-free condi-tions. The AIRS standard SST product,
in contrast, is derived using many ofthe 2378 AIRS infrared channels andwill be available under clear andcloudy conditions.
Data Assimilation
Chahine then indicated the importanceof hearing from the user communityand asked Bob Atlas to provide aperspective from the Goddard DataAssimilation Office (DAO). Atlas listedthree applications for the SST products:boundary forcing for numericalweather prediction; initial conditionsand verification data for coupledatmosphere ocean GCM simulations;and calculation of air-sea fluxes. Atlasexplained that data assimilationsystems are changing rapidly and thatthe current DAO model has 100-kmhorizontal resolution. The expectationis that within 10 years the resolutionwill be improved to less than 10 km.Requirements for the desired SSTmeasurements include 50-km spatialresolutions now, 1-km spatial resolu-tions in 5-10 years, and accuracies of 0.1K. Furthermore, for the purposes ofdata assimilation, Atlas would prefer tohave the skin temperature rather thanbulk or other ocean temperatures. Heexplained that errors in the SST fieldscan have significant impacts on thesimulated atmosphere in fewer than 10days and that modelers would like toupdate SST once a day.
SST Mini-Workshop Conclusions
Chahine concluded that the Aquascience teams are doing extremely well,obtaining consistent SST measurementsfrom the MODIS, AIRS, and AMSR-E.At this point, one year after launch, wehave achieved within 0.5 K matching,which is much better than would havebeen expected two years ago. JimDodge from NASA Headquartersasked whether we want a combined
product or will accept three separateSSTs from Aqua. Merging SSTs mea-sured by different spacecraft radiom-eters ranks high in the objectives of theGlobal Ocean Data AssimilationExperiment (GODAE) High-ResolutionSST Pilot Project, and many scientistsagree that a merging of the Aqua SSTmeasurements to a combined productcould be valuable.
In closing Chahine asked: “Where dowe go from here?” The participantsindicated that there is a need in bothhemispheres to cover regions polewardof 50°, where very few buoy data areavailable for the regression approachand an extremely small fraction ofobservations are indicated as cloud-free. This is not a simple problem andwill require considerable work. On thisnote, Chahine concluded the SSTworkshop.
Mini-Workshop on Cloud Detection:
Approaches, Needs, and
Intercomparisons
The Thursday morning session (May29, 2003), on “Cloud Detection:Approaches, Needs, andIntercomparisons,” was chaired by theDeputy Aqua Project Scientist, Steve
Platnick. Cloud detection and subse-quent masking, needed for both clearand cloudy sky algorithms, is acommon requirement for AIRS/AMSU/HSB, CERES, and MODISalgorithms. Seven speakers, represent-ing each of these instrument teams,participated in the session.
Each retrieval algorithm has a uniqueset of requirements for cloud detection,ultimately driven by the spectralregions being used and the geophysicalparameters being retrieved. Therefore,no single detection/masking approachcan be expected to meet all needs. Forexample, some algorithms require
THE EARTH OBSERVER • July/August 2003 Vol. 15 No. 4
14
either absolute clear or cloudy scenes(e.g., most MODIS/CERES pixel-levelretrievals), while other algorithms canwork with a combination of the two ina footprint (e.g., AIRS/AMSU/HSBprofile retrievals and the AIRS andMODIS CO2-slicing cloud top propertyalgorithm). The session was intendedto help foster an appreciation for thesevarious needs and provide an impetusfor collaborative work.
As summarized by Platnick, the sessionaddressed two broad items: (1) anoverview and status of current clouddetection approaches and (2) presenta-tion of detection and/or instrumentintercomparison studies performed todate. In particular, this was the firstscience meeting bringing together theMODIS/CERES and AIRS/AMSU/HSB teams on these topics. Even withinthe MODIS science discipline teams(atmospheres, land, and ocean teams)and CERES pixel-level retrieval group,cloud masking approaches haveevolved significantly since a Terra
cloud mask meeting was held at theUniversity of Wisconsin in May 2001;an update and extension to the fullAqua complement were deemedoverdue.
AIRS Cloud Clearing
The first two talks were from the AIRSteam. Joel Susskind began with ageneral overview of cloud clearingmethods used by polar orbitingsounders, including the NOAATelevision and Infrared ObservationalSatellite (TIROS) Operational VerticalSounder (TOVS) based on the High-Resolution Infrared Radiation Sounder(HIRS) and the Stratospheric SoundingUnit/Microwave Sounding Unit (SSU/MSU) or AMSU instrument suite. In thesounder context, “cloud clearing” issynonymous with understanding howclouds impact scene radiances and notnecessarily the elimination of cloud-contaminated sensor fields of view(FOVs).
There are three basic approaches tocloud clearing. The most restrictive is
to use only cloud free FOVs (~13-kmresolution for AIRS, ~20-km for HIRS),which severely limits retrieval cover-age. In addition, there might be smallamounts of cloud contamination insome fields of view judged to be clear.At the other extreme is to attempt asimultaneous solution for all cloud,surface, and clear sky parametersaffecting the measured radiances,which requires knowledge of thespectral optical cloud properties. Theintermediate approach, used to analyzeboth TOVS and AIRS, is to use adjacentsounder FOVs to reconstruct the clearsky radiances that would have beenobserved if the FOVs were completelyclear. This is done with the help ofmicrowave radiometer observationswhere multiple sounder FOVs arecollocated with larger MSU or AMSUmicrowave radiometer footprints (twoFOVs for TOVS HIRS, nine FOVS forAIRS). The method does not requireoptical cloud models. The algorithmutilizes a geophysical state, consistentwith both collocated microwave
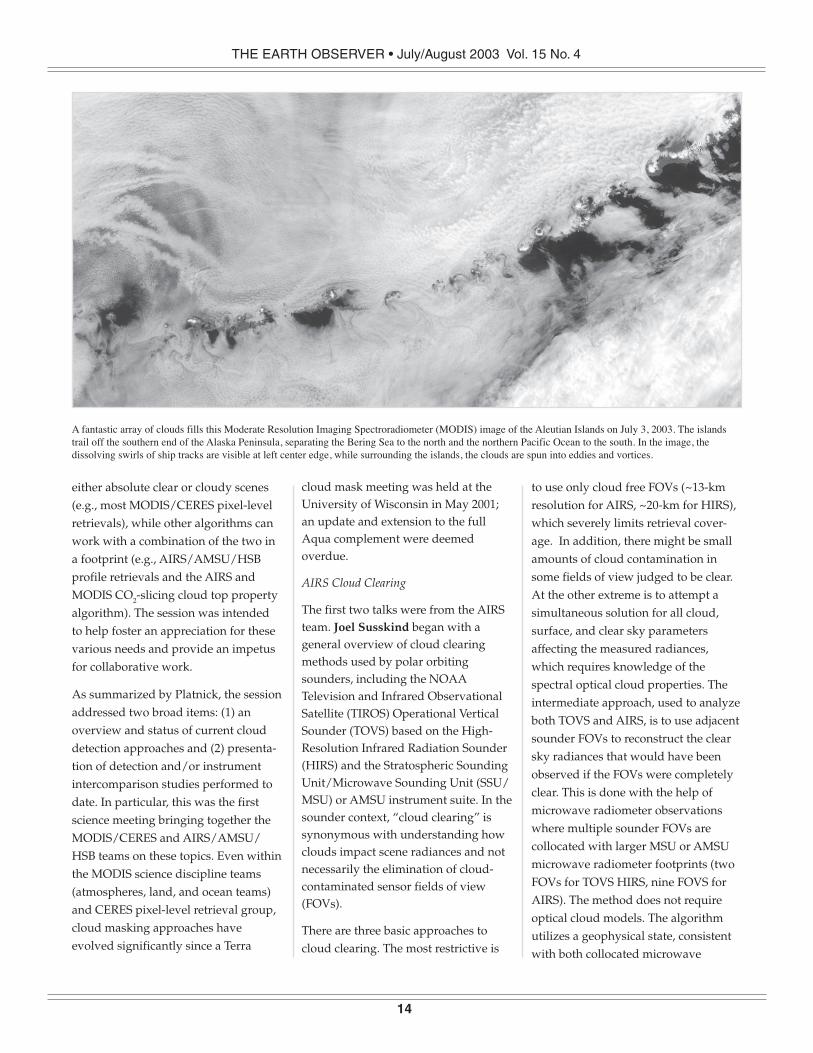
A fantastic array of clouds fills this Moderate Resolution Imaging Spectroradiometer (MODIS) image of the Aleutian Islands on July 3, 2003. The islandstrail off the southern end of the Alaska Peninsula, separating the Bering Sea to the north and the northern Pacific Ocean to the south. In the image, thedissolving swirls of ship tracks are visible at left center edge, while surrounding the islands, the clouds are spun into eddies and vortices.
THE EARTH OBSERVER • July/August 2003 Vol. 15, No. 4
15
observations and observed IR radi-ances, to reconstruct the cloud clearedIR radiances used to retrieve atmo-spheric profiles and surface propertiesvalid for the field of regard (FOR, theregion covered by the multiple sounderFOVs). Quality control, based on howwell solutions can be found thatsimultaneously match the cloud clearedIR radiances and observed microwaveradiances, is used to accept or rejectretrievals. Cloud products are subse-quently produced. Atmospheric profileand surface parameter retrievals areproduced in up to 80% cloud cover.
AIRS/AMSU/HSB products include allTOVS products (temperature/moistureprofiles, surface temperature, cloud toppressure and effective cloud fraction,and outgoing longwave radiation andderived clear-sky outgoing longwaveradiation) but with higher accuracy. Inaddition, ozone profiles, surfacespectral emissivity, CO and CH4
profiles, and CO2 column retrievals areproduced.
Susskind presented several AIRS/AMSU/HSB products as well ascomparison studies. He showed RMStemperature differences betweenretrievals and ECMWF at differentpressure heights versus cloud fraction.In general, the increase in error withcloud fraction is relatively small. Atsmall cloud fraction, absolute RMSerror is generally less than 1 K. Theradiosonde, ECMWF, and retrievedprofiles shown by Susskind for bothtemperature and water vapor revealedthe retrievals and ECMWF water vaporresults to be biased high compared toradiosondes (about 20% larger layeramounts near the surface, increasing to50% at 350 mb). ECMWF personnelhave shown that assimilation of AIRSclear-sky FOVs can add information tothe model forecasts.
In conclusion, Susskind mentioned thatthe AIRS/AMSU algorithms are stillevolving and that further algorithmimprovements are expected to bedelivered in the next six months.
Susskind was followed by Chris
Barnet, also from the AIRS Team, whogave a comprehensive tutorial of theAIRS/AMSU/HSB cloud-clearingalgorithm. Cloud clearing removeseffects that are proportional to cloudfraction. It does not require cloudoptical models. Barnet noted that Aquaprovides an opportunity to mergesounder and imager concepts, fromAIRS/AMSU and MODIS, respectively.
For an initial example, Barnet pre-sented a two-FOV, single-cloud-typeretrieval of cloud clearing and dis-cussed measurement noise issues andspectral correlation of errors. Regardingthis issue, the cloud-clearing algorithmhas the advantage that error estimatesare well-known. Complications arisewhen cloud optical properties are astrong function of wavenumber, whilemultiple cloud formations yield a non-unique solution. The use of nine AIRSFOVs allows for the determination ofmultiple cloud types. Barnet noted thatcalculations of cloud-cleared IRradiances from higher spatial resolu-tion imagery (e.g., AIRS visiblechannels and/or MODIS channels) isdifficult because of a lack of knowledgeof cloud emissivity as well as angularand spatial sampling issues.
Barnet showed a global example ofeffective cloud fraction. Though cloudsare currently underestimated, there arerarely (<2%) AIRS FORs that havecloud fraction less than 2%. Totalprecipitable water comparisonsbetween AIRS retrievals and ECMWFwere also shown to demonstrate thatthe quality of the retrieval is not a
strong function of cloudiness. Toillustrate this point further, Barnetcompared the AIRS cloud clearedspectral radiances over the PacificOcean with forward calculations fromECMWF analysis for a scene with 30%cloud fraction. The differences weresimilar to those seen in radiances fromlocations believed to be truly clear.
Barnet then turned to the motivationfor algorithm enhancements andupgrades. While the current cloudclearing approach is sufficient formeeting temperature and moisturegoals, research products (CO, CO2,CH4) may require improved cloudclearing. Improvements would come,for example, from better land emissiv-ity information and the detection/correction of uniform thin cirrus.AMSU retrievals and radiances areused as ancillary information withinthe AIRS profile retrievals; howevermicrowave instruments requirecomplex antenna side lobe corrections.Alternate approaches to the use ofAMSU data should be examined forrisk reduction, including the use ofMODIS clear-radiance products (e.g., asan estimate for AIRS clear-sky radi-ances either through MODIS-AIRSradiance regressions or a combinationof AMSU and MODIS data). Such aninvestigation might also have theadded benefit of leading to otherMODIS-AIRS research products.
MODIS Operational Cloud Mask
(MOD35)
Rich Frey from the MODIS ScienceTeam described the developmenthistory and status of the operationalMODIS cloud mask (standard dataproduct MOD35) and gave an over-view of recent MODIS/AIRS clouddetection comparisons. He began bydiscussing the practical considerationsinvolved in producing an operational

THE EARTH OBSERVER • July/August 2003 Vol. 15 No. 4
16
day-and-night 1-km global data set,including processing time, size of thedata output, and comprehension/usefulness to the user, all of whichimpose certain design constraints onthe algorithm. MOD35 also includes a250-m daytime mask derived from the0.65 and 0.86-µm bands and uses the 1-km mask results as ancillary informa-tion.
The 1-km mask uses threshold tech-niques applied to as many as 20spectral bands and a variety of “surfacedomain” tests. There are two thresh-olds for each test, allowing for assign-ment of a confidence level. The maskuses no other MODIS products andlittle ancillary data. Clear-sky “restoraltests” are used to check for unambigu-ous clear-sky signals. The overallconfidence levels derived from allindividual test results are written tobits 1 and 2 of the mask (which consistsof 48 bits of output per pixel). Themask is clear-sky conservative in thesense that it assesses the likelihood of apixel being clear and that the overallconfidence of being clear is zero if anysingle test has a confident not-clearoutcome. The philosophy was to try tosatisfy the basic cloud detection needsfor as many MODIS algorithms aspossible.
Validation approaches involve imageanalysis, field data, consistency checks,global statistical analysis, and compari-sons with other satellites (e.g., in theNOAA Polar-Orbiting EnvironmentalSatellite (POES) program). Exampleresults from these validation categorieswere shown, including results over theSouthern Great Plains (SGP) Cloud andRadiation Testbed (CART) site inOklahoma and direct broadcastacquisitions from the University ofWisconsin.
Comparisons with AIRS FOVs havebeen investigated by Dave Tobin andSteve Ackerman at the University ofWisconsin. An AIRS FOV clear skyconfidence was defined as the numberof confident clear MODIS pixelsdivided by the number of MODISpixels in the FOV. Several exampleswere discussed, including the probabil-ity of finding confident clear sky as afunction of FOV size and AMSU FOR.As expected, the probability dropssubstantially relative to the reference 1-km MODIS FOV.
Frey next showed global clear-skyconfidence maps overlaid onto variousMODIS bands (bands 2, 22, 26, 27, and31). Of particular interest was thesensitivity to thin cirrus detected withband 26 (1.38-µm). Band 26 can detectmuch more thin cirrus than is reportedin the basic cloud mask (bits 1 and 2).While the frequency of thin cirrus is ofgeneral interest for a number ofscientific reasons, at some low opticalthickness, it will cease to impactsignificantly infrared window channelmeasurements. Further study is neededwithin the MODIS community toquantify the thresholds of thin cirrus“cloud contamination” for each clear-sky product. In summary, Frey con-cluded that we still need to learn howto make good use of the informationcontained in the 1.38-µm band.
Imager Cloud Masking in Support of
CERES
Pat Minnis from the CERES Team gavean overview of cloud masking usingMODIS that is being done in support ofCERES products, along with initialintercomparisons. For the CERESefforts, the mask and subsequentMODIS retrievals are collocated andaveraged over a CERES footprint (10-50-km). Imager retrievals (as distin-
guished from CERES products) doneby the CERES group at LangleyResearch Center (LaRC) include acomprehensive set of cloud properties,aerosol optical depth over the ocean,and clear-sky properties such asspectral surface emissivity and albedo.Unlike the approach used in theMODIS operational cloud product(MOD06), the CERES philosophy is toperform imager retrievals on everypossible pixel in an attempt to maxi-mize cloud information for use withADMs.
The cloud mask approach described byMinnis includes multispectralthresholding based on clear scenecharacterizations along with spatialcoherence tests in the visible toeliminate sub-pixel clouds over theocean. The result is several classifica-tions for clear and cloudy skies. Cloudsignatures are designated as strong,weak, and glint; clear as strong, weak,snow/ice, aerosol, smoke, glint, andfire. Retrieval results are used asfeedback. The fuzzy logic mask of RonWelch from the University of Alabamaat Huntsville is used to refine results.Prior to Terra and Aqua, the mask wasapplied to the TRMM Visible InfraredScanner (VIRS) imager (2-km resolu-tion).
The mask uses MODIS spectral bandsat 0.65, 1.6, 3.7, 11, and 12-µm. Ancillaryinformation includes ECMWF analysis(profiles every 6 hours, 3-hour skintemperatures), surface elevation,surface water and ice/snow informa-tion, and International Geosphere-Biosphere Programme ecosystem type.The mask results are available aver-aged onto a 1° grid as well as theCERES footprint.
Thresholds and their uncertainties arederived from model estimates of clear-

THE EARTH OBSERVER • July/August 2003 Vol. 15, No. 4
17
sky radiances (solar and IR). The solarmodel uses empirically derived clear-sky visible band albedo for overhead-sun illumination and ecosystem-basedbidirectional reflectance models. In theIR, spectral surface emissivity is alsoempirically derived. An examplegranule-level comparison of observedclear-sky MODIS reflectance and IRemission and model results showedgood agreement. Mask validation issimilar to the MOD35 team approach(image analysis, climatologies, surfaceobservations). Minnis showed compari-sons with surface observations, VIRSretrievals, and data from the Interna-tional Satellite Cloud ClimatologyProject (ISCCP). Though there areseasonal and latitudinal variationsamong the comparisons, ISCCP cloudfraction is typically larger than theMODIS-derived values, perhaps due toits use of lower spatial resolutionimagery.
Minnis showed comparisons betweenthe LaRC MODIS cloud mask and theoperational MODIS mask (MOD35) fora number of example granules. TheLaRC mask category “good” and theMOD35 “confident cloudy” designa-tion were generally in good agreement.Problem areas include sun glint, desert,and snow/ice surfaces. Twilightregions are also problematic.
Minnis concluded by summarizingfuture mask activities and current dataavailability. Terra MODIS (Edition 1a)is available for the following timeperiods: March-August 2000, Novem-ber-December 2000, and January 2001 -March 2002; Aqua MODIS (Beta 1) isavailable for September-November2002 and January 2003.
Cloud Masking Approaches for MODISGeophysical Products
The next three talks discussed cloudmasking approaches being used by
individual MODIS discipline groups inproducing operational products. Theseinternally generated cloud masks arenot output as separate products. Peter
Minnett from the MODIS oceandiscipline group and the University ofMiami led this set of three talks bypresenting the operational clouddetection algorithm used by the oceangroup. He highlighted the importanceof the cloud masking by explaining thatunacceptable errors in the ocean colorand SST retrievals occur with just 1%fractional cloud cover, requiring anextremely conservative cloud detectionalgorithm.
Minnett first discussed the daytimealgorithm, which involves a relativelysimple two-part process. In band 14(678 nm), the ocean is nearly uniformlydark and the largest variations in veryturbid, coastal waters are comparableto the smallest cloud signatures.Therefore, spatial coherence tests canbe an effective means of cloud discrimi-nation. Such a test is applied to a 3x3block of pixels after Rayleigh, ozone,and sun glint corrections. The glintcorrection uses a simple wind-speeddependent algorithm. For processingefficiency, the spatial tests are appliedbefore aerosol corrections. To date, anadditional reflectance threshold test isnot used since it did not detect addi-tional clouds beyond those found withthe spatial test. Regions with max-minreflectance differences of less than orequal to 0.01 are considered free ofcloud contamination. Then SSTretrievals are compared with ReynoldsOptimum Interpolation (OI) SST fields;if the discrepancy is greater that 6 K,the pixel is flagged as cloud contami-nated.
For nighttime SST retrievals, spatialhomogeneity tests are applied to 3x3pixel arrays of the differences of SSTs
calculated from 4-µm data and the SSTscalculated from 11-µm data. Anadditional test involving brightnesstemperature differences between bands22 (3.9-µm) and 23 (4.0-µm) is applied;differences greater than a scan angledependent threshold are flagged ascloud contaminated. As a final step,SST retrievals are compared withReynolds OI SSTs using the same 6 Kdiscrepancy threshold as for thedaytime SST algorithm.
Minnett then discussed global statisticson AMSR-E SST and MODIS 11-µm SSTretrieval differences. Though thegreatest frequency of collocations is at a0 K difference, there is significantspread (approximately ±2 K), and jointprobability distributions indicate asecondary difference mode at about 5K. This probably indicates someresidual cloud-contamination in theMODIS retrievals. In summary, Minnettstated that the MODIS ocean clouddetection algorithm misses some low,uniform cloud decks and probably thincirrus. The use of a 6 K threshold in theReynolds OI SST comparison (com-pared with 2 K for AVHRR Pathfinderstudies) has allowed some leakage ofcloud-contaminated pixels. However,some level of residual cloud-contami-nation has to be tolerated, since toexclude all cloud effects would meanrejection of significant ocean signals.
Following Minnett, Nazmi Saleous
gave an overview of the various cloudmask approaches used by the MODISland team. With one exception (the fireproduct), either the operational mask(MOD35) and/or a mask based on theland surface reflectance product(MOD09), referred to as the “MOD09internal mask”, are/is used. Thesurface reflectance product uses theMOD09 internal mask exclusively. Thesnow product uses the overall cloud

THE EARTH OBSERVER • July/August 2003 Vol. 15 No. 4
18
confidence result from MOD35 (i.e., thefirst two bits of the mask) as well asindividual MOD35 spectral tests.Surface temperature products use onlythe MOD35 overall confidence result.The vegetation index, bidirectionalreflectance distribution function(BRDF), albedo, leaf area index (LAI),and fraction of photosyntheticallyactive radiation (FPAR) use the MOD35overall confidence result and theMOD09 internal mask. The fire productuses its own internal mask.
The MOD09 internal mask uses a mid-infrared anomaly test for low clouds,based on the difference between band20 (3.7-µm) reflectance and a linearcombination of bands 6 (1.6 µm) and 7(2.1 µm). High clouds are detected witha band 26 (1.38-µm) test. A thermal testbased on the difference between theMODIS brightness temperature andNCEP near-surface air temperature isused to assist over bright surfaces.Saleous showed several granule-levelexamples demonstrating the utility ofeach test. He also showed comparisonswith the MOD35 cloud mask and anexample of the land group’s shadowmask. The mask is based on geometriccalculations derived from cloud topheight (estimated from cloud andsurface temperature).
In summary, Saleous stated that furtherevaluation and improvements areneeded for both the MOD09 internalcloud mask (e.g., over water bodies)and the shadow mask. The land groupwould like to collaborate with theMOD35 cloud mask group as thesestudies evolve.
Finally, J. Vanderlei Martins discussedan operational spatial variabilitytechnique being used to supplementcloud masking for MODIS aerosolretrievals (MOD04) over the ocean.
Masking for aerosols is unique from
other clear-sky products in that heavy
aerosol plumes are often eliminated
from clear-sky conservative masks. The
spatial variability test in the latest
delivery is applied to 3x3 arrays of 500-
m band 4 (0.55-µm) pixels at each 500-
m pixel (instead of the previous version
where variability in 3x3 500-m pixel
arrays were analyzed every 1.5 km).
The new version improves the detec-
tion of cloud edges with acceptable
increases in processing time. Next, only
pixels within the 25-75% percentile in
10x10-km arrays are used for retrievals.
This acts to further eliminate cloud
contamination without biasing results.
Finally, several individual spectral tests
from the MOD35 cloud mask are
applied to detect thin cirrus and
homogeneous cloud fields — the 6.7-
µm high cloud water vapor test (bit 15),
window IR thin cirrus test (bit 11), and
the IR temperature difference test (bit
18). These tests allow for aerosol optical
depths up to about 5.0. Details can be
found in Martins et al. (GRL, 2002).
Other improvements in the latest
delivery include cloud discrimination
over sunglint, the use of a 1.38-µm thin
cirrus test (Gao et al., GRL, 2002), use of
a new coastal sediment mask (Li et al.,
TGRS, 2003), a high visible reflectance
threshold test, and thresholds of 0.47/
0.67-µm used to detect high optical
depth dust scenes having large
variability and thick dust scenes over
sunglint.
Martins showed examples of the
standard deviation for both 3x3 500-m
and 1-km resolution, along with
histograms over ocean and land scenes
demonstrating selection of standard
deviation thresholds. He also showed
examples over dust and sun glint.
Current work is proceeding onapplying a similar approach over land.This includes higher variance thresh-olds, a large band 0.47-µm reflectancethreshold to detect thick homogeneousclouds, spatial variance and absolutereflectance thresholds at 1.38 µm, andratios of 1.38-µm to 0.66-µm for cirrusdetection. Results to date are verypromising.
Platnick and Parkinson then thankedthe speakers and attendees for theirparticipation in this first, highlysuccessful attempt to compare productsfrom across the Aqua platform in aworkshop setting. The SST mini-workshop on May 28 and the clouddetection mini-workshop on May 29both brought together members of allthe Aqua science teams to cross-compare products and consider theenhanced understanding of the Earthsystem possible through the combineduse of the six instruments on the Aquaplatform.
THE EARTH OBSERVER • July/August 2003 Vol. 15, No. 4
19
Report on the Physical Oceanography DistributedArchive Center (PO.DAAC) User Working Group Meeting -April 22-23, 2003— Jorge Vazquez, [email protected], Jet Propulsion Laboratory
The regular meeting of the PhysicalOceanography Distributed ActiveArchive Center (PO.DAAC) UserWorking Group (UWG) was held April22-23, 2003, at the Raytheon/ITSSfacility in Pasadena, CA. Those inattendance included UWG members R.Evans (chair), David Glover, JohnLillibridge, Sydney Levitus, W.Timothy Liu, C.-K. Shum, and VictorZlotnicki (ex-officio), with the managerof the PO.DAAC, Donald Collins,chairing the meeting.
The meeting began with an overview ofthe future direction of the PO.DAAC.The overview will be incorporated intothe preparation of a strategic plan ofthe PO.DAAC. This strategic plan willinclude how the PO.DAAC willfunction in a competitive environmentand maintain a cost-effective mecha-nism for data distribution. A review ofthe goals of the PO.DAAC wasdiscussed.
Goals
The primary goal was for thePO.DAAC to be the lead center fordistribution of satellite-derived sea-surface topography and ocean vector-wind products. Additionally, thePO.DAAC will become the lead centerfor air-sea interaction data sets. Air-seainteraction data sets will include SST aswell as other derivable products suchas surface fluxes. The goals werediscussed in terms of integration intoNASA’s Earth Science program.
A NASA focus is now on the produc-tion of long-term climate data records(CDRs) and providing the data streamsto support the modeling community.Such CDRs will include both long-termtime series and data from multiplemissions. A challenge for the PO.DAACwill be providing the satellite-derivedoceanographic component of theseCDRs. As more missions and data setsrelated to CDRs come on line, thePO.DAAC will maintain its level ofuser support and data distribution. Partof the challenge is distributing thesedata sets in an operational near-real-time mode. To measure success, newand improved metrics are needed thatrecord all publications which includeCDRs. The discussion includedpossible scenarios for automating theprocess of keeping records on datapublication and usage.
Missions
Discussions also arose on the role of thePO.DAAC in future missions such asthe Ocean Vector Wind Mission(OVWM), the Ocean Surface Topogra-phy Mission (OSTM) on the JapaneseGlobal Change Observation Mission(GCOM), and the Aquarius Mission.Such missions will include the co-operation of the PO.DAAC with otheragencies such as NOAA. One of theunique aspects about the PO.DAAC isits direct linkage to the flight projects.This allows for the PO.DAAC toprovide a level of expertise in the data
sets from the beginning of the mission,including the system engineering, dataformats, data content, and the long-term data stewardship. Such experi-ence has been gained over several flightmissions including TOPEX/Poseidon,NSCAT, QuikScat, and Jason-1. Suchexperience will be carried forward intofuture flight projects and missions.
Conclusions
Increasing emphasis will be placed onthe electronic distribution of data. Thisincludes looking at new technologiesinvolving data transfer that improve onthe file transfer protocol (ftp). Addi-tionally, the incorporation of bettersubsetting for Level 2 and Level 3 dataproducts remains a high priority.
The meeting ended in agreement thatthe PO.DAAC is providing an excellentservice to its customers, both techni-cally and scientifically. Additionally, itsupports the educational communitythrough data products, brochures, andcommunity outreach. The members inattendance agreed that the primarychallenge would be for the PO.DAACto maintain its level of service, whileincreasing the number of data sets andproducts it supports.

THE EARTH OBSERVER • July/August 2003 Vol. 15 No. 4
20
The User Working Group of the OakRidge National Laboratory (ORNL)DAAC met on May 21-22, 2003, in OakRidge, Tennessee. The meeting wasattended by UWG members IndyBurke, Ken Davis, Ruth DeFries, MacPost, Peter Thornton, Curtis Woodcock(UWG Chair), and Quinton Barker(ESDIS Representative). From theORNL DAAC, Tim Rhyne (SystemsEngineer), Larry Voorhees (DAACManager), and Bob Cook (DAACScientist) attended the meeting; DAACstaff participated in several parts of theagenda.
The ORNL DAAC supports the EarthScience Enterprise (ESE) and the EarthObserving System (EOS) by providingdata and information about thedynamics between the biological,geological, and chemical componentsof the Earth’s environment. Sources ofdata held by the DAAC include NASA-funded field campaigns, (such asBOREAS, LBA, and SAFARI 2000),selected relevant measurements fromEOS satellites, as well as other bio-geochemical dynamics data useful tothe global change research community.The DAAC supports EOS validation byproviding data from Land Validationfield activities, as well as 7x7-kmsubsets of MODIS Land Products inASCII format. The Web Site for theORNL DAAC is www.daac.ornl.gov.
Following a review of the status ofDAAC activities, the meeting focusedon future plans.
DAAC Activities Status Report
• From July 2002 to April 2003, theORNL DAAC archived 26 datasets from the following projects(SAFARI 2000, BOREAS Follow-On, Net Primary Productivity,FLUXNET, and Prototype Valida-tion Experiment (PROVE)), aswell as global vegetation andglobal root data sets.
• In support of validation activities,the DAAC provides subsets of keyMODIS land products for 274 sitesin ASCII format for comparisonwith field data. The followingMODIS products are beingoffered: surface reflectance,surface temperature, land cover,enhanced vegetation index, leafarea index / fraction of photosyn-thetically active radiation,photosynthesis, albedo, and nadirBRDF-adjusted reflectance.
• The ORNL DAAC has developed aWeb map server to help userslocate field sites from around theworld. The DAAC has Web mapservers, based on the MinnesotaMapServer for more than 210 sitesin the FLUXNET global network,for more than 270 sites that haveMODIS ASCII Subsets, and morethan 60 sites from the Net PrimaryProduction project. Users canselect a group of sites and retrieveavailable site characteristics anddata.
• For the FLUXNET collection ofcarbon dioxide flux measure-ments, the ORNL DAAC regis-tered 216 towers from 11 networksworld-wide and provides gap-filled flux data for 176 site-yearsfrom 53 sites.
• In support of biogeochemicaldynamics modeling activities, theORNL DAAC has provided ametadata registry for regional andglobal environmental data held atdata centers around the world.Over 180 data sets on vegetation,climate, soils, gas exchange, andhydrology are registered inMercury, the ORNL DAAC’smetadata search and data retrievalsystem.
• During CY 2002, the ORNL DAACdelivered over 53,961 dataproducts to 5,030 distinct users;the most popular data sets wereFLUXNET, Net Primary Produc-tion, SAFARI 2000, Global Climatedata, and River Discharge(RivDIS).
• Mercury-EOS, a client for ECHO,was deployed in April 2003. Thissystem will allow users to searchORNL DAAC holdings and ordervia ECHO’s centralized orderingmechanism. ECHO, the EOSClearinghouse, is a systemdeveloped by ESDIS to query fordata and place orders like com-mercial e-commerce entities.
May 2003 User Working Group Meeting - ORNL DAAC forBiochemical Dynamics— Robert Cook,[email protected], Oak Ridge National Laboratory— Larry Voorhees, [email protected], Oak Ridge National Laboratory— Curtis Woodcock, [email protected], Boston University
THE EARTH OBSERVER • July/August 2003 Vol. 15, No. 4
21
• The DAAC has developed a Web-based tool for investigators toprepare documentation for in situ
data sets. Currently, the tool isbeing evaluated by selected LBAparticipants.
Data Activities: The NA Carbon
Program
The North American Carbon Program(NACP), one component of the U.S.Global Change Research Program, is amulti-agency research program tostudy sources and sinks of carbon inNorth America and adjacent oceans.Because of the close relationshipbetween the goals of the NACP and themission of the DAAC, the UWGdiscussed ways in which the DAACshould be one of many data centersinvolved in the NACP (e.g., NOAA-National Climatic Data Center(NCDC), Carbon Dioxide InformationAnalysis Center (CDIAC), LP-DAAC,and NOAA-Climate Monitoring andDiagnostics Laboratory (CMDL)).
The UWG recommended that theORNL DAAC should be involved inthe preparation of the implementationplan for NACP and involved incompiling and distributing in situ dataduring NACP.
Archiving Models
The UWG suggested at the July 2002meeting that the ORNL DAAC couldplay an important role in archivingnumerical models that representterrestrial biogeochemistry, includingland-atmosphere exchange of carbon.There are a number of reasons forarchiving models: to enable others toreproduce the results of a publishedstudy, to provide an estimate ofuncertainties for comparison withresults from other models in assess-ment/policy studies, and to provide
the source code, which allows others tosee how models treat individualprocesses. The model archive at theORNL DAAC is envisioned as aresource for experienced modelers, andis not intended for novices or as aninstructional tool.
Within three months, the UWG and theORNL DAAC will write a positionpaper for open literature to describe theimportance of creating a model archive.As a complement to that paper, theDAAC will write a set of guidelines forpreparing information for a modelarchive (documentation, source code,representative input and output data,and post-processing / analysis code).As part of the FY 2004 activities, theDAAC will begin to archive high-priority biogeochemical dynamicsmodels.
During the discussion of archivingmodels, the UWG suggested thatNASA should have a Model Policy togo along with the existing Data Policy.The UWG will pursue this after theposition paper has been finalized.
Land Validation and Field Investiga-
tion Subcommittee
A summary of a recent Land Validationand Field Investigation Subcommitteemeeting was presented. Six UWGmembers held a teleconference May 19,2003.
The subcommittee discussed unautho-rized use of project data. Severalprojects supported by the ORNLDAAC (SAFARI 2000, Land Validation,and FLUXNET data) have data policiesthat request users contact the investiga-tor before using the data. There havebeen several instances of researcherspublishing project data withoutcontacting investigators for permission,or properly citing the source of the
data. In response to these instances,projects have come up with a couple ofpossible solutions, including promi-nently posting the data policy at thetop of each data file.
The DAAC also requested guidancefrom the subcommittee on how best tomove data from the Land Validationversion of Mercury into the archive.The subcommittee suggested that theDAAC focus on those data used tovalidate land products. If suchvalidation data are in Mercury, theDAAC should contact investigators toensure that data are ready forarchiving. If data that have been usedin validating land products are not inMercury, the MODLAND Science Teamshould contact investigators to obtaindata and metadata.
The subcommittee discussed thefollowing data activities the DAAC canperform to support the Committee onEarth Observing Satellites (CEOS) /Working Group on Calibration andValidation (WGCV):
• Continue to attend WGCV topicalmeetings to provide DAACexperience and offer ways theDAAC can contribute (e.g.,Albedo Workshop, October 2002);
• Continue to register data frominternational LAI intercomparisonactivities in Mercury;
• Prepare and post MODIS ASCIISubsets for International WGCVintercomparison sites; and
• Provide data managementsupport: field data and metadatapreparation, data set distribution,compilation of site characteristicsdata from literature, preparationand distribution of value-addedproducts.

THE EARTH OBSERVER • July/August 2003 Vol. 15 No. 4
22
Regional and Global Data Subcom-
mittee
The UWG heard a report from theRegional and Global Data Subcommit-tee. Seven UWG members participatedin the teleconference on May 8, 2003.
The DAAC summarized plans toarchive regional and global data fromrecently completed projects. In thenear-term the DAAC is planning toarchive global allometry data, Siberianland cover, N-deposition data for theeastern U.S. and western Europe,global litter data, and the rangelandCO2 flux data from the U.S.
Conclusion
With this meeting, Curtis Woodcockconcluded his leadership role as Chairof the ORNL DAAC UWG for theperiod 1999-2003. The UWG andDAAC staff thanked Woodstock for hisservice. He was instrumental inimplementing several important
changes in the operation of the UWG.Early in Woodstock’s term as Chair, healso ensured that the DAAC’s activitiesand future plans were on target, so thatthe past several UWG meetings haveconfirmed that the DAAC is doing the“right thing” and no major issues havesurfaced.
During the close-out session, the UWGmembers provided the followingrecommeµndations:
• The top priority should always beto increase the data holdings ofthe DAAC.
• Data quality, documentation andadded-value of data holdings areall important considerations forthe DAAC. The legacy of theDAAC is tied to the data in thearchive.
• The model archive initiative isimportant, and DAAC staffshould assist the UWG in writinga modeling position paper during
the next three months.• The North American Carbon
Program (NACP) activity iscentral to the mission of theDAAC, and the DAAC should payclose attention to the NACP as itevolves.
• The UWG concluded the meetingby stating that the ORNL DAAC iscurrently fulfilling its mission toprovide biogeochemical dynamicsand terrestrial ecology data to theresearch community. The num-bers of DAAC data users andnumbers of data productsdownloaded each year continue toincrease, and references to ORNLDAAC data in the peer reviewedliterature are increasing.
UWG photo, at the Walker Branch Watershed Flux Tower site. (From left to right: Peter Thornton,Tim Rhyne, Mac Post, Tilden Meyers, (NOAA, Walker Branch Watershed Flux Tower PI), Ken Davis,Quinton Barker, Indy Burke, Ruth DeFries, Bob Cook, and Curtis Woodcock). Photo Credit: LarryVoorhees.
Erratum
The Odyssey of the Mind WorldFinals were held at Iowa StateUniversity in Ames, Iowa, notUniversity of Iowa as mentionedin our article titled "NASA'sEarth Science EnterpriseSponsors Creative ProblemSolving Competition" on page 30of the May/June issue of The
Earth Observer. Our apologies toIowa State for this error.
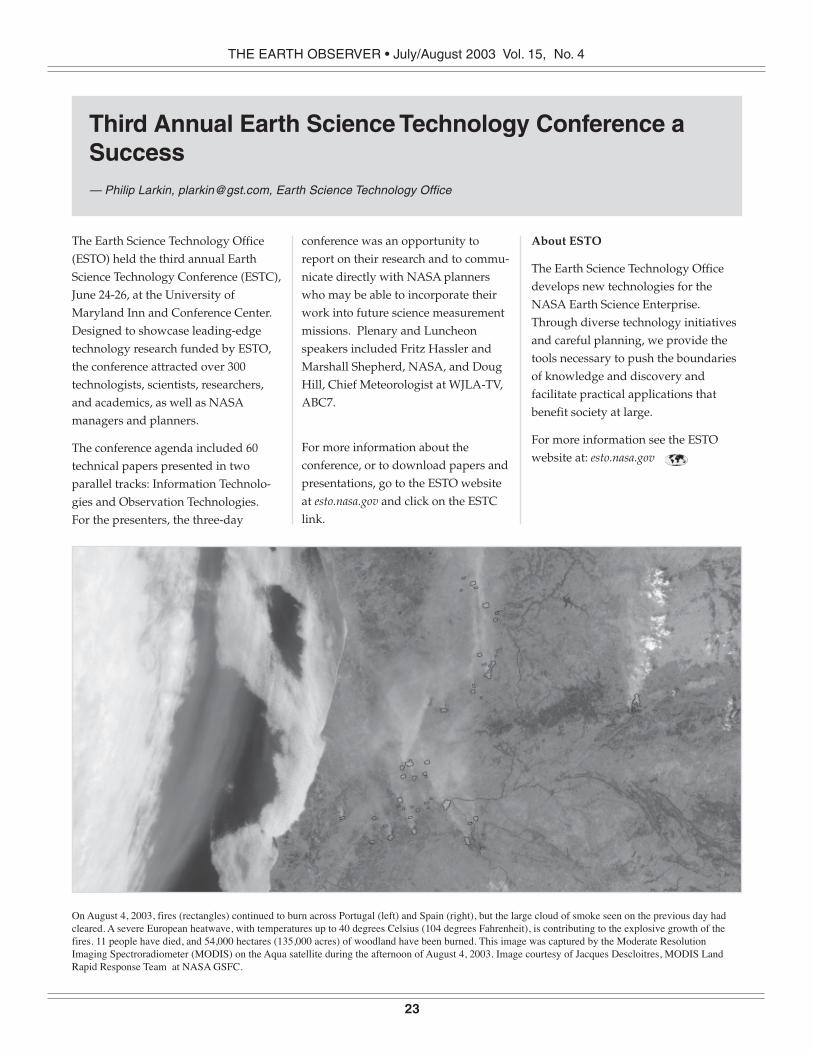
THE EARTH OBSERVER • July/August 2003 Vol. 15, No. 4
23
Third Annual Earth Science Technology Conference aSuccess— Philip Larkin, [email protected], Earth Science Technology Office
The Earth Science Technology Office(ESTO) held the third annual EarthScience Technology Conference (ESTC),June 24-26, at the University ofMaryland Inn and Conference Center.Designed to showcase leading-edgetechnology research funded by ESTO,the conference attracted over 300technologists, scientists, researchers,and academics, as well as NASAmanagers and planners.
The conference agenda included 60technical papers presented in twoparallel tracks: Information Technolo-gies and Observation Technologies.For the presenters, the three-day
conference was an opportunity toreport on their research and to commu-nicate directly with NASA plannerswho may be able to incorporate theirwork into future science measurementmissions. Plenary and Luncheonspeakers included Fritz Hassler andMarshall Shepherd, NASA, and DougHill, Chief Meteorologist at WJLA-TV,ABC7.
For more information about theconference, or to download papers andpresentations, go to the ESTO websiteat esto.nasa.gov and click on the ESTClink.
About ESTO
The Earth Science Technology Officedevelops new technologies for theNASA Earth Science Enterprise.Through diverse technology initiativesand careful planning, we provide thetools necessary to push the boundariesof knowledge and discovery andfacilitate practical applications thatbenefit society at large.
For more information see the ESTOwebsite at: esto.nasa.gov
On August 4, 2003, fires (rectangles) continued to burn across Portugal (left) and Spain (right), but the large cloud of smoke seen on the previous day hadcleared. A severe European heatwave, with temperatures up to 40 degrees Celsius (104 degrees Fahrenheit), is contributing to the explosive growth of thefires. 11 people have died, and 54,000 hectares (135,000 acres) of woodland have been burned. This image was captured by the Moderate ResolutionImaging Spectroradiometer (MODIS) on the Aqua satellite during the afternoon of August 4, 2003. Image courtesy of Jacques Descloitres, MODIS LandRapid Response Team at NASA GSFC.
THE EARTH OBSERVER • July/August 2003 Vol. 15 No. 4
24
The lessons learned during thedevelopment and operation of a NASAoutreach program can benefit othereducational efforts linked to scientificprojects.
Lesson One: Think Globally, Act
Incrementally.
A short-term project is probably bestdone with a small, local audience. For alonger-term, extensive project, startslowly, incorporate teacher feedback,and allow time for your project tobecome known and appreciated.
The Students’ Cloud Observations On-Line (S’COOL) Project was initiated inlate 1996, before the launch of the threelow Earth orbit satellites that now carrythe Clouds and the Earth’s RadiantEnergy System (CERES) instruments.From the beginning, S’COOL wasdeveloped with input from teachers.Indeed, the idea for this project arose ina conversation between the first authorand a sixth-grade science teacher. Shewas seeking a simple, safe, and cheapway to connect her students’ in-classexperiments to NASA. CERES, whichwas designed to monitor the Earth’sradiation budget and how it is im-pacted by cloud properties (Wielicki et
al. 1996), needed to validate cloudretrievals on a global basis. Theteacher’s class served as the first testsite for S’COOL, confirming thatstudents would be interested in the
project. The scope of the S’COOLproject was then expanded over theyear leading up to the launch of thefirst CERES instrument [on the TropicalRainfall Measuring Mission (TRMM)satellite on Thanksgiving Day, 1997,from Tanegashima, Japan]. Table 1
summarizes the development phases ofS’COOL. After each phase, teachercomments were solicited and used toimprove the project. Specific lessonslearned are included in Table 1.S’COOL was declared operational inApril 1998. It now involves the part-time efforts of two scientists, two weband database specialists, and a fulltimeformer classroom teacher (part of theteam since October 1997). A part-timeteacher consultant was added in 2000to focus on interaction with theSpanish-speaking audience. (Bilingualteam members cover French andGerman translation needs.) In 2001, apart-time administrative assistant wasadded to keep up with the growingS’COOL community.
Lesson Two: Keep it Simple.
For teachers: Teachers have manydemands on their time, so keepingoutreach as simple and flexible aspossible is imperative.
For students: What may seem trivial toscientists can be fascinating newknowledge to a young student.
To participate, interested teacherssimply register. S’COOL needs a recordof the location of each school in orderto match their observations with thesatellite. Each registered teacherreceives a packet of information,including a colorful cloud identificationposter. Upon registration, teachers aresent their first overpass schedule,telling them what time the satellite willpass over their school each day.Schedules are projected a maximum oftwo months into the future, sincesatellite orbit adjustments occur.Further schedules can be requestedonline at scool.larc.nasa.gov.
From the schedule, teachers select anoverpass that fits their class situation.Students then go outside within 15minutes of the satellite’s passage toobserve and record cloud and surfaceproperties on a one-page report form.For an experienced class, this processtakes only 5–10 minutes. Overpassschedules do not always mesh withschool schedules, but solutions can beworked out. For example, a high schoolteacher reported the following: “Ouroverpass times are always while theyare in classes other than science. Wedesigned special S’COOL hall passes,and my colleagues who teach otherdisciplines have been very supportiveand allow the students to leave classfor five minutes to go outside and taketheir readings.”
The CERES S’COOL Project— Lin Chambers , Langley Research Center, [email protected]— David Young, Langley Research Center, [email protected]— P. Kay Costulis, Langley Research Center, [email protected]— Pauline Detweiler, Langley Research Center, [email protected]— Joyce Fischer, Langley Research Center, [email protected]— Roberto Sepulveda, Langley Research Center, [email protected]— Douglas B. Stoddard, Langley Research Center, [email protected]— Amanda Falcone, Trinity University, San Antonio, Texas, [email protected]

THE EARTH OBSERVER • July/August 2003 Vol. 15, No. 4
25
The observation is sent to NASA eitherby accessing an online form, or bysending an e-mail, a fax, or even a hardcopy (a ground rule for S’COOL is thatInternet access is not required, enablingus to reach students without comput-ers). The S’COOL ground observationsare stored in a database at the NASALangley Atmospheric Sciences DataCenter (ASDC); online ateosweb.larc.nasa.gov. ASDC is respon-sible for processing and archivingCERES data along with many otheratmospheric datasets. During opera-tional processing, CERES data corre-sponding to S’COOL observations areextracted and placed in the S’COOLsatellite database. For the TRMMsatellite, data are only availablebetween about 35°N and 35°S latitude.In December 1999, the launch of twoCERES instruments on the Terra
spacecraft provided a daily morningoverpass of the entire globe. The Aqualaunch, with two more CERES instru-ments and a daily afternoon overpass,was on May 4, 2002.
Figure 1 shows the history of partici-pants and ground and satellite observa-tions in the S’COOL database. Within amonth of sending their first observa-tion (and for each new school year), aclass receives a “S’COOL Observer”decal for each student. Teachers canalso print certificates for each studentfrom the Web site to recognize theirprogress, which can be substantial. Forexample, one teacher reported “. . . myfirst graders got very good at identify-ing the cloud types. I was impressedwith their knowledge at such a youngage.”
Lesson Three: The Internet Advantage
The Internet is invaluable to facilitatecommunication with participants andto share information among them.There is also an increasing amount ofuseful information on the Web, whichcan be used for background andsupplementary information.
The S’COOL ground and satellitedatabases are available via a publicWeb interface, for use by teachers ineducational applications (such asgraphing, mapping, and comparing).Lesson plans describing data-useprojects are available. From thisdisplay, that data can also be down-loaded into spreadsheets for analysis.
From the beginning, S’COOL observa-tions have been a useful complement tothe satellite information. The very firstS’COOL observation occurred on abeautifully clear January day. Reportsfrom cloud observers on clear daysmay seem dull but are very important.Determination of a completely clearsky from the satellite can be a challengein certain circumstances, given theinhomogeneous background of theEarth’s surface, but there is highconfidence in the accuracy of students’report of clear sky. Other challenges tothe satellite cloud retrieval algorithminclude clouds over snow, subpixel-scale clouds, and very thin clouds—none of which pose problems forobservers on the ground. Whenmultiple cloud layers are present, thesurface observation gives an additionaldata point from the bottom, while thesatellite views the cloud top.
Instrument problems and data delayshave slowed the production of satellitedata, so that timely comparison ofground and satellite results has been amajor challenge. Nonetheless, astatistical comparison using the limited
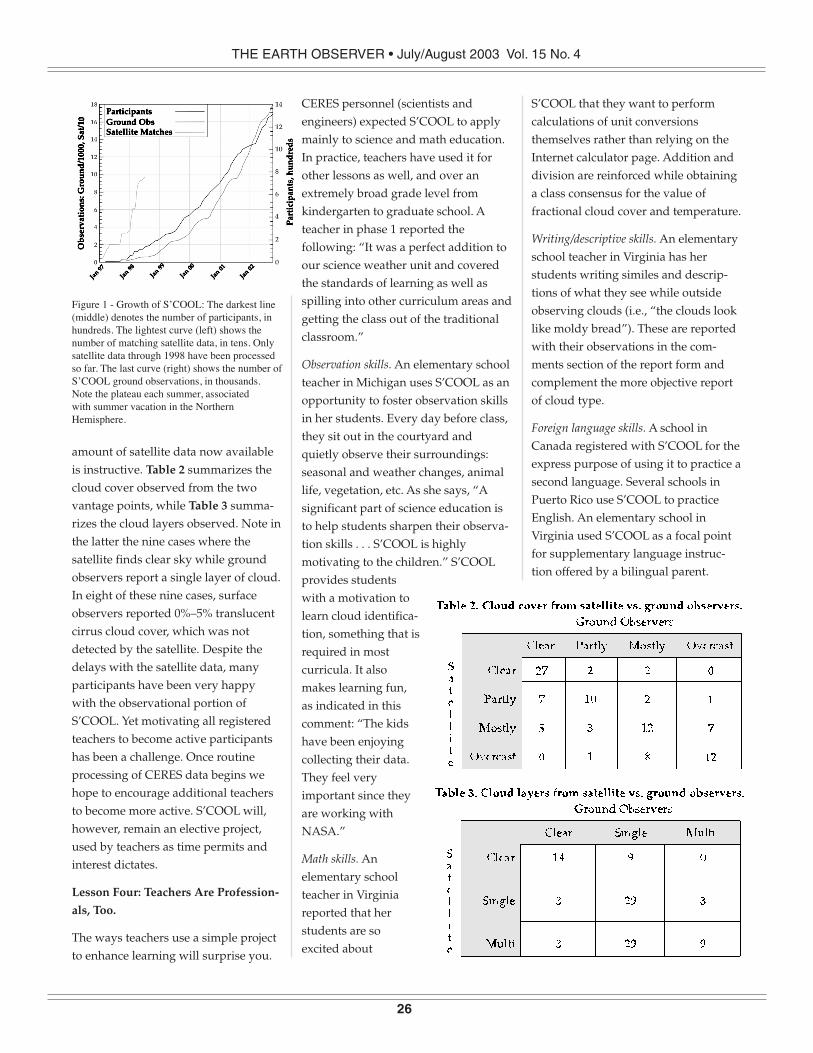
THE EARTH OBSERVER • July/August 2003 Vol. 15 No. 4
26
amount of satellite data now availableis instructive. Table 2 summarizes thecloud cover observed from the twovantage points, while Table 3 summa-rizes the cloud layers observed. Note inthe latter the nine cases where thesatellite finds clear sky while groundobservers report a single layer of cloud.In eight of these nine cases, surfaceobservers reported 0%–5% translucentcirrus cloud cover, which was notdetected by the satellite. Despite thedelays with the satellite data, manyparticipants have been very happywith the observational portion ofS’COOL. Yet motivating all registeredteachers to become active participantshas been a challenge. Once routineprocessing of CERES data begins wehope to encourage additional teachersto become more active. S’COOL will,however, remain an elective project,used by teachers as time permits andinterest dictates.
Lesson Four: Teachers Are Profession-
als, Too.
The ways teachers use a simple projectto enhance learning will surprise you.
CERES personnel (scientists andengineers) expected S’COOL to applymainly to science and math education.In practice, teachers have used it forother lessons as well, and over anextremely broad grade level fromkindergarten to graduate school. Ateacher in phase 1 reported thefollowing: “It was a perfect addition toour science weather unit and coveredthe standards of learning as well asspilling into other curriculum areas andgetting the class out of the traditionalclassroom.”
Observation skills. An elementary schoolteacher in Michigan uses S’COOL as anopportunity to foster observation skillsin her students. Every day before class,they sit out in the courtyard andquietly observe their surroundings:seasonal and weather changes, animallife, vegetation, etc. As she says, “Asignificant part of science education isto help students sharpen their observa-tion skills . . . S’COOL is highlymotivating to the children.” S’COOLprovides studentswith a motivation tolearn cloud identifica-tion, something that isrequired in mostcurricula. It alsomakes learning fun,as indicated in thiscomment: “The kidshave been enjoyingcollecting their data.They feel veryimportant since theyare working withNASA.”
Math skills. Anelementary schoolteacher in Virginiareported that herstudents are soexcited about
S’COOL that they want to performcalculations of unit conversionsthemselves rather than relying on theInternet calculator page. Addition anddivision are reinforced while obtaininga class consensus for the value offractional cloud cover and temperature.
Writing/descriptive skills. An elementaryschool teacher in Virginia has herstudents writing similes and descrip-tions of what they see while outsideobserving clouds (i.e., “the clouds looklike moldy bread”). These are reportedwith their observations in the com-ments section of the report form andcomplement the more objective reportof cloud type.
Foreign language skills. A school inCanada registered with S’COOL for theexpress purpose of using it to practice asecond language. Several schools inPuerto Rico use S’COOL to practiceEnglish. An elementary school inVirginia used S’COOL as a focal pointfor supplementary language instruc-tion offered by a bilingual parent.
Figure 1 - Growth of S’COOL: The darkest line(middle) denotes the number of participants, inhundreds. The lightest curve (left) shows thenumber of matching satellite data, in tens. Onlysatellite data through 1998 have been processedso far. The last curve (right) shows the number ofS’COOL ground observations, in thousands.Note the plateau each summer, associatedwith summer vacation in the NorthernHemisphere.
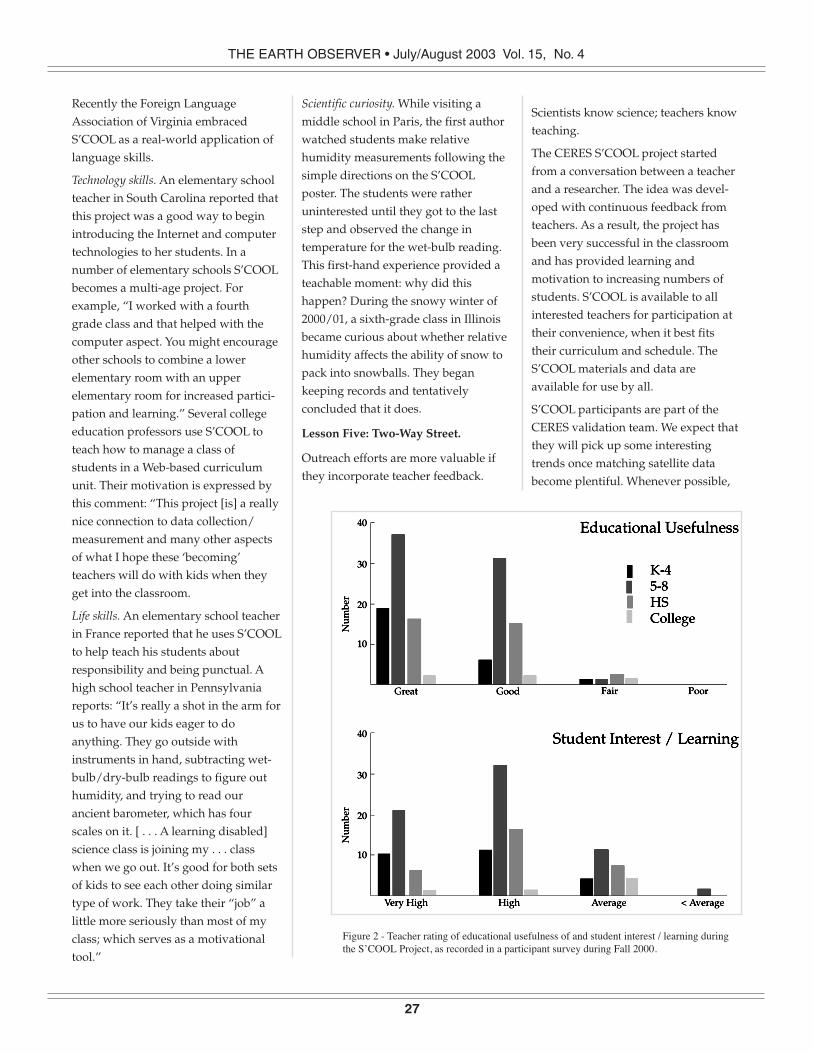
THE EARTH OBSERVER • July/August 2003 Vol. 15, No. 4
27
Recently the Foreign LanguageAssociation of Virginia embracedS’COOL as a real-world application oflanguage skills.
Technology skills. An elementary schoolteacher in South Carolina reported thatthis project was a good way to beginintroducing the Internet and computertechnologies to her students. In anumber of elementary schools S’COOLbecomes a multi-age project. Forexample, “I worked with a fourthgrade class and that helped with thecomputer aspect. You might encourageother schools to combine a lowerelementary room with an upperelementary room for increased partici-pation and learning.” Several collegeeducation professors use S’COOL toteach how to manage a class ofstudents in a Web-based curriculumunit. Their motivation is expressed bythis comment: “This project [is] a reallynice connection to data collection/measurement and many other aspectsof what I hope these ‘becoming’teachers will do with kids when theyget into the classroom.
Life skills. An elementary school teacherin France reported that he uses S’COOLto help teach his students aboutresponsibility and being punctual. Ahigh school teacher in Pennsylvaniareports: “It’s really a shot in the arm forus to have our kids eager to doanything. They go outside withinstruments in hand, subtracting wet-bulb/dry-bulb readings to figure outhumidity, and trying to read ourancient barometer, which has fourscales on it. [ . . . A learning disabled]science class is joining my . . . classwhen we go out. It’s good for both setsof kids to see each other doing similartype of work. They take their “job” alittle more seriously than most of myclass; which serves as a motivationaltool.”
Scientific curiosity. While visiting amiddle school in Paris, the first authorwatched students make relativehumidity measurements following thesimple directions on the S’COOLposter. The students were ratheruninterested until they got to the laststep and observed the change intemperature for the wet-bulb reading.This first-hand experience provided ateachable moment: why did thishappen? During the snowy winter of2000/01, a sixth-grade class in Illinoisbecame curious about whether relativehumidity affects the ability of snow topack into snowballs. They begankeeping records and tentativelyconcluded that it does.
Lesson Five: Two-Way Street.
Outreach efforts are more valuable ifthey incorporate teacher feedback.
Scientists know science; teachers knowteaching.
The CERES S’COOL project startedfrom a conversation between a teacherand a researcher. The idea was devel-oped with continuous feedback fromteachers. As a result, the project hasbeen very successful in the classroomand has provided learning andmotivation to increasing numbers ofstudents. S’COOL is available to allinterested teachers for participation attheir convenience, when it best fitstheir curriculum and schedule. TheS’COOL materials and data areavailable for use by all.
S’COOL participants are part of theCERES validation team. We expect thatthey will pick up some interestingtrends once matching satellite databecome plentiful. Whenever possible,
Figure 2 - Teacher rating of educational usefulness of and student interest / learning duringthe S’COOL Project, as recorded in a participant survey during Fall 2000.
THE EARTH OBSERVER • July/August 2003 Vol. 15 No. 4
28
CERES researchers and S’COOLpersonnel visit participating schools. AS’COOL “Wall of Fame” marks thelocation of each participating school. Itis on display near CERES researchers’workplace, enabling them to makeS’COOL visits a part of any trip theytake. These visits are a very importantelement of S’COOL, allowing us to takethe scientific message behind theproject directly to the children, and toshow them science’s human face. As aSwiss elementary school teacher said,“Continue thus and persuade yourcolleagues to do the same. It is thetruest way to ‘germinate’ vocations.”
Since 1999 there has been a weeklongsummer S’COOL workshop forteachers at NASA Langley ResearchCenter. The week includes in-depthwork with elements of the S’COOLProject, introduction to CERES scienceand scientists, and tours of interestingfacilities around NASA. Said oneparticipate, “I can never get enough ofthese guys explaining the sciencebehind the experiments.” This directinteraction between scientists andteachers, some of whom are experi-enced S’COOL teachers, never fails toresult in ideas for new ways to help
students learn. Lesson plans and othermaterials developed in these work-shops are made available online for allparticipants.
A participant survey during Fall 2000had a 20% response rate (134 respon-dents, which is about half of the then-active participants), and providedobjective data as well as room forcomments. A large majority of teachersrated the educational impact ofS’COOL highly. Thirty-three teachersreported a total of 557 studentsshowing increased interest in science asa career after being involved withS’COOL. The remainder of respondingteachers said it was “too soon to tell.”While this is a qualitative assessment, itis encouraging news for the S’COOLteam.
Acknowledgments
Funding for S’COOL is provided byNASA’s Earth Science Enterprise andEducation Offices, and by CERES.
Our thanks, first, to Eleanor Jones, thesixth-grade teacher who inspired theidea for S’COOL; to Carol Mitchell, alocal teacher who has been involvedand helpful from the first phase; toSteve Campbell and others in NASA
Langley’s graphics section whodeveloped and now continue theS’COOL “look”; to Carolyn Green, thefirst educational consultant forS’COOL, whose enthusiasm and hardwork were key factors in the success ofthe project, and who, in her thirdcareer, is now a S’COOL teacher; toAnne M. Racel and Susan J. Haberer ofthe ASDC, the first and second Web“gurus” of the S’COOL Project, withoutwhom we could not reach so manyschools in so many places; to IanMcGlynn, Gretchen Blauvelt, and AllanArmenta, student interns; to ChristineYork, teacher intern, who contributedto the S’COOL Project; to all the teachergraduates of our summer workshops,and to all S’COOL teachers around theworld, without whom this projectwould remain only an idea.
References
Wielicki, B. A., B. R. Barkstorm, E. F.Harrison, R. B. Lee III, G. L. Smith, andJ. E. Cooper, 1996: Clouds and theEarth’s Radiant Energy System(CERES): An Earth Observing SystemExperiment. Bull. Amer. Meteor. Soc.,77, 853–868.
KudosThe MODIS Near Real Time Processing Team has been awarded the NASA Group Achievement Award for establishinga processing and delivery system providing selected biogeophysical products to operational weather centrals. As adirect result of their outstanding interagency cooperation, products enabled by the Near Real Time effort are used tosupport Operation Enduring Freedom. The team consists of individuals from Government and contractor organiza-tions including NASA Goddard Space Flight Center, NOAA’s NESDIS: National Environmental Satellite, Data, andInformation Service, the Air Force Weather Agency (AFWA), the Fleet Numerical Meteorology and OceanographyCenter (FNMOC), the Naval Oceanographic Office (NAVOCEANO), the Naval Research Laboratory (NRL), andparticipants from several contractor companies.
The Earth Observer staff and the entire Earth Science community wish to congratulate this team on its outstandingaccomplishments.
THE EARTH OBSERVER • July/August 2003 Vol. 15, No. 4
29
Global Garden Gets Greener— Rebecca Lindsey, [email protected], Science Systems and Applications, Inc.
Published on the Earth Observatory Website: earthobservatory.nasa.gov/Study/GlobalGarden/
Leaving aside for a moment thedeforestation and other land coverchanges that continue to accompany anever-growing human population, thelast two decades of the 20th centurywere a good time to be a plant onplanet Earth. In many parts of theglobal garden, the climate grewwarmer, wetter, and sunnier, anddespite a few El Niño-related setbacks,plants flourished for the most part.
Numerous small-scale studies over thepast 20 years suggested that patches ofthe garden were getting greener, butthat trying to paint a global picturewould be a monumental project. Ateam of eight scientists from across thecountry worked for almost a year and ahalf to pull together satellite data onvegetation and ground- and satellite-based climate observations. Theirresults show us not only how vegeta-tion productivity has changed duringtwo of the warmest decades in therecord books, but they also revealwhich of the many factors that influ-ence plant productivity have been mostimportant in those changes.
When scientists talk about productivity,they are specifically talking about howmuch carbon ends up stored in theliving biomass—roots, trunks, andleaves of plants—after they tally upcarbon gains through photosynthesisand carbon losses through respiration.This tally of gains minus losses is called“net primary production.” Scientistsestimate net primary production byobserving how leafy vegetation is and
how much sunlight it is absorbing,which can both be measured bysatellite. Combined with climate dataon rainfall, temperature, and availableradiation, the satellite observationsreveal where carbon intake increased—and biomass grew—across the globe.
“Between 1982 and 1999, 25% of theEarth’s vegetated area experiencedincreasing plant productivity—a totalincrease of about 6%,” saysRamakrishna Nemani, the study’s leadscientist. “That increase occurredmainly in the tropics, and secondarilyin high northern latitudes. What’sinteresting about our results is that theyshow how the increase in each of theseregions is due to a different climatefactor. In the tropics, Nemani and hiscolleagues discovered that the increasein productivity was caused by lack ofclouds and increased Sun exposure,while in the northern latitudes, it wasmainly due to increased temperaturesand, to a lesser extent, water availabil-ity.
Increases in productivity are importantin a practical sense, since plant biomassis the food and fuel for all animals—including humans—on the planet. It’salso important in the way that every-thing related to carbon has becomeimportant in recent years. Scientistsand environmental policy decisionmakers across the world want to knowwhat is happening to all the carbon inthe carbon dioxide pumped into theatmosphere through fossil fuel andbiomass burning, such as forest fires or
firewood used as fuel. If carbon dioxideis “food” for plants, maybe more of itin the atmosphere caused plants togrow better.
“Experiments conducted in places likethe U.S and Europe, where scientistspumped extra amounts of carbondioxide gas into forests, did seem toshow that such ‘carbon dioxidefertilization,’ caused plants to growbetter—up to a point,” says Nemani.“But this didn’t go on year after year.Most people agree that a doubling ofcarbon dioxide could increase plantgrowth between 0% and 25% depend-ing on resource limitations such as soilnutrition. With the 9% increase incarbon dioxide that occurred between1980 and 2000, even the upper limitcannot explain the productivityincreases in the Amazon.” Clearly,carbon dioxide fertilization couldn’t besolely responsible for the change;climate change must be playing a roleas well.
To reach these conclusions, Nemaniand colleagues from Scripps Institute ofOceanography, University of Montana,NASA’s Goddard Space Flight Center,and Boston University used globalclimate data from the National Centerfor Environmental Prediction todetermine the relative importance forvarious locations of the three keyvariables that influence plant growth:temperature, water availability, andsunlight. They indexed areas based onwhich of those factors most limitedplant growth across the Earth. Lack of
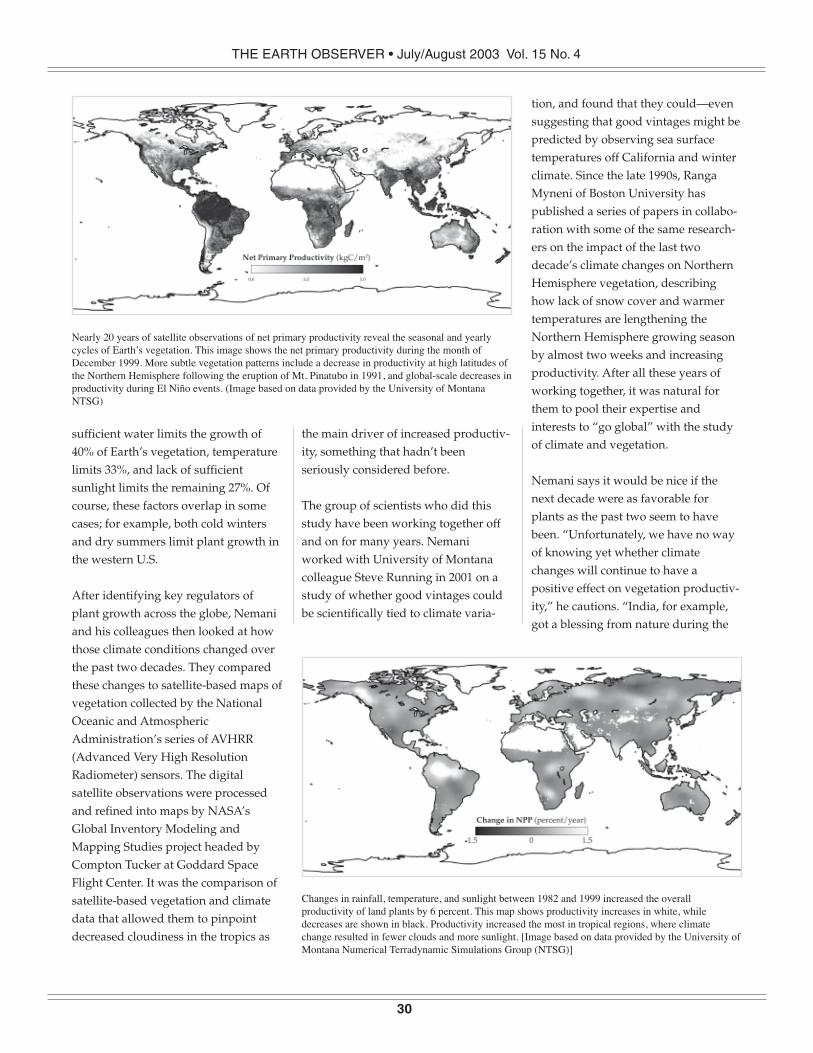
THE EARTH OBSERVER • July/August 2003 Vol. 15 No. 4
30
sufficient water limits the growth of40% of Earth’s vegetation, temperaturelimits 33%, and lack of sufficientsunlight limits the remaining 27%. Ofcourse, these factors overlap in somecases; for example, both cold wintersand dry summers limit plant growth inthe western U.S.
After identifying key regulators ofplant growth across the globe, Nemaniand his colleagues then looked at howthose climate conditions changed overthe past two decades. They comparedthese changes to satellite-based maps ofvegetation collected by the NationalOceanic and AtmosphericAdministration’s series of AVHRR(Advanced Very High ResolutionRadiometer) sensors. The digitalsatellite observations were processedand refined into maps by NASA’sGlobal Inventory Modeling andMapping Studies project headed byCompton Tucker at Goddard SpaceFlight Center. It was the comparison ofsatellite-based vegetation and climatedata that allowed them to pinpointdecreased cloudiness in the tropics as
the main driver of increased productiv-ity, something that hadn’t beenseriously considered before.
The group of scientists who did thisstudy have been working together offand on for many years. Nemaniworked with University of Montanacolleague Steve Running in 2001 on astudy of whether good vintages couldbe scientifically tied to climate varia-
tion, and found that they could—evensuggesting that good vintages might bepredicted by observing sea surfacetemperatures off California and winterclimate. Since the late 1990s, RangaMyneni of Boston University haspublished a series of papers in collabo-ration with some of the same research-ers on the impact of the last twodecade’s climate changes on NorthernHemisphere vegetation, describinghow lack of snow cover and warmertemperatures are lengthening theNorthern Hemisphere growing seasonby almost two weeks and increasingproductivity. After all these years ofworking together, it was natural forthem to pool their expertise andinterests to “go global” with the studyof climate and vegetation.
Nemani says it would be nice if thenext decade were as favorable forplants as the past two seem to havebeen. “Unfortunately, we have no wayof knowing yet whether climatechanges will continue to have apositive effect on vegetation productiv-ity,” he cautions. “India, for example,got a blessing from nature during the
Changes in rainfall, temperature, and sunlight between 1982 and 1999 increased the overallproductivity of land plants by 6 percent. This map shows productivity increases in white, whiledecreases are shown in black. Productivity increased the most in tropical regions, where climatechange resulted in fewer clouds and more sunlight. [Image based on data provided by the University ofMontana Numerical Terradynamic Simulations Group (NTSG)]
Nearly 20 years of satellite observations of net primary productivity reveal the seasonal and yearlycycles of Earth’s vegetation. This image shows the net primary productivity during the month ofDecember 1999. More subtle vegetation patterns include a decrease in productivity at high latitudes ofthe Northern Hemisphere following the eruption of Mt. Pinatubo in 1991, and global-scale decreases inproductivity during El Niño events. (Image based on data provided by the University of MontanaNTSG)

THE EARTH OBSERVER • July/August 2003 Vol. 15, No. 4
31
1990s. For 100 years, there has been astrong relationship between El Niñoand the monsoon season that bringsrain to India and Southeast Asia; ElNiño events interrupt the monsoon andcreate drought. In the 1990s, thatrelationship broke down, and themonsoon rains came despite a severeand persistent El Niño.” As a result,while much of the globe saw a decreasein productivity during El Niño events,India was one of the places whereproductivity increased. Whether theregion can count on such a lucky breakthis decade can’t be predicted.
That unpredictability means that in alllikelihood, we shouldn’t be dismissingour worries about carbon dioxide in theatmosphere or congratulating ourselveson our green thumb just yet. “Humansclaim about half of all the net primaryproduction on Earth,” says Myneni.“Productivity may have increased 6percent in the last 18 years, but humanpopulation has increased by over 35
percent over that same time. One halfof a 6% increase in the net productivitycompared to a 35% increase in popula-tion means that these net primaryproductivity changes have not im-proved global habitability in anysignificant way.”
“This global study is a good founda-tion,” concludes Nemani. “It helps usdecide where on the globe we shouldlook more closely at what is happeningwith Earth’s vegetation. But as far asthe whole carbon cycle goes, this isonly part of the picture. We didn’t lookat how climate changes might haveinfluenced other ecosystem processesthat release carbon dioxide back intothe global system.” Warmer tempera-tures could increase the rate at whichsoil microbes decompose organicmatter and release carbon dioxide. Inthe tropics, lack of cloud cover mighttemporarily increase productivity untilthe increased evaporation caused by allthat extra sunlight makes water
availability more important. Productiv-ity could drop just as easily as it hasrisen. What this study does tell is that,so far, climate change is making theEarth’s vegetation more productive,but the impact is small compared tohow quickly the human population isgrowing. This knowledge could be akey piece of information for societiesaround the world as they cultivate theglobal garden through agriculture,natural resource management andenvironmental policy.
Global primary productivity has been rising since 1982. In contrast to the long-term upward trend, ElNiño years and the eruption of Mount Pinatubo occasionally decreased overall plant growth. (Graphbased on data provided by the University of Montana NTSG)

THE EARTH OBSERVER • July/August 2003 Vol. 15 No. 4
32
Earth Science Education Update— Ming-Ying Wei, [email protected], NASA Headquarters— Diane Schweizer, [email protected], NASA Headquarters— Theresa Schwerin, [email protected], Institute for Global Environmental Strategies
A REASoN to Focus on Earth Science
Education
NASA has selected 41 proposals inresponse to a cooperative agreementnotice known as "REASoN" - the"Research, Education, and ApplicationsSolutions Network." The selectedproposals will help us to understandand protect our home planet whileinspiring our next generation ofexplorers through the use of theagency's wide range of Earth scienceresources. Six of the selected proposalsare in Education:
Steven Ackerman, University ofWisconsin Madison, Satellite Observa-
tions in Science Education
Lin Chambers, NASA LangleyResearch Center, Extending NASA
Earth Science Data Use to the K-12 and
Citizen Scientist Communities
Liping Di, George Mason UniversityNASA EOS Higher-EducationAlliance, Mobilization of NASA EOS
Data and Information Through Web
Services and Knowledge Management
Technologies for Higher-Education
Teaching and Research
John Pickle, Boston Museum ofScience, Measuring Vegetation Health
Patricia Reiff, Rice University,Immersive Earth: Teaching Earth Science
by Fulldome Experiences and Hands-On
Exhibits
Glen Schuster, U.S. Satellite Labora-tory, Project VIEW (Virtual InteractiveEnvironmental Worlds)
These proposals will facilitate the useof NASA Earth science capabilities toensure scientific successes that servescientists studying Earth systemscience, decision-makers of federalagencies and other organizations, andsociety at large. A complete listing ofselected proposals is available on theInternet at research.hq.nasa.gov/code_y/
archive.cfm. Click on 2003 to find thefull REASoN Cooperative Agreementnotice (CAN) selection results.
NASA CONNECT™: Earth Science
Broadcasts In 2003-2004
NASA CONNECT™ is a research,inquiry, and standards-based series ofFREE integrated mathematics, science,and technology instructional educationprograms for students in grades 6-8.Each program has three components:(1) a 30-minute television broadcast,which can be viewed live or taped forlater use; (2) an educator guidedescribing a hands-on activity; and (3)an interactive web activity whichprovides educators an opportunity touse technology in the classroom setting.These three components — televisionbroadcast, educator guide, and webactivity — are designed as an inte-grated instructional package.
The following are Earth science-relatedshows planned for the 2003-2004
season. For more information, visitconnect.larc.nasa.gov
Virtual Earth
Starts airing: Thursday, October 16,2003
NASA researchers and scientists usedata analysis and measurement todevelop a scientific understanding ofthe Earth system and its response tonatural and human-induced changesto enable improved prediction ofclimate, weather, and naturalhazards for present and futuregenerations.
Mathematics concepts: Data Analysisand Measurement
Science concepts: Earth as a System
NASA Research: Earth System Science
The "A" Train Express
Starts airing: Thursday, May 20, 2004
Take a ride on the "A" Train Express.NASA researchers and scientists usesatellites and problem solving toimprove weather prediction and ourunderstanding of aerosols andclouds.
Mathematics concepts: ProblemSolving
Science concepts: Weather andMeteorology
NASA Research: CALIPSO Satellite,CloudSat Satellite
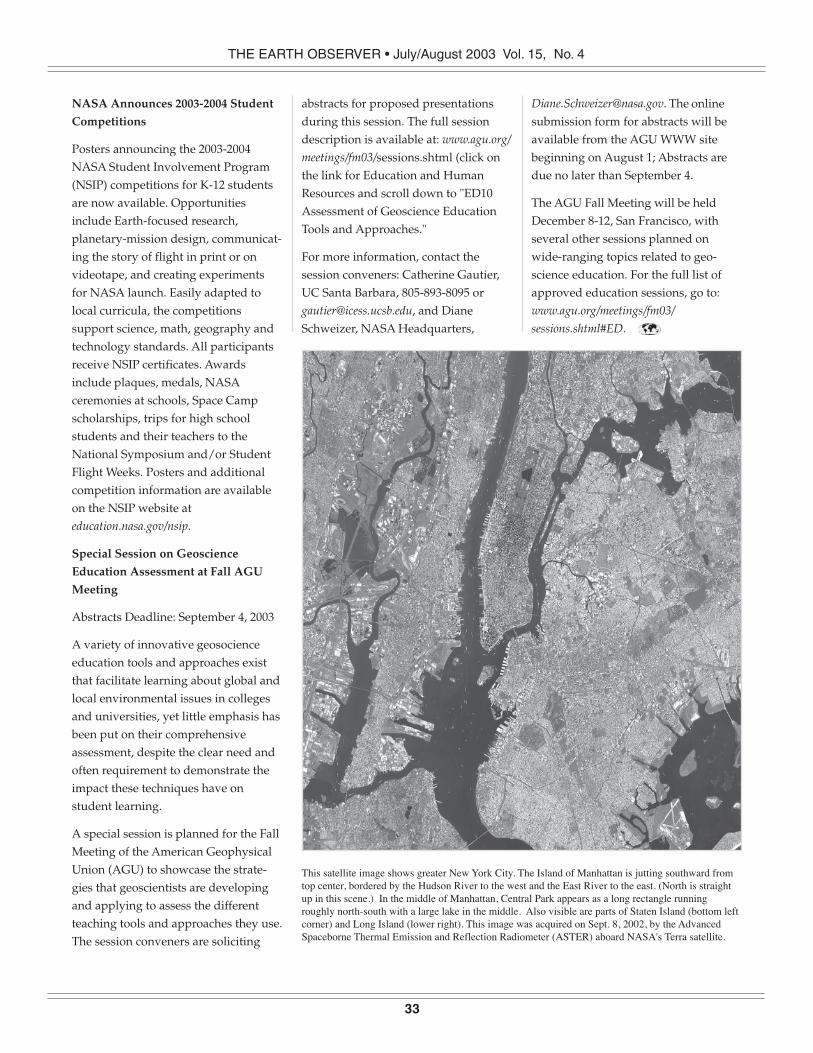
THE EARTH OBSERVER • July/August 2003 Vol. 15, No. 4
33
NASA Announces 2003-2004 Student
Competitions
Posters announcing the 2003-2004NASA Student Involvement Program(NSIP) competitions for K-12 studentsare now available. Opportunitiesinclude Earth-focused research,planetary-mission design, communicat-ing the story of flight in print or onvideotape, and creating experimentsfor NASA launch. Easily adapted tolocal curricula, the competitionssupport science, math, geography andtechnology standards. All participantsreceive NSIP certificates. Awardsinclude plaques, medals, NASAceremonies at schools, Space Campscholarships, trips for high schoolstudents and their teachers to theNational Symposium and/or StudentFlight Weeks. Posters and additionalcompetition information are availableon the NSIP website ateducation.nasa.gov/nsip.
Special Session on Geoscience
Education Assessment at Fall AGU
Meeting
Abstracts Deadline: September 4, 2003
A variety of innovative geosocienceeducation tools and approaches existthat facilitate learning about global andlocal environmental issues in collegesand universities, yet little emphasis hasbeen put on their comprehensiveassessment, despite the clear need andoften requirement to demonstrate theimpact these techniques have onstudent learning.
A special session is planned for the FallMeeting of the American GeophysicalUnion (AGU) to showcase the strate-gies that geoscientists are developingand applying to assess the differentteaching tools and approaches they use.The session conveners are soliciting
abstracts for proposed presentationsduring this session. The full sessiondescription is available at: www.agu.org/
meetings/fm03/sessions.shtml (click onthe link for Education and HumanResources and scroll down to "ED10Assessment of Geoscience EducationTools and Approaches."
For more information, contact thesession conveners: Catherine Gautier,UC Santa Barbara, 805-893-8095 [email protected], and DianeSchweizer, NASA Headquarters,
This satellite image shows greater New York City. The Island of Manhattan is jutting southward fromtop center, bordered by the Hudson River to the west and the East River to the east. (North is straightup in this scene.) In the middle of Manhattan, Central Park appears as a long rectangle runningroughly north-south with a large lake in the middle. Also visible are parts of Staten Island (bottom leftcorner) and Long Island (lower right). This image was acquired on Sept. 8, 2002, by the AdvancedSpaceborne Thermal Emission and Reflection Radiometer (ASTER) aboard NASA's Terra satellite.
[email protected]. The onlinesubmission form for abstracts will beavailable from the AGU WWW sitebeginning on August 1; Abstracts aredue no later than September 4.
The AGU Fall Meeting will be heldDecember 8-12, San Francisco, withseveral other sessions planned onwide-ranging topics related to geo-science education. For the full list ofapproved education sessions, go to:www.agu.org/meetings/fm03/
sessions.shtml#ED.
THE EARTH OBSERVER • July/August 2003 Vol. 15 No. 4
34
Special Announcement: AIRS Team
Member to Receive Award, August 2003.
It has recently been announced that Mitch
Goldberg and Gene Legg of the AIRS
Science Team and NOAA will be receiving
a Department of Commerce Gold Medal for
their work in providing AIRS/AMSU/HSB
data to the National Weather Service.
In Tropics, Forests Are Cool ButCroplands Are Hotter, Aug. 21, Der
Wissenschaft (Germany), NewsNow
(UK), A study of Santa Cruz, Bolivia, byLahouari Bounoua (NASA/GSFC) andRuth DeFries (University of MarylandCollege Park) using NASA satellitesand computer models, reported thatcutting down tropical forests andconverting grasslands to crops mayinadvertently warm those local areas.
El Niño’s Surprising Steady PacificRains Can Affect World Weather, Aug.20, Brightsurf.Com, Der Wissneschaft(Germany), Environment News Service
Sciencedaily Spaceref - Courtney
Schumacher and Robert Houze,(University of Washington) noticed ElNiño events produce more of a steadyrain in the middle of the Pacific Ocean.
U. of Colorado to Study Changes in
Earth’s Glacier Systems, Aug. 12,Brightsurf.com - Richard Armstrong
and researchers at the National Snowand Ice Data Center at the University of
Colorado at Boulder will receive $1.8million from NASA to compile anonline database of the world’s glaciers.
Researchers Find Antarctic Lake Water
Will Fizz Like a Soda, Aug. 12,Brightsurf.com - Chris McKay (NASA/Ames) said water released from LakeVostok, deep beneath the south polarice sheet, could gush like a popped canof soda if not contained, opening thelake to possible contamination.
How Cities Make Their Own Weather,August 11, TIME Magazine - Marshall
Shepherd (NASA/GSFC) is quoted inthis article about islands of urban heatand the effect they have on weather.
NASA Satellite Improves A Winter
Storm Forecast Looking At Ozone,Aug. 7, Brightsurf, Der Wissenschaft
(Germany), Spacedaily - Kun-Il Jang
and Xiaolei Zou (both of Florida StateUniversity) added ozone measure-ments from a NASA satellite intocomputer weather forecast models andimproved several factors in a forecastof a major winter snowstorm that hitthe United States in 2000.
Cooperation Earth: U.S. Hosts ‘Earth
Observation Summit, July 31, Christian
Science Monitor – Ghassem Asrar
(NASA HQ Office of Earth Science) isquoted in this article about a meeting of
representatives of 35 countries and 22multilateral organizations to start workon integrating systems to monitor theweather, oceans, land use and climatechange.
NASA Observations Indicate the First
Stage of Ozone Layer Recovery, July29, Atlanta Journal-Constitution,SpaceRef.com, Scientific American.com,ABC News, USA Today, National
Geographic.com, CNN, Nature.com,Environmental News Network, New
Scientist.com, Japan Times Online, New
York Post Online, and many other mediaoutlets - Mike Newchurch (Universityof Alabama) and Joe Zawodny (NASALaRC) discuss how data from HALOEon UARS, SAGE I and SAGE II providethe first evidence the rate of ozonedepletion in the Earth’s upper atmo-sphere is decreasing.
‘Potato’ Earth’s Deep Secrets, July 24,AP, BBCnews.com, DiscoveryChannel
.com - Michael Watkins, Victor
Zlotnicki and Lee-Lueng Fu (all NASAJPL), Byron Taplley (University ofTexas) were quoted in articles about theGRACE satellite producing the mostdetailed gravity map of the Earth, tohelp understand ocean movements.
Scientists Ponder Sun’s True Impact
on Earth’s Climate, July 24, ABCnews
.com, Christian Science Monitor - TheSun’s influence on changes in climatehas been a topic of hot debate amongphysicists, astronomers, and moreEarth-oriented climate researchers.Robert Cahalan (NASA/GSFC), Drew
Shindell (NASA/GISS) and Judith
Lean (U.S. Naval Research Lab) werequoted.
As World Swelters, Some Rare Cool
Spots, July 23, CNN, Reuters - With theworld sweltering through one of the
— Robert Gutro, [email protected],NASA Earth Science News Team

THE EARTH OBSERVER • July/August 2003 Vol. 15, No. 4
35
hottest years on record, some icybastions have been getting frostier indefiance of global warming. Joey
Comiso (NASA/GSFC) explained howwarmer oceans lead to more snow incolder areas.
NASA Earth Science Update: Cool
“Eyes” Above Help Track Hot Fires
Below, July 22, CBS Network News,Environment News Service, Voice of
America Radio, multiple televisionstations – Chris Justice (University ofMaryland), Vince Salomonson
(NASA/GSFC), and Tom Bobbe
(USDA Forest Service) were on a panel,broadcast on NASA-TV for the media,discussing NASA’s tools for firemonitoring moderated by MarshallShepherd (NASA HQ).
African Dust Brings Drought, Rain
Across Atlantic, July 15, Associated
Press - Dust from the Sahara Desert inAfrica may modify clouds and rainfallboth in Africa and across the tropicalNorth Atlantic as far away as Barbados,Natalie Mahowald (National Centerfor Atmospheric Research) and Lisa
Kiehl (University of California at Santa
Barbara) in their study using data fromNASA satellites, ground measure-ments, and computer models.
Satellites See Lightning Strikes inOzone’s Origins, July 14, SpaceflightNow, Associated Press, EnvironmentalNews Service, Spaceref.com – DavidEdwards (National Center for Atmo-spheric Research) and other NASA-funded scientists are using foursatellites to tell where low-level ozonepollution comes from and whether itwas manmade or natural.
Scientists Study Air 14 Miles out onChesapeake Light, July 12, TheVirginian-Pilot - NASA scientists findsuccess in the use of the ChesapeakeLight for validating readings from theAqua satellite.
NASA Satellites Help Track Crops inIowa, July 11, Associated Press – MarkWestgate of Iowa State University saidscientists are using images fromsatellites and airplanes to track thehealth of corn and soybean fields,predict yields and see whether pollenfrom biotech crops will contaminateother fields.
NASA Funds Research on Soft-Shell
Crabs, July 10, Durham Herald Sun - TheNational Science Foundation andNASA are supporting Jennifer Taylor’s
(University of North Carolina) researchto find out what keeps soft-shell crabsfrom collapsing when they shed theirshells.
NASA Designed Video Stabilizer
Used to Fight Crime, July 10, KTVT-TV
Dallas, TX and WTTG-TV, Washington,
DC – Paul Meyer (NASA/MSFC) wasinterviewed about his invention thatstabilized video for satellite imagery,now being used by law enforcementagencies.
NASA Research Helps Highlight
Lightning Safety Awareness Week,June 19, Environmental News Network,20 Television stations, 4 Newsradiostations - Dennis Boccippio, Steve
Goodman (both NASA/MSFC) wereinterviewed and quoted on television,radio, and websites on this story aboutNASA’s research on lightning.
The MODIS instrument onboard NASA’s Terraspacecraft captured this image of HurricaneIgnacio as it was bearing down on the southerntip of Baja.
At the time this image was taken, Ignacio waspacking winds near 105 mph, making it aCategory 2 storm on the Saffir-Simpson scale.On Monday, Aug. 25, 2003, the NationalHurricane center issued a warning that the stormcould produce 20 inches or more of rain to fall inthe southern baja region and said the rains couldcause “life-threatening” flash floods andmudslides.
Image courtesy Jeff Schmaltz, MODIS LandRapid Response Team at NASA GSFC

THE EARTH OBSERVER • July/August 2003 Vol. 15 No. 4
36
Getting to Know ESTO
— Philip Larkin, [email protected], ESTO Office, Goddard Space Flight Center
You may have heard the acronym
before. You may even know that ESTO
is located at Goddard Space Flight
Center. But, chances are, you may not
have a clear idea of what ESTO does.
ESTO, the Earth Science Technology
Office (Code 407), was created in 1998
to lead strategic technology develop-
ment and planning for the Earth
Science Enterprise. Although ESTO is
physically located at GSFC, it is a Level
2 office and performs an Earth Science
Enterprise headquarters function.
NASA’s first Earth Science Biennial
Review in 1997 recommended that
missions be implemented with shorter
development times using the best
available technologies. That recommen-
dation produced a dramatic shift in
process: science objectives, not mission
objectives, drive technology develop-
ment; technology, in turn, expands
mission horizons; and missions evolve
from the convergence of science
objectives and technology availability.
ESTO was established to develop and
nurture the technologies that drive this
new process.
Through flexible, science-driven
technology strategies and a competitive
selection process for highly specific
technologies, ESTO has developed a
broad portfolio of emerging technolo-
gies. Currently, ESTO is supporting the
development of 174 technologies at
over 50 institutions (universities,
corporations, and NASA centers)
nationwide. Many ESTO technologies
are being used in Earth Science
missions, as well as Code S and Code
M missions, and commercial applica-
tions to benefit society at large.
There are two primary areas of
technology development at ESTO:
Observation and Information. In each
of these, ESTO plans investments,
develops new technologies, and
identifies infusion paths for successful
deployments in future measurements.
The Instrument Incubator Program
(IIP) and Advanced Component
Technologies (ACT) program lead the
development of new and innovative
technologies that lead to smaller, more
powerful, less costly observation tools.
The Advanced Information Systems
Technology Program (AIST) and the
Computational Technologies Program
(CT) work toward a variety of goals
within information technologies. From
sensor web networking and on-board
processing to terabyte acquisition and
modeling interoperability, these two
programs make observations useful
and help to turn data into knowledge.
Technology requirements are derived
by ESTO in response to science
measurement goals. ESTO recently
developed a knowledge management
database, the Earth Science Integrated
Planning System (ESTIPS), to catalog
technology needs as well as communi-
cate the underlying science questions.
The database is available at:
esto.nasa.gov/estips
By identifying technology needs from
science requirements, regularly
assessing the maturity of technologies
within the portfolio, and leveraging
investments through creative partner-
ships, ESTO will continue to enable
future science applications far into the
21st century. To learn more about ESTO
and its programs go to: esto.nasa.gov

THE EARTH OBSERVER • July/August 2003 Vol. 15, No. 4
37
EOS Science Calendar Global Change Calendar
September 23 - 25
HDF & HDF-EOS Workshop VII , SilverSpring, MD. Call for abstracts. Contact:Richard Ullman, [email protected]. URL: hdfeos.gsfc.nasa.gov
September 23 - 25
CERES Science Team Meeting, Hampton,Va. Contact: Shannon Lynch,[email protected].
September 30 - October 3
Aura Science Team Meeting, Pasadena, CA.Contact: Anne Douglass, [email protected].
October 15
SEDAC User Working Group meeting,Montreal, Canada. Contact: Robert Chen,[email protected].
October 29-31
MODIS Science Team Meeting. BWI AirportMarriott. Contact: Barbara Conboy. Email:[email protected].
December 4-6
SORCE Science Meeting, Sonoma, CA.URL: lasp.colorado.edu/sorce/Dec03ScienceMeeting.html. Contact:Vanessa George,[email protected].
2003
September 8 - 10
Sixth Baiona Workshop on SignalProcessing in Communications, Baiona,Spain. Contact Carlos Mosquera, Email:[email protected], URL:www.baionaworkshop.org
September 23 - 26
Oceans ‘03, San Diego, CA. Contact: BrockRosenthal, Email: [email protected],Tel: (858) 454 4044, URL: www.o-vations.com.
November 10 - 14
30th International Symposium on RemoteSensing of Environment, Honolulu, HI.Email: [email protected], URL:www.symposia.org.
December 9-12
American Geophysical Union (AGU) SanFrancisco. E-mail: [email protected]: www.agu.org/meetings/fm03/
2004
January 11-15
American Meteorological Society AnnualMeeting, Seattle, WA. URL:www.ametsoc.org.
February 24-27, 2004
8th Specialist Meeting on MicrowaveRadiometry and Remote SensingApplications, Rome, Italy. URL:www.microrad04.org
March 22-23
Seventeenth Annual Towson University GISConference, Towson University, Baltimore,MD. Contact: Jay Morgan, Email:[email protected], URL:cgis.towson.edu/tugis2004
May 23-28
ASPRS Annual Conference, Denver, CO.URL: www.asprs.org/denver2004

Code 900National Aeronautics andSpace Administration
Goddard Space Flight CenterGreenbelt, Maryland 20771
Official BusinessPenalty For Private Use, $300.00
Printed on Recycled Paper
PRSRT STDPostage and Fees PaidNational Aeronautics andSpace AdministrationPermit G27
The Earth Observer
The Earth Observer is published by the EOS Project Science Office, Code 900, NASA Goddard Space Flight Center,Greenbelt, Maryland 20771, telephone (301) 614-5559, FAX (301) 614-6530, and is available on the World Wide Web ateos.nasa.gov/ or by writing to the above address. Articles, contributions to the meeting calendar, and suggestions arewelcomed. Contributions to the calendars should contain location, person to contact, telephone number, and e-mailaddress. To subscribe to The Earth Observer, or to change your mailing address, please call Hannelore Parrish at (301)867-2114, send message to [email protected], or write to the address above.
The Earth Observer Staff:
Executive Editor: Charlotte Griner ([email protected])Technical Editors: Bill Bandeen ([email protected])
Jim Closs ([email protected])Renny Greenstone ([email protected])Tim Suttles ([email protected])Alan Ward ([email protected])
Design and Production: Alex McClung ([email protected])Distribution: Hannelore Parrish ([email protected])