in the south queensland region alex banks queensland
TRANSCRIPT

VG211 Assessment of the fruit and vegetable industry situation and adoption of new technologies in the South Queensland region March 1995
Alex Banks Queensland Department of Primary Industries

VG211
This report is published by the Horticultural Research and Development Corporation to pass on information concerning horticultural research and development undertaken for the vegetable industry.
The research contained in this report was funded by the Horticultural Research and Development Corporation with the financial support of the Warren Cauliflower R&D Association.
All expressions of opinion are not to be regarded as expressing the opinion of the Horticultural Research and Development Corporation or any authority of the Australian Government.
The Corporation and the Australian Government accept no responsibility for any of the opinions or the accuracy of the information contained in this Report and readers should rely upon their own inquiries in making decisions concerning their own interests.
Cover Price $20.00
HRDC ISBN 1 86423 362 1
Published and Distributed by:
Horticultural Research and Development Corporation Level 6 7 Merriwa Street Gordon NSW 2072
Telephone: (02)9418 2200 Fax: (02) 9418 1352
© Copyright 1996

Contents
Parti Final Report Assessment of the fruit and vegetable industry situation and adoption of new teclinologies in the South Queensland region March 1995
Part II Survey of horticultural production in South Queensland January 1995

Parti Final Report Assessment of the fruit and vegetable industry situation and adoption of new technologies in the South Queensland region March 1995

INTRODUCTION
The Queensland Department of Primary Industries was approached by the Deciduous Sectional Group of Queensland Fruit and Vegetable Growers in 1992 to conduct a survey of horticultural production in south Queensland and especially on the Granite Belt. Accurate information regarding the size and value of horticultural industries in the region was needed by growers for appropriate decision making about those industries. Concern also existed about the amount of levies being collected to support research and promotion activities. This needed to be checked against the amount of production on which levies should have been collected. The Department also recognised the value of such information for their decision making when allocating staff and resources.
Current estimates being used by decision makers vary considerably depending on the source and date of information. Significant changes have occurred in most horticultural industries in the region in the last five years. These have been caused by changes in the nature of the grower community, consumer preferences, domestic and export market needs, prices for commodities and not least by drought conditions prevalent for the last three years. These factors make previous assessments of production unreliable.
MATERIALS and METHODS
Survey method
Manifests and records of transporters of horticultural produce within and out of the survey area were used as the primary source of data. Transporters included the four main commercial transport companies, rail and individual growers who transported their own and, in some cases, other grower's produce. In addition to these, information was obtained from several handlers of produce who supply customers outside of the region making use of transport passing through. Major roadside stalls who either grow their own produce or pick up produce directly from growers or produce handlers were also surveyed.
Crops covered
The list of crops covered is given in APPENDIX 1. Potatoes, carrots and onions were not included as they are normally grouped with agricultural production as heavy vegetables. No figures are presented for ornamental or cut flower production.

Production areas covered
The survey covered production areas on the Granite Belt and around Warwick as shown in the figure below.
Years covered
The survey covered two production years, 1992-1993 and 1993-1994. Analysis of harvest dates indicated that yearly horticultural production was best presented using a period from July to June (ie similar to a financial year).
Value of production
Value of horticultural production was derived by multiplying each crop's monthly production in standard cartons by a figure for the wholesale market value of that standard package in that month. Wholesale market value was calculated from average monthly figures for the Brisbane and Sydney wholesale markets over the three calendar years covered by the survey. In the case of Pome fruit, fruit sent to processors was valued using prices supplied by Golden Circle Cannery in Brisbane.
Reliability of information
The accuracy of information was reviewed by a panel which included DSGC members, local DPI staff and agri-business representatives.

RESULTS
The main findings of the survey were:-
• Total horticultural production (fruit and vegetables) amounted to 85,647 tonnes valued at $75 Million in 1993/94. This represents approximately 10% and 7% of Queensland's horticultural production and value of production annually.
• Both horticultural production and value of production are made up of fruit and vegetables at comparative proportions of 60% and 40% respectively.
• Pome fruit (Apples, Pears and Nashi) dominate fruit production followed by Stonefruit and Grapes.
• Tomatoes are the largest individual vegetable crop but as a group, Brassicas have greater production and value.
• In spite of drought conditions which have prevailed for over three years, horticultural production increased by 30% from 1992/93 to 1993/94, with significant increases in Pome and Stonefruit production and slight increases in most vegetable crops. Grape production decreased by 15% due to a decline in Table Grape production in favour of increased production of Wine Grapes. Tomato production decreased by nearly 50% over the two seasons of the survey.
• The value of horticultural production was relatively constant over the two seasons, reflecting static prices for produce.
• The majority of produce is sent to Brisbane, Sydney and Newcastle wholesale markets. Approximately 10% of produce is sold locally, much of it through roadside stalls while a still smaller amount is sent to Victoria. Significant amounts of produce are sold directly to stores especially in northern New South Wales.
• Pome (30%), Stonefruit (5%) and Grapes (nearly 50% into wine) were the only crops processed. The principle processor of Granite Belt produce is Golden Circle Cannery in Brisbane.

DISCUSSION
Extension/adoption by industry
A report was prepared and presented to the February meeting of the DSGC at Stanthorpe. It described the background to the project, the methods used to collect and present data and results of the survey. Copies of the report were also sent to participating transporters, growers and secondary fruit handlers and to agribusiness members of the review team. Copies of the report are being kept in the GBHRS Information Centre.
Directions for future activities
The DSGC and DPI recognise the value of such surveys but also the cost in time and resources to collect accurate and meaningful information. Discussions with DSGC looked at ways of updating the information while minimising costs. Similar surveys in other regions (eg Bundaberg) use a sub-sample of transporters and multiplying factors to give final figures. This approach needs to be investigated further for its suitability for this region. Such an approach may provide an appropriate mechanism given that a base line of information has now been set by this survey.

APPENDIX 1
CROPS SURVEYED, STANDARD PACKAGE SIZE & WEIGHT
Fruit Crops Included , Standard Package Weight (kg) Apple All varieties Apple and pear carton 19 Apricot T35 carton 10 Berries Raspberry, strawberry Tray of punnets 5 Cherry Box 5 Citrus All types Citrus box 9 Fig Tray 5 Table grapes Styrofoam box 10 Wine grapes Bin 1000 Nashi Tray 4 Nectarine Single layer tray 5 Peach Single layer tray 5 Pear Apple and pear carton 19 Plum T35 carton 10 Stonefruit Unidentified stonefruit T35 carton 10 Other fruit Unidentified fruit T35 carton 10
|||||i||iii||l||l Asparagus Box 1 Bean Box 10 Broccoli Styro icepack 8 Brusssel sprouts Stryo icepack 8 Cabbage Chinese, wombok 78 litre box 25 Capsicum Peppers and chillies T35 carton 10 Cauliflower 78 litre box 25 Celery 54 litre box 18 Corn Sweet corn Styrofoam box 8 Cucumber All types T35 carton 10 Eggplant 18 litre carton 6 Garlic Tray 5 Leek Leek, shallots, endive 78 litre box 17 Lettuce Iceberg, mignonette 58 litre carton 12 Mushroom Standard, oyster Mushroom box 4 Pea Snowpea, sugar snap Tray 10 Pumpkin All types Bin 1000 Rockmelon Honey dew, muskmelon 32 litre carton 18 Silverbeet 78 litre carton 17 Squash Button, scallopini T35 carton 10 Tomato Cherry, egg T35 carton 10 Watermelon Mini-melons Bin 1000 Zucchini T35 carton 10 Other vegetables Unidentified vegetables T35 carton 10

Part II Survey of horticultural production in South Queensland January 1995

SUMMARY
The amount and value of horticultural production on the Granite Belt and around Warwick was surveyed in 1994/95. The survey was conducted over two consecutive seasons primarily by accessing data from transport companies servicing the region and records of growers who transport their own or other grower's produce. The main findings of the survey were:-
• Total horticultural production (fruit and vegetables) amounted to 85.647 tonnes valued at $75 Million in 1993/94. This represents approximately 10% and 7% of Queensland's horticultural production and value of production annually.
• Both horticultural production and value of production are made up of fruit and vegetables at comparative proportions of 60% and 40% respectively.
• Pome fruit (Apples, Pears and Nashi) dominate fruit production followed by Stonefruit and Grapes.
• Tomatoes are the largest individual vegetable crop but as a group, Brassicas have greater production and value.
• In spite of drought conditions which have prevailed for over three_ years, horticultural production increased by 30% from 1992/93 to 1993/94, with significant increases in Pome and Stonefruit production and slight increases in most vegetable crops. Grape production decreased by 15% due to a decline in Table Grape production in favour of increased production of Wine Grapes. Tomato production decreased by nearly 50% over the two seasons of the survey.
• The value of horticultural production was relatively constant over the two seasons, reflecting static prices for produce.
• The majority of produce is sent to Brisbane. Sydney and Newcastle wholesale markets. Approximately 10% of produce is sold locally, much of it through roadside stalls while a still smaller amount is sent to Victoria. Significant amounts of produce are sold directly to stores especially in northern New South Wales.
• Pome (30%). Stonefruit (5%) and Grapes (nearly 50% into wine) were the only crops processed. The principle processor of Granite Belt produce is Golden Circle Cannery in Brisbane.

REASON FOR THIS SURVEY
Accurate information about fruit and vegetable industries in all areas has become a necessity for both government and the industries themselves. Increasingly, decisions regarding the future of industries are made on the basis of their value to the state's or local region's economy. If the information used is inaccurate or out of date, incorrect decision making can disadvantage an industry or a region.
Current estimates of horticultural production from the Granite Belt vary immensely depending on the source and date of the information. For example, figures for Apple production range from 21,000 tonnes1 to nearly 29,000 tonnes" for the same period. Significant changes have occurred in most horticultural industries in the region in the last five years. These have been caused by changes in the nature of the grower community, consumer preferences, domestic and export market needs, prices for commodities and not least by drought conditions prevalent for the last three years. These make previous assessments of production unreliable.
The information contained in this report will enable government and grower organisations as well as agribusiness servicing these areas to better target resources to promote the development of horticulture within the region.
EXTENT OF SURVEY
Crops included
The survey includes production figures on all horticultural crops growing in the region. A complete list of the crops appearing in the report is given in APPENDIX 1. Potatoes, carrots and onions were not included as they are normally grouped with agricultural production as heavy vegetables.
No figures are presented for ornamental or cut flower production.
' Source: GBHRS Annual Report 1991-1992 2 Source: AHC Hon Statistics Handbook 1994/95 Edition
1

METHOD OF DATA COLLECTION
Data sources
The main source of data was the records of transporters of horticultural produce within and out of the survey area. These included commercial transport companies, rail and individual growers who transported their own and, in some cases, other grower's produce. In addition to these, information was obtained from several handlers of produce who supply customers outside of the region by making use of transport passing through. Major roadside stalls who either grow their own produce, or pick up produce directly from growers or produce handlers were also surveyed.
A list of cooperators is included in APPENDIX 3.
Value of production
The value of horticulture in the region was derived by multiplying each crop's monthly production in standard cartons by a figure for the wholesale market value of that standard package in that month. Wholesale market value was calculated from average monthly figures for the Brisbane and Sydney wholesale markets over the three calendar years covered by the survey. Brisbane figures were provided by Market Information Services and for Sydney by NSW Agriculture's Flemington Market Reporting Service. In the case of Pome crops, fruit sent to processors was valued using prices supplied by Golden Circle Cannery in Brisbane.
Reliability of information
While every effort has been made to make the survey as accurate as possible, some level of inaccuracy is bound to occur. This happens through :-
• a failure to identify all sources of information that should be included
• the use of estimates rather than acmal records of produce handled
• the reluctance of identified sources to cooperate
• the same data being included from two (or more) sources
The accuracy of this survey is considered to be high because the majority of figures were obtained from actual manifests of the four main transport companies servicing the area. Queensland Rail and the main fruit handlers. Only three grower transporters did not have written records which necessitated reliance upon their memories and
3

• Where a crop has different varieties or types such as with lettuce (iceberg, mignonette) or cabbage (drum, Chinese, wombok), these have been grouped under their general crop heading.
ACKNOWLEDGMENTS
The author gratefully acknowledges the assistance of the following people and organisations.
• DSGC and HRDC for providing casual wages and operating funds to conduct the survey.
• DPI professional and administrative staff at GBHRS for their assistance to identify data sources, review survey results and publish the survey report.
• Halina Kruger for her diligence and energy in collecting and collating survey data.
• Members of the initial review team and the DSGC sub-committee appointed to review the data.
3

Table 1 Horticultural production
S21ii!!il3 jlliPjggjf mSSS 88KP Pome 1654234 31369 2076193 39403 Stonefruit 870603 5489 1353501 8391 Grapes 98442 1601 70337 1381 Other Fruit 30616 238 22732 168
Tomatoes 713689 7137 444167 4442 Brassieas 940899 16569 980304 17643 Lettuce 355741 4269 362849 4354 Cucurbits 222026 2429 169171 2588 Other Vegetables 737320 6693 790136 7277
TOTAL PRODUCTION 75795 85647
I Value of Fruit Production Value of Vegetable Production
1992-1993 1993-1994
Figure 2 Value of fruit and vegetable production

Table 2 Destination of fresh produce in 1993/94 (Numbers are standard packages)
* t* i->-nfl'^|fltf,ffirJr"fcr 'ini^^w^ffffilB^^^^fl^iyli^^iiiEMtfEifj^EBB :UjOi _;it
Fame 1282711 136224 7964 Stonefrtrit 1171380 118978 121 Grapes 62432 7905 0 Other Fruit 11523 11209 0 Tomatoes 369860 72083 2224 Brassicas 890258 83916 6138 Lettuce 294564 68285 0 Cucurbits 147847 21227 101 Other Vegetables 640609 146508 3019
Figure 4 Amount of fresh and processed produce
11

APPENDIX 1
CROPS SURVEYED, STANDARD PACKAGE SIZE & WEIGHT
Fruit Crops Included Standard Package Weight (kg) Apple All varieties Apple and pear carton 19 Apricot T35 carton 10 Berries Raspberry, strawberry Tray of punnets 5 Cherry Box 5 Citrus All types Citrus box 9 Fig Tray 5 Table grapes Styrofoam box 10 Wine grapes Bin 1000 Nashi Tray 4 Nectarine Single layer tray 5 Peach Single layer tray 5 Pear Apple and pear carton 19 Plum T35 carton 10 Stonefruit Unidentified stonefruit T55 carton 10 Other fruit Unidentified fruit T35 carton 10 Vegetables Asparagus Box 1 Bean Box 10 Broccoli Styro icepack 8 Brusssel sprouts Stryo icepack 8 Cabbage Chinese, wombok 78 litre box 25 Capsicum Peppers and chillies T35 carton 10 Cauliflower 78 litre box 25 Celery 54 litre box 18 Corn Sweet corn Styrofoam box 8 Cucumber All types T35 carton 10 Eggplant 18 litre carton 6 Garlic Tray 5 Leek Leek, shallots, endive 78 litre box 17 Lettuce Iceberg, mignonette 58 litre carton 12 Mushroom Standard, oyster Mushroom box 4 Pea Snowpea. sugar snap Tray 10 Pumpkin All types Bin 1000 Rockmelon Honevdew, muskmelon 32 litre carton 18 Silverbeet 7S litre carton 17 Squash Button, scallopini T35 carton 10 Tomato Cherry, egg T35 carton 10 Watermelon Mini-melons Bin 1000 Zucchini T35 carton 10 Other vegetables Unidentified vegetables T35 carton 10
13

APPENDIX 4
DETAILED MAJOR CROP SHEETS
Information is presented on individual crops whose annual production exceeds 200 tonnes and/or whose annual value of production is greater than $1 Million. This information includes:-
• Monthly production of each crop in standard packages.
• Total yearly production in standard packages.
• Monthly price received per standard package. These figures are an average between Brisbane and Sydney wholesale market prices.
• Annual value of production.
Crops are listed alphabetically with fruit crops appearing first followed by vegetable crops.
15

APRICOT
© © ©
a
July Aug Sept Oct Nov Dec Jan Feb Mar Apr May June
40
35
30
s 2 5 £
«20
10
0
PRICE 1993-1994
-o
Value of Production 1992-1993 $497,972 1993-1994 $596,996,
July Aug Sept Oct Nov Dec Jan Feb Mar Apr May June
17

200
150
100
50
0 6
NECTARINE
PRODUCTION
1992-1993 -o-1993-1994
( Yearly Production I (Trays) ' 1992-1993 281,781 (1993-1994 441,392
July Aug Sept Oct Nov Dec Jan Feb Mar Apr May June
30
25
20
PRICE 1992-1993 1993-1994
fvalue of Production \ 1992-1993 $2.6Million 1993-1994 $4.3Million
July Aug Sept Oct Nov Dec Jan Feb Mar Apr May June
19

50
40
5 30 o V5
S3 2 0
u
PEAR
PRODUCTION
1992-1993 -a-1993-1994
Yearly Production (Cartons)
July Aug Sept Oct Nov Dec Jan Feb Mar Apr May June
30
25
20
0
PRICE
1992-1993 1993-1994
['Value of Production 1992-1993 $757,506 1993-1994 $1.2Million
July Aug Sept Oct Nov Dec Jan Feb Mar Apr May June
21

20
15
o o ©
310
o
BEAN
PRODUCTION
1992-1993 1993-1994
Yearly Production ̂ (Boxes)
1992-1993 29,578 1993-1994 26,512
July Aug Sept Oct Nov Dec Jan Feb Mar Apr May June
0
PRICE
1993-1994
^Value of Production 1992-1993 $483,531
,1993-1994 $418,989
July Aug Sept Oct Nov Dec Jan Feb Mar Apr May June
23

CABBAGE
July Aug Sept Oct Nov Dec Jan Feb Mar Apr May June
20
15
0
PRICE
1992-1993 1993-1994
(Value of Production ^ i 1992-1993 $2.5Million 11993-1994 $3.1Million
July Aug Sept Oct Nov Dec Jan Feb Mar Apr May June
25

50
0
CAULIFLOWER
PRODUCTION
1992-1993 -a-1993-1994
Yearly Production (Boxes)
1992-1993 257,122 ,1993-1994 257,948
July Aug Sept Oct Nov Dec Jan Feb Mar Apr May June
30
25
20
0
PRICE
1992-1993 1993-1994
[ Value of Production 11992-1993 $2.8Million ^1993-1994 $3.0Million
July Aug Sept Oct Nov Dec Jan Feb Mar Apr May June
27

30
25
20 o © ©
C/5
s
u
15
10
0 6
CUCUMBER
PRODUCTION
1992-1993 -a-1993-1994
Yearly Production ̂ (Boxes)
j1992-1993 52,382 y!993-1994
July Aug Sept Oct Nov Dec Jan Feb Mar Apr May June
20
0
PRICE
Value of Production 1992-1993 $439,883
vl993-1994 $208,038
July Aug Sept Oct Nov Dec Jan Feb Mar Apr May June
29

200
150
© o o
W
VI = o S3 U
100
50
LETTUCE
PRODUCTION
1992-1993 -a-1993-1994
(Yearly Production (Boxes)
1992-1993 355,741 1993-1994 362,849
July Aug Sept Oct Nov Dec Jan Feb Mar Apr May June
20
15
0
PRICE
1992-1993 1993-1994
I Value of Production x
1992-1993 $2.9Million 1993-1994 $2.8MilIion
July Aug Sept Oct Nov Dec Jan Feb Mar Apr May June
31
10
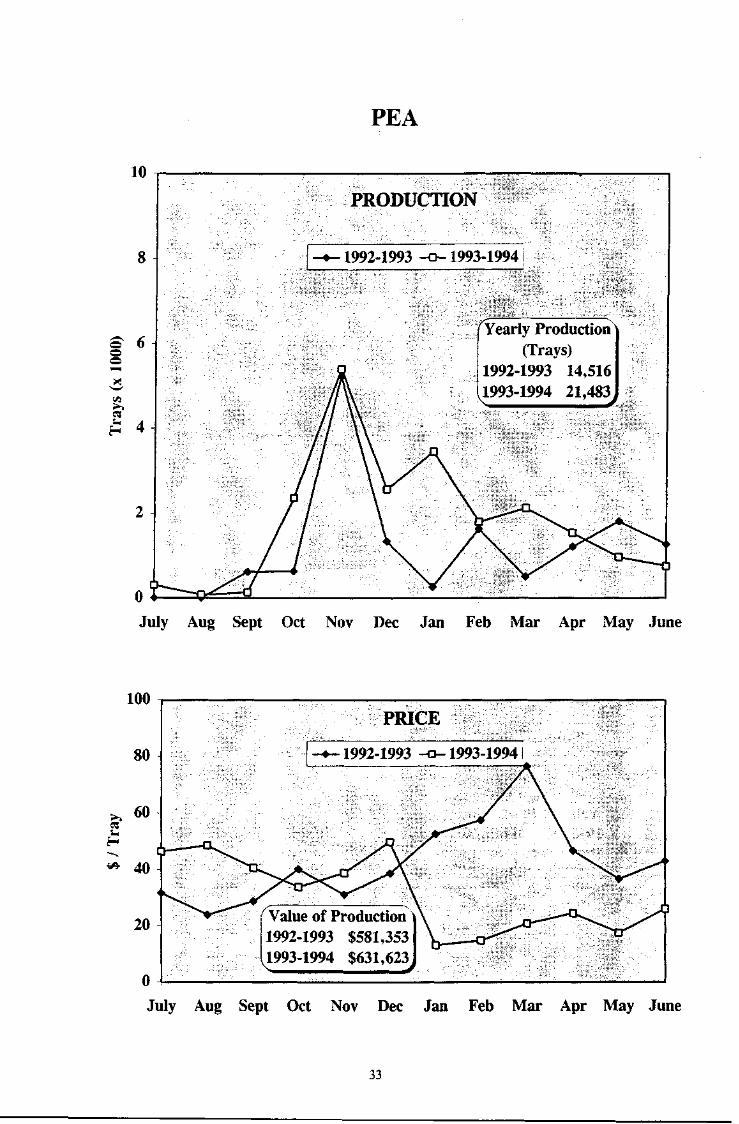
PEA
PRODUCTION
1992-1993 -a-1993-1994
Yearly Productionx
(Trays) 1992-1993 14,516 1993-1994 21,483
July Aug Sept Oct Nov Dec Jan Feb Mar Apr May June
100
0
PRICE
P*-1992-1993 -a-1993-1994
Value of Productionx
1992-1993 $581,353 1993-1994 $631,623
July Aug Sept Oct Nov Dec Jan Feb Mar Apr May June
33

TOMATO
300
250
200 o o o
w in C
«
150
100
50
PRODUCTION
1992-1993 -o-1993-1994
Yearly Production x
(Cartons) 1992-1993 713,689 1993-1994 444,167
July Aug Sept Oct Nov Dec Jan Feb Mar Apr May June
20
0
PRICE
1992-1993 1993-1994 i
' Value of Production 1992-1993 $6.8Million 1993-1994 $4.8Million
July Aug Sept Oct Nov Dec Jan Feb Mar Apr May June
35

APPENDIX 5
PRODUCTION AND VALUE OF MINOR CROPS
Crop Package Production Value of Production
Crop Package 1992-1993 1993-1994 1992-1993 1993-1994 Berries Cartons 10,772 11,043 $296,486 $218,799 Cherry Boxes 1,036 1,623 $ 26.289 $ 38.482 Citrus Boxes 916 58 $ 10,628 $ 733 Fig Trays 2,620 890 $ 29.379 $ 8.890 Nashi Trays 4,077 2,946 S 37.995 $ 23.682 Other Fruit Cartons 16,308 10,741 $520,037 $233,061 Asparagus Boxes 39,356 46,302 $192,647 $222,916 Brussel sprouts Icepacks 21,573 15,333 $438,076 $177,910 Corn Styro boxes 479 185 $ 4.325 $ 928 Eggplant Cartons 2,449 9,890 $ 17.949 $ 43,468 Garlic Trays 257 155 $ 5.111 $ 2.315 Pumpkin Bins 66 178 $ 20.232 $ 37.567 Rockmelon Cartons 9,653 10,072 $119,909 $ 90.039 Squash Cartons 21,967 12,199 $257,403 $190,560 Watermelon Bins 67 646 $ 16.060 $135,810 Other vegetables Cartons 94,740 53,794 $876,372 $606,775
37