1. 2 presentation to “mine to mill” research trip alex beavers queensland treasury
TRANSCRIPT

1
2
Presentation to “Mine to Mill” Research Trip
Alex BeaversQueensland Treasury
3
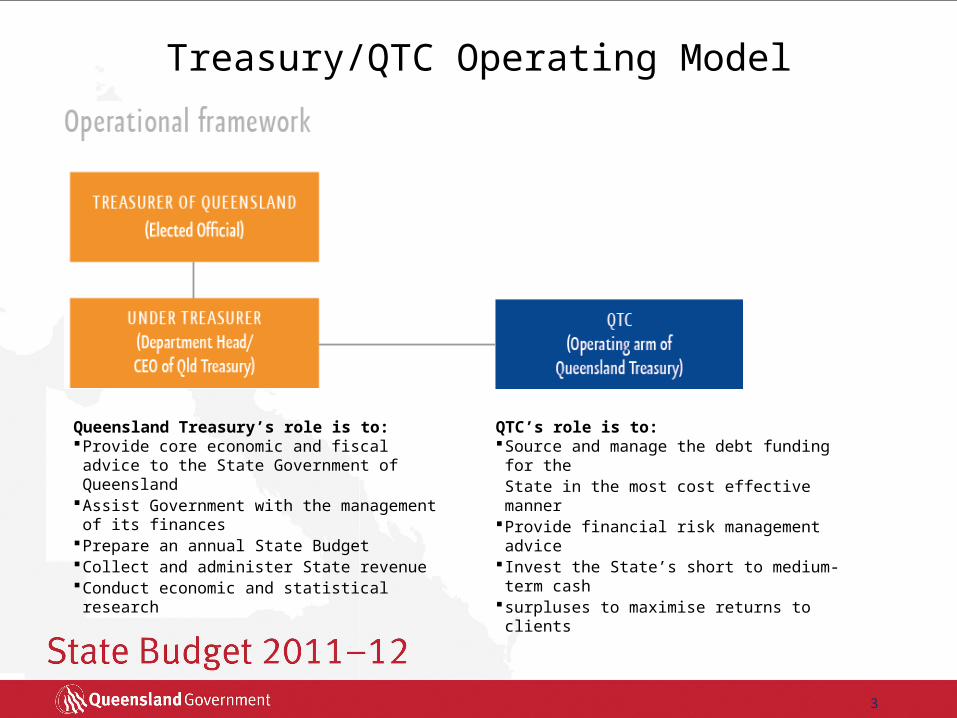
Treasury/QTC Operating Model
Queensland Treasury’s role is to:Provide core economic and fiscal advice to the State
Government of QueenslandAssist Government with the management of its financesPrepare an annual State BudgetCollect and administer State revenueConduct economic and statistical research
QTC’s role is to:Source and manage the debt funding for the
State in the most cost effective mannerProvide financial risk management advice Invest the State’s short to medium-term cashsurpluses to maximise returns to clients

4
Economic growth comparison1
(annual % change)
1CVM, 2008-09 reference year. 2010-11 is estimated actual. 2011-12 to 2012-13 are forecasts. 2013-14 to 2014-15 are projections.Sources: Queensland Treasury, Australian Treasury and ABS 5206.0.
Despite natural disasters in 2010-11, growth to surge beyond trend in 2011-12 and 2012-13…
-4
-2
0
2
4
6
8
10
1978-79 1984-85 1990-91 1996-97 2002-03 2008-09 2014-15
Queensland Australia
Australian 1980s recession
Australian 1990s recession
Housing boom
Mining boom
Global financial
crisis
Queensland disasters
5
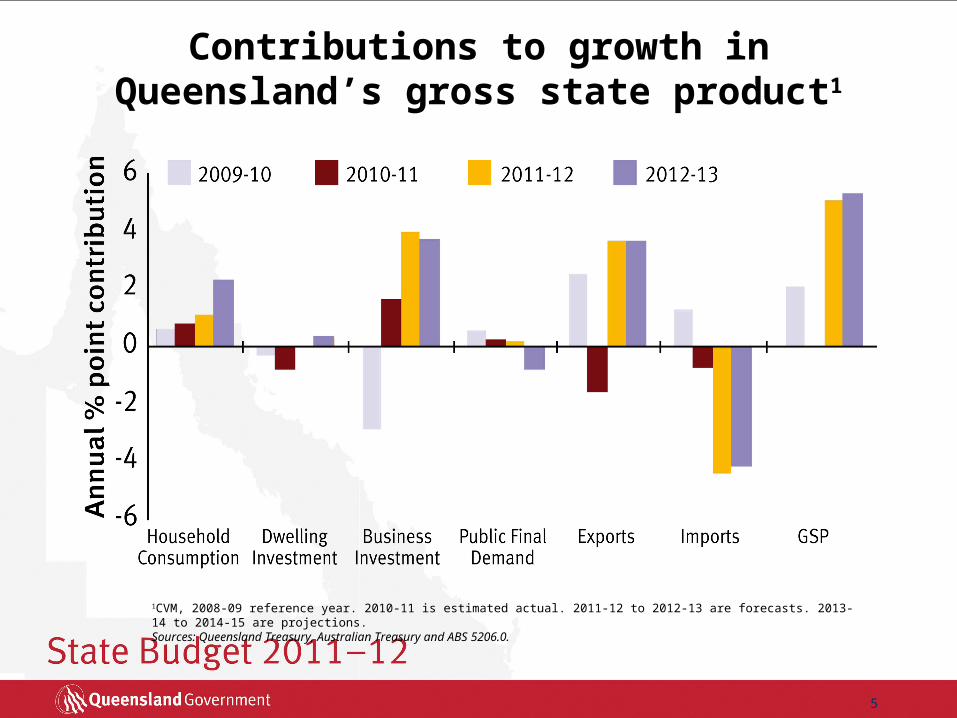
1CVM, 2008-09 reference year. 2010-11 is estimated actual. 2011-12 to 2012-13 are forecasts. 2013-14 to 2014-15 are projections.Sources: Queensland Treasury, Australian Treasury and ABS 5206.0.
Contributions to growth in Queensland’s gross state product1
6
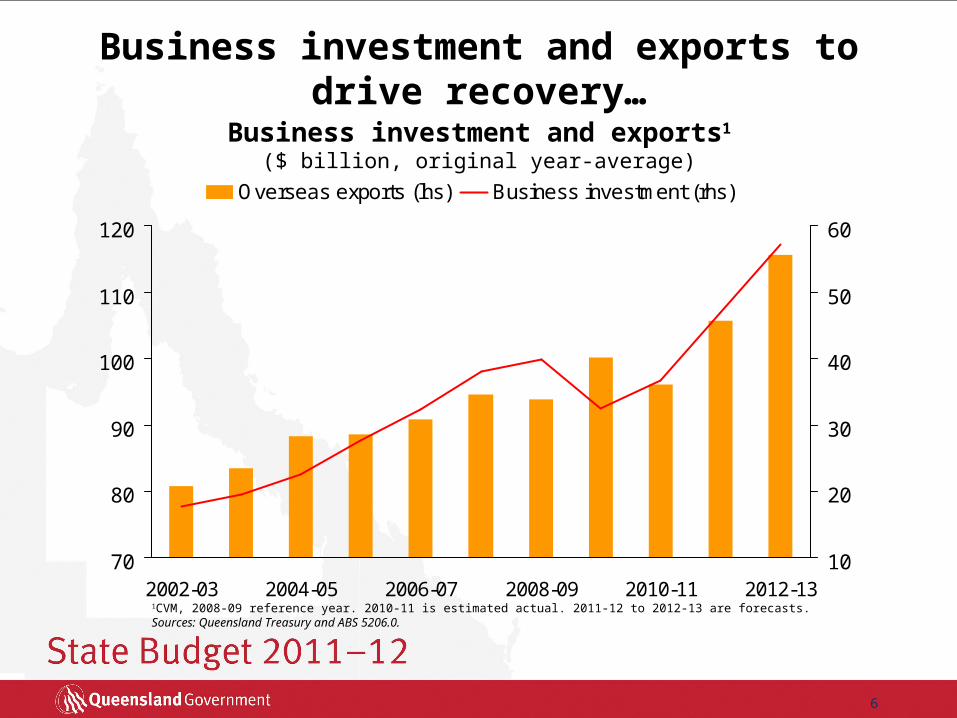
1CVM, 2008-09 reference year. 2010-11 is estimated actual. 2011-12 to 2012-13 are forecasts. Sources: Queensland Treasury and ABS 5206.0.
Business investment and exports to drive recovery…
70
80
90
100
110
120
2002-03 2004-05 2006-07 2008-09 2010-11 2012-1310
20
30
40
50
60
Overseas exports (lhs) Business investment (rhs)
Business investment and exports1
($ billion, original year-average)
7
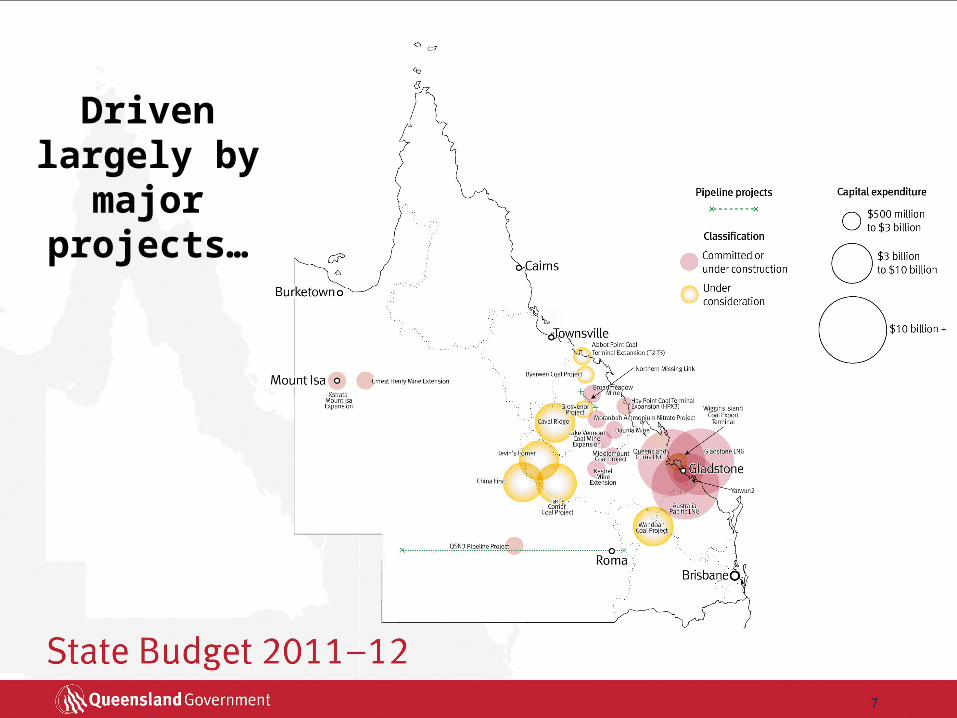
Driven largely by major
projects…

8
Responding to stronger demand from our major trading partners
Sources: International Monetary Fund, Consensus Economics and Queensland Treasury.
Major trading partner growth (annual % change)
9
State’s Role and Strategy
• State is a facilitator, not a funder of these projects.• These projects are declared “significant” which allows for
coordinated and streamlined assessments and approvals.
• Private sector delivers and/or funds bulk of associated infrastructure requirements.
• Consistent with Queensland asset sales program strategy.

10
Source: Queensland Treasury.
Lower capital spend and borrowings each year
0
2,000
4,000
6,000
8,000
10,000
12,000
14,000
2011-12 2012-13 2013-14 2014-15
$M
Capital Purchases Net Borrowings

QTC Borrowing Program 2011-12Investor Presentation, July 2011Richard Jackson: General Manager, Funding and Markets

12
QTC – Operational framework
Queensland Treasury’s role is to: Provide core economic and fiscal advice to the
State Government of Queensland Assist Government with the management of its
finances Prepare an annual State Budget Collect and administer State revenue Conduct economic and statistical research
QTC’s role is to: Source and manage the debt funding for the
State in the most cost effective manner Provide financial risk management advice Invest the State’s short to medium-term
cash surpluses to maximise returns to clients
13
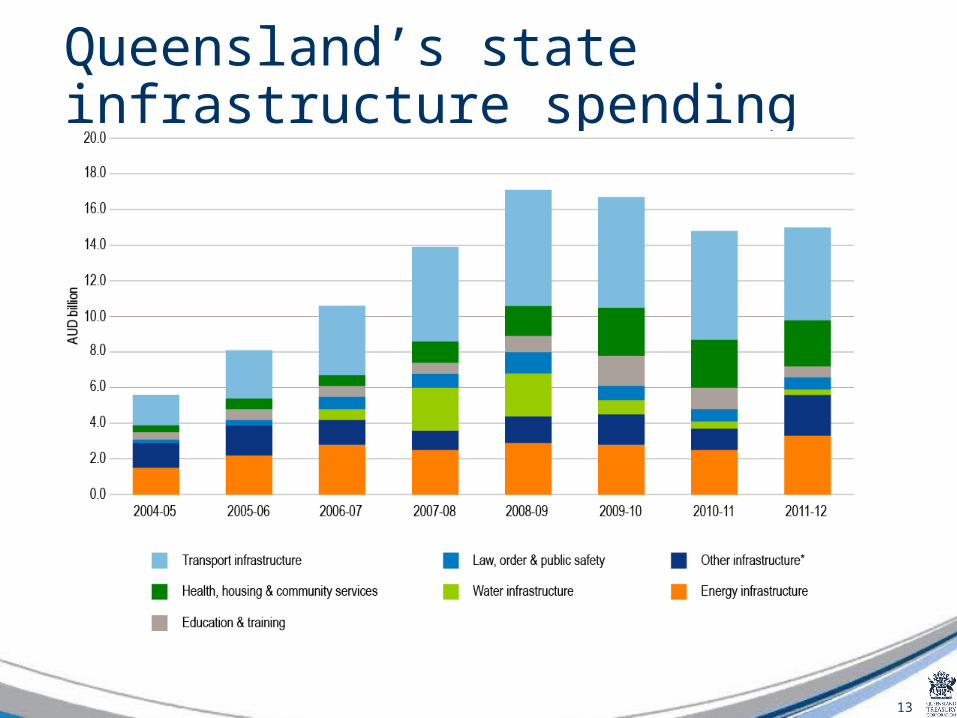
Queensland’s state infrastructure spending

14
Funding Sources, (as at 30 June 2011)
Onshore 55%
Offshore 45%
By investor location
By facility
* Includes Euro CP (2%), Euro MTN (1%), AUD CIB (1%), Other Domestic
(Public, private( (1%), USCP (1%))
AUD Benchmark Bonds 59%
AUD AGG Global Bonds 3%
CP*6%
AUD T-Notes4%
AUD AGG Domestic Bonds28%

15
Strength of Credit
Full Queensland State Government Guarantee (AA+/Aa1)
Australian Government Support– 50% of revenue sourced from Australian Government– Australian Govt guarantee (AAA/Aaa) during crisis– Disaster Support
Fund Queensland public sector capital works– ‘Government to Government’

16
Strength of Product
Focus on AUD benchmark bonds– Significant volumes on issue– Choice of maturity
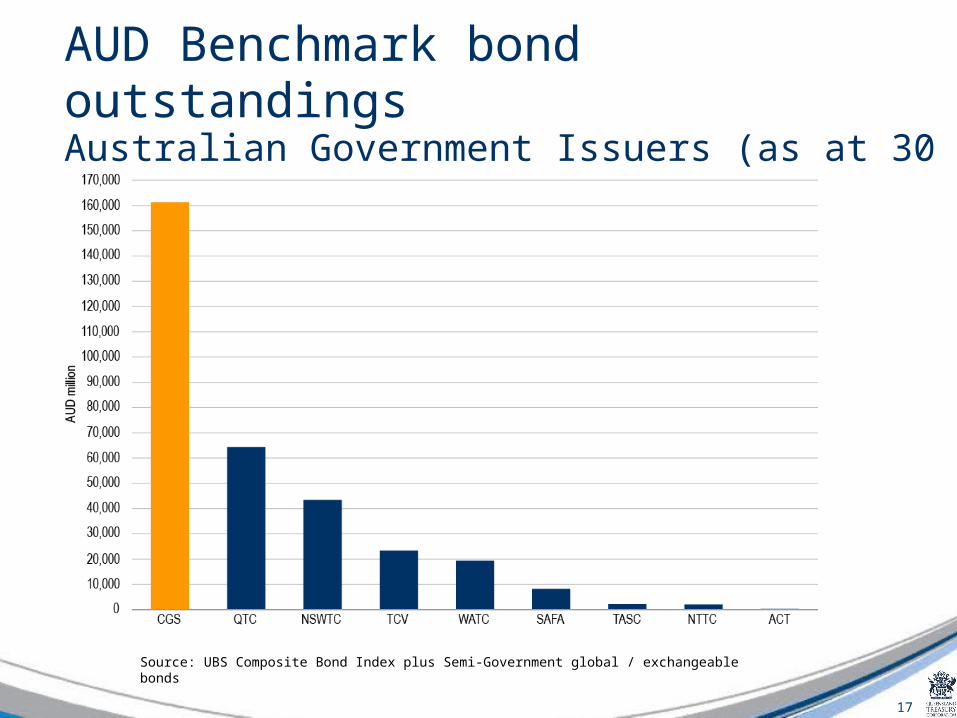
17
AUD Benchmark bond outstandings Australian Government Issuers (as at 30 June 2011)
Source: UBS Composite Bond Index plus Semi-Government global / exchangeable bonds

18
QTC AUD Benchmark bondsOutstandings by maturity as at 30 June 2011
* **** *
* Issued 2010-11
19
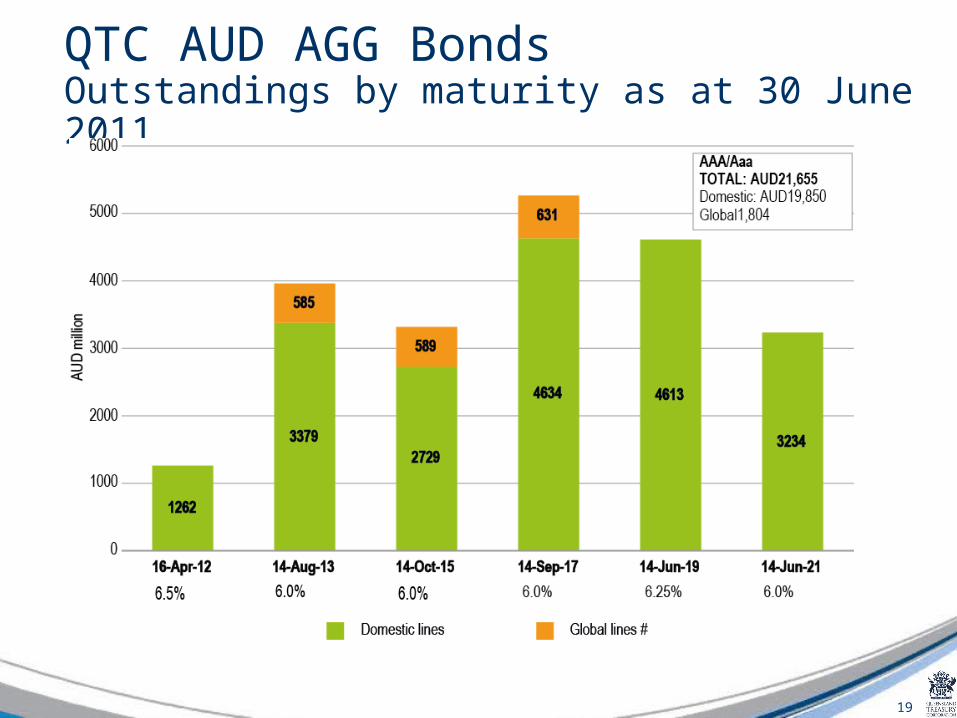
QTC AUD AGG BondsOutstandings by maturity as at 30 June 2011

20
Strength of Product
Focus on AUD benchmark bonds– Significant volumes on issue– Choice of maturity
Dedicated primary & secondary market dealer panel

21
Strength of Product
Focus on AUD benchmark bonds– Significant volumes on issue– Choice of maturity
Dedicated primary & secondary market dealer panel
Attractive yield pickup
22
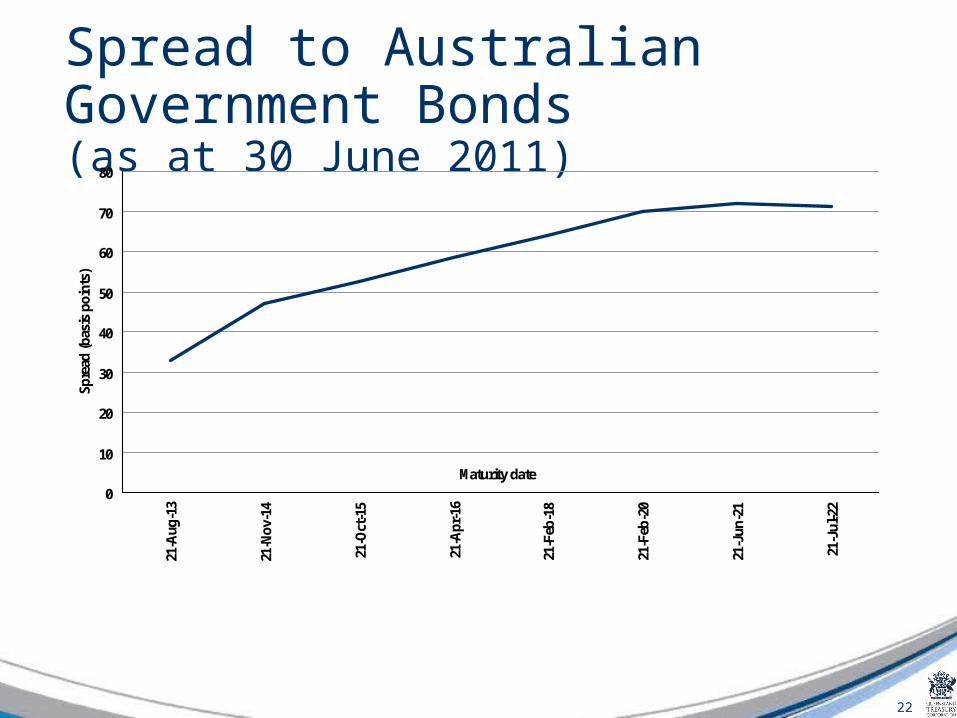
Spread to Australian Government Bonds(as at 30 June 2011)
0
10
20
30
40
50
60
70
8021
-Aug
-13
21-N
ov-1
4
21-O
ct-1
5
21-A
pr-1
6
21-F
eb-1
8
21-F
eb-2
0
21-J
un-2
1
21-J
ul-2
2
Maturity date
Spre
ad (b
asis
poi
nts)
23
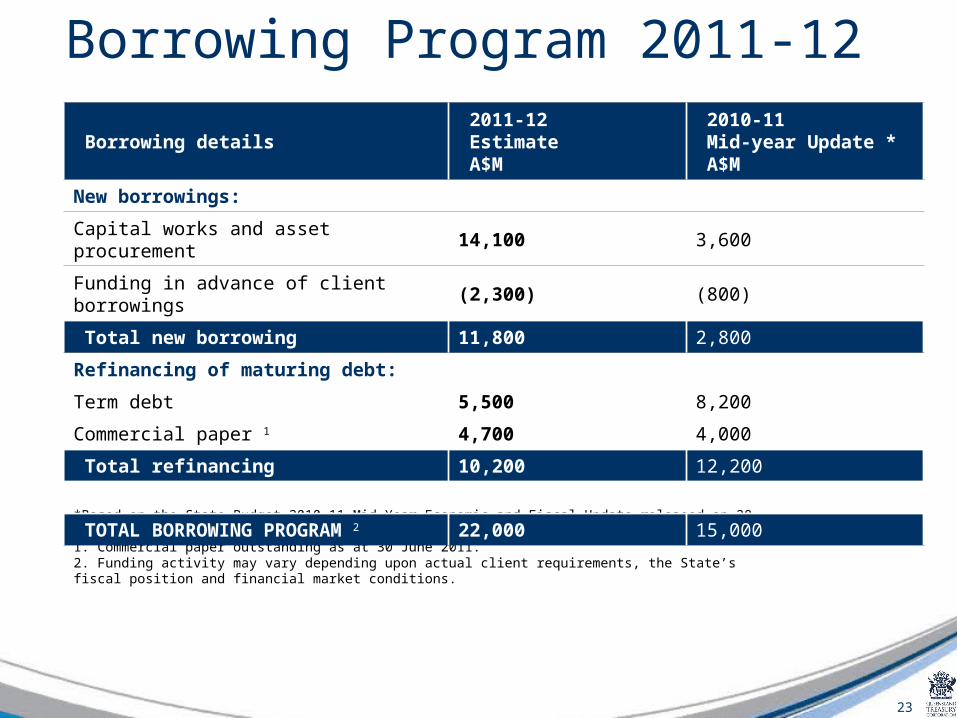
Borrowing Program 2011-12
*Based on the State Budget 2010-11 Mid-Year Economic and Fiscal Update released on 28 January 2011.1. Commercial paper outstanding as at 30 June 2011.2. Funding activity may vary depending upon actual client requirements, the State’s fiscal position and financial market conditions.
Borrowing details 2011-12 Estimate A$M
2010-11 Mid-year Update * A$M
New borrowings:
Capital works and asset procurement 14,100 3,600
Funding in advance of client borrowings (2,300) (800)
Total new borrowing 11,800 2,800
Refinancing of maturing debt:
Term debt 5,500 8,200
Commercial paper 1 4,700 4,000
Total refinancing 10,200 12,200
TOTAL BORROWING PROGRAM 2 22,000 15,000
24
Key Points
Central Financing Authority for the State of Qld– ‘Government to Government’– Aa1/ AA+
Large Benchmark Bond Lines– Fixed Interest Distribution Group (17)– Favourable yield pick up
25
Key Points
2011-12 Borrowing Program– AUD 22 billion– Including 2017 and 2019 new benchmarks

26