in-situ testing for site characterization & qa/qc for deep
TRANSCRIPT

Study
In-Situ Testing for Site Characterization & QA/QC for Deep Dynamic Compaction
Cone penetration testing, as well as dilatometer and instrumented dilatometer testing, are useful tools for quality assurance and control on in-situ densification projects.
HEATHER J. MILLER, EDWARD L. HAJDUK, KEVIN P. STETSON, JEAN BENOIT & PETER J. CONNORS
The Massachusetts Highway Department (MassHighway) relocated a section of U.S. Route 44 between Route 58
in Carver and U.S. Route 3 in Plymouth in southeastern Massachusetts. The new roadway section is a four-lane divided highway that replaces the former two-lane highway. The study described herein was conducted at a section where mechanically stabilized earth (MSE) walls were constructed through former pond and cranberry bog areas. Prior to con-
struction, the native site stratigraphy consisted of standing water and/ or peat deposits of varying thickness that extend in depth up to a maximum of about 9.1 meters (30 feet). Glacial outwash deposits consisting of loose to dense, coarse to fine sands with lenses of silt, clay and gravel were encountered beneath the peat. A detailed description of site conditions prior to construction was prepared by MassHighway1 and a comprehensive study of the engineering properties of the peat is provided by Paikowsky et al.2
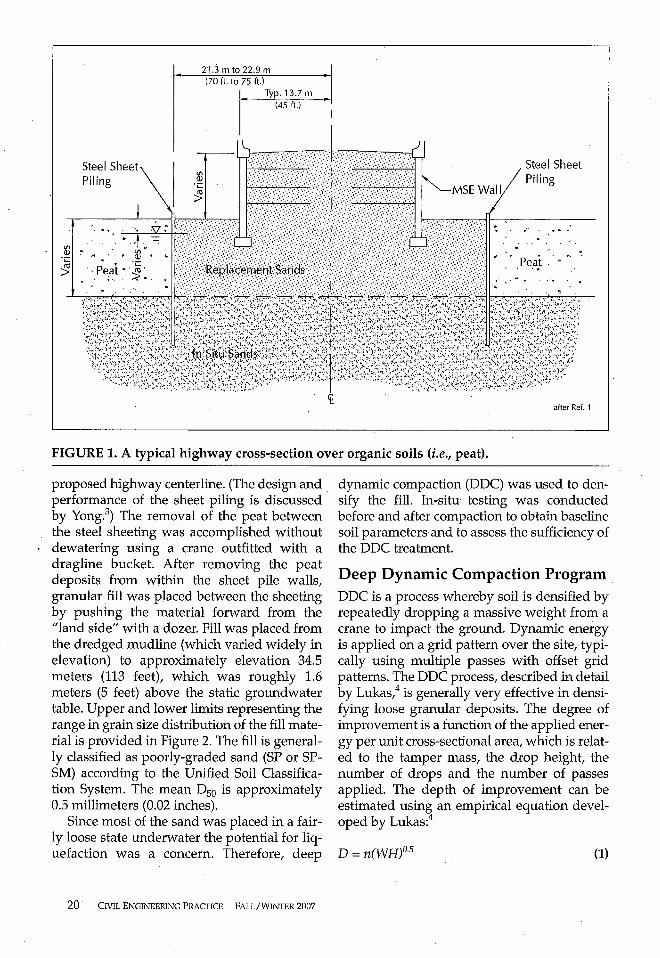
Due to right-of-way considerations that severely restricted the space available for the roadway and environmental concerns regarding the remaining cranberry bog sections, traditional sloped earth embankments could not be used. Therefore, an innovative design incorporating sheet piling and MSE walls was used at the cranberry bog crossings. A typical cross-section of this design is presented in Figure 1.
The construction project started with the installation of steel sheet piling through the pond/bog sections. The sheeting was located about 21.3 to 22.9 meters (70 to 75 feet) off the
CIVIL ENGINEERING PRACTICE FALL/WINTER 2007 19
21 .:i m to 22.9 m (70 ft. to 75 ft.)
Ty . 13.7 m (45 ft.)
Steel Sheet Piling ~ t)/Y/<t>t//N/i.H}t?><?:Lkt
~ .·.::.-::_·i/_: .. \:':._.·:·_·:_·:\·: -1 · _.-:),::_'.\>\:.:_: _. _:.-<-._. MSE Wal I
Steel Sheet Piling
~------'-~----lh-,-,~.,..,,..,~ 1--~-----~
Peat
after Ref. 1
FIGURE 1. A typical highway cross-section over organic soils (i.e., peat).
proposed highway centerline. (The design and _ performance of the sheet piling is discussed by Yong.3
) The removal of the peat between the steel sheeting was accomplished without dewatering using a crane outfitted with a dragline bucket. After removing the peat deposits from within the sheet pile walls, granular fill was placed between the sheeting by pushing the material forward from the "land side" with a dozer. Fill was placed from. the dredged mudline (which varied widely in elevation) to approximately elevation 34.5 meters (113 feet), which was roughly 1.6 meters (5 feet) above the static groundwater table. Upper and lower limits representing the range in grain size distribution of the fill material is provided in Figure 2. The fill is generally classified as poorly-graded sand (SP or SPSM) according to the Unified Soil Classification System. The mean D50 is approximately 0.5 millimeters (0.02 inches).
Since most of the sand was placed in a fairly loose state underwater the potential for liquefaction was a concern. Therefore, deep
20 CIVIL ENGINEERING PRACTICE FALL/WINTER 2007
dynamic compaction (DDC) was used to densify the fill. In-situ testing was conducted before and after compaction to obtain baseline soil parameters and to assess the sufficiency of the DDC treatment.
Deep Dynamic Compaction Program _ DDC is a process whereby soil is densified by repeatedly dropping a massive weight from a crane to impact the ground. Dynamic energy is applied on a grid pattern over the site, typically using multiple passes with offset grid patterns. The DDC process, described in detail by Lukas,4 is generally very effective in densifying loose granular deposits. The degree of improvement is a function of the applied energy per unit cross-sectional area, which is related to the tamper mass, the drop height, the number of drops and the number of passes applied. The depth of improvement can be estimated using an empirical equation developed by Lukas:4
D=n(WH)°-5 (1)

Sand Gravel
Coarse I I Silt & Clay
Medium Fine
Sieve No. #4 #30 #40 #60 #IO0 #200 100
90
80
70
~
60 'if. ~
00 C: 50 'iii rd
Q. 40
30
20
10
0
10 #4 #10 #30 #40 #60 #'I 00 0. l #200 0.01
Particle Diameter (mm)
FIGURE 2. Grain size distribution of backfill material.
where: D = depth of improvement in meters; W = mass of tamper in megagrams; H = drop height in meters; and, n = empirical coefficient (for pervious
soil deposits with a high degree of saturation, a value of 0.5 is recommended; for semi-pervious soils with a high degree of saturation, a value of 0.35 to 0.4 is recommended)
According to Lukas,4 the maximum improvement resulting from DDC is likely to occur within the zone from about one-third to one-half of the depth, D, calculated using Equation 1.
The DDC planned for this project consisted of two passes over the site. In-situ testing was conducted to evaluate the effectiveness of the DDC, with data collected prior to DDC and after the initial two passes of DDC. A third pass of DDC was applied to any areas where
the initial compaction was not deemed sufficient. The layout for each pass consisted of a square pattern with a spacing of 4.6 meters (15 feet). The second pass was offset within the center spacing of. the first pass. A typical DDC layout for the project is presented in Figure 3. At each grid point location, a maximum of nine drops were applied, with less drops applied if the depth of the crater exceeded approximately 1.52 meters (5 feet). In some instances, the number· of drops applied and/ or the .drop heights were reduced in response to the lateral movement of the sheet pile walls and/ or sand boils that occurred over portions of the site.
The DDC was conducted using a tamper· weight of 13.15 tonnes (14.5 toris). The tamper was a six-sided lead weight with an approximate diameter of 1.52 meters (5 feet) and a height of 0.90 meters (35 inches). Drop heights varied with distance from the roadway center-
CIVIL ENGINEERING PRACTICE FALL/WINTER 2007 21

----21.3-22.9 Jin----....
(70-75 ft.) DDC Drop Weight Location (1st Pass)
Cranberry Bog
4.6 m (15.0 ft.) Typ. DDC Drop Weight
Location (2nd Pass)
@ ® @
0 0 2.3 m (7.5 ft.) Typ.
4.6 m. (15.0 ft.) Typ. ® ® @,@ e ® oo m.ooo
,t® ®l®@ @.® o.·. c.·~· Q .o
" @ @,@ @
Cranberry Bog
Sheet Piling I <i,
,_ __ 18.3 m (60 ft.) _ _,..., Drop Height
9.1 m (30 ft.) Drop Height
FIGURE 3. A typical DDC layout pattern.
line. From the roadway centerline to 11.4 meters (37.5 feet) from the roadway centerline, the DDC drop height was 18.3 meters (60 feet). From a distance of 13.7 meters (45 feet) from the roadway centerline and beyond, the drop height was reduced to 9.1 meters (30 feet). The decrease in drop height was implemented to reduce the lateral stresses on the sheet piling from the DDC.
In-Situ Testing Program An extensive in-situ testing program was carried out prior to design and construction that included soil borings with standard penetration testing.1 Additional testing was conducted to provide baseline conditions of the backfill and to assess the degree of compaction resulting from the DDC. For quality control (QC) purposes, MassHighway elected to use cone penetration testing as a means of establishing ground improvement criterion. Construction specifications required an initial round of piezocone penetration testing
22 CIVIL ENGINEERING PRACTICE FALL/WINTER 2007
9.1 m (30 ft.) Drop Height
From Ref 5.
(CPTU) to be conducted prior to DDC, and a verification phase of CPTU after two passes of DDC.6 In addition, seismic cone penetration testing (SCPT) was also conducted to collect soil shear wave velocities (V5).
Supplemental in-situ testing was also conducted before and after DDC under a research contract between MassHighway and· UMassDartmouth (UMD). This testing included standard penetration testing (SPT), drive cone penetration testing (DCPT), cone penetration testing (CPTU and SCPT), dilatometer testing (DMT) and instrumented dilatometer testing (IDMT). Extensive details regarding that research project are described by Miller et al.7
'8
and by Benoit and Stetson.9 The results of CPTU, DMT and IDMT conducted at this site are presented below.
Cone Penetration Testing. The cone penetrometer consists of a steel probe with a conical tip that is pushed at a rate of 2 centimeters (0.8 inches) per second into the soil in accordance with ASTM D5778.10 Cone penetrome-

ters with a 15-square-centimeter ( 6-squareinch) projected tip area and a 225-square-centimeter (89-square-inch) friction sleeve were used throughout the testing. A porous piezoelement saturated in silicon oil is located behind the tip and detects in-situ penetration pore pressure during cone advancement.
The CPTlJ data acquisition system records the cone penetration resistance (qc) and the local sleeve friction (f5). Typically, CPTU tip resistance values are adjusted to account for porewater pressure effects due to unequal end areas, and the "corrected" values are
· expressed as qt. From that information, the friction ratio (FR) can be calculated as the local sleeve friction divided by the corrected tip resistance (f /qt), which is typically expressed as a percentage.
CPTU is beneficial in obtaining continuous profiles that provide information concerning soil stratification and variation in soil properties. Under the MassHighway construction specifications, the criterion for ground improvement was based on {:Orrected CPTU tip resistance (qt) values. The increase of CPTU tip resistance has been widely used to monitor the densification effect of various ground improvement techniques.11 Although· the use of shear wave velocities measured during SCPT has gained increased use for determining the degree of ground improvement, specifically the resistance to liquefaction, 12 it was not used as a quality control (QC) indicator for this project.
Dilatometer Testing. The dilatometer, introduced by Marchetti,13 consists of a stainless steel blade 95 millimeters (3.75 inches) wide and 15 millimeters (0.6 inches) thick with a 20-degree apex. On one face of the blade is a circular flexible steel membrane 60 millimeters (2.4 inches) in diameter. For this project, the dilatometer tests were carried out according to the ASTM D6635-0l.14 The dilatometer probe was hydraulically pushed into the ground at a rate of about 2 centimeters per second (0.8 inches per second). At typical test intervals of 15 to 30 centimeters (6 to 12 inches), the penetration was stopped and the membrane expanded against the soil. Three pressure readings (A, B and C) were recorded during a test and then corrected for membrane stiffness (P 0,
P1 and P2, respectively). P0 is the pressure corresponding to the initial movement of the membrane, P1 is the pressure at a displacement of 1.1 millimeters (0.04 inches) into the soil and P 2 is the pressure at which the membrane recontacts the body of the probe upon deflation. From the corrected pressures, Marchetti introduced the dilatometer indices Iv (material index), Kv (horizontal stress index) and Ev (dilatometer modulus), which can be used to empirically obtain various soil properties.
The dilatometer has been previously used in monitoring ground improvement by various means including DDC. Schmertmann et al. and Marchetti et al. suggest that since most densification work is aimed at reducing settlement, the constrained modulus from the dilatometer is a better indicator of improvement than relative density.15
'16 The constrained modulus
(MvMT) is empirically calculated using the dilatometer indices Iv, Kv and Ev. Consequently, this modulus inherently takes into account stress history and the state of stress. Their studies have also shown that increases in MvMT are often twice that observed using qc from the cone penetration test. In addition, settlement calculations based on the MvMT have been in good agreement with observed settlements. The horizontal stress index (Kv) is also a good indicator of improvement as densification translates into an increase in the lateral stress coefficient.
Instrumented Dilatometer Testing. One of the innovative field methods used in this testing program was a specially designed instrumented dilatometer. A standard flat dilatometer was modified at the University of New Hampshire in an effort to better understand the mechanics and soil response durin~ expansion of the dilatometer membrane.1
IDMT allows for continuous measurement of the membrane displacement during the test, the pore pressure during insertion and testing, and the total pressure applied to the inside of the blade. These modifications were implemented without impacting the original blade design. Other similar probes have been previously designed and built for field testing and for use in calibration chambers.18
-22
The testing procedure used for IDMT was essentially the same as for DMT, with the
CIVIL ENGINEERING PRACTICE FALL/WINTER 2007 23

qt (tsf) qt (tsf) qt (tsf) q I (tsf) 0 100 200 300 400 0 100 200 300 400 0 100 200 300 400 0 100 200 300 400
35 35 35 I I
I I
I I
34 34 __ I __ I ___ 34 I
I I ,--
I I 110 I I
I I 33 I I
33 33 -1----1--- --1----1---I I I
I I I
I I I
I 32 I I 105 32 32 --;--- - - r -;- - -
E I I ~
I I I i I I I
'; 31 I I
31 I 31 r--7--- --7--- C
0 I I I I 100 .,g 'i I I I I I I I I I I I I I (,::
[i 30 .L __ J ___
30 _L __ J ___ . ___ L __ .J ___ 30 -- __ l_ ____ j ___ > I I I I I I I I CIJ i::i:i I I I I I I I i::i:i I I I I I I I I
I I I I I I I I I
29 1----cl--- 29 ---1----1--- ~- -1- - - 29 ---1----1--- 95 I I I I I I ... , I I I .... I -:--t- ....
28 I I 28
,, I 28 r---,--- -r--,---I I I I I I
90 I I
27 I I 27 27 r--7---I
26 26 26 0 10 20 30 40 0 10 20 30 40 0 10 20 30 40 0 10 20 30 40
qt (MPa) qt (MPa) qt (MPa) qt (MPa) STA 158+00 C STA 158+00 W STA 159+00 E STA 159+00W
From Ref. 5
FIGURE 4. Typical Initial and Verification CPTU results.
exception of the unload-reload loop. For each test, an unload-reload loop was conducted at a membrane displacement of approximately 0.6 millimeters (0.02 inches). The rate of pressurization was designed to reach the A-reading within 30 to 60 seconds, with the rate decreasing when approaching the A-reading to improve resolution at lift-off. For the remainder of the test, the pressure rate was kept nearly constant. To keep test times approximately constant, the average pressure rates during loading for the pre-compaction and post-compaction profiles were 350 and 950 kilopascals (51 and 138 pounds per square inch) per minute, respectively. The final unloading rates were similar to the loading rates.
QC Criteria. The ground improvement criterion was set as the minimum corrected tip resistance (q1) value that would prevent liquefaction of the backfill between the sheet piling due to the design earthquake. These minimum q1 values were established using the procedures developed at the 1996 NCEER and 1998
24 CIVIL ENGINEERING PRACTICE FALL/WINTER 2007
NCEER/NSF Workshops on Evaluation of Liquefaction Resistance of Soils and outlined by Youd et al.23 The design earthquake for the project has a 2 percent probability of exceedance in fifty years (i.e., a 2,475 return period). According to the liquefaction analysis, the minimum required corrected tip resistance ranged between 5.75 to 7.66 MPa (60 to 80 tsf).
The CPTU program for this project was planned for two major phases: Initial and Verification. The first testing phase (i.e., Initial) was conducted prior to the start of DDC and would determine if the placed fill would require any ground improvement and, if so, it would serve as a baseline for the subsequent testing. The next testing phase (i.e., Verification I), was conducted after completion of the initial round (two passes) of DDC. If the backfill did not meet the required minimum q1 criteria, then the areas not meeting the criteria would have additional rounds of DDC and CPTU until the established criteria were met.

Several small sections did not meet the established qt criteria in the Verification I phase. Therefore, a third pass of DDC and subsequent CPTU, labeled as Verification II, were performed in those areas.
In-Situ Test Results. In general, the CPTU locations for the QC program were spaced 30.5 meters (100 feet) apart along the centerline of the new roadway. At even station numbers, CPTU soundings were conducted at the centerline and in the eastbound (right offset) and westbound (left offset) lanes at distances of 18.3 meters (60 feet) where appropriate. At odd station numbers, CPTU soundings were conducted along the eastbound and westbound lanes at distances of 15.2 meters (50 feet) where appropriate. In certain instances, additional CPTU soundings were conducted at the centerline at odd station numbers. Every fifth CPTU sounding had shear wave measurements conducted at 1-meter (3.3-foot) depth intervals. A detailed summary of the CPTU and SCPT results is presented by Hajduk et al. 5 Analysis of the corrected tip resistance results showed that, with the exception of a few areas, DDC improved the soil so that the minimum corrected tip resistance of 7.66 MPa (80 ts£) was achieved within the placed fill. Typical qt results from the Initial and Verification I testing phases are presented in Figure 4. In that figure, it should be noted that "outside DDC" refers to CPTU soundings that were conducted between the sheet piling and the outermost DDC drop point locations.
As part of the research contract between MassHighway and UMass-Dartmouth, extensive testing was performed between Stations 156+00 and 159+00 to enable the comparison of different in-situ test results. A total of twenty-three dilatometer profiles were conducted on four separate sessions. Testing included fifteen profiles using the standard Marchetti flat dilatometer and eight profiles using the instrumented dilatometer. Figure 5 shows typical profiles of corrected pressures P 0, P 1 and P2 for DMT-102 and DMT-104, conducted prior to DDC near the sheeting at Station 156+00 and near the highway centerline at Station 159+00, respectively. It should be noted that for most of the DMT soundings, the fill from the ground surface to a depth of
about 1.52 meters (5 feet) was pre-bored with a hollow stem auger and then the DMT soundings were initiated at a depth of about 1.83 meters (6 feet). This modification was done to avoid damage to the dilatometer blade, since the upper fill material was fairly dense as a result of construction traffic through the area and it also contained some gravel.
Below elevation 28 meters (92 feet), profile DMT-104 shows a dramatic decrease in P1 and an increase in P2 (above hydrostatic conditions), indicating that a 1.22- to 1.52-meter (4-to 5-foot) layer of soft organic material was left in place prior to filling that area. The material above elevation 30.8 meters (101 feet) appears to be stiffer at DMT-104 than at DMT-102. This increased stiffness is likely due to the heavy construction traffic that occurred along the centerline during and after the filling operations. Although the two profiles are approximately 91 meters (300 feet) apart, the results (excluding the deeper soft layer and the upper compacted zone) seem to show that the filling process was minimally variable, especially with respect to P0.
Profiles of pre-DDC CPTU data from approximately the same location as DMT-104 (Station 159+00, centerline) are shown in Figure 6. The influence of the heavy construction traffic along the centerline is clearly reflected in the high CPTU qt values within the upper 3.05 meters (10 feet) of fill. Just below elevation 28 meters (92 feet), the drop in tip resistance and increases in pore pressure and friction ratio also suggest that a 1.22- to 1.52-meter (4- to 5-foot) layer of soft organic material was present below that elevation, just as in DMT-104.
Figure 7 shows two typical corrected pressure-displacement curves for instrumented dilatometer profile IDMT-104, also conducted prior to DDC near the highway centerline at Station 159+00. Test IDMT-104 at elevation 30.14 meters (99 feet) was carried out within the hydraulic sand fill, while test IDMT-104 at elevation 26.36 meters (86.49 feet) was carried out within the zone of soft organic material that had been left in place prior to backfilling. These IDMT test curves are corrected for membrane stiffness. The pressure-displace-
CIVIL ENGINEERING PRACTICE FALL/WINTER 2007 25

0 5
35
34
33
32
-E 31 -C: Q .:
30 ~ > QJ
I.I.I
29
28
27
26
25
0 200
P0
, P1 & P2 (ksf)
10 15 20
Pre-DDC Measurements
DMT-102 P0
----- DMT-102 P1
----- DMT-102 P2
--•■-- D1\t\T-1 04 Po DMl~I 04 P1
DMT-104 P1
' ' ' ' ' ' I I I I
25
- - - - - - - - - - - - - ..,_ - - - - - - -- - - - - J_ - - -- - - - - - - - - J - - - - - -- - - - - - -
' ' ' : : I
: ! ' ' ' ' t I J l - --:---- ---------:--- -- -- -- ----:----- -- ------1- -- ------ -- --
: : l : ' ' ' ! : : ' ' ' - ---- ------'--- -- -- -- - --- .J_ ---- -- -- -- -- .J_ -- - --- -- -- --
' ' ' ' ' ' ' ' ' ' ' ' ' ' ' ' ' ' ' ' ' ' ' ' ' ' ' -- - - - - - - - - J_ - - - - - - - - - - - - J_ - - - - - - - - - - - - J - - - - - - - - - - - - -
! : : 1 : :
' ' __________ J _______ . _____ J ----' ' ' ' ' -:~---+-:---~---· i
--------i- ------- ---:;,;:--_;'.;~-;.-;;.---------~-------------:------- -- -- --' ' ' ' :
i
110
105
100
95
90
85
400 600 800 1000 1200
FIGURE 5. Corrected Po, P1 and P2 for DMT-102 and DMT-104.
-,i= -C: Q
'i > ~ I.I.I
ment curves are similar in appearance to selfboring pressuremeter curves. As the internal pressure approaches the lateral stress in the ground, the membrane starts lifting off. Because of soil disturbance due to blade penetration, excess pore water pressures are generated in the soft organic zone, leading to a substantial increase in lateral stress. That increase in lateral stress is reflected by the significantly higher lift-off pressure shown in Figure 7 for
the test at elevation 26.36 meters (86.49 feet). The response for the test in the soft zone is relatively flat following the unload-reload and actually shows a decrease in pressure with increasing displacement as the membrane stiffness becomes a significant component of the total pressure.
26 CIVIL ENGINEERING PRACTICE FALL/WINTER 2007
It should be noted that MassHighway conducted additional soil borings at Station 159+00 (as well as at other locations) that confirmed

qt (tsf) U2 (tsf) Rf(%)
0 200 400 0 2 4 6 0 4 8 12 36
I I
35 I I I I I 115 - I --1--1 -1--1--
I I I I I I I I
34 I I I I I - I - - - - I - I - -1- - I
I I I I I 110 I I I I I I I I I I
33 ;...l __ l __ L_J. __ 1 __ .I __ I __ L _ J. __ I __
I I I I I I I I I I I I I I I I I I I I I I I I I I I I I I
32 - ..l - _J_ - L - J. - _1_ - ,l __ 1 __ L - ..1. - -1- - 105 - I I I I I I I I I
~ _§, I I I I I I I I I I I I I I I I I I I I I I I -31 - -1- - -1- - --J - - + - - - --1- - -1- - !- - -+ - -1- - .+--1--!---+-:_I-- C
C I I I I I I I I I I I I Q Q I I I I I I I I I I I 100 'i I I I I I I I I I I I I 'i 30 --1---1---1--r-- i" - -1- - I- - -t - -1- - -1- - I- - -t - -1 > > ~ I I I I I I I I I I I I ~ i!i i!i I I I I I I I I I I I I
I I I I I I I I I I I I 29 - -1- - 7- --r- -T- - - ,.- -,--r- 7--1-- -1- - r - T - -1 95
I I I I I I I I I I I I I I I I I I
I I I I I 28 1 - -1- - r - T - -,- -
90 27
26 85
25 0 10 20 30 40 50 0 0.2 0.4 0.6 0 4 8 12
qt (MPA) U2 (MPA) Rf(%)
FIGURE 6. Pre-DDC CPTU results near the centerline at Station 159+00.
that isolated pockets of organic material (i.e., peat) had been left in place during the initial dredging and backfilling operations. It was decided to remove the granular fill at those locations, excavate the peat and then replace the granular fill prior to commencing the DDC program. That work was completed during the fall of 2002, and additional baseline in-situ testing was conducted in those "re-muck" areas during December 2002 and January 2003.
DMT and IDMT test profiles were carried out following DDC to assess the effects of DDC on various parameters. Figure 8 shows two IDMT tests carried out at approximately the same depth, before and after DDC. The pressure-displacement test curves clearly depict the improvement from DDC. The improvement is reflected in terms of higher lift-off and, thus, increased horizontal stress (or K), as well as an increase in stiffness as indicated by the significantly larger pressure
required to reach 1.1 millimeter (0.04 inch) expansion. Increases in lateral stress have also been reported bi others using DMT for QA/QC of DDC.1
,14 An enlarged view of the
unload-reload loops for each of those two tests is shown in Figure 9 (on page 30). A straight line between the start of reloading and the loop closure is used to calculate the unload~ reload modulus. It should be noted that the test curves in Figure 8 show every five data points recorded, while the unload-reload loops in Figure 9 show every data point. Also, in Figure 9, the data for IDMT-102 and IDMT-202 are plotted on the left-hand and righthand axes, respectively.
Figure 10 (on page 31) shows unload-reload modulus values for IDMT soundings IDMT-102, IDMT-202 and IDMT-302. As expected, the modulus values are greater following compaction with the most significant increases above elevation 28 meters (91.9 feet).
CIVIL ENGINEERING PRACTICE FALL/WINTER 2007 27

350
300
250
~ 200 ::::J Ill Ill
~ Q.
~ 150 · ~
100
50
0
Membrane Displacement (in)
0 0.01 0.02 0.03 0.04
0
---t-Q--1--- I DMT-1 04 at Elev. 30.14m (Sand) --+-0-+--- IDMT-104 at Elev. 26.36m (Peat)
' ' ' ' ' --- [ [ i ' ' ' ' ' ' ' ' ' ' ' ' ' ' '
' ' ' ' ' ' ' ' ' ------ -- ---- ----:- ------- --------;---- - ----- -- - -i- - ----- --
' ' ' ' ' ' ' ' : ' ' ' ' ' ----------------;':i;; ·-;.f""CpXJ
' ' ' ' ' . ' ' ' ' ' ' 1- - -- ---- - -- - --- -1--- - - ~ - --- - - ---
: : I
' ' ' ' ' ' ' ' ' ' ' '
' ' ' ' ' ' ' '
'
' ' ' !- ---- ---- -- -- ---:-- -- --- -- --- ---r---- ----------r ----, ' ' ' ' ' ' ' ' ' ' ' I I I I -----------1----------------1- -- -------------r----------------i-, ' ' ' ' ' ' ' ' ' ' ' ' ' ' ' ' ' ' '
0.25 0.5 0.75
Membrane Displacement (mm)
3.5
3
2.5
2 ~ ::::J Ill Ill
~ Q.
1.5 ~ I-
0.5
0
1.25
FIGURE 7. Typical pre-DDC IDMT results in sand and organic soils (i.e., peat).
According to Lukas," the maximum improvement should be approximately between elevations 31.7 and 32.6 meters (104 and 107 feet). The results shown in Figure 10 indicate that the maximum improvement zone may extend somewhat deeper than those predicted elevations. Post-compaction modulus values in the maximum improvement zone are about two
· times larger than the pre-compaction values. The native material is at an elevation of about 28 meters (91.9 feet), and little improvement in
28 CIVIL ENGINEERING PRACTICE FALL/WINTER 2007
modulus values has occurred below that elevation. The pre- and post-compaction modulus values seem to indicate the presence of a soft organic pocket at elevation 29.5 meters (96.8 feet), and also a relatively soft zone at about elevation 28.2 meters (92.5 feet).
Figures 11 and 12 (on pages 32 and 33) show profiles of the horizontal stress index (K0) and the constrained modulus (MoMT) for two adjacent DMT soundings conducted near Station 156 (one prior to compaction and the

0
1800
1600
1400
1200
1000
800
600
400
200
0
0
0
□
Membrane Displacement (in)
0.01 0.02 0.03
I DMT-1 02 at Elev. 31 .06m (Pre-DDC)
IDMT-202 at Elev. 31.18m (Post-DDC)
' '
0.04
----c----------r--------------r--------- i i -------' ' ' ' ' ' ' --------------- :------------- : : - - - -
: ! : [ ' ' ' ' ' ' ' ' ' ' ' -------:-- --.- -- --- ---- -r- --- -- ---- --- ---:-
, ' ' ' ' ' ' :----------------t----------------r--------------
' ' ' ' ' ' ' ' ' ' ' ' ' ' .. - --- ---1--- ---- --- --- --- .. -- --- --- ------ --i-,---- --- --- -- --1--- - -- ---- --- -- -' ' ' ' ' ' ' ' ' ' ' ' ' ' ' ' ' ' ' ' ' ' ' ' ' ' - --- --- --- -•I•-- - --- --- --- - -- -+ -- --- --- - ----- - -1--- --- --- -
' ' ' ' ' ' ' ' ' ' ' ' ' ' ' ' ' ' _______________ _!___________ i :
'
0.25 0.5 0.75
Membrane Displacement (mm)
' ' ' ' ' ' ' '
1.25
FIGURE 8. Pre- and post-DOC IDMT test curves.
18
16
14
12
~ ---10 Q,j I.,
::l <I) <I) Q,j
8 I.,
Q.
~ -6 ~
4
2
0
other conducted after compaction with DOC). Both figures show expected increases in lateral stress due to compaction with the most significant increases between elevations 30.0 and 32.0 meters (98.4 and 105 feet). The maximum improvement appears to be approximately between elevations 30.5 and 31.1 meters (100.1 and 102 feet), where post-DOC values of constrained modulus are about fifteen to twenty times larger than the pre-compaction values. Below that depth, the horizontal stress
increase attenuates, but still remains higher than the pre-compaction stage.
Profiles of tip resistance values in CPTU soundings conducted near the sheeting (eastbound lane) at Station 156+00 are shown in Figure 13 (on page 34). Sounding 156 EI2 was conducted prior to compaction, and sounding 156 R2S was conducted after compaction with DOC. It is interesting to note that, within the upper 0.9 to 1.2 meters (3 to 4 feet) of fill, the post-DOC q1 values shown in Figure 13 are
CIVIL ENGINEERING PRACTICE FALL/WINTER 2007 29

Membrane Displacement (mm)
0.58 550
0.6 0.62 0.64 0.66 0.€58 1400
+ X
I DMT-1 02 at Elev. 31 .06m (Pre-DOC)
500 IDMT-202 at Elev. 31.18m (Post-DOC)
1350
- 450 (',:I Q. ~ ..._,, N 400 0 ,-f,.!. ~ 350 C cu :i.. ::, 300 Cl) Cl)
cu :i..
Q.
-;; 250 -~ 200
150
100
50
0.58 0.6 0.62 0.64 0.66
1300
1250
1200
1150
1100
1050
1000
950
900
0.68
-(',:I Q. ~ ..._,, N 0 N f,.!. ~ C cu :i.. ::, Cl) Cl)
cu :i.. Q.
-;; -~
Membrane Displacement (mm)
FIGURE 9. Pre- and post-DOC IDMT unload-reload loops.
actually less than the pre-DDC values. As noted previously, pre-DDC qt values within the upper 0.9 to 1.2 meters (3 to 4 feet) of fill were quite high due to compaction from heavy construction traffic. Ground improvement in this upper zone was not expected, since DDC severely affects near surface soils, resulting in a looser surface after the process is completed.
Below elevation 33.5 meters (109.9 feet), Figure 13 shows expected increases in tip resistance due to compaction. The most signif-
30 CIVIL ENGINEERING PRACTICE FALL/WINTER 2007
icant increases are approximately between elevations 30.0 and 33.0 meters (98.4 and 108.3 feet), which is consistent with the DMT data. The maximum improvement zone appears ·to be approximately between elevations 31 and 32 meters (102 and 105 feet), which is slightly higher than the maximum improvement zone indicated by the DMT data. Within the zone of maximum improvement, the post-DDC qt values are about five to eight times larger than
· the pre-compaction values.

0
35
34
33
32
--E --C 31 0
i > OJ 30
i!i
29
28
27
26
25
0
Unload-Reload Modulus (Edur) (tsf)
1000 2000 3000
Approxi~ate G~ound S~rface
IDMT-102 (Pre-DOC)
IDMT-202 (Post-DOC) IDMT-302 (Post-DOC)
4000
' ' '
5000
_._ -------~ -------' ' ' ' ' ' ' ' _1_ - - - - - - - L. - - - - - - -
' ' : i : l
----- -+------+---- : ____ ----~-------l 1. l ' ' ' ' I I I I -------r- -----;--__ -----..-~~~-.,1---+-~~~::::.1.-s;/---r------r-------' ' '
' ' ' ' ' ' ' ' --- ----~- ----- - ~- - - - - - --~ ---- ____ .1, ________ 1 ______ --L-- -- -- -
' ' ' ' ' ' ' ' ' ' '
"--..,.-S✓ : I :
' ' : : ' ' ' '
, : r l -- -----1- ------;- ----- --;- -- - --L- -- - ---..L-- -- -- --1-- -- ---- L -- ---- -I I I I
: : : : I I I I I I l I
I ] : : l l ' ' ' ' ' ' : I : I
-----t- -- -- ---:- -- -----~- -- -- --- - -- - - -..l -- -- -- __ , __ ------I. -- -- - - '.I -- --- -- _._
: I : :
' ' ' ' ' ' : : : : : ' ' . ' ' ' ' ' ' ' ' ' ' ' ' ' ' ' ' I I I I I I ' ' ' - - - - - - - .l - - - - - - _..J_ - - - - - - - L- - - - - - - .1.- - - - - - - -'- - - - - - - - L. - - -- .1.- - - - - - - -'- - - - - - - -L - - - - - - -I I I I I I
: : : : : : : : : : : : I I I I I I
: I : : : I
I I I I
100 200 300
! : ' ' ' ' ' '
400 Unload-Reload Modulus (Edur) (MPa)
Edur= 38.2(p8-pA)/(d8-d.J
500
110
105 --¢: --C 0
100 i > OJ
i!i
95
90
85
FIGURE 10. Profiles of unload-reload modulus (Eaur>•
Based on a 13.15 tonne (14.5 ton) tamper and a 9.1 meter (30 foot) drop height, the depth of improvement computed from Equation 1 using a coefficient, n, of 0.5 is 5.5 meters (18 feet). The corresponding maximum improvement would then be predicted to occur within a zone between 1.8 and 2.7 meters (5.9 and 9.0 feet) below the ground sur-
face (i.e., elevations 32.6 to 31.7 meters [107 to 104 feet], respectively). For a drop height of 18.3 meters (60 feet), the depth of improvement computed from Equation 1 would be 7.8 meters (25.4 feet), with a corresponding maximum improvement zone between 2.6 and 3.9 meters (8.5 and 12.7 feet) below the ground surface. As noted previously, a detailed sum-
CIVIL ENGINEERING PRACTICE FALL/WINTER 2007 31

0
35
34
33
32
,_, E 3'1 _. C: 0 -~
30 (lJ
i!i
29
2fl
27
26
25
0
Horizontal Stress Index (K0 )
2 4 5 6 7
'
a 9
' ' ' ' ' ' ' ' ' ' ' ' ' ' .- --- -- --~- ---- --1--- ____ J. __ - -- -- -'- -- -- -- -L- -- -- --
,I : : : : . l ' ' ' ' ' ' ' ' ' ' ' ' ' ' ' ' ' ' ' ' ' ' ' ' ' ' ' ------L---- --1--------1--------l-------
' ' ' ' ' ' ' ' ----- __ J._ ------ ..I- --
' ' ' ' ' ' ' ' ' ' ' ' ' ' ' ' --------1--, ' ' ' ' ' i
• □
. ' ' ' ' ' '
- - - - - - _ j_ - - - - - - - ~ - - - - - - _ J _ - -- -- - _:_ -- -- -- -~ - -- -- --l I I I I I
1 : : : ! : I I I I I I 1 I I f I l I I I · I I I I I I I I I I I I I I I
- - - - ..L - - - - - - - J_ - - - - - _ -L - - - - - - - .1 - - - - - - - -'- - - - - -- - L - - - - - - -
l : l : ! l ' ' ' ' ' ' : : : I I I .I I 1 --· --- ----~- -------r-------r------r-----r------
' ' ' ' ' ' ' ' ' ' ' -- --- - -..I- -------L-- -- -- -' ' ' '
IDMT-1 02 (Pre-DDC) ' ' ' ' ' ' ' '
IDMT-202 (Post-DOC) ' ' ' ' ' '
10
2 3 4 5 6 7 g 9 10
Horizontal Stress Index (K0 )
!05
--= _.
·100 C: 0 .:: ~ :> (lJ
i!i
95
90
BS
FIGURE 11. Profiles of the horizontal stress index (K0 ) near Station 156+00.
mary of 123 CPTU soundings conducted at this site is presented by Hajduk et al.5 Results were presented in terms of the improvement index for densification (Id), which can be calculated using the following expression:11
(2)
where: qt, before= Corrected tip resistance before
32 CIVIL ENGINEERING PRACTICE FALL/WINTER 2007
start of ground improvement; and, qt, after = Corrected tip resistance after
densification at the same point in the subsurface.
Values for Id greater than zero indicate that the in-situ soils have been improved (i.e., have experienced densification). Based on the average values computed from all CPTU soundings, Id values exceeded zero to a depth of

35
34
33
32
-E 31 _. C 0
i 30 > QJ
'u:i 29
28
27
26
25
0
Constrained Modulus (MoMT) (tsf)
200
' '
400 600 800 1000
' ' I I I I I
- -- --:- -- -- --:-- -- -- -:-- -----:-- --- -:---- -- - I
I l I I I I I I
: : : : ' ' ' ' l I I I I I I l I I 1 I I I I I _____ ~- ____ --J-- _____ ~--- ____ L ___ · --~----- -- L- --- - _...J_ -- - ----: .. ------: - J I
' ' ' ' ' ' ' ' ' ' ' ' ' ' ' ' I I I I
____ L __ - - - _ -1- - - - - - - .l - --- --...I - ---- --L ---- __ ..J_ -- -- -- .L- -- -- --1-- -- - - -
: : : : : : : ' ' ' '
: : . : ' ' ' ' ' ' ' ' ' I I I I I I
I I I I I I I -- __ -.1------ L------ .J ___ -- --L---- -- ..J_ -- -- - - J.._ ---- --*-- -- -- -
I I I I I I I I I I I l
: : : : I I I 1
'l"', -~. -=:::::::;::::::,.;;i.. : : l : 1 I I I l I I I
----- -:- - - -- --:- - --- -- _J ____ - - -L--- --- ..I- -- -- --t- -- ----: --- ---1 : ~ : ' ' ' ' ' ' : ~'-----'------'-----'----'--~'-----, I : : ______ :___ ♦ DMT-102 (Pre-DOC) -1-------t ______ : ______ _
0
' ' ' : 0 DMT-202 (Post-DOC) : : ' ' ' ' ' ' ' ' '
1 0 20 30 40 50 60 70 80 90 1 00 11 0
Constrained Modulus (MoMT) (MPa)
110
105
95
90
85
FIGURE 12. Profiles of the contrained modulus (MvMT) near Station 156+00.
about 11.3 meters (37 feet) below the ground surface within DDC treatment areas, and to about 8 meters (26.2 feet) in the areas between the sheet piling and the outermost DDC drop point locations. Within the zones of maximum improvement predicted from Equation 1, values for Id ranged from about 2 to 4. Average Id values (both inside and outside DDC treatment areas) exceeded 2.0 down to a depth of about 4.9 meters (16 feet). DMT and IDMT
data presented in Figures 10, 11 and 12 also show that DDC resulted in significant improvement down to a depth of about 4.9 meters (16 feet) below the ground surface. Therefore, at this site, both the CPTU and DMT data indicate that the depth of improvement extended slightly below that predicted by Equation 1, and that the zone of maximum improvement may also be slightly deeper than that predicted using Equation 1.
CNIL ENGINEERING PRACTICE FALL/WINTER 2007 33

35
34
33
32
- 31 E .._ C: 30 Q
-..: ~ > 29 ~
U-1
28
27
26
25
24
Corrected Tip Resistance (qt) (tsf)
0 50 100 150 200 250 300 350 400
0
j -------- ! ------
' ' ' ' -- ----~ i ---u----; ' ' ' ' : : ' ' -----,- ---------' ' ' '
--=-- 156 El2 (Pre-DOC)
--=-- 156 R2S (Post-DOC)
' ' ' ' ' I I I I I I ,- -.- - - -- - - -T-- -- - - - - - -.- - - - - - - - -- r- - - -- - - - - ,- - - - -- - - - -r- - - - -- - - -: : : : : . : ! ·!Soft Zone: ! ! 1 I I I I I I I I f I I I I I I I I l -:--- -- -- --:-- -- -- ---:- --- ---- --:- ----- ---:- --- -- -- --:-- ----- --
•: I : : : : 1 I I I I
l I : : : :
- ---- . ---- .:----------~Seft.Z-oi:te-!- · -.- .. ----~---------~----------~. -. ·.-----
' ' ' ---------.J----' ' i ' '
5
, I .I I I
I : : : : I I I I
: : : : - I I I I I
---:---------r---------~- ---------r---------1----------~ ---------I I I I I I l I I I I I
: I : : : :
I l : : : --- -I•----- -----1----- --- - - -f- --- --- - - -1- -- -- -----
1 : - : :
--.J~;::~~ ' ' ' i ! ;
-- -- -- ----- _J_ ----- - ___ L_ - - -- -- - _J _______ - --~- -- ----- -I I I I I I I I
: : : : I I I I
: : : l
10 15 20 25 30 35 40
Corrected Tip Resistance (qt) (MPa)
FIGURE 13. Profiles of CPTU corrected tip resistance (q1) near Station 156+00.
110
105
100 ,_ ~ C: Q
~ 95 > ~ U-1
90
85
80
As noted previously, the IDMT modulus values presented in Figure 10 seem to indicate the presence of a soft organic pocket at elevation 29.5 meters (97 feet), and also a relatively soft zone at about elevation 28.2 meters (92.5 feet). Those soft zones were identified in the IDMT data obtained both before DOC (IDMT-102) as well as after compaction (IDMT-202, IDMT-302). ·1n contrast, although the DMT data (see Figures 11 and 12) and the CPTU
data (see Figure 13) indicate soft pockets at approximately elevation 28.2 meters (92.5 feet) and elevation 29.5 meters (97 feet) after compaction, the pre-DOC soundings obtained with those instruments did not clearly depict those zones during the baseline testing.
34 CIVIL ENGINEERING PRACTICE FALL/WINTER 2007
Conclusions The results of this study suggest that DMT, IDMT and CPTU are very useful tools for pro-

viding stratigraphic profiles as well as parameters for QA/QC on in-situ densification projects. During preliminary site investigations, tests using these three devices were helpful in identifying thicker pockets of organic soils (i.e., peat) that were not completely removed during the initial dredging operations. Based on data obtained near Station 156, it appears that the IDMT unload-reload modulus values were the most sensitive indicators of very thin zones of soft soils tested prior to compaction. After compaction, data from all three devices showed negligible increases in strength and stiffness values in those thin soft seams.
The CPTU corrected tip resistance (qt) values, the IDMT unload-reload modulus (Eaur) values and· the horizontal stress index (K0 )
and constrained modulus (MoMT) values obtained from DMT were all good indicators of densification effects. The DMT constrained modulus values appeared to be the most sensitive indicators of densification effects. Data from DMT, IDMT and CPTU all indicate that the depth of improvement resulting from DDC extended slightly beyond the depth predicted using Equation 1, and that the zone of maximum improvement may also be slightly deeper than that predicted using Equation 1.
ACKNOWLEDGEMENTS - The authors wish to acknowledge the Massachusetts Highway Department for its financial support for this research. Additionally, several MassHighway personnel provided much assistance in conducting the field testing for this project. Nabil Hourani, Edward Mahoney and the entire staff of the MassHighway Route 44 Field Office in Carver, Mass., are acknowledged in that regard. The authors also appreciate the help provided by Glenn Stewart at P.A. Landers, Inc.; John Jones, at TerraSystems; and UMD undergraduate research assistants Nicholas Yafrate and Tracy Willard. CPTU/SCPT testing for this project. was conducted by Wright 1
Padgett Christopher under the MassHighway construction contract with P.A. Landers, Inc. In addition to work conducted by MassHighway and UMD personnel, Applied Research Associates conducted cone penetration testing, and the University of New Hampshire conducted dilatometer and instrumented dilatometer testing.
HEATHER J. MILLER is Associate Professor of Civil Engineering at the University of Massachusetts Dartmouth, where she joined the faculty in 1994 after receiving a Ph.D. from the
University of New Hampshire. She has worked in the past as a geotechnical engineer for Haley & Aldrich and for Parsons;· Brinckerhoff, Quade & Douglas.
EDWARD L. HAJDUK is an assistant. professor in the Civil and. Environmental Engineering Department at The Citadel. Prior to that, he was a Senior Geotechnical Engineer for WPC. Ed
graduated with his Doctor of Engineering degree from the University of Massachusetts-Lowell. His project experience includes the Arthur Ravenel Jr. Bridge, the Woodrow Wilson Bridge, the demolition of the old Cooper River Bridges, and the Morris Island Lighthouse renovation.
KEVIN P. STETSON is a Senior Project Manager at Sanborn, Head & Associates, Inc., in Westford, Mass. He has over nine years of experience in geotechnical engineering design
and in-situ testing.
JEAN BENOIT is currently Professor and Chair of the Department of Civil Engineering at the University of New Hampshire. He received his B.S.C.E. from Ecole Polytechnique in
Montreal in 1977 and his Masters and Doctorate in Civil Engineering from Stanford University in 1980 and 1983, respectively. He worked as a geotechnical engineer for Woodward-Clyde Consultants following his B.S.C.E.
PETER J. CONNORS is an Assistant Geotechnical Engineer for the Massachusetts Highway Department. He has been employed there since 1995 after receiving a MSCE from the
University of Massachusetts-Lowell.
REFERENCES
1. Ernst, H., Connors, P., & Pettis, P., Massachusetts Highway Department Geotechnical Report for Relocated Route 44, Section I Carver, Plympton and Kingston, MHD Geotechnical Section, Boston, Mass., 1996.
CIVIL ENGINEERING PRACTICE FALL/WINTER 2007 35

2. Paikowsky, S.G., Elsayed, A.A., & Kump, P.U., "Engineering Properties of Cranberry Bog Peat," Proceedings of 2nd Inter. Conf on Advances in Soft Soil Engineering and Technology, Putrajaya, Malaysia, 2003.
3. Yong, T., Sheet Pile Design and Performance in Peat, doctoral dissertation submitted to the University of Massachusetts-Lowell in fulfillment of Doctor of Engineering Degree, Lowell, Mass., 2005.
4. Lukas, R.G., Geotechnical Engineering Circular No.1: Dynamic Compaction, Report FHWA-SA-95-037, Federal Highway Administration, Washington, D.C., 1995.
5. Hajduk, E.L., Connors, P.J., Miller, H.J., & Meng, J., "Verification Testing of Deep Dynamic Compaction Between Sheet Piling Using Cone Penetration Testing," Proc. of the 2004 Intern. Symp. on Ground Improvement, Paris, France, 2004.
6. Massachusetts Highway Department, Project Specifications for Relocated Route 44, Section I Carver, Plympton and Kingston, Boston, Mass., 1999.
7. Miller, H.J., Stetson, K.P., & Benoit, J., "Site Characterization and QA/QC of Deep Dynamic Compaction Using an Instrumented Dilatometer," Proceedings of the 2nd International Conference on Site Characterization (ISC-2), Porto, Portugal, September 19-22, 2004 ..
8. Miller, H.J., Stetson, K.P., & Benoit, J., "DMT Testing for Site Characterization and QA/QC on a Deep Dynamic Compaction Project," ASCE Geotechnical Special Publication No. 126: Proceedings of Geo-Trans 2004, Los Angeles, Calif., July 27-31, 2004; Sponsored by the Geo-Institute of the American Society of Civil Engineers.
9. Benoit, J., & Stetson, K.P., Report on DMT and IDMT Testing for Route 44 Relocation Project, University of New Hampshire, Durham, New Hampshire, 2004.
10. ASTM International, "Standard Test Method for Performing the Flat Plate Dilatometer," ASTM D6635-01, 2002. . .
11. Dove, J.E., Boxill, L.E.C., & Jarrett, J.B., A CPTBased Index for Evaluating Ground Improvement: Advances in Grouting and Ground Modification, ASCE Geotechnical Special Publication 104, 2000.
12. Andrus, R.D., & Stokoe, K.H., "Liquefaction Resistance of Soils From Shear-Wave Velocity," Journal of Geotechnical and Geoenvironmental Engineering, Vol. 126, No. 11, 2000.
36 CIVIL ENGINEERING PRACTICE FALL/WINTER 2007
13. Marchetti, S., "A New In Situ Test for the Measurement of Horizontal Soil Deformability," Proceedings of the Conference on In Situ Measurement of Soil Properties, ASCE Specialty Conference, Vol. 2, Raleigh, North Carolina, June 1975.
14. ASTM International, "Standard Test Method for Performing Electronic Friction Cone and Piezocone Penetration Testing of Soils," ASTM D5778-95, 2000.
15. Schmertmann, J., Baker, W., Gupta, R., & Kessler, K., "CPT /DMT QC of Ground Modification at a Power Plant," Proceedings of In Situ '86, Blacksburg, Virginia, June, ASCE Geotechnical Special Publication No. 6, 1986.
16. Marchetti, S., Monaco, P., Totani, G., & Calabrese, M., "The Flat Dilatometer Test (DMT) in Soil Investigations," a report by the ISSMGE Committee TC16, Proceedings of the International Conference on In Situ Measurements ofSoil Properties, Bali, Indonesia, May 2001.
17. Stetson, K.P., Benoit, J., & Carter, M.J., "Design of an Instrumented Flat Plate Dilatometer", Geotechnical Testing Journal, Vol. 26, No. 3, 2003.
18. Motan, S.E., & Gahr, M.A., "Flat Dilatometer and Lateral Soil Modulus," Transportation Research Record 1022, National Academy Press, Washington, D.C., 1985.
19. Motan, S.E., & Khan, A.Q., "In-Situ Shear Modulus of Sands by a Flat-Plate Penetrometer: A Laboratory Study," Geotechnical Testing Journal, Vol. 11, No. 4, 1988.
20. Campanella, R.G., & Robertson, P.K., "Use and Interpretation of a Research Dilatometer," Canadian Geotechnical Journal, Vol. 28, 1991.
21. Pretti, C., Lo Presti, D.C.F., & Salgado, R., "Development of the Research Dilatometer: In Situ and Calibration Test Results," Rivista Italiana di Geotecnia, Napoli, Italy, Vol. XXVI, No. 4, 1992.
22. Kay, J.N., & Chiu, C.F., "A Modified Dilatometer for Small Strain Stiffness Characterization," Proceedings of the Eleventh Southeast Asian Geotechnical Conference, Singapore, 1993.
23. Youd, T.L., et al., "Liquefaction Resistance of Soils: Summary Report from the 1996 NCEER and 1998 NCEER/NSF Workshops on Evaluation of Liquefaction Resistance of Soils," Journal of Geotechnical and Geoenvironmental Engineering, Vol. 127, No. 10, 2001.