in situ quantification of bioturbation using time-lapse
TRANSCRIPT

MARINE ECOLOGY PROGRESS SERIESMar Ecol Prog Ser
Vol. 271: 1–12, 2004 Published April 28
INTRODUCTION
The mixing of porewater solutes and sediment par-ticles by the activities of benthic organisms, collec-tively referred to as bioturbation (sensu Richter 1952),has long been known to have profound effects on thephysical, chemical and biological properties of un-
consolidated sediments (e.g. Gray 1974, Rhoads 1974,Aller 1982, Rhoads & Boyer 1982). Through burrowing,feeding, ventilatory and locomotory behaviour, theinfauna disproportionately influence biogeochemicaland diagenetic reactions within the interstitial pore-water and promote the vertical and lateral redistribu-tion of sediment particles above and/or below the sedi-
© Inter-Research 2004 · www.int-res.com*Email: [email protected]
In situ quantification of bioturbation usingtime-lapse fluorescent sediment profile imaging
(f-SPI), luminophore tracers and model simulation
Martin Solan1,*, Benjamin D. Wigham2, 6, Ian R. Hudson2, Robert Kennedy3,Christopher H. Coulon4, Karl Norling5, Hans C. Nilsson5, Rutger Rosenberg5
1Oceanlab, School of Biological Sciences, University of Aberdeen, Newburgh, Aberdeenshire AB41 6AA, UK2DEEPSEAS group, George Deacon Division, Southampton Oceanography Centre, Empress Dock, European Way,
Southampton SO14 3ZH, UK3Martin Ryan Institute, National University of Ireland, Galway, Ireland
4The GAIA Group, 2200 Roosevelt Avenue, Berkeley, California 94703, USA5Department of Marine Ecology, Goteborg University, Kristineberg Marine Research Station, 450 34 Fiskebackskil, Sweden
6Present address: Oceanlab, School of Biological Sciences, University of Aberdeen, Newburgh, Aberdeenshire AB41 6AA, UK
ABSTRACT: In order to link actual biological data on bioturbation to the abstract parameters in bio-turbation models, high-resolution data on the frequency and lengths of particle displacements arerequired. The temporal variation in bioturbation for a subtidal macrofaunal assemblage was studiednon-invasively and in situ using an optically modified fluorescence sensitive time-lapse sedimentprofile imaging camera (f-SPI), fluorescent-dyed sediment particles (luminophores) and mathemati-cal modelling. This combined approach allowed tracer particles to be non-invasively tracked andtheir displacements monitored at an unprecedented spatial (78 µm) and temporal (every 10 min) res-olution for extended periods of time (16 h). The redistribution of luminophores was digitally acquiredfrom sequential images and compared to model predictions, with particle transport modelled as (1) adiffusive process, allowing the biodiffusion coefficient, Db, to be estimated, and (2) a non-local pro-cess, allowing a reworking activity constant, a, to be calculated. Model predictions of luminophoreparticle transport for the final image of the f-SPI sequence gave: Db = 1.26 × 102 cm2 yr–1; a = 5.23 ×10⁻² cm–1 yr–1. Discrete values of a fluctuated widely throughout the sequence and allowed discretebioturbation events to be identified. Time-lapse movie sequences revealed that most of the bioturba-tion observed during the deployment could be directly attributed to the behaviour of the brachyurancrab Hyas araneus. Our findings demonstrate that f-SPI provides a rapid and non-invasive means tovisualise and quantify, in situ, the extent and influence of discrete infaunal bioturbation events onparticle mixing. This technique provides detailed information on the spatial and temporal resolutionof such bioturbation events, which could significantly improve existing models of bioturbation.
KEY WORDS: Sediment profile imaging · Luminophore tracer · Bioturbation · Biodiffusion coefficient ·Reworking activity constant · Non-local modelling · Benthic
Resale or republication not permitted without written consent of the publisher

Mar Ecol Prog Ser 271: 1–12, 2004
ment-water interface. Although the precise form andrate of bioturbation is generally species-specific (e.g.Forster & Graf 1995, Shull & Yasuda 2001) and maycovary with respect to other environmental variables(e.g. Solan & Kennedy 2002, Biles et al. 2003), the com-bined effect of infaunal activity on the properties of thesediment has important implications for many ecosys-tem processes; bioturbation directly affects organicmatter remineralisation and decomposition (Anderson& Kristensen 1991, Aller 1994), nutrient cycling (Furu-kawa et al. 2001), pollutant release (Gilbert et al.1994), sediment resuspension (Rowden et al. 1998) andmicrobial activity (Aller & Yingst 1985). Understandingand quantifying the mechanisms of bioturbation is there-fore of primary importance in disentangling organism-sediment interactions as they relate to the provisionand long-term sustainability of ecosystem function.
Several direct approaches have been used for esti-mating the extent of bioturbation, including the col-lection of burrow ejecta (Cadée 1976), faecal pellets(Hughes et al. 1996) and resin casts (Meadows & Tufail1986), although these methods have gradually beensuperseded by the use of natural and artificial tracers(e.g. glass beads, isotopically labelled algae, inertsolutes, radionuclides, metal-doped sediment and fluo-rescent luminophores; Wheatcroft et al. 1994, Blair etal. 1996, Gerino et al. 1998, Sandnes et al. 2000, Berg etal. 2001, Green et al. 2002, Forster et al. 2003). The useof such tracers allows the average concentration of par-ticles within the sediment profile to be characterisedfollowing a short incubation period, but the process oftracer recovery can be extremely time consuming andis not without error. Replicate cores containing lumino-phore particles, for example, are usually sliced intohorizontal segments (~1 cm thick), each of whichundergoes a series of washing and sieving steps to re-move the fine fraction of the sediment, before the re-maining sediment is dried in an oven and the lumino-phores are manually counted under an ultraviolet lightsource (e.g. Gerino et al. 1998). During this process,there is a risk that the sediment may be mixed betweensegments, or that the porewater may drain from onesegment to another, thereby artificially extending thetracer profile to result in an overestimate of the degreeof mixing (Berg et al. 2001). Even when it is anticipatedthat this has not taken place, it is unlikely that the be-haviour of infauna confined within a narrow core is rep-resentative of the natural situation in the field (e.g.Jones & Jago 1993). Despite these issues, the use oftracers remains the best currently available method forobtaining the necessary information required to quan-tify and compare rates of sediment reworking withmathematical models of bioturbation (e.g. Boudreau1986, Boudreau & Imboden 1987, François et al. 1997,2002; and for review see Meysman et al. 2003).
The most commonly used model descriptor of biotur-bation is the biodiffusion coefficient Db, which typi-cally ranges between 102 and 10–3 cm2 yr–1 for macro-faunal assemblages in subtidal sediments (Matissoff1982; for exceptions, see Green et al. 2002). While val-ues of Db provide a convenient and useful means tocompare bioturbation rates, the assumptions under-lying a biodiffusive analogy are over-simplistic; it ispresupposed that particles randomly move over shortdistances and that the rate of such movement is pro-portional to the tracer concentration gradient. As manyspecies are capable of transporting particles over dis-tances equal to, or even greater than, their own bodylengths (e.g. through upward or downward conveyorbelt feeding, Fisher et al. 1980; burrow and fill mixing,Boudreau & Imboden 1987; or sediment regeneration,Gardner et al. 1987), such an assumption is simply in-appropriate. Indeed, the application of biodiffusivemodels has provided little predictive understanding ofbioturbation for the following main reasons (modifiedfrom François et al. 1997): (1) a diffusive analogy isconstrained by the conditions of the symmetry andlength criteria, which often do not reflect the fre-quency and length scales of discrete bioturbationevents imposed by species behaviour, (2) the currentlyemployed techniques for tracer studies are integrativemeasures, and thus not able to separate or document aseries of discrete rapid mixing events over a long pe-riod of time (e.g. Wheatcroft et al. 1990), and (3) varia-tion in the rate of tracer mixing cannot be directly re-lated to specific bouts of animal activity; the poorconnection between ‘real’ biological activity and para-meter values in bioturbation studies is a major weak-ness in the interpretation of model data. While many ofthese issues can be avoided through the use of a theo-retical framework based on a non-local model of tracerredistribution (e.g. Boudreau 1986, Boudreau & Im-boden 1987), the main problem in the interpretationof bioturbation profiles remains: Specific sediment re-working signatures obtained within tracer profiles can-not always be matched with individual species, nor canthey be directly associated with interactions betweenindividuals or external environmental phenomena.
One method that has proven successful in observingand interpreting dynamic processes below the sedi-ment-water interface is time-lapse sediment profileimaging (t-SPI; see Diaz & Cutter 2001, Solan &Kennedy 2002). This technique provides multipleundisturbed cross-sectional images of the benthos,obtained in situ, that simultaneously allow the visualidentification of species and the direct observation ofanecdotal and quantifiable information on infaunalactivity. It follows that the expansion of this techniqueto incorporate an ability to visualise an optically dis-tinct tracer, such as a luminophore, would allow tracer
2
Solan et al.: In situ quantification of bioturbation using f-SPI
activity to be directly associated with discrete biotur-bation events and/or matched to the activities of indi-vidual species visible in the images. Some progresstowards this goal has already been made. Gilbert et al.(2003) successfully used images from a series of labo-ratory cores containing luminophores to calculate anoptical reworking coefficient (32∆Q) using standardimage analysis routines. Although the calculation of32∆Q was unable to derive realistic and comparable ratesof bioturbation, it demonstrated the viability of theimaging approach. The aim of the present study was:(1) to combine the use of an optically distinct tracerwith in situ t-SPI, (2) simultaneously visualise infaunalbehaviour and quantify tracer activity for a subtidalassemblage, (3) communicate a method of modellingthe observed behaviour, and (4) ensure that the spatialand temporal resolution was sufficient to capture rapidand/or discrete bioturbation events.
MATERIALS AND METHODS
Sediment profile imaging. A time-lapse capablesediment-profile imaging camera was optically modi-fied (see below) for fluorescence detection and de-ployed in 28 m water depth at Gullsmarsfjord, Sweden(58° 15’ 252’’ N, 11° 27’ 158’’ E); a site known to containmany important bioturbators, including Amphiura fili-formis, Echinocardium cordatum and Calocaris macan-dreae. The SPI consists of a stainless steel supportframe and a prism-shaped imaging module that pene-trates the sediment-water interface when lowered on awire from a vessel. The back plate of the prism con-tains a mirror mounted at a 45° angle that reflects thesediment profile up to the camera (for general princi-ples, see Rhoads & Cande 1971). The current imagingmodule on the SPI houses a Canon EOS D60 singlelens reflex digital CMOS camera (2048 × 3072 pixels,i.e. 6.29 megapixels) equipped with an f2.0 Canon EF35 mm lens, an automated interval timing facility and amodified flash (ETTL Canon 220 EX). The camera wasset for an exposure of 1/60, f = 4.0 and a film speed ofISO 200. The dimensions of the prism face-plate allowa maximum visible area of 384 cm2 (16 × 24 cm) to beimaged. This configuration provides an effectiveimage resolution of 78.13 × 78.13 µm per pixel. TheSPI camera was placed in situ approximately 2 h priorto the start of the time-lapse sequence and was un-coupled from the research vessel for the duration ofthe deployment.
The time-lapse sequence started at 09:58 h on 28April 2003 and ended at 01.58 h on 29 April 2003 (i.e.16 h). Each successive image was taken at an intervalof 10 min, giving a total of 97 images. Immediatelyafter the first image, a team of SCUBA divers spread
30.0 g dry weight of sand-based luminophores (i.e. nat-ural sediments treated with a dye that fluoresces inultraviolet light, Mahaut & Graf 1987) on the sedimentsurface to aid subsequent visualisation of particlemovement. The spread of luminophores was restrictedto within 1 cm of the SPI face plate to form a layerapproximately 3 mm deep. The luminophores (pink,125 to 250 µm diameter; Environmental TracingSystems) were pre-soaked and vigorously shaken inseawater 24 h prior to distribution to prevent particleaggregation and/or floatation during the distributionprocess in the field. To maximise the distinctionbetween luminophore particles and the surroundingsediment, lighting filters (Lee Filters, UK) were addedto the camera lens (Medium yellow #010) and flash (J.Winter Blue, #713). The blue filter on the flash allowsthe transmission of light necessary for luminophoreexcitation (λ = 375 to 500 nm) and for partial illumina-tion of the sediment profile (λ = 700 to 800 nm), butblocks the transmission of any additional light.Reflected light returning to the camera passes throughthe yellow filter. This removes the light used solely forthe purpose of luminophore excitation (λ = 375 to 480nm), but allows the remaining light (λ = 480 to 500 and700 to 800 nm) through to the camera. This configura-tion allows accurate discrimination of luminophoreparticles while also retaining sufficient detail of thesediment profile. At the end of the time-lapse period, a0.1 m2 Smith-MacIntyre grab was used to recover thesediment immediately in front of the camera face-plate.The sediment was washed through a standard 1.0 mmsquare mesh sieve. The fauna retained on the sievewas regarded as indicative of the macrofauna on sta-tion and was used to aid visual identification of anyspecies observed in the SPI images.
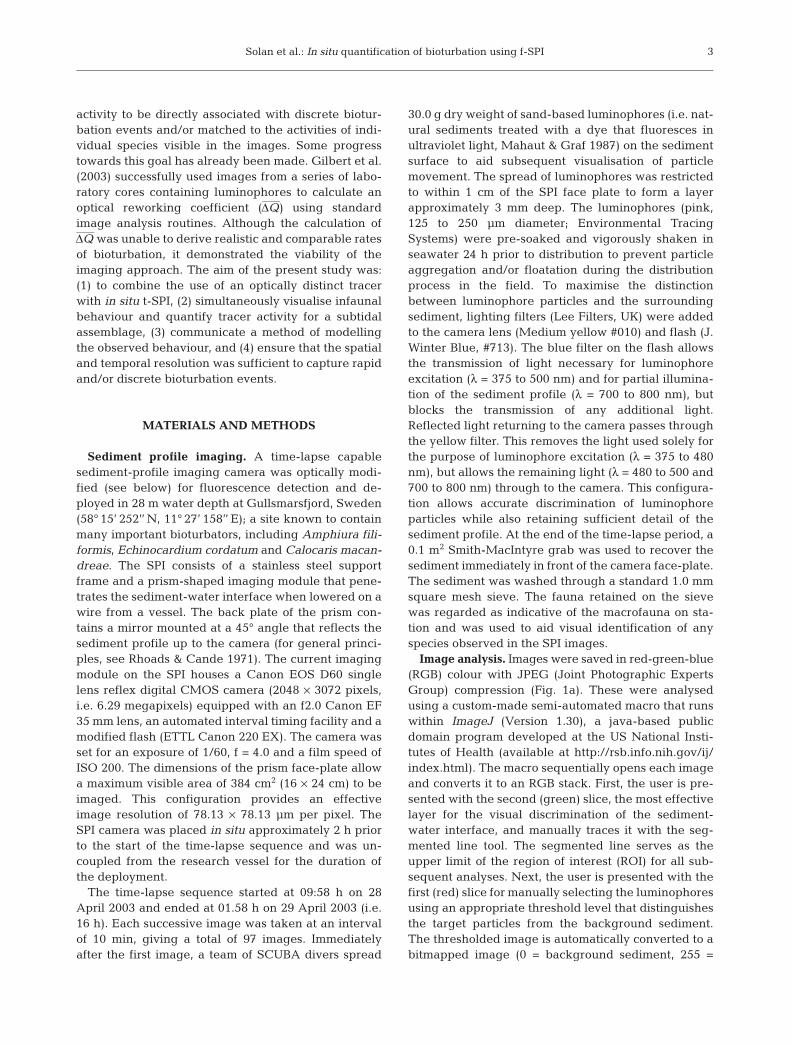
Image analysis. Images were saved in red-green-blue(RGB) colour with JPEG (Joint Photographic ExpertsGroup) compression (Fig. 1a). These were analysedusing a custom-made semi-automated macro that runswithin ImageJ (Version 1.30), a java-based publicdomain program developed at the US National Insti-tutes of Health (available at http://rsb.info.nih.gov/ij/index.html). The macro sequentially opens each imageand converts it to an RGB stack. First, the user is pre-sented with the second (green) slice, the most effectivelayer for the visual discrimination of the sediment-water interface, and manually traces it with the seg-mented line tool. The segmented line serves as theupper limit of the region of interest (ROI) for all sub-sequent analyses. Next, the user is presented with thefirst (red) slice for manually selecting the luminophoresusing an appropriate threshold level that distinguishesthe target particles from the background sediment.The thresholded image is automatically converted to abitmapped image (0 = background sediment, 255 =
3

Mar Ecol Prog Ser 271: 1–12, 2004
luminophore pixels; Fig. 1b) before the macro uses thex- and y-coordinates of the segmented line to calculateevery y-position along the x-axis and determine thepixel values for each y-column. The latter are trans-ferred to an array that resets the starting index of eachcolumn to zero, i.e. the segmented line is flattened sothat the sediment-water interface is equal to the firstrow of the array (Fig. 1c). Finally, the pixels that areequal to 255 for each row (x-axis) of the array aresummed to yield the total number of luminophorepixels for each value of y (= depth) and are presentedin a results table (Fig. 1d). These data were used todetermine particle mixing rates using 2 separate mod-els: biodiffusive and non-local (= advective). The initiallayer of deposited tracers was 0.297 cm (= 38 pixelrows) deep. Luminophore counts were aggregated intoboxes equal to this depth for modelling purposes.Luminophore pixel counts were converted to relativeconcentrations (i.e. expressed as a proportion of thoserecovered from each individual image) by dividing thenumber of luminophore pixels in each box by the totalnumber of luminophore pixels in the image.
Biodiffusive modelling. The biodiffusion coefficient(Db) was determined for the luminophore tracer countsfrom the final image in the time series using the1-dimensional diffusion model, applicable for passivetracers in the absence of sedimentation and given byCrank (1975) as:
(1)
where C is the relative concentration of lumino-phore pixels, t is time and z is depth (positive into thedeposit).
The solution to Eq. (1) was determined by Crank(1975) to be:
(2)
where c(z,t) is the tracer concentration at depth z andtime t, and C0 is the relative concentration at z = 0.
For consistency with the non-local model presentedin the present study, Eq. (2) is rewritten here in termsof mass concentration. The initial condition is that of atracer pulse at the sediment-water interface, i.e.:
C(z,0) = Mδ(z) (3)
where M denotes the amount of luminophores applied.Here, δ(z) denotes the Dirac delta function, which van-ishes everywhere except at z = 0, where it becomesinfinite. The conversion of mass demands that at alltimes the total inventory of tracer in the sediment isequal to the amount initially applied, i.e.:
(4)
The upper boundary condition prevents the loss ofluminophores to the water column, while at infinitedepth (i.e. the lower boundary condition), luminophoreconcentration vanishes:
(5)
(6)
The solution to Eq. (1) then becomes:
(7)C z tMD t
zD t
( , ) exp= −
π b b
2
4
Lower boundary condition: lim
z→∞=C z t( , ) 0
Upper boundary condition:
C
z
∂∂
==z 0
0
C z z M z z M( , ) ( )00 0
d d= =∞ ∞
∫ ∫ δ
C z t C z
D t( , ) exp= −
0
2
4 b
∂∂
=∂∂
2 2
2
Ct
DCz
b
4
Fig. 1. The process of image analysis for the optical quantification of luminophores showing (a) the original image with thesediment appearing in blue and luminophore particles in pink, (b) the thresholded image, and (c) the processed image, correctedso that the sediment-water interface is flattened and all luminophore pixels on the sediment surface have been discarded.
In (d), the total number of luminophore pixels with depth are presented. Images have been cropped. Scale bars = 1.0 cm
Luminophore pixels
Dep
th (
cm)
0 250 500 750 10000.0
–0.5
–1.0
–1.5
–2.0
–2.5
–3.0
(d)

Solan et al.: In situ quantification of bioturbation using f-SPI
Db was derived by weighted least-squares regressionof predicted profiles on observed tracer concentrations(François et al. 2002). This procedure calculates asquared residual between the observed (obs) andpredicted (pred) concentrations at each depth. Eachresidual is weighted by the corresponding observedconcentration +1, to prevent a null denominator. Aregression coefficient (r) is calculated by summing theresiduals as follows:
(8)
This procedure attempts to give due consideration tothe deeper sediment layers, where values of tracerconcentration are typically low relative to the surfacelayers. Where the predicted profile is a perfect matchwith the observed profile, r = 0.
Non-local modelling. Non-local transport coeffi-cients were calculated for each image using a sym-metric non-local model in the form:
(9)
where K(z ’,z) represents the exchange function (Bou-dreau 1986, Boudreau & Imboden 1987, Meysman etal. 2003) that models the non-local displacement rate ofluminophores from a given depth z ’ to the modellingdepth z. For simplicity, the exchange function wasassumed to be symmetric, i.e.:
K(z ’,z) = K(z,z’) (10)
It was also assumed that the exchange decreasedexponentially with distance. An explicit expression forthe exchange function is given by:
(11)
where a is a reworking activity constant (dimensionsL–1 T–1), and λ is the attenuation constant of the expo-nential function (dimensions L). Here we used a fixedattenuation depth of λ = 3 cm. This scale was largerthan the total length of the transport observed in theSPI images. As for the biodiffusion model, an initialcondition of a tracer pulse at the sediment-water inter-face was applied; however, the boundary conditionswere changed to the following:
(12)
(13)
where L represents the depth of the modelled sedi-ment (2.673 cm).
The values of a producing the best fit were deter-mined by weighted least-squares regression of the
predicted profile to the observed mean profiles, asfor the biodiffusive model.
RESULTS
The macrofaunal returns from the Smith-MacIntyregrab consisted of 122 individuals (53.0 g wet weightbiomass), representing 12 taxa (Table 1). The mostabundant faunal element were the ophiuroids Amphiuraspp. (63.1%), comprising 2 species: A. filiformis andA. chiajei. As these are largely indistinguishable inSPI images, they were not identified to species level.The bivalves Abra nitida (17.1%) and Corbula gibba(4.1%) and the polychaete Nephtys hombergii (5.7%)were also relatively abundant. The remaining taxa,although less numerous, revealed the presence ofsome other major bioturbators on station (e.g. Echino-cardium cordatum and Calocaris macandreae). In termsof biomass, E. cordatum and Amphiura spp. collec-tively accounted for 98.7% total biomass (Table 1).
Images from the f-SPI sequence showed no evi-dence of current-induced erosion or deposition at thesediment-water interface, although an undeterminedamount of excess luminophores in the distant field ofview did appear to be scoured away over the course ofthe deployment. Comparison of the pre- and post-luminophore images (i.e. Frames 1 and 2 or –10 and0 min) confirmed that the act of luminophore emplace-ment did not disturb the sediment profile and that thespread of the luminophore deposit was satisfactory (i.e.tracers were homogeneously located along the sedi-ment-water interface at time zero). Very little infaunalbioturbation was evident below the sediment-waterinterface, except for the brief appearance of one indi-vidual Nephtys hombergii at depth and a number ofsmall horizontal burrows of unknown identity near thesediment surface. None of these biogenic structuresresulted in a significant displacement of luminophores.Instead, almost all the observed bioturbation could bedirectly attributed to the presence of the brachyuranspider crab Hyas araneus.
The images reveal that Hyas araneus was present fromat least 70 min (Frame 9) from the start of the sequencethrough to an elapsed time of 850 min (Frame 87), withregular occurrences in the images throughout the de-ployment (Frames 17, 19, 30, 48 to 55 and 86). Distin-guishing marks on the walking legs (peraeopods) of theorganism indicated the presence of at least 2 individualsduring the sequence. Of the 13 frames in which H. ara-neus was visible, only 2 images (Frames 86 to 87) refer-enced the second individual. The regularity with whichthe first individual was documented, and its appearancewithin 2 frames of a distinctive bioturbation event(Frame 17 or 150 min), suggest that this individual is
Lower boundary condition:∂∂
==
C
z z L
0
Upper boundary condition:∂∂
==
C
z z 0
0
K z z a
z z( ’ ) exp
’= − −
λ
∂∂
= −∞ ∞
∫ ∫C
tK z z C z t z K z z C z t z( ’, ) ( ’, ) ’ ( , ’) ’d ( , )d
0 0
r i i
ii
n
= −( )+=
∑ obs pred
obs
2
1 1
5

Mar Ecol Prog Ser 271: 1–12, 2004
primarily responsible for the observed redistribution ofluminophores. Closer examination of the images re-vealed the mechanism of particle displacement (Fig. 2).When H. araneus remains stationary on the sedimentsurface, the walking legs penetrate the sediment-waterinterface (Fig. 2a). The individual appears to constantlyadjust its posture during such rest periods, thereby pal-pating the sediment as each walking leg is re-positioned(Fig. 2b). As the individual relocates, the body risesand assumes an elevated position with respect to thesediment surface and it fully retracts each walking leg toenable forward motion (Fig. 2c). Measurements takenfrom the image estimate a body size of approximately 4.0to 4.5 cm (posterior carapace width), a walking leg dia-meter of 0.5 cm and an apparent leg penetration depth of1.5 to 2.0 cm; the insertion angle of each walking leg intothe sediment profile varied (7.5 to 30°) and was an unre-liable indication of maximum penetration or subsurfaceorientation. Assuming the buried portion of each leg to
be a cylinder (∅ = 0.5 cm, length = 1.5 cm),the volume of sediment displaced by 8walking legs each time the organism re-locates may be ~2.36 cm3.
Sequential images allowed the trans-port of individual particles and the evolu-tion of the tracer profile to be tracked(Fig. 3) and quantified (Fig. 4). For thefirst image of the sequence (Frame 2;Figs. 3a & 4a), all luminophores werecontained within the uppermost 0.30 cmof the sediment profile, reflecting thedepth of the luminophore layer on thesediment surface. Burial of luminophoreparticles below this depth did not occurfor at least 70 min (Frame 9), but thisperiod was followed by a series of dra-matic particle burial events. By 80 min(Frame 10), luminophores were presentto a depth of 1.04 cm, although a compar-
atively small number of particles (3531 to 8903 lu-minophore pixels, Frames 10 to 16) were buried belowthe 0.30 cm horizon (e.g. Figs. 3b & 4b). The latter, how-ever, increased by an order of magnitude (to 44671 lu-minophore pixels) after 150 min (Frame 17), and wasaccompanied by an increase in the maximum lu-minophore penetration depth to 1.68 cm (e.g. Figs. 3c &4c). The form of the luminophore profiles with depth(Figs. 3d–i & 4d–i) shows that several non-local mixingevents with length scales of whole cm per 10 min(equivalent to 104 cm yr–1) took place throughout thedeployment period. Following these events, tracerswere rapidly dispersed throughout the profile, leadingto an approximately Gaussian, or biodiffusive, profile.
Model predictions of luminophore particle transportas a diffusive process on the final image (Frame 97) ofthe f-SPI sequence gave a Db value of 1.26 × 102 cm2
yr–1. Although the predicted diffusional profile (Pdiff)statistically fitted reasonably well (r = 0.079) with that
6
Table 1. Summary of the macrofaunal returns from a 0.1 m2 Smith-MacIntyregrab obtained from immediately in front of the sediment profile imaging(SPI) face-plate at the end of the time-lapse sequence. Data are listed in
descending order of abundance
Species Abundance Biomass % Total % Total(g) abundance biomass
Amphiura spp. 77 9.9847 63.11 18.85Abra nitida 21 0.1023 17.21 0.19Nephtys hombergii 7 0.1107 5.74 0.21Corbula gibba 5 0.0066 4.10 0.01Melinna cristata 2 0.0137 1.64 0.03Abra alba 2 0.0083 1.64 0.02Cylichna cylindracea 2 0.0053 1.64 0.01Risoella spp. 2 0.0046 1.64 0.01Echinocardium cordatum 1 42.307 0.82 79.89Calocaris macandreae 1 0.3976 0.82 0.75Anaitides sp. 1 0.0107 0.82 0.02Turritella communis 1 0.0049 0.82 0.01
Total 1220 52.95640 100.000 100.000
Fig. 2. Hyas araneus. Time-lapse sequence illustrating the repositioning behaviour of the spider crab. Walking legs penetratebelow the sediment-water interface during periods of rest (a) but are constantly readjusted to maintain posture (b) or removedfrom the sediment when moving to a new location (c). Images represent (a) Frame 52 (500 min), (b) Frame 53 (510 min) and
(c) Frame 54 (520 min) and have been cropped. Scale bars = 1.0 cm

Solan et al.: In situ quantification of bioturbation using f-SPI
of the observed profile (Pobs), the form of the 2 profileswere not equivalent to one another; the degree ofparticle burial for Pdiff, when compared to Pobs, was over-estimated near to the sediment surface, and underesti-mated with increasing error with depth (Fig. 5). Thisdisparity resulted in a difference in relative concentra-tion of 2 orders of magnitude between Pobs and Pdiff at a
sediment profile depth of only 1.63 cm. Below thisdepth, the biodiffusive model predicted relative con-centrations below the detection limit of the technique.Use of the non-local model to predict particle transportfor the same image (Frame 97) gave a reworking activ-ity constant value of 5.23 × 10⁻² cm–1 yr–1, but this pre-diction (Pnl) fitted the Pobs better (r = 0.005) than the
7
Fig. 3. Selected images fromthe time-lapse sequence de-tailing the impact of bio-turbation on luminophoreparticle displacement from(a) Frame 2 (0 min) through to(i) Frame 97 (950 min). Inter-vening images (b to h) areeach separated by 14 frames(=120 min). Sediment parti-cles appear as blue and lu-minophore particles as pink.The presence of Hyas ara-neus can be seen in frames (e)and (h). Scale bars = 1.0 cm

Mar Ecol Prog Ser 271: 1–12, 20048
(a)Relative concentration
0.00 0.01 0.02 0.03 0.04 0.05
Dep
th (
cm)
-3.0
-2.5
-2.0
-1.5
-1.0
-0.5
0.0
0.00 0.20 0.40 0.60 0.80 1.00
(b)Relative concentration
0.00 0.01 0.02 0.03 0.04 0.05
Dep
th (
cm)
-3.0
-2.5
-2.0
-1.5
-1.0
-0.5
0.0
0.00 0.20 0.40 0.60 0.80 1.00
(c)Relative concentration
0.00 0.01 0.02 0.03 0.04 0.05
Dep
th (
cm)
-3.0
-2.5
-2.0
-1.5
-1.0
-0.5
0.0
0.00 0.20 0.40 0.60 0.80 1.00
(d)Relative concentration
0.00 0.01 0.02 0.03 0.04 0.05
Dep
th (
cm)
-3.0
-2.5
-2.0
-1.5
-1.0
-0.5
0.0
0.00 0.20 0.40 0.60 0.80 1.00
(e)Relative concentration
0.00 0.01 0.02 0.03 0.04 0.05
Dep
th (
cm)
-3.0
-2.5
-2.0
-1.5
-1.0
-0.5
0.0
0.00 0.20 0.40 0.60 0.80 1.00
(f)Relative concentration
0.00 0.01 0.02 0.03 0.04 0.05
Dep
th (
cm)
-3.0
-2.5
-2.0
-1.5
-1.0
-0.5
0.0
0.00 0.20 0.40 0.60 0.80 1.00
(g)Relative concentration
0.00 0.01 0.02 0.03 0.04 0.05
Dep
th (
cm)
-3.0
-2.5
-2.0
-1.5
-1.0
-0.5
0.0
0.00 0.20 0.40 0.60 0.80 1.00
(h)Relative concentration
0.00 0.01 0.02 0.03 0.04 0.05
Dep
th (
cm)
-3.0
-2.5
-2.0
-1.5
-1.0
-0.5
0.0
0.00 0.20 0.40 0.60 0.80 1.00
(i)Relative concentration
0.00 0.01 0.02 0.03 0.04 0.05
Dep
th (
cm)
-3.0
-2.5
-2.0
-1.5
-1.0
-0.5
0.0
0.00 0.20 0.40 0.60 0.80 1.00
Fig. 4. Number of observed luminophore pixels (dots, upper x-axis) and equivalent aggregated data used for the modelsimulations (open circles, lower x-axis) plotted against sediment profile depth (y-axis) for the images shown in Fig. 3. Data are
expressed as relative concentrations

Solan et al.: In situ quantification of bioturbation using f-SPI
output from Pdiff. The form of the Pnl also tracked that ofPobs much more closely, allowing significant amountsof tracer to precede the tracer front,although there was increasing error atdepths > 2.0 cm (Fig. 5).
Calculation of the reworking activityconstant on a frame-by-frame basis (Fig.6) revealed large differences in theextent of bioturbation during the timeinterval between each image. Thesediscrete values of a fluctuated widelybetween each image step, spanningapproximately 4 orders of magnitude(10–6 to 10–2) during the first 5 h of thef-SPI deployment and reducing to ap-proximately 3 orders of magnitude(10–3 to 100) for the remaining 11 h
of the sequence. Nevertheless, a remained within anorder of magnitude of the Pnl estimate based on thefinal image (i.e. 5.23 × 10⁻² cm–1 yr–1; dashed line inFig. 6) for 55% of the image steps, suggesting that thisthreshold was an appropriate descriptor of typicalreworking activity levels. Departures in a away fromthis threshold appeared to be associated with discreteperiods of atypical bioturbation, either caused byincreased (a → 102) or decreased (a → 10–6) bouts ofHyas araneus activity. Subsurface particle displace-ment caused by physical processes or other infaunalinvertebrates appeared to be insignificant.
DISCUSSION
For establishing how the reworking activities ofbenthic infauna affect the storage and transport ofsediment particles and porewater solutes, it is neces-sary to determine not only the rate of bioturbation,but also the mechanistic nature of biogenically medi-ated particle transport. Such information is necessaryfor conceptual mathematical models that aid indeciphering the precise characteristics of organism-sediment relations. The combined approach adoptedwithin our experiment provided a new means withwhich to non-invasively visualise and quantify in situsubsurface infaunal activity, at a spatial and temporalresolution previously not obtained for a particulatetracer. While the tracer profiles obtained allow eventhe smallest changes (<78 µm) in particle distribution
9
Fig. 6. Discrete reworking activity constant,a, calculated on a frame-by-frame basis.Fluctuations denote discrete periods of atypi-cal bioturbation, either caused by increased(a → 102) or decreased (a → 10–6) bouts ofHyas araneus activity. The non-local pre-diction for the final image is presented
(dashed line) for comparison
Fig. 5. Comparison of the observed luminophore activityprofile (—–d—–) obtained from the final f-SPI (fluorescencesensitive time-lapse sediment profile imaging camera) im-age (Frame 97) after 950 min with the modelled predictions(—–s—–) of the biodiffusive model (- - - - -) and the non-local
model (– – – – –)
acm
–1yr
–1

Mar Ecol Prog Ser 271: 1–12, 2004
to be observed, the images provided the opportunityto consider unpredictable and discrete behaviouralmixing events. This ability is not trivial, for it allowsdiscrete events that cause particle redistribution overlength steps greater than diffusional differences tobe quantified and taken into account during theformalisation of suitable mathematical models ofbioturbation.
The in situ f-SPI observations of infaunal behaviourrevealed little activity below the sediment-water inter-face, despite high abundances of several species (e.g.Amphiura filiformis, A. chiajei, Nephtys hombergii)that are capable of considerable levels of bioturbation.Instead, the activities of the brachyuran crab Hyasaraneus were clearly responsible for almost all of theobserved luminophore particle redistribution. Thisspecies is commonly found at low densities (e.g.Mathieson & Berry 1997) in temperate coastal regions(Dyer 1985), where it is an important member of theepibenthic scavenging community (Nickell & Moore1992a,b). While it is possible that the presence of theSPI assembly may have acted as a refuge and attractedthis species to the camera, the patterns of bioturbationobserved are nevertheless informative and of generalapplicability. Indeed, the f-SPI images revealed thatH. araneus was seldom stationary and, although it didnot actively burrow into the sediment profile, thecontinual repositioning of the walking legs resulted ina significant amount of particle displacement. Themechanics of each walking leg movement could beclearly visualised during playback of the time-lapsesequence, generating a piston-like redistribution ofparticles at an oblique angle relative to the sediment-water interface. Preliminary measurements from theimages estimate that as much as ~0.30 cm3 of sedimentmay be displaced and transported to ≤2.5 cm deptheach time one adult walking leg is repositioned. Whilethese events may be punctuated with respect to time,they are certainly not rare, and their relative impor-tance has not been previously appreciated; the non-local transport of particles from the sediment surface todepth is likely to have a disproportionate influence onthe amount of recently settled organic material thatbecomes incorporated into the sediment profile. Theseshort-lived discrete events may be, at least temporar-ily, of greater importance to local nutrient cycling bud-gets than the contribution from the background levelof bioturbation.
The adopted image analysis routine successfullyallowed the optical recovery of luminophores and sub-sequent calculation of Db. This process was rapid(<2 wk for 96 profiles) and avoided the practical diffi-culties of tracer recovery associated with core slicing,although tracer enumeration from SPI imagery islikely to underestimate particle mixing because some
luminophores may become horizontally displacedaway from the camera face-plate and no longer beimaged. The values for Db obtained with this techniqueare therefore likely to provide a conservative estimateof bioturbation. Despite this fact, the Db values ob-tained here confirmed that bioturbation by Hyasaraneus was extensive (Db = 1.26 × 102 cm2 yr–1) andconsistent with the upper range of many estimates forentire subtidal communities (for review, see Matissoff1982), although the images from the f-SPI indicatedthat a non-local mode of particle transport would forma more appropriate mechanistic description of crabactivity. Tracers were transported rapidly over dis-tances of cm in a manner that could not be related to adiffusive concentration gradient. Although bioturba-tion by decapod crustaceans has previously been mod-elled in a non-local manner, it has only been done for aspecific set of circumstances. Boudreau & Imboden(1987) and Gardner et al. (1987), for example, describea form of particle redistribution induced by fiddlercrabs as ‘burrow and fill’ or ‘regeneration’ mixing. Inthese models, vertical or near vertical tubes in the sed-iment profile are opened by the crab walking legs andfilled with slumping material from a superficial surfacelayer. The model they used, however, assumed that thesurface layer is not depleted by the burrowing activityof the organism. As this contrasts to the present study,where the upper layer of sediment is significantlydepleted, a symmetric non-local model is more realis-tic. Using this method, the reworking activity constant,a, formed a much closer fit with the observed profilesof luminophore tracer. Moreover, comparison of thevalue of a on a frame-by-frame basis provided a meanswith which to identify the frequency and magnitude ofdisplacement events, i.e. discrete periods of atypicalbioturbation, caused by either increased (a → 102)or decreased (a → 10–6) bouts of H. araneus activitycould be distinguished from background levels ofbioturbation (a = 5.23 × 10⁻² cm–1 yr–1).
Consideration of behaviourally driven tracer mixingover short timescales is essential to the understandingof the fate of organic matter and other important con-stituents of the sediment profile. As the burial of parti-cles is unpredictable, the adoption of a diffusive ana-logy averaged over extended time periods is likely tolead to an inaccurate classification of benthic activity(for exceptions, see Shull 2001, Shull & Yasuda 2001).One alternative method has been the formulation ofcomplex models tailored towards particular species orfunctional types (e.g. François et al. 1997, 2002); how-ever, this approach cannot readily contribute to com-parative syntheses of measurements made in differentlocales or at different times. Use of a simple non-localmodel, such as the one adopted in the present study,can simulate behaviourally driven tracer mixing with
10

Solan et al.: In situ quantification of bioturbation using f-SPI
realistic length scales, whilst remaining applicable tomore than one case study. An exponential function wasused to determine exchange coefficients to simulatethe greater exchange of particles between near andadjacent boxes than those between distant boxes. Aniteratively determined activity constant allowed thestrength of this mixing function to be varied to accountfor periods of faunal activity and quiescence. Our studydemonstrates that f-SPI is capable of providing thenecessary data on the frequency and length scales ofdiscrete bioturbation events, allowing the parametersin bioturbation models to be directly related to infaunalactivity. Combined with such readily available real-time data for tracer reworking, non-local modellinghas the potential for exchange functions to be derivedthat closely mimic behaviourally driven particle redis-tribution. In this way, the necessary ethological infor-mation required to understand organism-sedimentrelationships can inform and improve capability inpredictive modelling.
Acknowledgements. We are indebted for the provision offacilities and technical support received through the EUfunded Access to Research Infrastructure (ARI) programme,hosted by Kristineberg Marine Research Station, Sweden. Wethank A. Mustard (George Deacon Division, Southampton)for advice on optical filters. Constructive remarks on themanuscript from F. J. R. Meysman and 3 other anonymousreferees are gratefully acknowledged. A copy of the f-SPIimages, movies and image analysis macros can be obtainedfrom the authors.
LITERATURE CITED
Aller RC (1982) The effects of macrobenthos on chemicalproperties of marine sediment and overlying water. In:McCall PL, Tevesz MJS (eds) Animal-sediment rela-tions—the biogenic alteration of sediments. Topics in geo-biology, Vol 2. Plenum Press, New York, p 53–102
Aller RC (1994) Bioturbation and remineralization of sedi-mentary organic matter: effects of redox oscillation. ChemGeol 114:331–345
Aller RC, Yingst JY (1985) Effects of the marine deposit-feed-ers Heteromastus filiformis (Polychaeta), Macoma balthica(Bivalvia) and Tellina texana (Bivalvia) on averagedsedimentary solute transport, reaction rates and microbialdistributions. J Mar Res 43:615–645
Anderson FØ, Kristensen E (1991) Effects of burrowing macro-fauna on organic matter decomposition in coastal marinesediments. Symp Zool Soc Lond 63:69–88
Berg P, Rysgaard S, Funch P, Sejr MK (2001) Effects of biotur-bation on solutes and solids in marine sediments. AquatMicrob Ecol 26:81–94
Biles C, Solan M, Isaksson I, Paterson DM, Emes C, RaffaelliDG (2003) Flow modifies the effect of biodiversity onecosystem functioning: an in situ study of estuarine sedi-ments. J Exp Mar Biol Ecol 285/286:165–177
Blair NE, Levin LA, DeMaster DJ, Plaia G (1996) The short-termfate of fresh algal carbon in continental slope sediments.Limnol Oceanogr 4:1208–1219
Boudreau BP (1986) Mathematics of tracer mixing in sedi-ments. II: Non-local mixing and biological conveyor beltphenomena. Am J Sci 286:199–238
Boudreau BP, Imboden D (1987) Mathematics of tracer mixingin sediments. III: The theory of non-local mixing withinsediments. Am J Sci 287:693–719
Cadée GC (1976) Sediment reworking by Arenicola marinaon tidal flats in the Dutch Wadden Sea. Neth J Sea Res 10:440–460
Crank J (1975) The mathematics of diffusion. Oxford Univer-sity Press, Oxford
Diaz RJ, Cutter GR Jr (2001) In situ measurement of organ-ism-sediment interaction: rates of burrow formation/aban-donment and sediment oxidation/reduction. In: Aller JY,Woodin SA, Aller RC (eds) Organism-sediment interac-tions. Belle W. Baruch Library in Marine Science. Univer-sity of South Carolina Press, Columbia, SC, p 19–32
Dyer MF (1985) The distribution of Hyas araneus (L) and Hyascoarctatus Leach (Crustacea, Decapoda, Brachyura) in theNorth sea and the Svalbard region. J Mar Biol Assoc UK65(1):195–201
Fisher JB, Lick WL, McCall PL, Robbins JA (1980) Verticalmixing of lake sediments by tubificid oligochaetes. J Geophys Res 85:3997–4006
Forster S, Graf G (1995) Impact of irrigation on oxygen fluxinto the sediment: intermittent pumping by Callianassasubterranea and ‘piston-pumping’ by Lanice conchilega.Mar Biol 123:335–346
Forster S, Khalili A, Kitlar J (2003) Variation of nonlocal irriga-tion in a subtidal benthic community. J Mar Res 61:335–357
François F, Poggiale JC, Durbec JP, Stora G (1997) A newapproach for the modelling of sediment reworking in-duced by a macrobenthic community. Acta Biotheor 45:295–319
François F, Gerino G, Stora G, Durbec JP, Poggiale JC (2002)Functional approach to sediment reworking by galleryforming macrobenthic organisms: modelling and appli-cation with the polychaete Nereis diversicolor. Mar EcolProg Ser 229:127–136
Furukawa Y, Bentley SJ, Lavoie D (2001) Bioirrigation model-ling in experimental benthic mesocosms. J Mar Res 59:417–452
Gardner LR, Sharma P, Moore WS (1987) A regenerationmodel for the effect of bioturbation by fiddler crabs on210Pb profiles in salt marsh sediments. J Environ Radioact5:25–36
Gerino M, Aller RC, Lee C, Cochran JK, Aller JY, Green MA,Hirschberg D (1998) Comparison of different tracers andmethods used to quantify bioturbation during a springbloom: 234-thorium, luminophores and chlorophyll a. EstuarCoast Shelf Sci 46:531–547
Gilbert F, Rivet L, Bertrand JC (1994) The in vitro influence ofthe burrowing polychaete Nereis diversicolor on the fateof petroleum hydrocarbons in marine sediments. Chemo-sphere 29:1–12
Gilbert F, Hulth S, Strömberg N, Ringdahl K, Poggiale JC(2003) 2-D optical quantification of particle reworkingactivities in marine surface sediments. J Exp Mar Biol Ecol285/286:251–263
Gray JS (1974) Animal-sediment relationships. Oceanogr MarBiol Annu Rev 12:223–261
Green MA, Aller RC, Cochran JK, Lee C, Aller JY (2002) Bio-turbation in shelf/slope sediments off Cape Hatteras,North Carolina: the use of 234Th, Chl-a, and Br– to evaluaterates of particle and solute transport. Deep-Sea Res II 49:4627–4644
Hughes DJ, Ansell AD, Atkinson RJA (1996) Sediment bio-
11

Mar Ecol Prog Ser 271: 1–12, 2004
turbation by the echiuran worm Maxmuelleria lankesteri(Herdman) and its consequences for radionuclide disper-sal in Irish Sea sediments. J Exp Mar Biol Ecol 195(2):203–220
Jones SE, Jago CF (1993) In situ assessment of sediment prop-erties by burrowing invertebrates. Mar Biol 115:133–142
Mahaut ML, Graf G (1987) A luminophore tracer techniquefor bioturbation studies. Oceanol Acta 10:323–328
Mathieson S, Berry AJ (1997) Spatial, temporal and tidal vari-ation in crab populations in the Forth estuary, Scotland.J Mar Biol Assoc UK 77(1):167–183
Matisoff G (1982) Mathematical models of bioturbation.In: McCall PL, Tevesz MJS (eds) Animal-sedimentrelations—the biogenic alteration of sediments. Topicsin geobiology, Vol 2. Plenum Press, New York, p289–330
Meadows PS, Tufail A (1986) Bioturbation, microbial activityand sediment properties in an estuarine ecosystem. Proc RSoc Edinb B 90:129–142
Meysman FJR, Boudreau BP, Middelburg JJ (2003) Relationsbetween local, nonlocal, discrete and continuous modelsof bioturbation. J Mar Res 61:391–410
Nickell TD, Moore PG (1992a) The behavioural ecology ofepibenthic scavenging invertebrates in the Clyde seaarea—laboratory experiments on attractions to bait instatic water. J Exp Mar Biol Ecol 156(2):217–224
Nickell TD, Moore PG (1992b) The behavioural ecology ofepibenthic scavenging invertebrates in the Clyde seaarea—laboratory experiments on attractions to bait inmoving water, underwater TV observations in situ andgeneral conclusions. J Exp Mar Biol Ecol 159(1):15–35
Rhoads DC (1974) Organism-sediment relations on the muddysea floor. Oceanogr Mar Biol Annu Rev 12:263–300
Rhoads DC, Boyer LF (1982) The effects of marine benthos onphysical properties of sediments. A successional perspec-tive. In: McCall PL, Tevesz MJS (eds) Animal-sedimentrelations—the biogenic alteration of sediments. Topics ingeobiology, Vol 2. Plenum Press, New York, p 3–52
Rhoads DC, Cande S (1971) Sediment profile camera for in situstudy of organism-sediment relations. Limnol Oceanogr16:110–114
Richter R (1952) Fluidal-texture in Sediment-Gesteinen undober Sedifluktion überhaupt. Notizbl Hess LandesamtesBodenforsch Wiesbaden 3:67–81
Rowden AA, Jones MB, Morris AW (1998) The role of Callia-nassa subterranea (Montagu) (Thalassinidea) in sedimentresuspension in the North Sea. Cont Shelf Res 18:1365–1380
Sandnes J, Forbes T, Hansen R, Sandnes B, Rygg B (2000) Bio-turbation and irrigation in natural sediments, describedby animal-community parameters. Mar Ecol Prog Ser 197:169–179
Shull DH (2001) transition-matrix model of bioturbation andradionuclide diagenesis. Limnol Oceanogr 46:905–916
Shull DH, Yasuda M (2001) Size-selective downward particletransport by cirratulid polychaetes. J Mar Res 59:453–473
Solan M, Kennedy R (2002) Observation and quantificationof in situ animal-sediment relations using time-lapsesediment profile imagery (t-SPI). Mar Ecol Prog Ser 228:179–191
Wheatcroft RA, Jumars PA, Smith CR, Nowell ARM (1990) Amechanistic view of the particulate biodiffusion coeffi-cient: step lengths, rest periods and transport directions. JMar Res 48:177–207
Wheatcroft RA, Olmez I, Pink FX (1994) Particle bioturbationin Massachusetts Bay: preliminary results using a newdeliberate tracer technique. J Mar Res 52:1129–1150
12
Editorial responsibility: Otto Kinne (Editor), Oldendorf/Luhe, Germany
Submitted: September 19, 2003; Accepted: January 27, 2004Proofs received from author(s): March 26, 2004