in situ diffraction study of the high ... - materialsnsf/papers/krogstad-htxrd-jacers14.pdf · in...
TRANSCRIPT

Accepted for Publication in the Journal of the American Ceramics Society, August 2014
In situ Diffraction Study of the High-Temperature Decomposition of t’-Zirconia
Jessica A. Krogstad*,†,‡, Yan Gao§, Jianming Bai¶, Jun Wang¶, Don M. Lipkin§, Carlos G. Levi*
* Materials Department, University of California, Santa Barbara, California, USA § General Electric Global Research Center, Niskayuna, NY, USA
¶ National Synchrotron Light Source, Brookhaven National Laboratory, Brookhaven, NY, USA _________________________________________________________________
The mechanisms of phase destabilization upon aging of the metastable t’ phase of yttria stabilized zirconia (YSZ) are poorly understood, despite its broad application in thermal barrier coatings (TBC). To provide insight, synchrotron X-ray diffraction (XRD) with a quadrupole lamp furnace is used to examine the temperature response, including thermal expansion and phase evolution, of a 9 mol% (8 wt.%) YO1.5 t’-8YSZ. The thermal expansion of equilibrated YSZ powders ranging from 0 to 18.4 mol% YO1.5 is also investigated to better understand the effect of composition on the thermal expansion anisotropy. The T0(c/t) temperature for t’-8YSZ is estimated to be 1640ºC. Full decomposition of the t’ phase into a coherent mixture of a Y-lean tetragonal phase (t) and a Y-rich cubic phase (c) that coarsen over time is observed at elevated temperatures; however, upon quenching, the t’ phase reappears in the diffraction profile. This supports our evolving understanding that the t’ phase observed by XRD in aged samples is a microstructural artifact due to the coherency strain between the t and c phases.
Keywords: Zirconia, phase stability, high-temperature diffraction, thermal barrier coating, YSZ
† Author to whom correspondence should be addressed. e-mail: [email protected] ‡ Present address: Materials Science and Engineering Department, University of Illinois, Urbana, Illinois, USA

Krogstad, et al. : Decomposition of t’-Zirconia at High Temperature Page 2 ——————————————————————————————————————————-
1. Introduction
The desirable properties of 7-8 wt% Y2O3 (7.6-8.7 mol%YO1.5) stabilized zirconia (7-8YSZ) are attributed to a metastable tetragonal phase—t’-YSZ.1,2 To date, this system has outperformed all other options for thermal barrier coatings (TBCs) in advanced gas turbine engines.3 Environmental and economic demands have motivated development of hotter-operating engines, and with this, the durability and longevity of 7YSZ TBCs may be compromised by factors including attack by molten siliceous debris, limited toughness, and destabilization of the metastable t’ solid solution into the equilibrium yttria-rich cubic (c) and yttria-lean tetragonal (t) phases.3,4 Because t-YSZ is reversibly transformable to the monoclinic (m) phase upon thermal cycling, such transformations can lead to microcracking (due to the associated volume change) and subsequent loss of TBC mechanical integrity.4 The diffusion kinetics of Y3+ cations are sufficiently slow under historical operating conditions that the phase evolution of the t’ phase has been considered largely inconsequential. However, this degradation would be accelerated at the higher temperatures expected in future engines. On this basis, there is renewed impetus for in-depth understanding of the phase evolution of t’-YSZ so as to better assess its high-temperature (and long-time) capability limits.
Traditionally, X-ray diffraction (XRD) techniques have been used to study the changing phase composition of aged t’-YSZ.5-20 This method is convenient, but when used alone, has certain shortcomings.20,21 Most studies report that the t’ phase fraction gradually declines and is replaced by a mixture of yttria-lean and yttria-rich phases; the number and definition of these phases vary and depend heavily on the angular resolution of the x-ray source used and the method of refinement. However, recent work21 has shown that the t’ phase rapidly decomposes into a coherent array of nano-scale Y-rich and Y-lean domains—a process not resolvable via XRD until much later in the aging process, when phase coarsening leads to loss of coherency. This same study reconciled these apparently conflicting observations by positing the existence of a pseudo-t’ phase, resulting from the interspersed Y-lean and Y-rich nano-domains mutually strained into tetragonal symmetry having lattice parameters close to the original t’ phase.
When studied at room temperature by XRD, phase evolution of t’-YSZ after the phases become distinguishable may require analysis of up to five distinct phasesa for an adequate pattern refinement, as discussed elsewhere.20 The complexity of room-temperature results can thus overshadow effects of coherency at elevated temperatures, while missing any influence of anisotropic thermal expansion in the tetragonal phases.12,16,22-24 The goal of the present study is
a See further description in Section 3.2.

Krogstad, et al. : Decomposition of t’-Zirconia at High Temperature Page 3 ——————————————————————————————————————————-
to provide direct insight into the phase evolution mechanisms by an in-situ high temperature XRD approach that combines access to relevant temperatures with rapid heating and cooling rates as well as high angular resolution necessary to follow this complex, dynamic phase evolution. This would avoid the complications introduced by the phase transformations upon cooling and thus help validate and improve the understanding of the microstructure evolution21,25 previously inferred from interpretation of room temperature XRD phase analysis.20
2. Experimental Procedure
Two sets of experiments were performed on a range of YSZ powders: (i) extraction of thermal expansion behavior as a function of composition and temperature and (ii) in situ observation of phase evolution of t’-8YSZ. These experiments are described in sequence below.
The thermal expansion experiments were conducted using five commercially available powders fabricated by Tosoh (Tokyo, Japan) and a crushed t’-8YSZ air plasma sprayed thermal barrier coating (APS TBC). The measured compositions of these materials are listed in Table I, as determined via inductively coupled plasma mass spectrometry (ICP-MS) by Dirats Laboratories Inc. (Westfield, MA). A quadrupole lamp furnace (QLF), first described by Siah et al.,26,27 represents the state-of-the-art in high temperature in situ XRD and was used in this experiment. The specimen is placed in the focal point of four lamps, enabling specimen temperatures up to 1700ºC. An internal standard is necessary to determine the sample temperature; therefore, each oxide powder was mixed with 10wt% Pt powder (0.15µm-0.45µm 99.9%, Sigma-Aldrich, St. Louis, MO), and loaded into a single crystal sapphire capillary having an inner diameter of 0.58mm. The ends of the sapphire tube were sealed using high temperature cement (Ultra-Temp 516; Aremco Products, Inc., Valley Cottage, NY) before mounting to the alumina support tubes. The sample fixture was then loaded and aligned in the goniometer and furnace.
Variable temperature powder diffraction patterns were collected at Beamline X14A at the National Synchrotron Light Source, Brookhaven National Laboratory. The incidence x-ray energy was 17 keV and the wavelength of 0.073795 nm was calibrated using NIST SRM 660a LaB6. A typical dataset was collected in 3.5 minutes over a range of 22º (12º ≤ 2θ ≤ 34º), using steps of 2 degrees and a counting time of 10 seconds per step with a Si-strip position sensitive detector. The combined use of intense synchrotron beam, capillary configuration associated with the QLF, and the fast Si-strip detector is an ideal choice for achieving high angular resolution as well as high-speed data collection for in situ measurements.

Krogstad, et al. : Decomposition of t’-Zirconia at High Temperature Page 4 ——————————————————————————————————————————-
It was clear from analysis of room temperature data that the as-received TZ-3 and TZ-6 powders were not fully homogenized. These powders were therefore equilibrated at the temperatures recorded in Table I using the QLF. After sample homogenization, the specimens were quenched to room temperature and realigned with the beam and furnace to ensure coincidence of the furnace hot zone (~2mm x 2mm) and the beam (1mm x 2mm). A reference room temperature pattern was collected to determine the initial Pt lattice parameter, ao. The samples were gradually heated in 12 temperature increments with a pattern collected at each step. After heating, the specimen was rapidly cooled to room temperature by switching off the furnace and an additional room temperature pattern was collected. The lattice parameter of Pt at each step was refined using JADE (Materials Data, Inc., Livermore, CA) and the specimen temperature, T, was calculated based on the known thermal expansion of Pt, given by27
(1)
where T is in degrees Kelvin.
The in situ phase evolution experiments examined only the t’-8YSZ APS TBC, which was crushed and mixed with the same Pt internal standard used previously. The experimental configuration was identical; however, different heating and cooling trajectories were used. One sample, henceforth TBC-1b, was heated to the maximum temperature in 25 steps, collecting a full scan (12º ≤ 2θ ≤ 34º) at each step, then cooled at the same rate, again collecting a full scan at each step. An example of the calibrated temperature profile is plotted in Figure 1(a). A second sample, TBC-2, was rapidly heated to 1529ºC and held isothermally for 3.25 hours. 108 patterns were collected over a narrow angular range (26.7º ≤ 2θ ≤ 27.6º) to follow the phase transformation. The sample was rapidly quenched to 300ºC and held for an additional 3.5 hours during which 78 patterns were collected over the same angular range. This procedure was repeated on a third specimen, TBC-3, for which the hold temperature was 1609ºC.
Room temperature full scans (12º ≤ 2θ ≤ 34º) were analyzed via Rietveld’s refinement method28 using the GSAS software29 with the EXPGUI graphical interface,30 providing baseline lattice parameters for the YSZ phases. The background was fit manually and the line profiles were fit using a pseudo-Voigt function. Teufer’s31 structural model for zirconia, based on the primitive tetragonal cell (P42/nmc)c, was used during the refinement process. The undistorted
b The APS TBC specimens that were crushed and studied here were taken from the same batch of coatings used
in 20,25 in which they were denoted as APS2 (see Table I). TBC-1, -2, -3, are used here to denote different specimens of the same initial feedstock, composition and microstructure.
c Note that when tetragonality (c/a) is discussed, a pseudo-cubic setting (apc = at√2) is used to facilitate comparison with the cubic phase.
!a ao( ) = 8.8099"10#4 T # 293( )+18.047"10#8 T # 293( )2 # 2.5619"10#11 T # 293( )3

Krogstad, et al. : Decomposition of t’-Zirconia at High Temperature Page 5 ——————————————————————————————————————————-
fluorite or cubic structural model, , was described by Howard.32 For the elevated temperature scans, the phase fractions were calculated by profile-fitting of characteristic tetragonal and cubic peaks, (103)t, (211)t, and (311)c using the JADE software (Materials Data Incorporated, Livermore, CA). The commonly used (220)t/(004)t/c/(400)c triplet suffered from poorer signal/noise in the high-temperature measurements due to background intensity from the sapphire capillary tube. As Rietveld refinement favors the more intense peaks while being less sensitive to subtle changes of the high-angle and weaker peaks, profile fitting at higher temperatures was chosen over Rietveld refinement for quantification.
3. Results
Presentation of the results and discussion will be structured around the two sets of experiments as noted above. The thermal expansion behavior was observed as both a function of temperature and composition. This behavior has been previously documented for some of the compositions studied here;12,16,22-24 however, it is reviewed in the context of the present results as it provides an important baseline for the lattice parameters of the evolving phases in the second set of experiments. Accurate extraction of high temperature lattice parameters aids in phase identification as well as providing unique insight into the phase evolution process.
3.1. Thermal Expansion
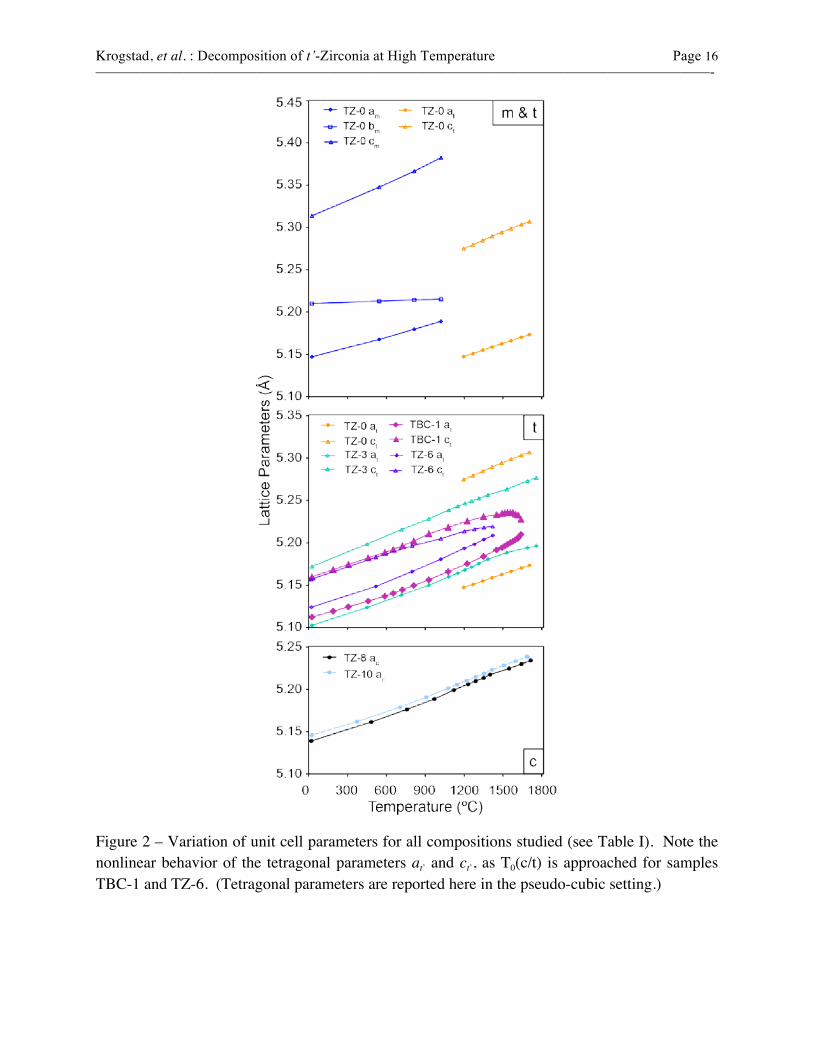
The evolution of several YSZ unit cell parameters with increasing temperature is depicted in Figure 2. With the exception of bm, the lattice parameters of the monoclinic, tetragonal and cubic phases generally increase significantly with temperature (e.g Table I). The linear coefficient of thermal expansion, α, for each composition and lattice parameter, was found by plotting (Δl/lo) vs. ΔT and extracting the slope.d In all cases except for TZ-0 (pure zirconia), the linear fit was valid only below about 1400ºC. These values are summarized in Table II. The behavior of the cubic lattice parameter is consistent with previous reports.33 For TBC-1 and TZ-6, the tetragonal parameters a and c converge with increasing temperature (this convergence is also expected for the other tetragonal compositions at temperatures above those investigated here). This previously documented phenomenon12 is more evident when plotting the tetragonality (c/a) against temperature, as shown in Figure 3. The parameter a increases with temperature more rapidly than c, leading to a maximum in tetragonality, which precedes the transition to the cubic phase at T0(c/t), often by several hundred degrees Celsius.e The
d Here l is a generic lattice parameter. The linear coefficient of thermal expansion was calculated for each
unique lattice parameter for each detected phase. e T0(c/t) denotes the temperature at which the free energy of the tetragonal and cubic phases are equal for a given
composition—see Figure 4. Above this temperature, the cubic phase is thermodynamically favored.
Fm3m

Krogstad, et al. : Decomposition of t’-Zirconia at High Temperature Page 6 ——————————————————————————————————————————-
observations in this study agree well with previously published data12 (also included in Figure 3). The maximum tetragonality for each composition was calculated based on a polynomial fit to the data and is superimposed on the ZrO2-YO1.5 phase diagram in Figure 4. The implications of these trends for phase stability will be discussed in Section 4.1.
3.2. Phase Evolution
Because the monoclinic phase is only present in negligible amounts the phase evolution data is presented in terms of four discernible phases: t, t’, t” and c. The t and c phases correspond essentially to the equilibrium Y-lean and Y-rich phases, respectively, and the t” phase is derived from the c phase upon cooling through T0(c/t).25 Because t” obtains from a highly stabilized composition, it has a very low degree of tetragonality making it difficult to distinguish between the c and t” phases via conventional XRD.25 This problem is partially circumvented in the present study by the use of high intensity light sources. The true nature of the observed t’ phase has been previously postulated21 and will be discussed in more depth in Section 4.
3.2.1. Slow Heating
Figure 1 illustrates the evolution of the XRD profile during heating and cooling for the first APS TBC sample investigated, TBC-1. Because the heating and cooling rates were faster at lower temperatures, the changes of peak position in Figure 1(b) don’t appear linear, following the temperature profile of Figure 1(a). The highest temperature reached was 1696°C according to the internal Pt calibration. With increasing temperature, the two tetragonal peaks, (103)t’ and (211)t’, gradually converged into a single peak, (311)c’, as illustrated in Figure 1(c). It became impossible to distinguish the individual peak positions of the initial t’ phase above 1638°C. Concomitantly, an additional tetragonal phase, with larger tetragonality than that of t’, developed with increasing temperature, as indicated by arrows in Figure 1(c). This incipient t phase appeared around 1400°C, as suggested by the diffuse intensity bands in Figure 1(a), but the peak positions could not be determined with confidence until the sample was above 1600°C. Between 1638ºC and 1696ºC, the XRD pattern can be described as a combination of a cubic (c’)f reflection in the middle, bounded on both sides by tetragonal (t) peaks with larger c/a (i.e. lower Y content) than the original t’. (The fit, however, is not completely satisfactory because it does not account for the broad shoulders between the c’ and t peaks, indicated by the arrows in Figure 5(a)). To assure that the speed of measurements was adequate to capture the phase
f Here c’ is used much in the same way t’ is used to indicate a phase with the same crystallographic structure but
composition that differs from the equilibrium phase.

Krogstad, et al. : Decomposition of t’-Zirconia at High Temperature Page 7 ——————————————————————————————————————————-
transformation, three scans were repeated at 1659°C, over a period of 15 min, and gave almost identical diffraction patterns.
Examination of the diffraction profile in Figure 1(b) and the fit profiles in Figure 5(a,b) reveals that the phase evolution upon cooling was not a simple reversal of what had happened on heating. As expected, the cubic (c) and tetragonal (t) phases formed in the later stages of heating were retained down to room temperature. However, peaks consistent with the original t’-phase gradually reappeared on cooling, becoming resolvable below 1586°C. Also, a tetragonal t” phase, crystallographically identical to the initial t’ phase but distinct in composition,25 formed on cooling. The peak positions for the cubic (c) and three tetragonal phases (t, t’, t”) were readily discernible in the diffraction pattern from data collected below 1420°C. The presence of the c and t peaks across the entire temperature range is clearly evident in Figure 1(b), but the relative intensity of the t peaks increases on cooling as shown by comparing Figure 5(a) and (b). Exclusion of the t’ peaks (located between c and t peaks) results in a poor profile fit, as illustrated in Figure 5(c), supporting the view that t’ appears to have re-formed on cooling. At room temperature, the c/a inferred from the two t’ peaks, if present, is 1.0102, corresponding to 8.52 mol% of YO1.5 based on the relationships established in 34. Also note that there was only a small amount, 0.6 wt%, of monoclinic phase observed at room temperature at the end of this heating cycle.
The t’ lattice parameters on heating and cooling are plotted in Figure 6(a). On cooling to room temperature, at’ and ct’ decrease at nearly the same rate, and therefore, c/a decreases by only 0.3% rather than the nearly 1% change observed upon heating. The change of the cubic lattice parameter a on cooling from 1696°C follows almost a perfect linear relation with the temperature, Figure 6(b), and its slope (Table II) is comparable with the cubic thermal expansion rate on heating.
3.2.2. Rapid Heating
It is clear that some phase segregation occurred during slow heating/cooling of TBC-1; therefore, a faster ramp rate with a hold time at high temperature was chosen for samples TBC-2 and TBC-3, to isolate the phase evolution process to a single isotherm. Starting with an un-aged specimen, TBC-2, a target temperature of 1529ºC was selected so as to be below the estimated T0(c/t)-curve (see Figure 4); however, this target was overshot due to the accelerated heating rate and limitations of the feedback control system. The maximum temperature reached during this brief excursion (about 1 min), which is above the melting point of the Pt internal standard, was estimated by using the peak position of (222)c based on the known thermal expansion behavior

Krogstad, et al. : Decomposition of t’-Zirconia at High Temperature Page 8 ——————————————————————————————————————————-
of the cubic phase. The overshoot temperature for the first diffraction pattern was +297°C, corresponding to 1826ºC. The temperatures reached during this transient were well above the expected T0(c/t)-line (but still within the two-phase field), providing an opportunity to independently estimate this important thermodynamic temperature. The structural changes at discrete steps from 1826ºC to the target temperature of 1529ºC are depicted by the diffraction profile in Figure 7(a). There is a clear transition from a single c’ phase at 1826°C to a more complex tetragonal profile at 1577°C, which is noticeable by superimposing the patterns after accounting for any shifting due to thermal expansion—Figure 7(b). Careful inspection of the diffraction profiles in Figure 7(b) reveals that the transition from a single cubic peak to a bimodal peak (fit by two overlapping tetragonal peaks), falls between 1660ºC and 1632ºC. The T0(c/t) temperature for the original t’ composition of 8.97 mol%YO1.5 (Table I) is therefore estimated to be ~1640ºC. This is slightly higher than the CALPHAD35 generated T0(c/t) curve depicted in Figure 4, but the overall agreement is still quite reasonable.
The evolution of the diffraction profile in the first 180 minutes after the temperature equilibrated at 1529ºC is given in Figure 8(a,b). Initially, the pattern can be described with a single t’ phase. As time progresses, the initially broad shoulders become more intense and the central peak broadens due to the appearance of the c phase. The optimized fit suggests that the putative t’ phase never fully disappears at this temperature. After 194 minutes (3.2 h), the sample was quenched rapidly (< 1 min) to 300ºC. The profiles at 1529ºC and 300ºC are compared in Figure 5(d-f), where the intensity of the t’ peaks has increased significantly (Figure 5(e)) relative to those of the t” and t phases. No additional changes were observed after 120 minutes at 300ºC.
A third sample from the crushed APS coating, TBC-3, was treated in a similar fashion. The isothermal soak temperature for this sample was 1609ºC, closer to T0(c/t), with an initial overshoot to 1878ºC. The phase evolution in the first 180 minutes at 1609ºC is given in Figure 8(c,d). Broad shoulders between the c and t peaks still exist but additional tetragonal peaks could not be successfully fit in these regions. Upon rapid cooling to 300ºC, similar, but more pronounced, changes are observed relative to TBC-2—Figure 5(g-i). Again a t’ phase had to be included to obtain a satisfactory fit—compare to the cooling profile of the slowly heated specimen, TBC-1, Figure 5(b),
4. Discussion
Comparing the in situ phase evolution at elevated temperatures to that previously observed ex situ at ambient lends new insights into the nature of the t’ phase and how anisotropic thermal

Krogstad, et al. : Decomposition of t’-Zirconia at High Temperature Page 9 ——————————————————————————————————————————-
expansion may influence microstructural morphology during decomposition of this metastable phase.
4.1. Evidence from Thermal Expansion
The behavior of the tetragonal lattice parameters with increasing temperature agrees well with previously published studies.12,16,22-24 The observed maximum in tetragonality varies with composition, as expected. This maximum is associated with the elastic anisotropy and has been largely attributed to the different bond strengths along the c and a axes.36 The anisotropic thermal expansion of the tetragonal unit cell has several implications for phase evolution of 7-8YSZ TBCs. Consider Figure 4, in which the maximum tetragonality is superimposed on the ZrO2-YO1.5 phase diagram. At a typical TBC surface temperature of ~1200°C, the equilibrium tetragonal phase exhibits near maximum tetragonality. This has clear implications for the aging time required to activate the disruptive t→m transformation of the Y-lean domains, which is controlled by the coarsening kinetics of the coherent t and c domains. The rate of coarsening, and thus the susceptibility to transformation, is arguably influenced by the lattice mismatch between the Y-rich and Y-lean domains. Increasing the use temperature would enhance the diffusion kinetics but concomitantly decrease the driving force for domain coarsening. Furthermore, recent data supports a retrograde shape for the tetragonal solvus with a maximum solubility at ~1400°C20 (see dotted line in Figure 4). The inference is that the YO1.5 solubility is lower at current use temperature—thereby exacerbating the lattice mismatch with the Y-rich c phase and potentially accelerating the coarsening rate of the transformable domains.
4.2. Phase Evolution
Notwithstanding their different thermal histories, the three crushed APS samples exhibited remarkably similar phase constitution at the end of the experiments. A t’ phase in the peak fitting was necessary after relatively harsh thermal exposures—both at elevated as well as at room temperatures. This behavior is consistent with observations at lower temperature20,21 but equivalent exposures,g based on the aging parameter proposed by Lipkin et al.20 There are two possible explanations for this:
(i) the t’ phase did not fully decompose at high temperatures but its tetragonality could not be resolved in proximity to T0(c/t), whereas upon cooling to room temperature, the t’ phase became distinguishable from the product phases (t”/c and t); or
g The calculated Hollomon-Jaffee aging parameters proposed by Lipkin et al,20 were approximately 51,000 and
54,000 for TBC-2 and TBC-3, respectively. No significant monoclinic phase content is expected after these exposures.

Krogstad, et al. : Decomposition of t’-Zirconia at High Temperature Page 10 ——————————————————————————————————————————-
(ii) the t’ phase does not correspond to a phase with a distinct composition but is instead an artifact of the strained interphase regions in a modulated microstructure comprising coherent alternating Y-rich (c) and Y-lean (t) regions, as proposed earlier.21
The data presented for each specimen will now be further dissected with these two hypotheses in mind. (Note that, while it was convenient to work at these temperatures to simultaneously investigate both the accelerated phase evolution and the position of the T0(c/t)-curve, it is expected that phase evolution may proceed differently above and below the T0(c/t)-curve.37) TBC-2, which was heated isothermally at 1529ºC and experienced only a brief excursion above T0(c/t), is the simplest case. Isothermal aging of TBC-2 resulted in a gradual increase of intensity in the c and t peaks, Figure 8(a,b), and the t’ signal was retained over the duration of the high temperature soakh—maintaining a nearly constant tetragonality, consistent with the expected thermal expansion behavior presented in Section 3.1. Upon cooling after the exposure, the lattice parameters of the residual t’ phase are nearly identical to those in the unaged sample. This is inconsistent with the conventional precipitation scenario suggested by (i) above. Thermodynamics and mass balance would dictate that if the cubic phase were precipitating from a supersaturated t’, the composition of the entire parent tetragonal phase should gradually shift towards a more Y-lean composition (i.e. the tetragonality should increase). Instead, the observations are consistent with the scenario described in (ii). Previous work21 on electron beam physical vapor deposition (EBPVD) t’-YSZ TBCs of similar composition revealed rapid (e.g., fewer than 15.4 minutes at 1482ºC) decomposition into a coherent array of Y-rich and Y-lean domains, yet this phase evolution was not apparent via XRD until much later (1.4 hours at 1482ºC) in the aging process. The initial compositionally homogenous t’ phase was distinguished from that corresponding to the modulated microstructure—henceforth pseudo-t’—which was postulated to stem from the coherency strain between the neighboring domains and was hence an artifact of microstructural constraint. Unfortunately, confirmation of compositional modulation in the final microstructure of TBC-2 via TEM analysis was not possible due to the small specimen dimensions. However, TEM of another sample of the same coating exposed to an equivalent treatment clearly revealed the modulated microstructure consistent with hypothesis (ii).25 Moreover, the strong increase in t’ intensity upon cooling, cf. Figure 5(d,e), suggests that the source of this signal is not purely linked to compositional changes and may be closely related to such microstructural constraints.
h Note that the t’ signal does disappear in heating above T0(c/t) giving rise to the cubic phase consistent with the
same composition, but is recovered essentially unchanged as the sample rapidly cools down to the hold temperature, as shown in Figure 7.

Krogstad, et al. : Decomposition of t’-Zirconia at High Temperature Page 11 ——————————————————————————————————————————-
Based on the higher aging temperature for TBC-3, the phase evolution process is accelerated relative to TBC-2 but is otherwise quite similar. However, given that the aging temperature of 1609ºC is much closer to T0(c/t) (cf. Figures 3 and 4), the individual t’ reflections are more difficult to discern during the isothermal hold. The transition from the t’ phase into a mixture of t+c can only be inferred from the sharpening of the central reflection and the concomitant strengthening of the t peaks in Figure 8(c,d) because of proximity of the t’ and c reflections at this temperature. This proximity makes it difficult to conclusively say that the t’ phase has disappeared during the isothermal hold. However, the same thermodynamic argument applied to TBC-2 holds—there is no evident shift or even broadening of the central peak that might be correlated to a gradual depletion of the parent tetragonal phase expected from a conventional precipitation process.
Although the interpretation of TBC-1 is more complicated because of the slow heating/cooling rates and time spent above T0(c/t), it is highly representative of many previously published studies of phase evolution in YSZ via XRD and the historical confusion surrounding such analysis. A few assumptions can be made in comparing the heating/cooling results to previous observations of EBPVD and APS TBCs via ambient temperature XRD and TEM.20,25 In particular, the diffuse intensity appearing around 1400ºC, indicative of an incipient t phase, reveals that the phase evolution process has begun upon heating and below T0(c/t), Figure 1(b,c). It took approximately 90 minutes to reach this temperature. A quick qualitative comparison to the EBPVD coatings heat treated for 15 minutes at 1482ºC21 mentioned above suggests that at some point during the 90 minute temperature ramp there is a transition from t’ to pseudo-t’, i.e. from a true single phase to a compositionally modulated structure. It is not possible to explicitly identify this transition point or range via XRD alone because of the fine scale of the modulated microstructure and the associated coherency strains. What is interesting in this scenario is that the now pseudo-t’ reflections continue to follow the expected anisotropic thermal expansion behavior until they fully converge with the c phase peak (e.g. Figure 6a), but this is not the case upon cooling. This observation suggests that continued coarsening of the modulated microstructure, either below or above T0(c/t), allows domain cores to relax towards their equilibrium lattice parameters, consistent with the increasing intensity of the t and c reflections, but the interface between domains remains constrained. This interfacial volume is arguably the source for the pseudo-t’ signal.
These observations, in conjunction with the previously reported21,25 microstructural evidence that the t’ phase rapidly decomposes into a modulated structure consisting of Y-rich and Y-lean domains, further validate the argument that the t’ phase, as observed in XRD after

Krogstad, et al. : Decomposition of t’-Zirconia at High Temperature Page 12 ——————————————————————————————————————————-
thermal aging, is the byproduct of the interfacial coherency strain between the two product phases. Additional investigations are necessary to fully elucidate the nature of the decomposition mechanisms; however, it is now clear that it is necessary to account for the role of microstrain in any discussion of phase evolution in 8YSZ.
5. Conclusions
In situ high temperature powder diffraction has shed new light on the mechanisms of microstructural and phase evolution of t’-zirconia. While x-ray diffraction is an efficient technique for characterizing phase evolution, its interpretation demands full consideration of the mechanism involved. The anisotropic thermal expansion of tetragonal YSZ is in good agreement with previously reported data and highlights important differences in the nature of the observed t’ phase upon heating and cooling, although the latter does not follow the expected anisotropic behavior. This is because the t’ phase evolves into a mixture of t and c phases after extended exposures to elevated temperatures, but reappears as the pseudo-t’ phase upon cooling. These observations corroborate previous observations that the initially homogenous t’-YSZ is distinct from the pseudo-t’ phase observed via XRD after thermal aging, and that this pseudo-t’ phase is likely the result of the coherency between the evolving phases.
This investigation was supported by the National Science Foundation under Grants DMR-1105672 and DMR-
0605700 (JAK, CGL), and by the US Department of Energy via Cooperative Agreement DE-FC26-05NT42643
(YG, DML). Any opinions, findings, conclusions or other recommendations expressed are those of the authors and
do not necessarily reflect the views of the US Department of Energy or the National Science Foundation. The
research made use of the UCSB-MRL Central Facilities supported by NSF under grant DMR-1121053. Use of the
National Synchrotron Light Source, Brookhaven National Laboratory, was supported by the U.S. Department of
Energy, Office of Science, Office of Basic Energy Sciences, under Contract No. DE-AC02-98CH10886 (JB, JW).
Helpful discussions with Prof. R.M. McMeeking (UCSB) are gratefully acknowledged.

Krogstad, et al. : Decomposition of t’-Zirconia at High Temperature Page 13 ——————————————————————————————————————————-
References
1. NASA Technical Memorandum. NASA TM-78976, National Aeronautics Space Administration, 1978.
2. R. A. Miller, "Thermal barrier coatings for aircraft engines: History and directions," J. Therm. Spray Technol., 6 [1] 35-42 (1997).
3. A. G. Evans, D. R. Clarke, and C. G. Levi, "The influence of oxides on the performance of advanced gas turbines," J. Eur. Ceram. Soc., 28 [7] 1405-1419 (2008).
4. R. A. Miller, "Phase stability in plasma sprayed, partially stabilized zirconia-yttria," pp. 241-253. In Science and Technology of Zirconia I, Vol. 3. Edited by A. H. Heuer, L.W. Hobbs. The American Ceramics Society, Inc, 1981.
5. H. G. Scott, "Phase relationships in zirconia-yttria system," J. Mater. Sci., 10 [9] 1527-1535 (1975).
6. H. Toraya, "Effect of YO1.5 dopant on unit-cell parameters of ZrO2 at low contents of YO1.5," J. Am. Ceram. Soc., 72 [4] 662-664 (1989).
7. M. Yoshimura, "Phase stability of zirconia," Am. Ceram. Soc. Bull., 67 [12] 1950-1955 (1988).
8. D.-J. Kim, "Lattice parameters, ionic conductivities, and solubility limits in fluorite-structure MO2 oxide [M = Hf4+, Zr4+, Ce4+, Th4+, U4+] solid solutions," J. Am. Ceram. Soc., 72 [8] 1415-1421 (1989).
9. D. Kim, "Effect of Ta2O5, Nb2O5 and HfO2 alloying on the transformability of Y2O3-stabilized tetragonal ZrO2," J. Am. Ceram. Soc., 73 [1] 115-120 (1990).
10. J. R. Brandon and R. Taylor, "Phase-stability of zirconia-based thermal barrier coatings. 1. Zirconia Yttria Alloys," Surf. Coat. Tech., 46 [1] 75-90 (1991).
11. C. J. Howard and R. J. Hill, "The polymorphs of zirconia - phase abundance and crystal strcture by Rietveld analysis of neutron and X-Ray diffraction data " J. Mater. Sci., 26 [1] 127-134 (1991).
12. T.-S. Sheu, T.-Y. Tien, and I. W. Chen, "Cubic-to-tetragonal (t') transformation in zirconia-containing systems," J. Am. Ceram. Soc., 75 [5] 1108-1116 (1992).
13. D.-J. Kim, S.-H. Hyun, S.-G. Kim, and M. Yashima, "Effective ionic radius of Y3+ determined from lattice parameters of fluorite-type HfO2 and ZrO2 solid solutions," J. Am. Ceram. Soc., 77 [2] 597-599 (1994).
14. U. Schulz, "Phase transformation in EB-PVD yttria partially stabilized zirconia thermal barrier coatings during annealing," J. Am. Ceram. Soc., 83 [4] 904-910 (2000).
15. I. R. Gibson and J. T. S. Irvine, "Qualitative X-ray diffraction analysis of metastable tetragonal (t ') zirconia," J. Am. Ceram. Soc., 84 [3] 615-618 (2001).
16. N. Igawa and Y. Ishii, "Crystal structure of metastable tetragonal zirconia up to 1473 K," J. Am. Ceram. Soc., 84 [5] 1169-1171 (2001).
17. A. Azzopardi, R. Mevrel, B. Saint-Ramond, E. Olson, and K. Stiller, "Influence of aging on structure and thermal conductivity of Y-PSZ and Y-FSZ EB-PVD coatings," Surf. Coat. Tech., 177 131-139 (2004).
18. G. Witz, V. Shklover, W. Steurer, S. Bachegowda, and H. P. Bossmann, "Phase evolution in yttria-stabilized zirconia thermal barrier coatings studied by rietveld refinement of X-ray powder diffraction patterns," J. Am. Ceram. Soc., 90 [9] 2935-2940 (2007).
19. G. Di Girolamo, C. Blasi, L. Pagnotta, and M. Schioppa, "Phase evolution and thermophysical properties of plasma sprayed thick zirconia coatings after annealing," Ceram. Int., 36 [8] 2273-2280 (2011).
20. D. M. Lipkin, J. A. Krogstad, Y. Gao, C. A. Johnson, W. A. Nelson, and C. G. Levi, "Phase evolution upon aging of air plasma spray t’-zirconia thermal barrier coatings: Part I – synchrotron diffraction," J. Am. Ceram. Soc., 96 [1] 290-298 (2012).
21. J. A. Krogstad, S. Krämer, D. M. Lipkin, C. A. Johnson, D. R. G. Mitchell, J. M. Cairney, and C. G. Levi, "Phase stability of t′-zirconia-based thermal barrier coatings: mechanistic insights," J. Am. Ceram. Soc., 94 s168-s177 (2011).

Krogstad, et al. : Decomposition of t’-Zirconia at High Temperature Page 14 ——————————————————————————————————————————-
22. P. Aldebert and J.-P. Traverse, "Structure and ionic mobility of zirconia at high temperature," J. Am. Ceram. Soc., 68 [1] 34-40 (1985).
23. H. Schubert, "Anisotropic thermal expansion coefficients of Y2O3-stabilized tetragonal zirconia," J. Am. Ceram. Soc., 69 [3] 270-271 (1986).
24. T.-S. Sheu, "Anisotropic Thermal Expansion of Tetragonal Zirconia Polycrystals," J. Am. Ceram. Soc., 76 [7] 1772-1776 (1993).
25. J. A. Krogstad, R. M. Leckie, S. Krämer, D. M. Lipkin, C. A. Johnson, and C. G. Levi, "Phase evolution upon aging of air plasma spray t’-zirconia thermal barrier coatings: Part II – microstructure evolution," J. Am. Ceram. Soc., 96 [1] 299-307 (2012).
26. L. F. Siah, W. M. Kriven, and J. Schneider, "In situ, high-temperature, synchrotron, powder diffraction studies of oxide systems in air, using a thermal-image furnace," Measurement Science & Technology, 16 [6] 1291-1298 (2005).
27. P. Sarin, W. Yoon, K. Jurkschat, P. Zschack, and W. M. Kriven, "Quadrupole lamp furnace for high temperature (up to 2050 K) synchrotron powder x-ray diffraction studies in air in reflection geometry," Rev. Sci. Instrum., 77 [9] 093906-093909 (2006).
28. H. M. Rietveld, "A profile refinement method for nuclear and magnetic structures," J. Appl. Crystallogr., 2 65-71 (1969).
29. A. C. Larson, R.B. Von Dreele, "General Structure Analysis System (GSAS)," Los Alamos National Laboratory Report LAUR 86-748 (2004).
30. B. H. Toby, "EXPGUI, a graphical user interface for GSAS," J. Appl. Crystallogr., 34 210-213 (2001).
31. G. Teufer, "Crystal structure of tetragonal ZrO2," Acta. Crystallogr., 15 [NOV] 1187 (1962).
32. C. J. Howard, R. J. Hill, and B. E. Reichert, "Structures of the ZrO2 polymorphs at room-temperature by high-resolution neutron powder diffraction," Acta Crystallogr., Sect. B: Struct. Sci, 44 116-120 (1988).
33. S. P. Terblanche, "Thermal-expansion coefficients of yttria-stabilized cubic zirconias," J. Appl. Crystallogr., 22 283-284 (1989).
34. J. A. Krogstad, M. Lepple, Y. Gao, D. M. Lipkin, and C. G. Levi, "Effect of yttria content on the zirconia unit cell parameters," J. Am. Ceram. Soc., 94 [12] 4548-4555 (2011).
35. O. Fabrichnaya, C. Wang, M. Zinkevich, C. G. Levi, and F. Aldinger, "Phase equilibria and thermodynamic properties of the ZrO2-GdO1.5-YO1.5 system," J. Phase. Equilib., 26 [6] 591-604 (2005).
36. R. P. Ingel and D. Lewis, "Elastic anisotropy in zirconia single-crystals," J. Am. Ceram. Soc., 71 [4] 265-271 (1988).
37. T. Sakuma, Y. I. Yoshizawa, and H. Suto, "The modulated structure formed by isothermal agining in ZrO2-5.2mol%Y2O3 alloy," J. Mater. Sci., 20 [3] 1085-1092 (1985).

Krogstad, et al. : Decomposition of t’-Zirconia at High Temperature Page 15 ——————————————————————————————————————————-
Figure 1 – Heating and cooling responses for sample TBC-1. (a) The temperature profile corresponding the the diffraction profile in (b) calculated from the lattice parameter of the Pt reference. (b) Top-down 2D projection of the diffraction profile as a function of temperature, showing the angular range containing the tetragonal (103)t and (211)t and cubic (311)c peaks. (c) Individual diffraction profiles between 1555ºC and 1638ºC upon heating (white box overlaid in (a)) showing the gradual merger of the two tetragonal (t’) peaks into the cubic (311)c peak. The equilibrium tetragonal (t) phase starts to become apparent as indicated by the arrows in (c).
Krogstad, et al. : Decomposition of t’-Zirconia at High Temperature Page 16 ——————————————————————————————————————————-
Figure 2 – Variation of unit cell parameters for all compositions studied (see Table I). Note the nonlinear behavior of the tetragonal parameters at’ and ct’, as T0(c/t) is approached for samples TBC-1 and TZ-6. (Tetragonal parameters are reported here in the pseudo-cubic setting.)

Krogstad, et al. : Decomposition of t’-Zirconia at High Temperature Page 17 ——————————————————————————————————————————-
Figure 3 – Variation of the tetragonality (c/a) with temperature for a range of YSZ compositions. A composition-dependent maximum in tetragonality is observed before a rapid descent to unity as T0(t/c) is approached.

Krogstad, et al. : Decomposition of t’-Zirconia at High Temperature Page 18 ——————————————————————————————————————————-
Figure 4 – Superposition of the maximum tetragonality on the YO1.5-ZrO2 phase diagram35 (the proposed retrograde tetragonal solvus from Lipkin, et al.20 is dashed in gray). The position of the T0(c/t)-line estimated from TBC-2 (see Figure 7) data is denoted with a star and dashed (—-) line. The maximum (TBC-1) or isothermal (TBC-2 & -3) aging temperatures are also indicated to guide comparisons of the equilibrium phase compositions to those expected from typical TBC service conditions.

Krogstad, et al. : Decomposition of t’-Zirconia at High Temperature Page 19 ——————————————————————————————————————————-
Figure 5 – A portion of the diffraction profiles for the (a) slowly heated TBC-1 at the maximum temperature 1696ºC and (b) upon cooling to room temperature. Note that the peak positions shift due to thermal expansion/contraction. The same is given for TBC-2 and TBC-3, held isothermally at 1529ºC (d) and 1609ºC (g), respectively, after 180 minutes and (e) & (h) at 300ºC immediately after quenching. The bottom row of profiles, (c), (f), and (i), are the 300ºC profiles, except that the t’ phase is excluded from the fitting.

Krogstad, et al. : Decomposition of t’-Zirconia at High Temperature Page 20 ——————————————————————————————————————————-
Figure 6 – Variation of (a) the t’ lattice parameters upon slow heating and cooling for sample TBC-1. (b) Comparison of lattice parameters for the t, t’, t”, and c phases upon slow cooling.

Krogstad, et al. : Decomposition of t’-Zirconia at High Temperature Page 21 ——————————————————————————————————————————-
Figure 7 – The changing peak profile for TBC-2 on cooling across the T0(c/t)-line after a brief temperature overshoot in (a) projection and (b) offset in scattering angle to account for thermal expansion.

Krogstad, et al. : Decomposition of t’-Zirconia at High Temperature Page 22 ——————————————————————————————————————————-
Figure 8 – 3D and 2D view for the evolution of the diffraction profile during isothermal aging for (a-b) TBC-2 at 1529ºC over 180 minutes and (c-d) TBC-3 at 1609ºC for 180 minutes. Sharpening of the central (311)c peak and increases in the intensity of the (103)t and (211)t peaks with increasing time indicate a transition to a t+c two-phase mixture.

Krogstad, et al. : Decomposition of t’-Zirconia at High Temperature Page 23 ——————————————————————————————————————————-
Table I – Compositions, pre-treatment conditions and linear coefficients relating temperature and lattice parameter for cubic and tetragonal phases.i
R²
c
0.99
9
1.00
0
0.99
9
0.98
6
0.99
6
- - -
b
0.99
8
- - - - - - -
a
0.99
9
1.00
0
0.99
8
0.99
5
0.99
7
1.00
0
0.99
9
0.99
8
Inte
rcep
t (Å
) c 5.31
5.20
5.17
5.16
5.16
- - -
b 5.21
- - - - - - -
a 5.15
5.09
5.10
5.10
5.12
5.13
5.14
5.14
slope
(x10
-5) (
Å/ºC
)
c 6.84
6.36
6.07
4.70
4.49
- - -
b 0.54
- - - - - - -
a 4.18
5.16
5.67
6.14
6.15
5.97
5.77
5.73
Fit T
emp
Rang
e (ºC
)
24-1
021
1196
-170
4
24-1
758
24-1
638
24-1
421
1497
-169
5
20-1
714
24-1
683
Hom
ogen
izat
ion
Tem
pera
ture
(ºC)
none
1000
none
1670
none
none
mol
%
YO
1.5
0.00
5.98
8.97
11.1
2
15.6
5
18.3
9
TZ-0
TZ-3
APS
2
TZ-6
TZ-8
TZ-1
0
i Where three parameters are given, they correspond to the monoclinic phase, two correspond to the tetragonal
phase (in the pseudo-cubic setting) and one corresponds to the cubic phase.

Krogstad, et al. : Decomposition of t’-Zirconia at High Temperature Page 24 ——————————————————————————————————————————-
Table II – Thermal expansion coefficients for cubic and tetragonal lattice parameters on slow heating.
Fit Temp Range (ºC)
Linear coefficient of thermal expansion, α (ppm/ºC) R2
a c a c
TZ-0 1196-1704 10.029 12.056 0.9999 0.9992
TZ-3 24-1289 11.143 12.142 0.9967 0.9999
APS2 24-1451 11.277 10.480 0.9960 0.9976
TZ-6 24-1421 13.057 7.9859 0.9994 0.9921
TZ-8 20-1415 11.709 - 0.9993
TZ-10 24-1400 11.602 - 0.9988