nisouthafrica.ni.com/sites/default/files/advances in rf and microwave... · • customizable with...
TRANSCRIPT

1 ni.com

ni.com

ni.com
Advances in RF and Microwave
Measurement Technology
Rejwan Ali
Marketing Engineer
NI Africa and Oceania

4 ni.com
New Demands in Modern RF and Microwave Test
Signal intelligence and electronic warfare systems require combinations of extremely flexible instrumentation and wide instantaneous bandwidth.
In semiconductor and wireless, technologies such as carrier aggregation and DPD require instruments to have increasingly higher dynamic range.
Modern radar test systems require increasingly wider instantaneous bandwidths and signal
processing capabilities.
5 ni.com
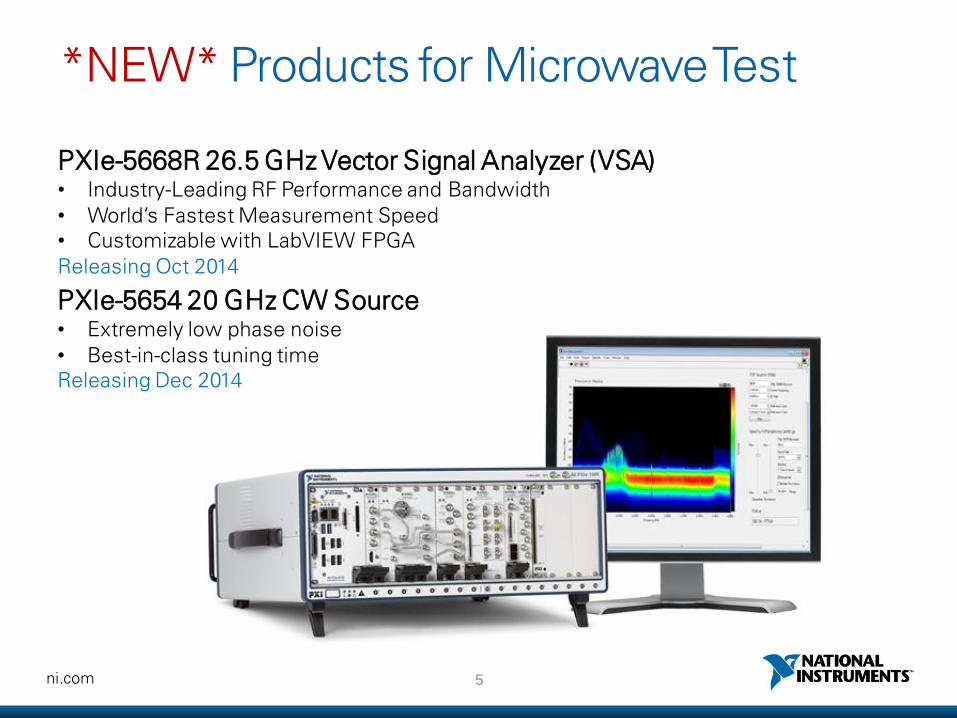
*NEW* Products for Microwave Test
PXIe-5668R 26.5 GHz Vector Signal Analyzer (VSA) • Industry-Leading RF Performance and Bandwidth • World’s Fastest Measurement Speed • Customizable with LabVIEW FPGA Releasing Oct 2014
PXIe-5654 20 GHz CW Source • Extremely low phase noise • Best-in-class tuning time Releasing Dec 2014

10 ni.com
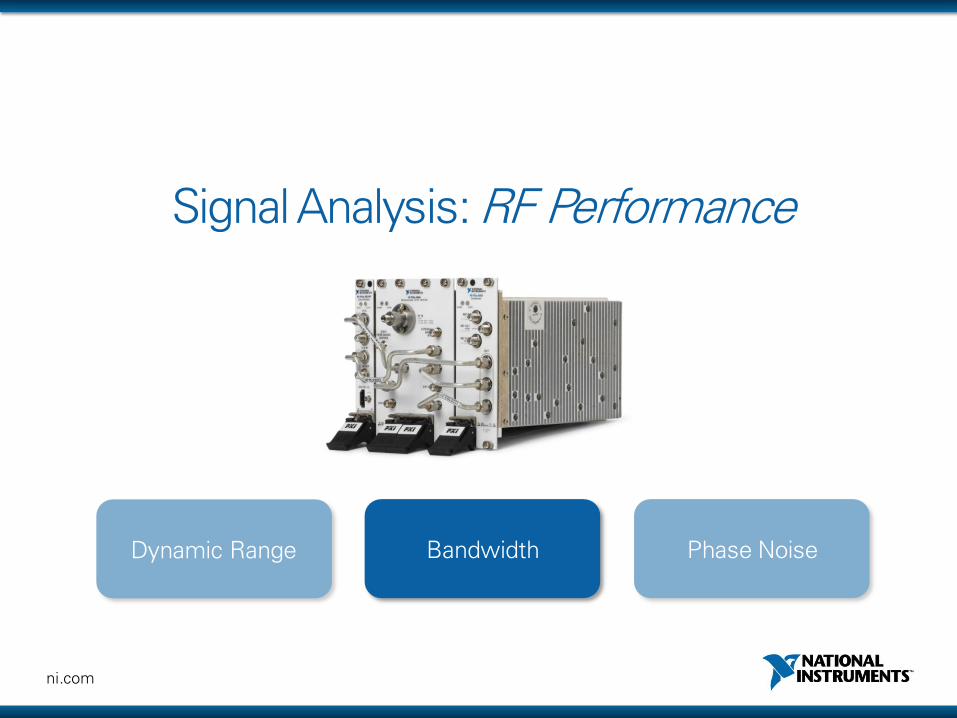
Signal Analysis: RF Performance
Dynamic Range Bandwidth Phase Noise

11 ni.com
Signal Analysis: RF Performance
Dynamic Range Bandwidth Phase Noise
12 ni.com
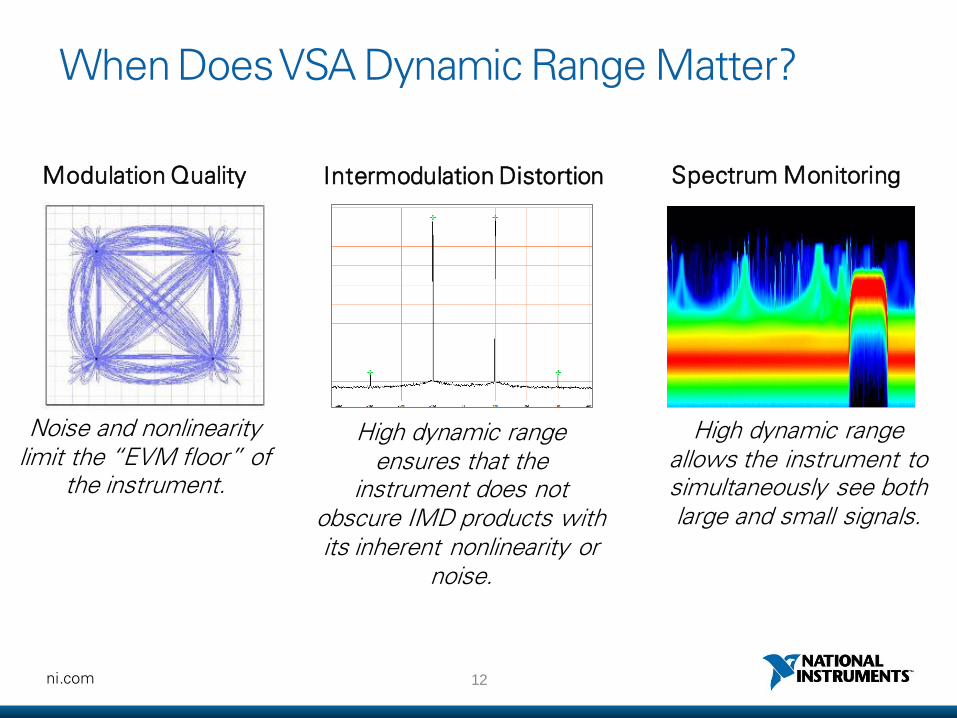
When Does VSA Dynamic Range Matter?
Modulation Quality
Noise and nonlinearity limit the “EVM floor” of
the instrument.
Intermodulation Distortion
High dynamic range ensures that the
instrument does not obscure IMD products with its inherent nonlinearity or
noise.
Spectrum Monitoring
High dynamic range allows the instrument to simultaneously see both large and small signals.
13 ni.com
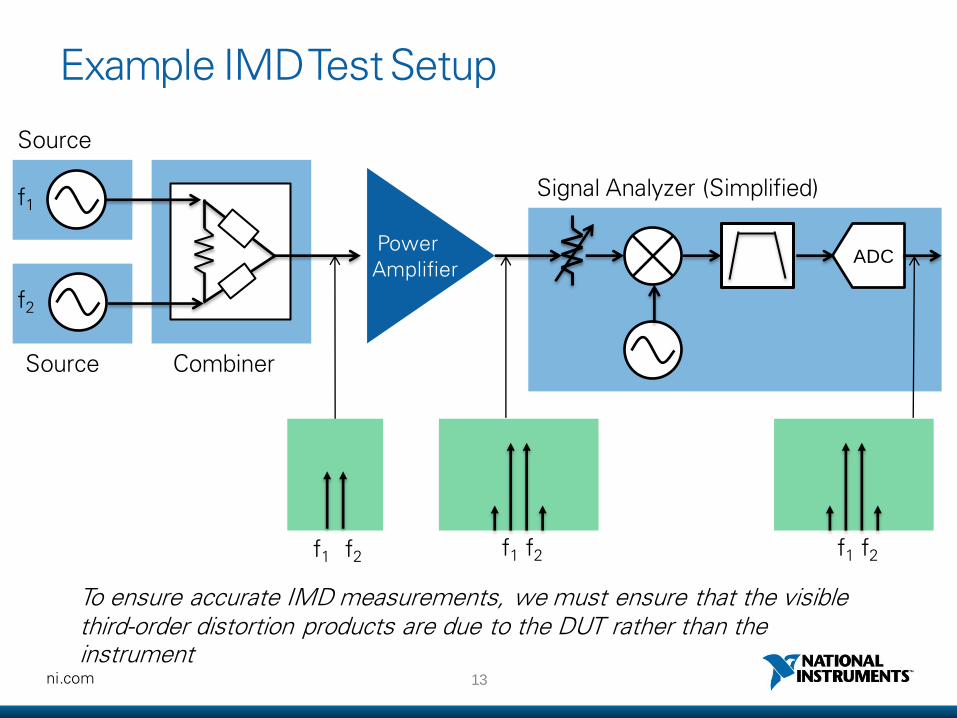
Example IMD Test Setup
f1
f2
f1 f2
Power Amplifier
ADC
Source
Source Combiner
Signal Analyzer (Simplified)
f1 f2 f1 f2
To ensure accurate IMD measurements, we must ensure that the visible third-order distortion products are due to the DUT rather than the instrument
14 ni.com
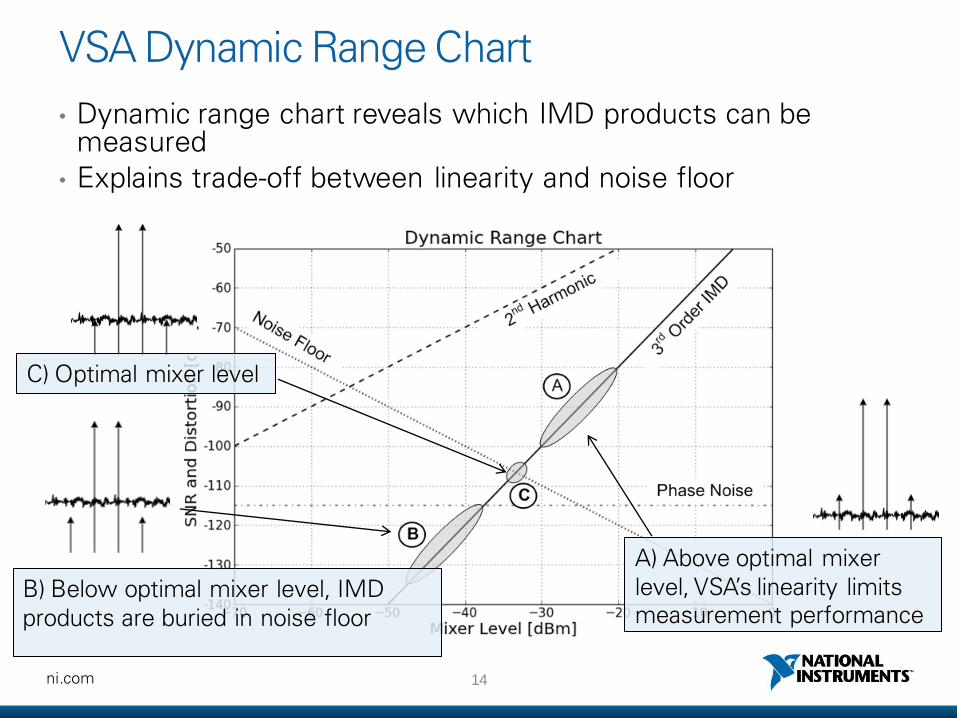
VSA Dynamic Range Chart
• Dynamic range chart reveals which IMD products can be measured
• Explains trade-off between linearity and noise floor
B) Below optimal mixer level, IMD products are buried in noise floor
A) Above optimal mixer level, VSA’s linearity limits measurement performance
C) Optimal mixer level

16 ni.com
-140
-130
-120
-110
-100
-90
-80
-70
-60
-50
-70 -60 -50 -40 -30 -20 -10 0
Dy
nam
ic R
an
ge (d
Bc)
Av
era
ge N
ois
e D
ensity
& D
isto
rtio
n R
ela
tive
to M
ixer L
evel
Mixer Level (dBm)
Nominal Dynamic Range at 20 GHz
Average Noise Level (RMS)
2nd Order Distortion
Third Order Distortion
NI 26.5 GHz Analyzer: Dynamic Range (20 GHz)
Maximum SFDR of 117 dB (1 Hz BW) at 20 GHz
17 ni.com
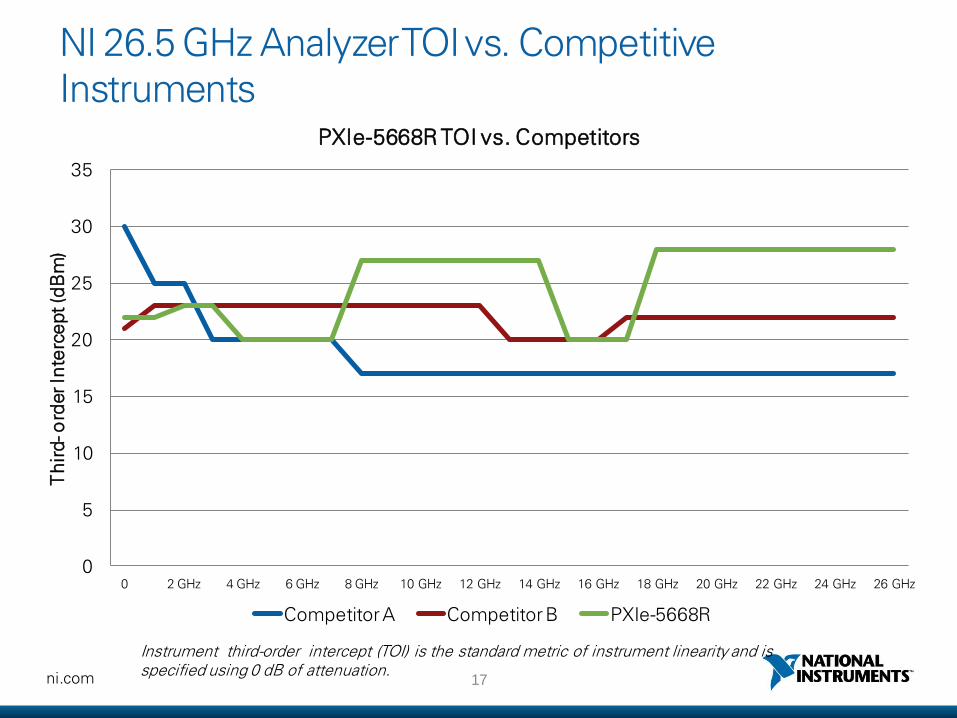
NI 26.5 GHz Analyzer TOI vs. Competitive Instruments
0
5
10
15
20
25
30
35
0 2 GHz 4 GHz 6 GHz 8 GHz 10 GHz 12 GHz 14 GHz 16 GHz 18 GHz 20 GHz 22 GHz 24 GHz 26 GHz
Th
ird- o
rder In
terc
ept (d
Bm
)
PXIe-5668R TOI vs. Competitors
Competitor A Competitor B PXIe-5668R
Instrument third-order intercept (TOI) is the standard metric of instrument linearity and is specified using 0 dB of attenuation.
19 ni.com
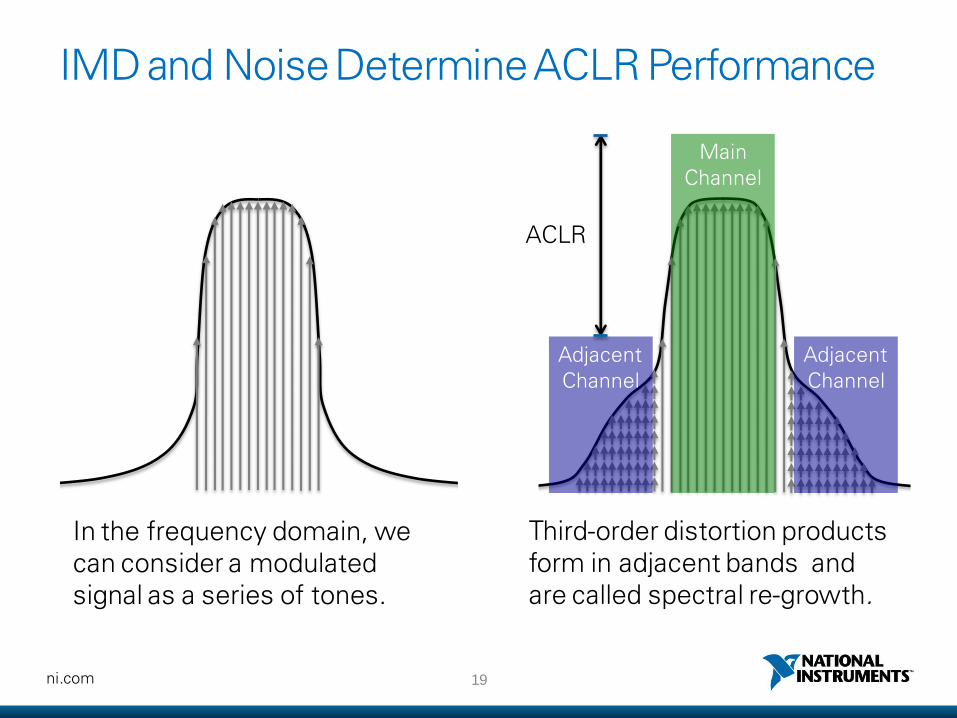
IMD and Noise Determine ACLR Performance
In the frequency domain, we can consider a modulated signal as a series of tones.
Third-order distortion products form in adjacent bands and are called spectral re-growth.
Main Channel
Adjacent Channel
Adjacent Channel
ACLR

20 ni.com
Example WCDMA PA Test Setup
Power Amplifier
ADC
Signal Generator
Signal Analyzer (Simplified)
A high-performance signal analyzer can measure ACLR without contributing inherent noise or nonlinearity. Often, a signal analyzer can employ “noise correction” to remove its inherent noise contribution.
90°
DAC
DAC
+
Gain

22 ni.com
Example ACLR Performance
ni.com
Signal Analysis: RF Performance
Dynamic Range Bandwidth Phase Noise
24 ni.com
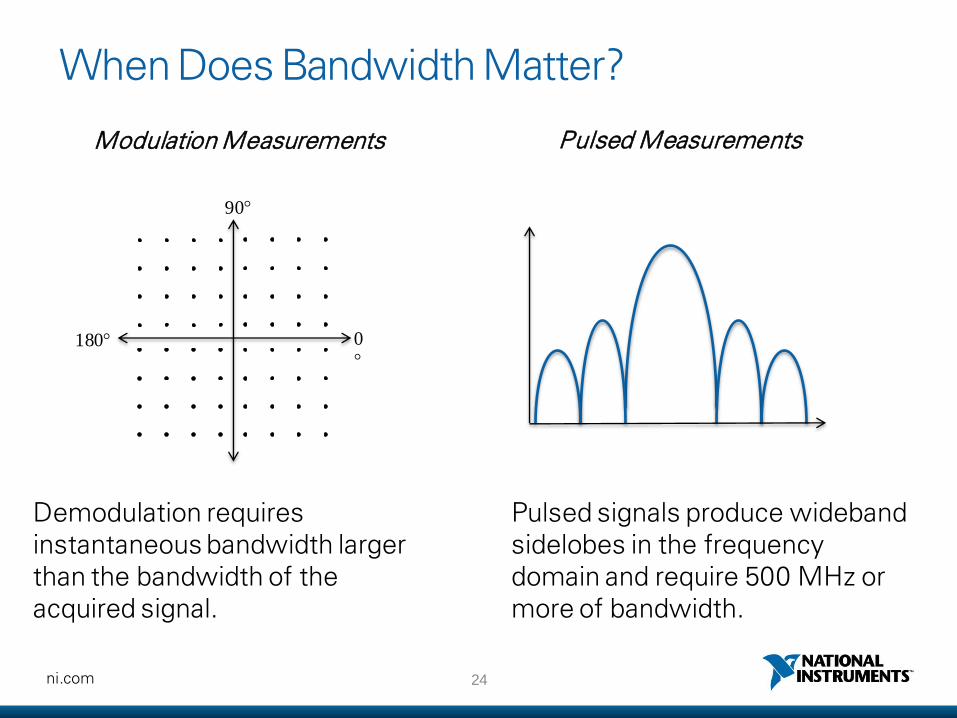
When Does Bandwidth Matter?
Modulation Measurements Pulsed Measurements
90°
180° 0
°
Demodulation requires instantaneous bandwidth larger than the bandwidth of the acquired signal.
Pulsed signals produce wideband sidelobes in the frequency domain and require 500 MHz or more of bandwidth.
25 ni.com
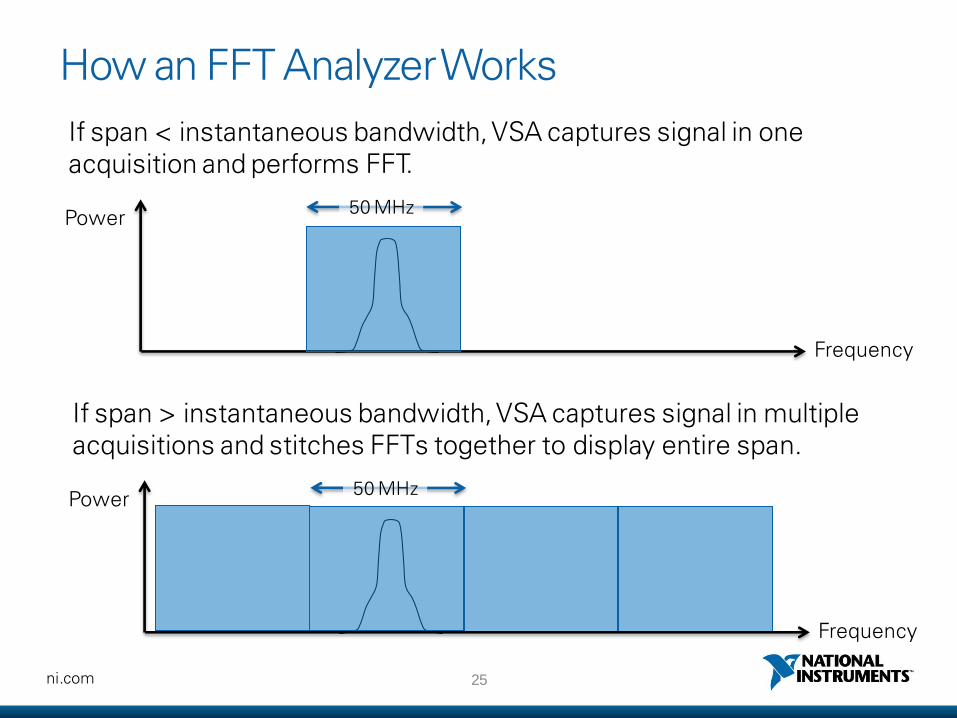
How an FFT Analyzer Works
Frequency
Power
If span < instantaneous bandwidth, VSA captures signal in one acquisition and performs FFT.
50 MHz
If span > instantaneous bandwidth, VSA captures signal in multiple acquisitions and stitches FFTs together to display entire span.
50 MHz
Frequency
Power
26 ni.com
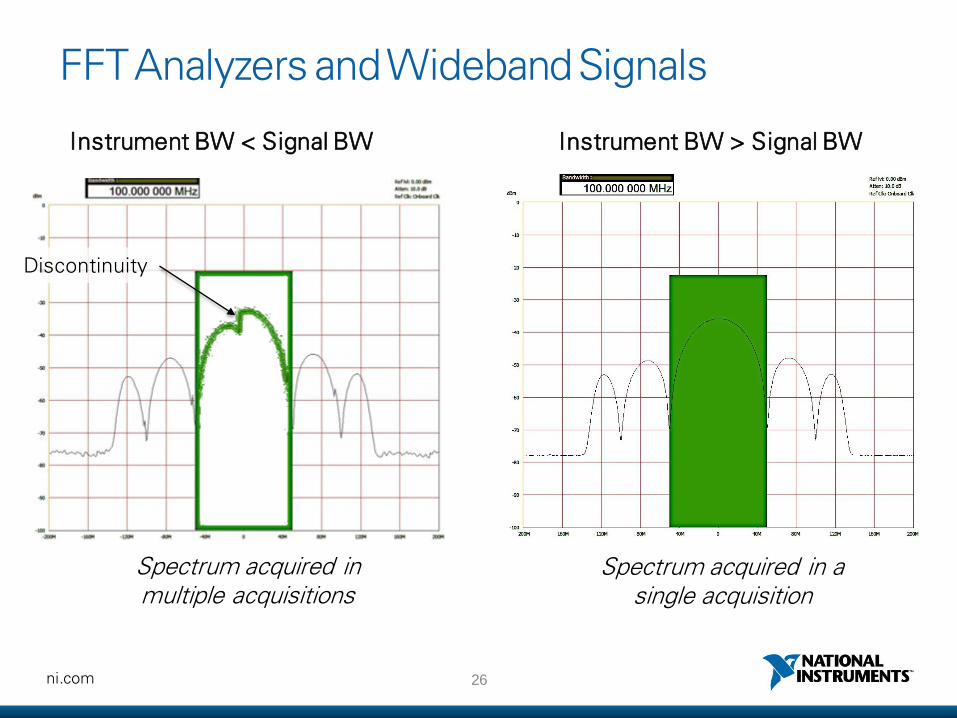
FFT Analyzers and Wideband Signals
Instrument BW < Signal BW
Spectrum acquired in multiple acquisitions
Instrument BW > Signal BW
Spectrum acquired in a single acquisition
Discontinuity
29 ni.com
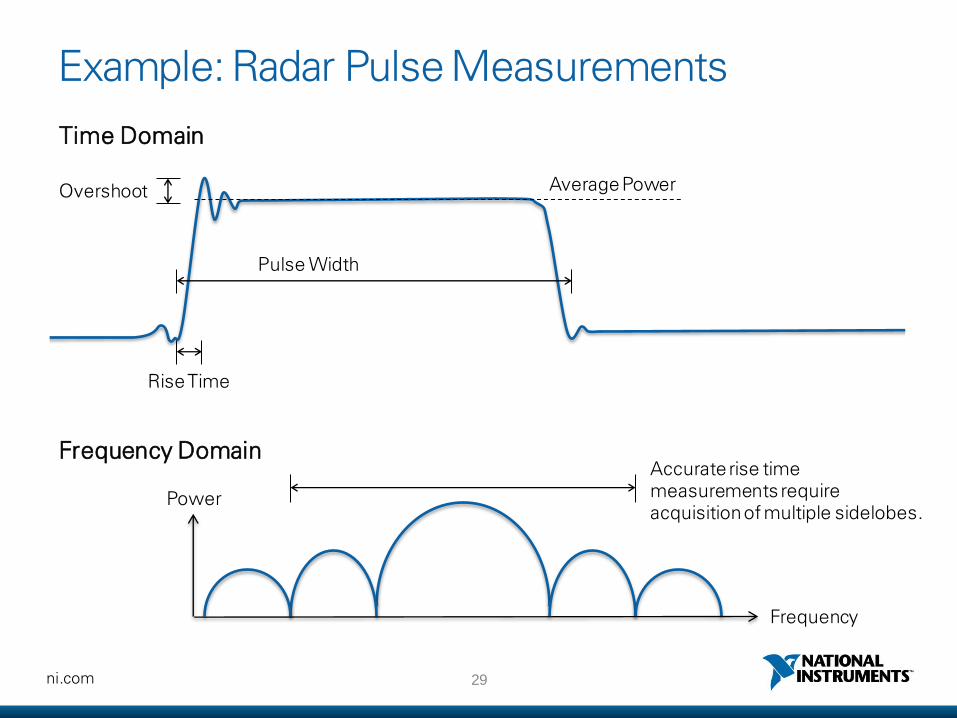
Example: Radar Pulse Measurements
Time Domain
Rise Time
Overshoot
Pulse Width
Average Power
Frequency Domain
Frequency
Power
Accurate rise time measurements require acquisition of multiple sidelobes.

30 ni.com
Bandwidth and Pulsed Signals
Pulse bandwidth is inversely related to pulse width, with shorter pulses translating to wide bandwidths. In a continuous wave pulse, the bandwidth of the main lobe is (2 / pulse width).
Frequency Domain Time Domain
Rise Time = 8ns

35 ni.com
NI 26.5 GHz VSA Phase Noise vs. Competition at 1 GHz
Ph
ase
No
ise d
Bc/H
z
Offset Frequency (Hz)
-150
-130
-110
-90
-70
-50
100 1 000 10 000 100 000 1 000 000
PXIe-5668R Competitor A Competitor B
ni.com
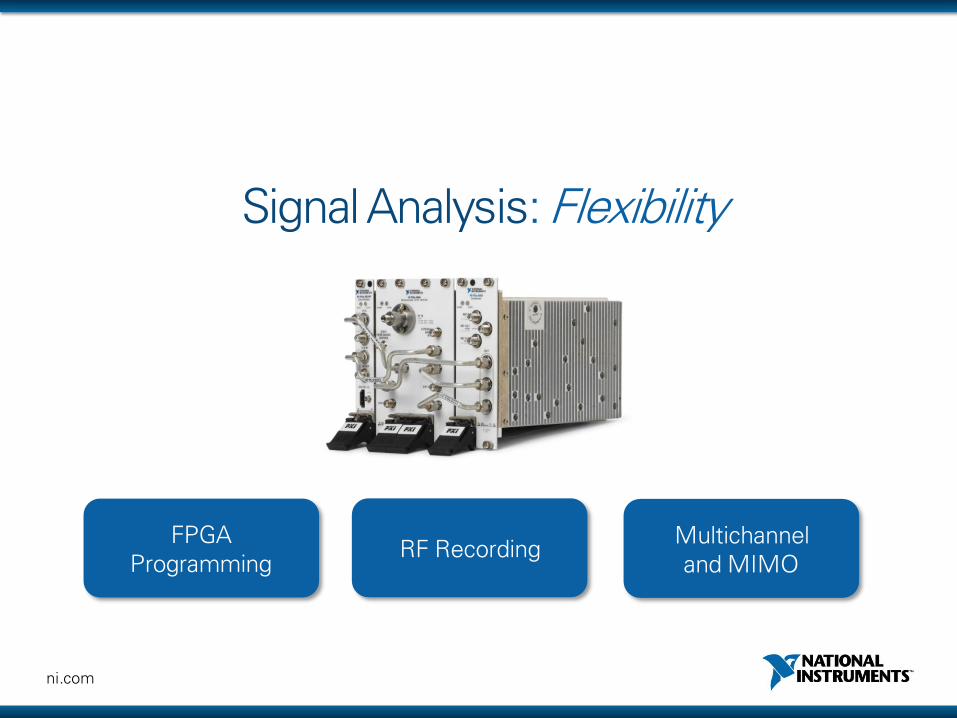
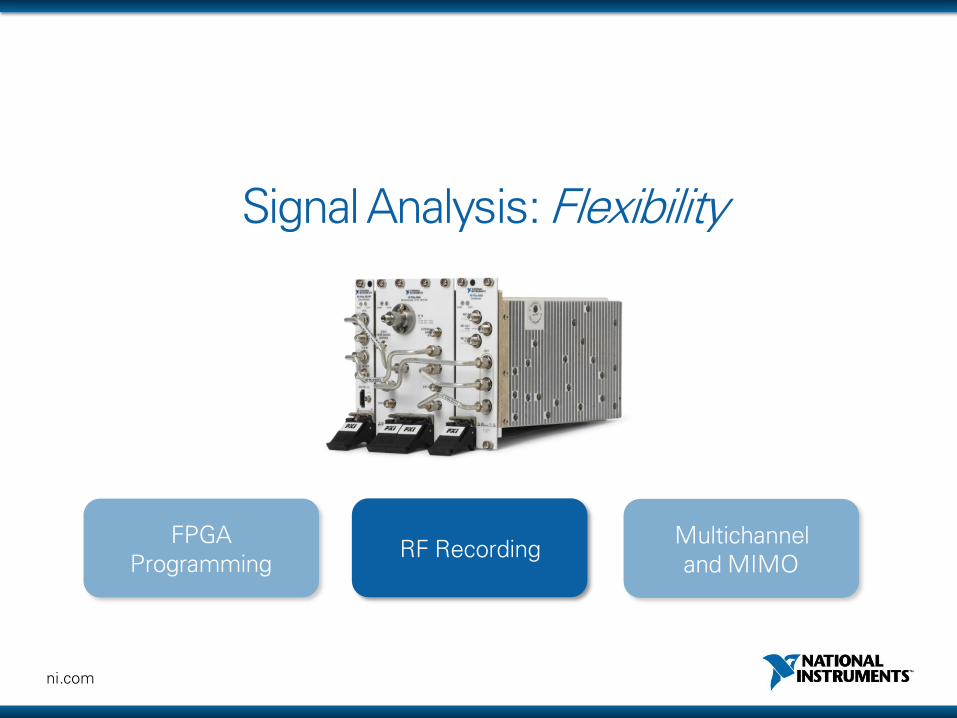
Signal Analysis: Flexibility
FPGA Programming
RF Recording Multichannel and MIMO

ni.com
Multichannel and MIMO
RF Recording
Signal Analysis: Flexibility
FPGA Programming
38 ni.com
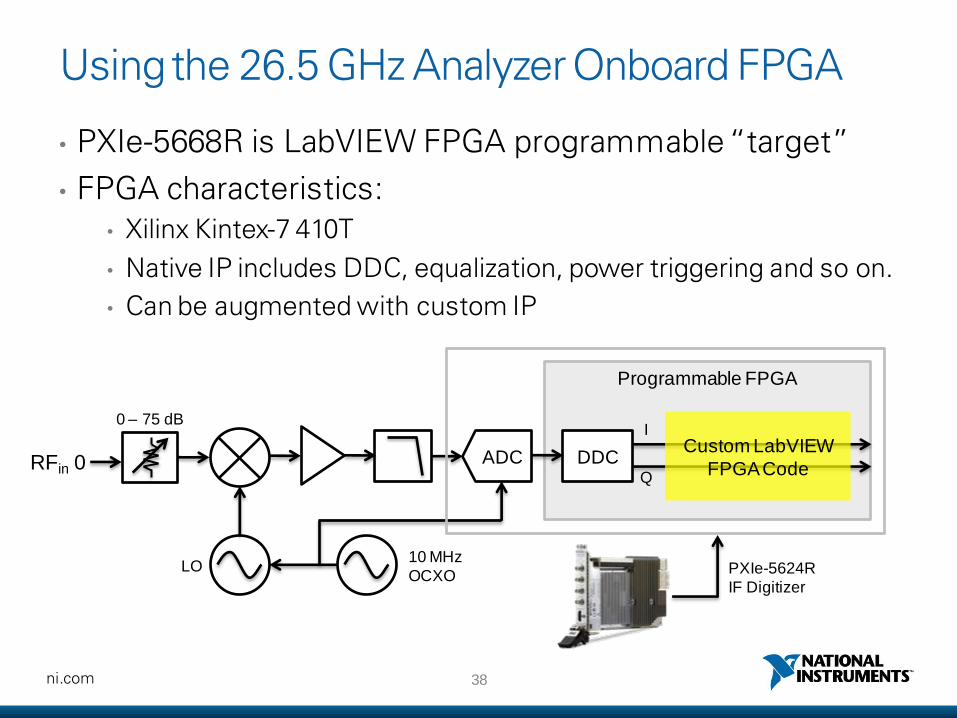
Programmable FPGA
Using the 26.5 GHz Analyzer Onboard FPGA
• PXIe-5668R is LabVIEW FPGA programmable “target”
• FPGA characteristics: • Xilinx Kintex-7 410T
• Native IP includes DDC, equalization, power triggering and so on.
• Can be augmented with custom IP
ADC
LO
0 – 75 dB
DDC
I
Q
10 MHz
OCXO
RFin 0 Custom LabVIEW
FPGA Code
PXIe-5624R
IF Digitizer

43 ni.com
Example: Real-Time Spectrum Analysis
• Gapless persistence, spectrogram, and trace statistics (max hold, min hold, average) calculated on FPGA
• Process up to 2 M FFTs/s using overlapped, windowed FFTs
• Real-time frequency mask triggering
• 100% probability of intercept (POI) minimum duration options:
• 1 µs or >15 µs
• Source available upon request
ni.com
Multichannel and MIMO
Signal Analysis: Flexibility
FPGA Programming
RF Recording

45 ni.com
NI 26.5 GHz Analyzer Recording System Architecture
PXI Chassis
Cable PCI
Express
Interface
(3.6 GB/s)
PXI Controller
PXIe-5668R
RF Signal Analyzer
RFin
PXIe-8384 PCIe Interface
HDD-8266 External RAID System
RF Input PCI Expressx8 Gen 2
(3.6 GB/s)

ni.com
Multichannel and MIMO
Signal Analysis: Flexibility
FPGA Programming
RF Recording
48 ni.com
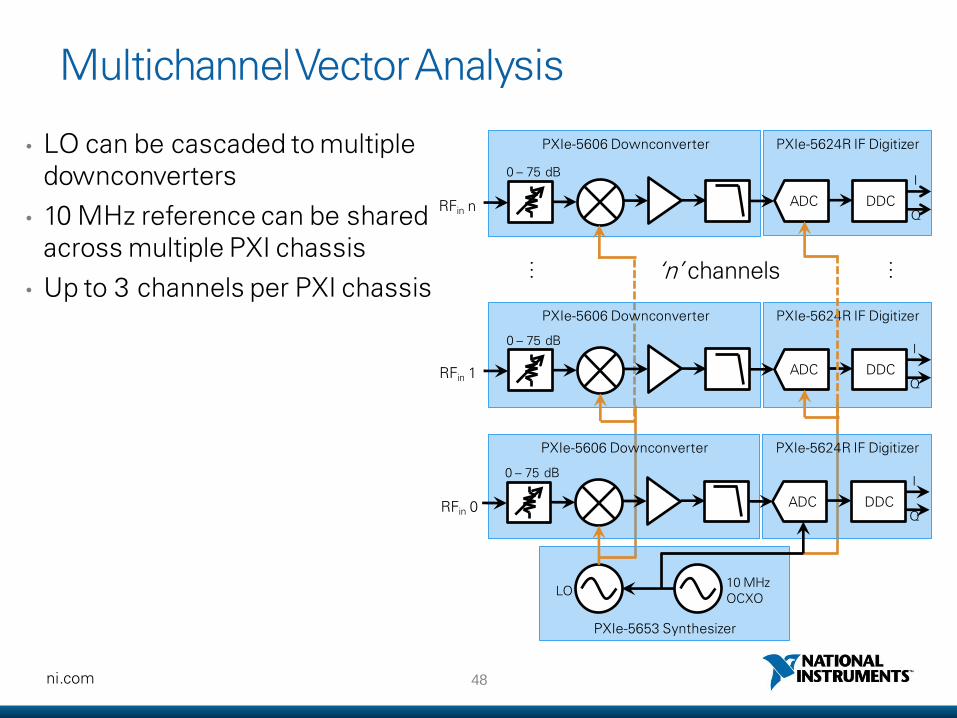
Multichannel Vector Analysis
• LO can be cascaded to multiple downconverters
• 10 MHz reference can be shared across multiple PXI chassis
• Up to 3 channels per PXI chassis
PXIe-5653 Synthesizer
PXIe-5606 Downconverter PXIe-5624R IF Digitizer
ADC
LO
0 – 75 dB
DDC
I
Q
PXIe-5606 Downconverter PXIe-5624R IF Digitizer
ADC
0 – 75 dB
DDC
I
Q
10 MHz OCXO
PXIe-5606 Downconverter PXIe-5624R IF Digitizer
ADC
0 – 75 dB
DDC
I
Q
…
…
RFin 0
RFin 1
RFin n
‘n’ channels

64 ni.com
Summary
• Wireless communications and crowded radio spectrum drive the need for better performance from test instruments • RF test market is evolving to meet application needs
YOU and NI are at work to solve the challenges of our generation!

65 ni.com
Stay Connected During and After NIDays
ni.com/xxxxxxxxxxxxxxxxx
youtube.com/niglobal
facebook.com/NationalInstruments
twitter.com/niglobal