in q3, ambu has achieved solid organic growth of 10% and ... reports/2018-201… · of ent scopes...
TRANSCRIPT

In Q3, Ambu has achieved solid organic growth of 10% and an EBIT margin before special items of 20.1%. The pipeline has been advanced, US approval of ENT scopes secured, and Ambu is on plan for future launch of the duodeno-scope, the cystoscope and next generation aView™ monitor. In terms of com-mercial infrastructure, Ambu has decided to further invest in and strengthen its largest market by moving to a 100% direct sales organization for pulmonary endoscopy in the US. Financial guidance is revised.
“We have a unique position with our pipeline of Visualization products, and we believe there is an untapped potential to be released by further investments in a direct sales force. Therefore, we have decided to go 100% direct with our aScope products on the US market. We believe that in the years to come, our direct sales force will be able to maximise our revenue growth and our entrance into ENT and urology will benefit from having full control of the sales force. With this change, we will build the largest single-use direct organisation in our most important market globally creating a competitive advantage for Ambu. Our expansion is well under way and will be effective during H1 2019/20. As a result, our full-year guidance for 2018/19 and 2019/20 is changed. In line with our communication in June, we are committed to create sig-nificant value for our shareholders in the long-term through strategic investments,” says CEO Juan Jose Gonzalez.
• For Q3, revenue totalled DKK 773m (DKK 673m), with organic growth of 10% and reported growth of 15%. The gap
between organic growth and reported growth is due to the strengthened USD/DKK exchange rate, and recognition of
GPO fees in accordance with the accounting standard relative to the same quarter last year.
• In Q3, Visualization contributed organic growth of 30%, Anaesthesia was flat, and PMD (Patient Monitoring & Diag-
nostics) delivered growth of 2%.
• Organic growth of 15% was realised in North America, 5% in Europe and 9% in the Rest of the world.
• Sales of single-use endoscopes in Q3 totalled 194,000 units, up 33% relative to Q3 last year. Year to date, sales of
endoscopes thus totals 525,000 units.
• Gross margin for Q3 was 56.4% (59.7%), including one-off write-downs of raw materials and finished goods in the
amount of DKK 25m due to the discontinuation of the SC210 colonoscope. Comparable gross margin before these
write-downs was 59.6%, which is on par with Q3 last year.
• Capacity costs for the quarter totalled DKK 281m (DKK 251m), corresponding to a 12% increase. The increase reflects
investments made in the sales organisation in recent quarters and recognition of GPO fees. Furthermore, cost accruals

have been released in respect of long-term incentives for management as a result of the adjusted long-term financial
guidance (as communicated on 17 June 2019).
• EBIT before special items for the quarter was DKK 155m (DKK 151m) with an EBIT margin before special items of
20.1% (22.4%). Adjusted for one-off write-downs relating to the SC210 colonoscope, the EBIT margin before special
items was 23.3%.
• In line with the announcement on 10 May 2019, costs associated with the change of CEO are accounted for as one-
off costs in Q3 in the amount of DKK 38m and in the form of special items.
• In line with the business update on 17 June 2019, financial income for the quarter includes DKK 202m due to changes
in estimates of earn-out and milestone payments due to lower impact from revenue of GI scopes in the earn-out period
ending October 2021.
• The working capital to revenue ratio is 21% (22%) based on rolling 12-month revenue.
• Free cash flows before acquisitions totalled DKK 148m (DKK 103m) for the quarter.
• Since 2015, Ambu and Tri-anim Health Services, a leading US specialty distributor, have been in partnership to make
Ambu’s single-use bronchoscopes the market leader. Today, Tri-anim covers 40% of Ambu’s revenue from sales of
aScope™ products within pulmonary endoscopy in the US market. As part of the ongoing initiative to expand our
direct sales force, Ambu and Tri-anim have mutually agreed to fully transition the sales of aScope™ products to Ambu
and the agreement has effect from 1 October 2019. We are confident that with our pipeline of new endoscope products
in markets including ENT and urology, we will be able to maximise revenue growth and cross-sales effects by going
direct. This is an attractive investment for Ambu as transition effects will be outweighed by higher long-term growth.
Furthermore, pricing policies towards distributors in the US will be changed with the purpose of optimizing prices.
These important investments will have a one-off effect in Q4 and will cause significant changes to the guidance for
the full year 2018/19 and 2019/20 and to the expected number of endoscopes sold.
The outlook for the full year as announced in company announcement no. 12 2018/19 on 17 June 2019 and with the
changes announced in company announcement no. 13 2018/19 on 22 August 2019 is now changed as follows:
Current financial year (2018/19)
• Organic growth of approx. 4-5% compared to previously 14-15%
• EBIT margin before special items of approx. 17% compared to previously approx. 22%
• Free cash flows of approx. DKK 200m compared to previously approx. DKK 375m.
• Sale of approx. 600,000 endoscope units in 2018/19 compared to previously stated 750,000
The changes to the outlook are caused by a decision to invest further in the US and to transition our distributor sales for
pulmonary endoscopy in the US and by a change of legacy business practice of offering rebates within the core business
on the US market. As part of the agreement to transition the distributor partnership, it has been agreed that Ambu will pay
a compensation of USD 20m. The compensation is a one-off cost in Q4, accounted in the form of special items and is
payable in Q4 2018/19 and Q1 2019/20. Further details on the changes to the financial guidance are described on page
11.
Big Five 2020 strategy (2019/20)
• Organic growth in 2019/20 is now estimated in the range of 16-22% compared to previously 16-19% driven by a change in the guidance for the full year 2018/19, as explained above, as well as a more conservative outlook.
• Sale of approx. 900,000 endoscope units in 2019/20 compared to previously approx. 1,000,000, due to the changes to the commercial infrastructure in the US as explained above.

The reason for the change to the outlook for organic growth and the number of endoscopes sold is the impact from transi-
tioning sales from the distributor in the US as well as the timing of transferring the accounts from the distributor to Ambu.
Assumptions regarding planned revenue from Ambu’s direct sales of all Visualization products including GI and ENT are
unchanged. Due to the significant expansion of the organisation and the investments that are being planned, the guidance
on EBIT and free cash flow will be available with the result for 2018/19 to be announced on 13 November 2019.
A conference call is being held today, 22 August 2019, at 10.00 (CEST). The conference will be held in English and can
be followed online at www.ambu.com/webcastQ32019. The presentation can be downloaded immediately before the con-
ference call via the same link. In order to be able to ask questions during the conference call, please call 5 minutes before
the start on tel. +45 3544 5577 and enter the following access code: 95008558#.
Investor relations
CFO, Michael Højgaard, [email protected] / +45 4030 4349
IR Manager, Nicolai Thomsen, [email protected] / +45 2620 8047
Media
Morten Huse Eikrem-Jeppesen, [email protected] / +45 5385 0770
Ambu A/S
Baltorpbakken 13
DK-2750 Ballerup
Denmark
Tel.: +45 7225 2000
CVR no.: 63 64 49 19
www.ambu.com
About Ambu Since 1937, breakthrough ideas have fuelled our work on bringing efficient healthcare solutions to life. This is what we create within our fields of excellence
– Visualization, Anaesthesia, and Patient Monitoring & Diagnostics. Millions of patients and healthcare professionals worldwide depend on the functionality
and performance of our products. We are dedicated to improving patient safety and determined to advance single-use devices. The manifestations of our
efforts range from early inventions like the Ambu Bag™ resuscitator and the legendary BlueSensor™ electrodes to our newest landmark solutions like the
Ambu® aScope™ – the world’s first single-use flexible endoscope. Our commitment to bringing new ideas and superior service to our customers has made
Ambu one of the most recognised medtech companies in the world. Headquartered near Copenhagen in Denmark, Ambu employs approximately 2,700
people in Europe, North America and the Asia Pacific. For more information, please visit www.ambu.com.

DKKm
Q3
2018/19
Q3
2017/18
YTD
2018/19
YTD
2017/18
FY
2017/18
Income statement
Revenue 773 673 2,214 1,877 2,606
Gross margin, % 56.4 59.7 58.8 59.5 59.4
EBITDA before special items 186 182 544 484 678
Depreciation -15 -12 -38 -35 -49
Amortisation -16 -19 -44 -51 -66
EBIT before special items 155 151 462 398 563
EBIT 117 151 424 398 563
Net financials 164 -4 109 -71 -98
Profit before tax 281 147 533 327 465
Net profit for the period 216 112 409 231 337
Balance sheet
Assets 4,357 4,167 4,357 4,167 4,234
Net working capital 624 558 624 558 535
Equity 2,226 1,863 2,226 1,863 1,882
Net interest-bearing debt 1,112 1,410 1,112 1,410 1,245
Cash flows
Cash flows from operating activities 225 181 381 338 554
-77 -78 -177 -177 -233
Free cash flows before acquisitions of enterprises and technology 148 103 204 161 321
Acquisitions of enterprises and technology -1 -76 -2 -928 -928
Cash flows from operating activities, % of revenue 29 27 17 18 21
Investments, % of revenue -10 -12 -8 -9 -9
19 15 9 9 12
Key figures and ratios
Organic growth, % 10 17 13 15 15
Rate of cost, % 36 37 38 38 38
EBITDA margin before special items, % 24.1 27.0 24.6 25.8 26.0
EBIT margin before special items, % 20.1 22.4 20.9 21.2 21.6
Tax rate, % 23 24 23 29 28
Return on equity, % 25 19 25 19 21
NIBD/EBITDA before special items 1.5 2.2 1.5 2.2 1.8
Equity ratio, % 51 45 51 45 44
Net working capital, % of revenue 21 22 21 22 21
Return on invested capital (ROIC), % 15 15 15 15 17
Average number of employees 3,006 2,730 2,909 2,680 2,712
Share-related ratios
Market price per share (DKK) 106 215 106 215 154
Earnings per share (EPS) (DKK) 0.88 0.46 1.67 0.95 1.39
Diluted earnings per share (EPS-D) (DKK) 0.87 0.45 1.65 0.92 1.36
Free cash flows before acquisitions of enterprises and technology,
% of revenue
Cash flows from investing activities before acquisitions of
enterprises and technology

Q3 2018/19
In Q3 2018/19, Ambu’s long-term growth potential was
significantly strengthened.
Appointment of new CEO
On 10 May 2019, Ambu’s Board of Directors appointed
Juan Jose Gonzalez as the new CEO, effective 15 May
2019, to replace Lars Marcher, who resigned from his
position.
Lars Marcher’s resignation entailed one-off costs of DKK
38m, which for accounting purposes are recognised in
the income statement as special items. The costs re-
lated, among other things, to salary during the notice pe-
riod the value of share options already granted, calcu-
lated according to the Black Scholes formula, as well as
expenses in the recruitment of a new CEO.
Partnership with Cook Medical
On 18 May 2019, Cook Medical and Ambu announced a
partnership under which Cook Medical will distribute
Ambu’s single-use duodenoscope in the US. The prod-
uct is well under development and is expected to be
launched before the end of September 2020.
Duodenoscopes are used for ERCP procedures, which
involve examinations of the pancreatic and bile ducts. An
ERCP procedure requires a combination of scope and
tools, and Cook Medical is the second-largest provider of
ERCP tools on the US market. The partnership with
Cook Medical will enhance Ambu’s ability to successfully
enter the market for duodenoscopy.
Visualization portfolio pipeline update
On 17 June 2019, Ambu announced an updated product
pipeline which includes several new products. The prod-
ucts, which Ambu had not previously announced, were a
new aScope™ 5 Broncho, a new ureteroscope, a new
monitor platform that allows full HD quality, and a re-
placement of the SC210 colonoscope with a superior
scope based on classic wheel technology.
During Q3 2018/19, Ambu secured the approval of its
ENT portfolio in the US. The initial results of the launch
are promising in especially the US and the UK where we
see a faster uptake compared to previous launches.
Investments in commercial infrastructure
The announcement on 17 June 2019 included the deci-
sion to accelerate Ambu’s investments in commercial in-
frastructure in the US, Europe and Asia Pacific with the
purpose of maximising the value and strengthening of
our position as a global leader in single-use Visualiza-
tion.
The expansion of the sales force will include additional
sales reps, clinical trainers and an expansion of market-
ing capabilities in all our key markets, and will more than
double our global Visualization sales force. To maximise
the impact on growth in 2019/20 and beyond, hiring has
started in Q4 2018/19, with an estimated cost in 2018/19
of approx. DKK 20m.
Settlement with US authorities
In Q2, Ambu reached an agreement in principle to settle
a dispute with US authorities concerning compliance with
laws and regulations governing sales to US government
institutions. The financial implications of the settlement
are limited to the payment of a restitution totalling USD
3.3 million. Provisions in a similar amount have been
made and expensed in earlier accounting periods, and
the settlement will therefore have no further impact on
Ambu’s EBIT earnings, nor will it impact Ambu’s growth
opportunities in the USA. The settlement has been finally
agreed in August 2019.
BUSINESS AREAS (Comparative figures are stated in brackets. Unless otherwise
stated, growth is stated as organic growth.)
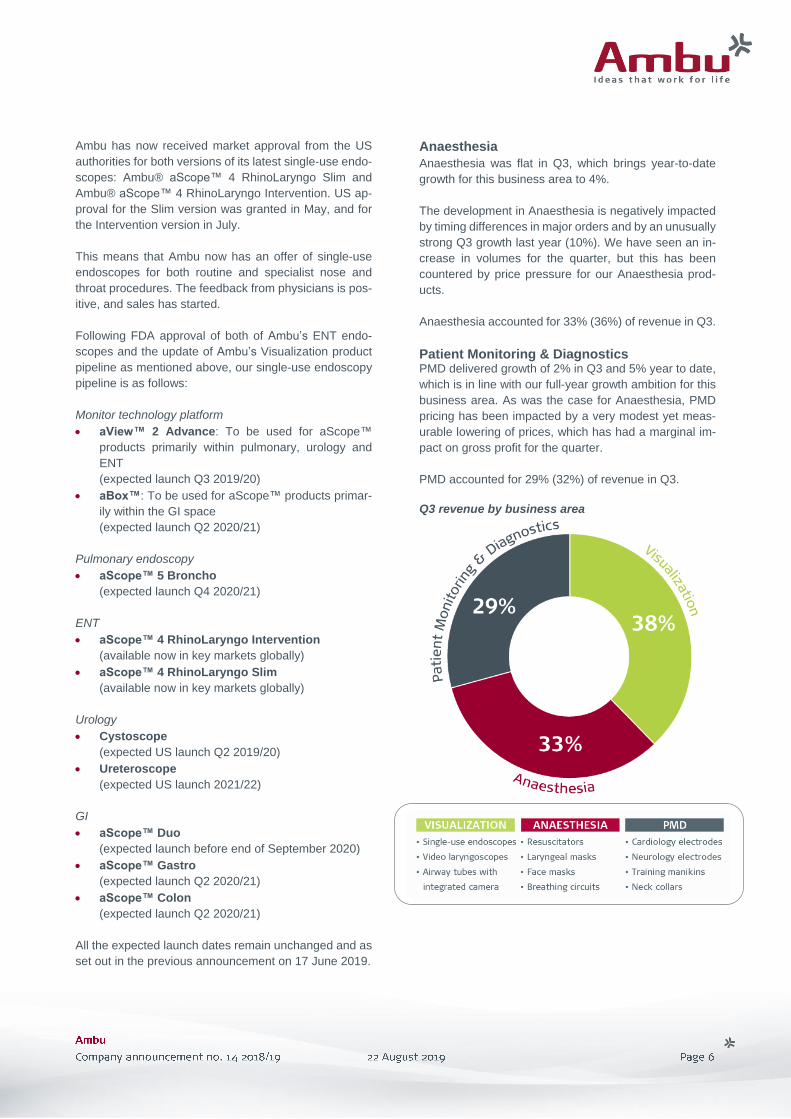
Visualization
Visualization delivered growth of 30% for Q3, and 32%
year to date. Visualization accounted for 38% (32%) of
revenue for the quarter.
Sales of endoscopes totalled 194,000 units in Q3, repre-
senting a 33% increase, while sales year to date stood
at 525,000 units, which also equates to a 33% increase.
In FY 2017/18, we sold 560,000 endoscopes, and includ-
ing the impact from transitioning the US distribution part-
nership, we now expect to sell approx. 600,000 units in
the current financial year.
Revenue – business areas
Q3 Composition of growth YTD Composition of growth
18/19 Split 17/18 Organic IFRS 15 Currency Reported 18/19 Split 17/18 Organic IFRS 15 Currency Reported
Visualization 295 38% 218 30% 2% 3% 35% 809 36% 587 32% 2% 4% 38%
Anaesthesia 257 33% 244 0% 2% 3% 5% 748 34% 679 4% 2% 4% 10%
PMD 221 29% 211 2% 1% 2% 5% 657 30% 611 5% 1% 2% 8%
Revenue 773 100% 673 10% 2% 3% 15% 2,214 100% 1,877 13% 2% 3% 18%
Ambu has now received market approval from the US
authorities for both versions of its latest single-use endo-
scopes: Ambu® aScope™ 4 RhinoLaryngo Slim and
Ambu® aScope™ 4 RhinoLaryngo Intervention. US ap-
proval for the Slim version was granted in May, and for
the Intervention version in July.
This means that Ambu now has an offer of single-use
endoscopes for both routine and specialist nose and
throat procedures. The feedback from physicians is pos-
itive, and sales has started.
Following FDA approval of both of Ambu’s ENT endo-
scopes and the update of Ambu’s Visualization product
pipeline as mentioned above, our single-use endoscopy
pipeline is as follows:
Monitor technology platform
• aView™ 2 Advance: To be used for aScope™
products primarily within pulmonary, urology and
ENT
(expected launch Q3 2019/20)
• aBox™: To be used for aScope™ products primar-
ily within the GI space
(expected launch Q2 2020/21)
Pulmonary endoscopy
• aScope™ 5 Broncho
(expected launch Q4 2020/21)
ENT
• aScope™ 4 RhinoLaryngo Intervention
(available now in key markets globally)
• aScope™ 4 RhinoLaryngo Slim
(available now in key markets globally)
Urology
• Cystoscope
(expected US launch Q2 2019/20)
• Ureteroscope
(expected US launch 2021/22)
GI
• aScope™ Duo
(expected launch before end of September 2020)
• aScope™ Gastro
(expected launch Q2 2020/21)
• aScope™ Colon
(expected launch Q2 2020/21)
All the expected launch dates remain unchanged and as
set out in the previous announcement on 17 June 2019.
Anaesthesia
Anaesthesia was flat in Q3, which brings year-to-date
growth for this business area to 4%.
The development in Anaesthesia is negatively impacted
by timing differences in major orders and by an unusually
strong Q3 growth last year (10%). We have seen an in-
crease in volumes for the quarter, but this has been
countered by price pressure for our Anaesthesia prod-
ucts.
Anaesthesia accounted for 33% (36%) of revenue in Q3.
Patient Monitoring & Diagnostics PMD delivered growth of 2% in Q3 and 5% year to date,
which is in line with our full-year growth ambition for this
business area. As was the case for Anaesthesia, PMD
pricing has been impacted by a very modest yet meas-
urable lowering of prices, which has had a marginal im-
pact on gross profit for the quarter.
PMD accounted for 29% (32%) of revenue in Q3.
Q3 revenue by business area

FINANCIAL RESULTS INCOME STATEMENT Revenue Revenue of DKK 773m was posted for Q3, representing
organic growth of 10%, and 15% reported growth. Year
to date, revenue totals DKK 2,214m, equating to organic
growth of 13%, or 18% reported growth.
Growth in North America was 15% (18%) for the quar-
ter. In North America, Visualization grew 49%, while An-
aesthesia grew -1% and PMD 1% in Q3.
Sales momentum continues to be strong for Visualization
in North America, while growth in Anaesthesia and PMD
was low due to timing differences in purchase patterns
and, to a lesser degree, price pressure.
In Europe, growth of 5% (18%) was realised in Q3. For
the quarter, growth rates in the European markets were
14% for Visualization, 2% for Anaesthesia and 1% for
PMD.
As regards single-use endoscopes, the markets in North-
ern Europe are more mature than, for instance, in Spain
and Italy. Therefore, we see high penetration and low
growth in Scandinavia, the UK, Germany and France,
whereas we see low penetration and high growth in
Southern Europe. The growth for Anaesthesia and PMD
was low compared to the strong Q3 last year.
The Rest of the world – comprising Asia, Australia and
markets in the Middle East, Africa and Latin America –
realised growth of 9% (7%) in Q3. Growth was 10% for
Visualization, 5% for Anaesthesia and 12% for PMD.
In Q2, we started to obtain the price codes which are
necessary for sales of single-use endoscopes in China,
and in Q3 we have seen strong growth albeit from low
initial volumes. In Australia, the growth for Visualization
reflects the fact that this market is more mature, whereas
the growth in Anaesthesia has been relatively strong.
Growth in the Middle East, Africa and Latin America has
been negatively impacted by fluctuations in major orders
from NGOs and distributors. However, PMD has seen
growth across the Rest of the world markets with peaks
in the Middle East.
Revenue (DKKm) and growth (%) per quarter
Currency exposure
Ambu’s revenue is exposed, in particular, to the USD, as
approx. 50% of revenue is invoiced in USD. The rest of
Ambu’s revenue is invoiced mainly in EUR and DKK,
while GBP accounts for approx. 5% of revenue. Ambu’s
exposure to GBP is shown in the table below.
Moreover, EBIT is exposed to developments in the Chi-
nese currency CNY and the Malaysian currency MYR,
as a significant proportion of the value of Ambu’s produc-
tion in the Far East is settled in these two currencies.
The foreign currency sensitivity of revenue and EBIT, re-
spectively, can be summarised over a 12-month period
as follows, based on a 10% increase in exchange rates
against DKK:
DKKm USD MYR CNY GBP
Revenue 160 0 0 15
EBIT 45 -15 -15 10
EBIT margin +0.3% -0.5% -0.5% +0.3%
Gross profit
Gross profit for Q3 was DKK 436m (DKK 402m), while
the gross margin decreased from 59.7% to 56.4%. The
lower gross margin reported in Q3 2018/19 is negatively
affected by 3 percentage points due to the discontinua-
tion of the SC210 which has led to a DKK 25m one-off
write-down relating to raw materials and finished goods.
Adjusted for the discontinuation of SC210, the gross
margin for Q3 is 59.6%.
Revenue – markets
Q3 Composition of growth YTD Composition of growth
18/19 Split 17/18 Organic IFRS 15 Currency Reported 18/19 Split 17/18 Organic IFRS 15 Currency Reported
North America 383 49% 306 15% 3% 7% 25% 1,074 49% 844 17% 3% 7% 27%
Europe 300 39% 285 5% 0% 0% 5% 884 40% 814 8% 0% 1% 9%
Rest of the world 90 12% 82 9% 0% 1% 10% 256 11% 219 14% 0% 3% 17%
Revenue 773 100% 673 10% 2% 3% 15% 2,214 100% 1,877 13% 2% 3% 18%
Costs
Total capacity costs for the quarter were DKK 281m
(DKK 251m), and are thus up 12%, which reflects the
continued investments made in the sales organization in
recent quarters, the recognition of GPO fees as well as
release of accruals in previous quarters in respect of
long-term incentives for management due to adjust-
ments to the long-term financial guidance.
Year to date, total capacity costs amounted to DKK 839m
(DKK 719m).
The rate of cost for Q3 was 36% (37%).
Selling and distribution costs totalled DKK 190m (DKK
155m), corresponding to an increase of 23%. Compared
to Q2, selling and distribution costs increased by 5%,
which is in line with expectations.
Development costs year to date totalled DKK 76m (DKK
84m). The correlation between capitalisation of develop-
ment costs and amortisation in the income statement is
shown in the table below. Amortisation of DKK 45m and
investments of DKK 119m have been recognised, taking
cash development costs to DKK 150m year to date, of
which 51% (77%) have been expensed. The share of de-
velopment costs expensed is declining, as the number
and value of development projects are going up, while
the fixed, non-allocable costs are largely unchanged. In
line with Ambu’s accounting policies, development pro-
jects are amortised over 5-10 years from the moment the
products are launched commercially.
DKKm YTD
18/19 17/18
Development costs 76 84
÷ Amortisation related thereto -45 -49
+ Investments 119 74
= Cash flows 150 109
Of which expensed 51% 77%
Management and administrative expenses for the quar-
ter totalled DKK 65m (DKK 62m). The expenses are in
line with Q2 after adjusting for management’s long-term
incentives in Q3 as a consequence of lowering the long-
term financial guidance on 17 June 2019.
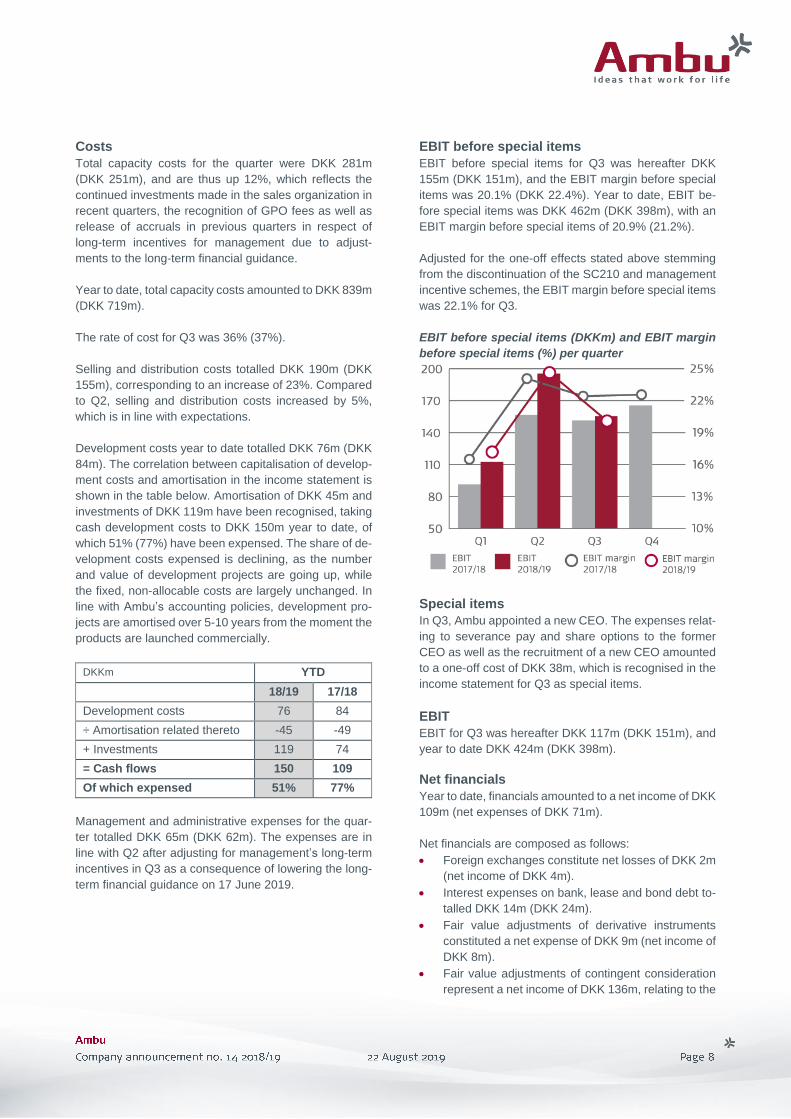
EBIT before special items
EBIT before special items for Q3 was hereafter DKK
155m (DKK 151m), and the EBIT margin before special
items was 20.1% (DKK 22.4%). Year to date, EBIT be-
fore special items was DKK 462m (DKK 398m), with an
EBIT margin before special items of 20.9% (21.2%).
Adjusted for the one-off effects stated above stemming
from the discontinuation of the SC210 and management
incentive schemes, the EBIT margin before special items
was 22.1% for Q3.
EBIT before special items (DKKm) and EBIT margin
before special items (%) per quarter
Special items
In Q3, Ambu appointed a new CEO. The expenses relat-
ing to severance pay and share options to the former
CEO as well as the recruitment of a new CEO amounted
to a one-off cost of DKK 38m, which is recognised in the
income statement for Q3 as special items.
EBIT
EBIT for Q3 was hereafter DKK 117m (DKK 151m), and
year to date DKK 424m (DKK 398m).
Net financials
Year to date, financials amounted to a net income of DKK
109m (net expenses of DKK 71m).
Net financials are composed as follows:
• Foreign exchanges constitute net losses of DKK 2m
(net income of DKK 4m).
• Interest expenses on bank, lease and bond debt to-
talled DKK 14m (DKK 24m).
• Fair value adjustments of derivative instruments
constituted a net expense of DKK 9m (net income of
DKK 8m).
• Fair value adjustments of contingent consideration
represent a net income of DKK 136m, relating to the

acquisition of Invendo Medical GmbH (expense of
DKK 57m).
• The interest element from liabilities stated at present
amortised value is recognised as a net expense of
DKK 2m (DKK 2m).
According to the terms agreed when acquiring Invendo
Medical GmbH in October 2017, changes to the fair
value of contingent consideration to former Invendo
Medical GmbH shareholders, as announced on 17 June
2019, has led to a net financial income of DKK 136m Q3
year to date.
This net financial income consists of the following ele-
ments:
• Adjustment of the fair value of contingent earn-out
payments has led to non-cash financial income of
DKK 187m in Q3. To achieve the minimum thresh-
old of the earn-out, accumulated revenue from sale
of GI-products in the period October 2017 to Octo-
ber 2021 must be EUR 75m. Based on the latest es-
timates this revenue is not going to be achieved and
the value of the earn-out is now valued at DKK 0m.
• Adjustment of the fair value of the contingent mile-
stones has led to non-cash financial income of DKK
15m in Q3. When Ambu receives FDA approval for
the “aScope™ Duo” and the “aScope™ Gastro”,
milestones of EUR 40m and 20m respectively will be
payable. Changes to timelines relating to these con-
tingent payments have caused a non-cash financial
income of DKK 15m in Q3.
• According to the ordinary amortization plan set in
conjunction with the purchase price allocation of In-
vendo Medical GmbH the unwinding of cash flows
relating to milestones and earn-out has caused a
non-cash financial cost of DKK 66m.
With respect to unwinding of cash flows for the remaining
of the year we expect to incur additional costs of DKK
15m for Q4, and DKK 55m for 2019/20. These fair value
adjustments have no cash flow effects.
Tax
The profit before tax for the quarter was taxed at a rate
of 23% (24%), adjusted for non-deductible and non-tax-
able items. Year to date, the tax rate was 23% (29%).
The reduction in the effective tax rate year to date com-
pared to last year is because the tax figure for 2017/18
was impacted by the US tax reform and the impairment
of the tax asset to which this gave rise.
Net profit
A net profit of DKK 216m (DKK 112m) was posted for the
quarter. The result year to date is hereafter a net profit of
DKK 409m (DKK 231m), corresponding to 18% (12%) of
revenue. The primary reason for the increase in net profit
is the one-off net effect from lower than previously ex-
pected earn-out payments, discontinuation of SC210
and special items.
Earnings per share (EPS)
Year to date, earnings per share were DKK 1.67 (DKK
0.95), affected by the one-off items described above. In
addition, the development from last year is positively af-
fected by non-cash items of DKK 19m in 2017/18 due to
a reduction in the federal income tax rate in the US to
21%.
At the end of June 2019, Ambu had total assets of DKK
4,357m (DKK 4,167m).
At the end of Q3, the contingent consideration related to
the milestone payment maturing upon FDA approval of
duodenoscope (EUR 40m) is classified as short-term at
a fair value of DKK 254m as opposed to non-current in
previous quarters. The payment of EUR 40m will be
funded out of Ambu’s existing credit facilities.
The net working capital at the end of the quarter was
DKK 624m (DKK 558m), corresponding to 21% (22%) of
12 months’ revenue.
Trade receivables totalled DKK 535m at the end of the
quarter against DKK 429m at the same time last year.
Calculated at fixed exchange rates, the average number
of credit days was 59 (55). The credit risk attaching to
outstanding debtors is unchanged, and the quarter was
not affected by bad debts to any significant extent.
Inventories totalled DKK 418m at the end of the quarter
against DKK 387m at the same time last year and are
composed of raw materials at factories and finished
goods at central warehouse locations. Calculated at
fixed exchange rates, the increase is 7%. The growth in
absolute values is due to a build-up of inventories of fin-
ished goods to support growth and the build-up of safety
stock in raw materials at our factories. The average fin-
ished goods turnover ratio is 6.7 (6.0).
Trade payables and other payables totalled DKK 384m
(DKK 306m). The increase is primarily due to special
items, discontinuation of SC210 and timing differences.
Cash and cash equivalents amounted to DKK 26m (DKK
27m), and total net interest-bearing debt at the end of the
quarter was DKK 1,112m (DKK 1,410m), corresponding
to 1.5 (2.2) of rolling 12-month EBITDA before special
items.

At the end of Q3, Ambu had unutilised credit facilities of
approx. DKK 1.3bn (DKK 1.0bn).
(Unless otherwise stated, all values refer to cash flows year to
date.)
Cash flows from operating activities totalled DKK 225m
(DKK 181m) for the quarter and DKK 381m (DKK 338m)
year to date. The large fluctuation between the quarters
in H1 and H2 is in line with expectations, including the
cash flow impact from transitioning the distributor in the
US in Q4.
Investments in non-current assets totalled DKK 177m
(DKK 177m), which are distributed in DKK 119m (DKK
74m) that related to development activities, and DKK
58m (DKK 103m – of which DKK 70m related to build-
ings) that primarily were investments in Ambu’s produc-
tion facilities. For the full year, total investments of ap-
prox. DKK 250m are expected, of which development
costs will constitute about 70%.
Free cash flows before acquisitions of enterprises to-
talled DKK 204m (DKK 161m), corresponding to 9% of
revenue (9%).
Cash flows from financing activities amounted to DKK
-248m (DKK 772m). This includes changes to long-term
loans and the payment of dividend. The difference rela-
tive to the end of Q3 last year is due primarily to proceeds
from the capital increase, the repayment of bridge financ-
ing in connection with the acquisition of Invendo Medical
GmbH, as well as the purchase of treasury shares.
Changes in cash and cash equivalents totalled DKK
-46m (DKK 5m).
At the end of Q3, equity totalled DKK 2,226m (DKK
1,863m), with an equity ratio of 51% (45%).
Other comprehensive income
Other comprehensive income includes a translation ad-
justment year to date arising from the translation of for-
eign subsidiaries of DKK 24m (DKK 20m) because of a
strengthening of the USD/DKK exchange rate by 2%
since the end of the previous financial year.
Other equity
At the general meeting held on 12 December 2018, it
was decided to pay dividend of DKK 101m. Since the
general meeting, all DKK 101m in proposed dividend
have been distributed, including DKK 3m on Ambu’s
portfolio of treasury shares.
At the end of Q3, Ambu employees had exercised a total
of 842,429 purchase options in Ambu A/S.
In accordance with Ambu’s remuneration policy, a gen-
eral employee share programme for 2018/19 was estab-
lished in Q1, while the general employee share pro-
gramme for 2016/17 has expired, and Ambu’s obliga-
tions in this respect have thus been fulfilled. Conse-
quently, the holding of treasury shares was reduced by
128,751 Class B shares in Ambu A/S.
At the end of Q3, Ambu’s holding of treasury Class B
shares had hereafter been reduced by 971,180 to
6,767,239 (7,738,419), corresponding to 2.688%
(3.083%) of the total share capital.
In addition, at the end of Q3, Ambu employees had ex-
ercised a total of 455,000 warrants to subscribe for
shares in Ambu A/S.

The outlook for the full year as announced in company announcement no. 12 2018/19 on 17 June 2019 and with the
changes announced in company announcement no. 13 2018/19 on 22 August 2019 is now changed as follows:
Local currencies
22 August
2019
17 June
2019
1 May
2019
31 January
2019
13 November
2018
Organic
growth Approx. 4-5% Approx. 14-15% Approx. 15-16% Approx. 15-16% Approx. 15-16%
Danish kroner
22 August
2019
17 June
2019
1 May
2019
31 January
2019
13 November
2018
EBIT margin
before spe-
cial items
Approx. 17% Approx. 22% Approx. 22-24% Approx. 22-24% Approx. 22-24%
Free cash
flows*
Approx. DKK
200m
Approx. DKK
375m
Approx. DKK
400-475m
Approx. DKK
400-475m
Approx. DKK
400-475m * Before acquisitions
The changes to the outlook for organic growth are mainly cause by two decisions:
• A decision by Ambu to further invest in the US and transition the partnership with Tri-anim Health Services, who has
been selling aScope™ Broncho in the US since 2015, and instead sell directly through Ambu’s own sales force. The
agreement to end the partnership was entered on 22 August 2019 and takes effect from 1 October 2019. The reason
for the change is that we are confident that with our pipeline of new endoscope products in markets including ENT
and urology, we will be able to maximise revenue growth and cross-sales effects by going direct. The transition is
agreed amicably, and Ambu will, with the purpose to support a smooth migration, cancel already agreed sales orders
for September 2019 and buy back existing inventories at Ambu’s initial transfer price. These transactions will reduce
already expected revenue in 2018/19 by approx. DKK 200m and cause a cash payment of approx. DKK 120m when
buying back inventories from the distributor by end of Q4.
The inventory that is bought back will be added to Ambu’s existing inventory and be sold in H1 2019/20 on normal
terms and at full retail price. It is estimated, that the inventory equals approx. 95,000 aScope units. These units have
in previous quarters been sold and hence reported as part of Ambu’s revenue and must therefore be offset against
our Q4 revenue and unit sales. This will reduce our full year revenue and unit sales together with orders worth approx.
DKK 80m, or 55,000 units, expected for Q4 that are now canceled because the distribution partnership has been
concluded.
Finally, to end the partnership, Tri-anim will be paid a compensation of USD 20m which will be accrued in Q4 and
accounted in the form of special items and is payable with 50% each in Q4 2018/19 and Q1 2019/20.
The sales of endoscopes for 2018/19 are now expected to be 600,000 units compared to previously 750,000. The
decline reflects the short-term impact from transitioning the distributor to Ambu’s direct sales organisation in the US.
• A decision to change a legacy business practice of offering rebates to a range of distributors within the core business
on the US market. The change in pricing is estimated to reduce revenue for 2018/19 by approx. DKK 50m while
revenue in 2019/20 is estimated to be positively impacted due to the improved pricing.

The impact of the above equals a total reduction in revenue by DKK 250m which will reduce the current estimate for
2018/19 full year growth by approx. 10%-pts to now approx. 4-5% growth and make growth for Q4 negative by approx.
18%. Going forward these changes will enable Ambu to achieve stronger growth at better prices, as the margin and the
rebates that are currently shared with distributors to a large extent can be added back to revenue. Our end-customers
using Ambu’s products are not foreseen to be impacted by these changes.
The impact from the reduction of the full year revenue by DKK 250m is expected to reduce the EBIT margin before special
items for the full year 2018/19 from approx. 22% to approx. 17%.
The impact to the free cash flows for the financial year 2018/19 from the above is estimated to be approx. DKK 175m which
will reduce the guidance for 2018/19 to approx. DKK 200m.
The financial impact from the changes described will all be posted in Q4 2018/19 and have full impact on the full year
2018/19 results.
The overall impact to the organic growth for prior years that the changes to pricing policies and transitioning the distributor
partnership in the US would have had, if the changes were to be cascaded backwards, are not significant. Specifically, for
Q3 2018/19 and the financial year 2017/18, the net effect to organic growth would have been nil.
The outlook for 2018/19 is based on the following exchange rate assumptions:
Forward-looking statements
Forward-looking statements, especially such as relate to future revenue and operating profit, are subject to risks and
uncertainties. Various factors, many of which are outside Ambu’s control, may cause the actual development to differ
materially from the expectations contained in this report. Factors that might affect such expectations include, among others,
changes in health care, in the world economy, in interest rate levels and in exchange rates.
Exchange rate assumptions for 2018/19
22 August 2019 1 May 2019 31 January 2019 13 November 2018
USD/DKK 660 660 650 650
CNY/DKK 97 97 95 95
MYR/DKK 160 160 155 155
GBP/DKK 840 860 850 830
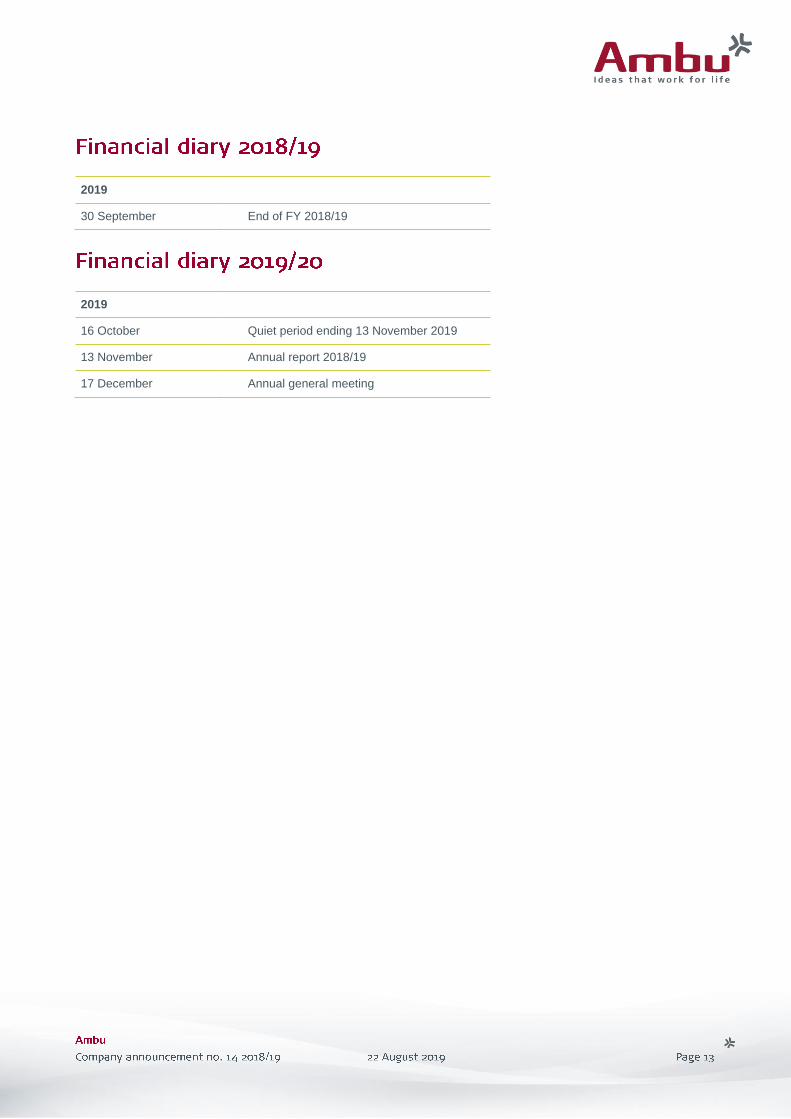
2019
30 September End of FY 2018/19
2019
16 October Quiet period ending 13 November 2019
13 November Annual report 2018/19
17 December Annual general meeting

DKKm
Q3
2018/19
Q2
2018/19
Q1
2018/19
Q4
2017/18
Q3
2017/18
Q2
2017/18
Q1
2017/18
Composition of net revenue, products:
Visualization 295 283 231 249 218 211 158
Anaesthesia 257 260 231 247 244 228 207
PMD 221 242 194 233 211 212 188
Revenue 773 785 656 729 673 651 553
Key figures, revenue:
Endoscopes sold, ’000 units 194 182 149 165 146 145 104
Growth in number of endoscopes sold, % 33 26 43 43 54 53 76
Composition of reported growth:
Organic growth, % 10 14 15 15 17 15 14
IFRS 15 effects on reported growth, % 2 2 1 0 0 0 0
Exchange rate effects on reported growth, % 3 5 3 1 -5 -9 -6
Reported revenue growth, % 15 21 19 16 12 6 8
Organic growth, products:
Visualization, % 30 27 42 39 47 43 58
Anaesthesia, % 0 5 8 6 10 8 0
PMD, % 2 10 1 5 2 3 4
Organic growth, % 10 14 15 15 17 15 14
Organic growth, markets:
North America, % 15 16 20 18 18 16 16
Europe, % 5 9 11 12 18 14 12
Rest of the world, % 9 24 10 13 7 17 12
Organic growth, % 10 14 15 15 17 15 14
Revenue 773 785 656 729 673 651 553
Production costs -337 -313 -263 -299 -271 -257 -232
Gross profit 436 472 393 430 402 394 321
Gross margin, % 56.4 60.1 59.9 59.0 59.7 60.5 58.0
Selling and distribution costs -190 -181 -182 -165 -155 -146 -141
Development costs -26 -23 -27 -27 -34 -26 -24
Management and administration -65 -73 -72 -73 -62 -66 -65
Total capacity costs -281 -277 -281 -265 -251 -238 -230
Operating profit (EBIT) before special items 155 195 112 165 151 156 91
EBIT margin before special items, % 20.1 24.8 17.1 22.6 22.4 24.0 16.5
Special items -38 0 0 0 0 0 0
Operating profit (EBIT) 117 195 112 165 151 156 91
EBIT margin, % 15.1 24.8 17.1 22.6 22.4 24.0 16.5
Financial income 131 5 0 0 3 6 3
Financial expenses 33 -30 -30 -27 -7 -44 -32
Profit before tax (PBT) 281 170 82 138 147 118 62
Tax on profit for the period -65 -40 -19 -32 -35 -27 -34
Net profit for the period 216 130 63 106 112 91 28

DKKm
Q3
2018/19
Q2
2018/19
Q1
2018/19
Q4
2017/18
Q3
2017/18
Q2
2017/18
Q1
2017/18
Balance sheet:
Assets 4,357 4,418 4,262 4,234 4,167 4,046 3,894
Net working capital 624 713 568 535 558 538 457
Equity 2,226 2,075 1,874 1,882 1,863 1,743 1,918
Net interest-bearing debt 1,112 1,266 1,274 1,245 1,410 1,241 981
Cash flows, in DKKm:
Cash flows from operating activities 225 63 93 216 181 70 87
Cash flows from investing activities before
acquisitions of enterprises and technology -77 -52 -48 -56 -78 -48 -51
148 11 45 160 103 22 36
Acquisitions of enterprises and technology -1 -1 0 0 -76 -1 -851
Cash flows, in % of revenue:
Cash flows from operating activities 29 8 14 30 27 11 16
Cash flows from investing activities before
acquisitions of enterprises and technology -10 -7 -7 -8 -12 -8 -9
19 1 7 22 15 3 7
Key figures and ratios:
Capacity costs 281 277 281 265 251 238 230
Rate of cost, % 36 35 43 36 37 37 42
EBITDA before special items 186 221 137 194 182 184 118
EBITDA margin before special items, % 24.1 28.2 20.9 26.6 27.0 28.3 21.3
Depreciation -15 -12 -11 -14 -12 -12 -11
Amortisation -16 -14 -14 -15 -19 -16 -16
EBIT before special items 155 195 112 165 151 156 91
EBIT margin before special items, % 20.1 24.8 17.1 22.6 22.4 24.0 16.5
NIBD/EBITDA before special items 1.5 1.7 1.8 1.8 2.2 2.0 1.7
Net working capital, % of revenue 21 25 21 21 22 22 19
Share-related ratios:
Market price per share (DKK) 106 176 157 154 215 136 111
Earnings per share (EPS) (DKK) 0.88 0.53 0.26 0.44 0.46 0.37 0.12
Diluted earnings per share (EPS-D) (DKK) 0.87 0.52 0.25 0.43 0.45 0.36 0.11
Free cash flows before acquisitions of
enterprises and technology
Free cash flows before acquisitions of
enterprises and technology

The Board of Directors and the Executive Board have considered and approved the interim report of Ambu A/S for the
period 1 October 2018 to 30 June 2019. The interim report has not been audited or reviewed by the company’s inde-
pendent auditors.
The interim report is presented in accordance with IAS 34 – Interim Financial Reporting as adopted by the EU and
additional Danish disclosure requirements for the interim reporting of listed companies.
We consider the accounting policies applied to be expedient, the group’s internal controls relevant to preparing and
presenting the interim report to be adequate and the interim report to give a true and fair view of the group’s assets,
liabilities, results and financial position as at 30 June 2019 and of the results of the group’s operations and cash flows
for the period 1 October 2018 to 30 June 2019.
We further consider that the management’s review gives a true and fair view of the development in the group’s activities
and financial affairs, the profit for the period and the group’s financial position as a whole as well as a description of the
most significant risks and uncertainties to which the group is subject.
Ballerup, 22 August 2019
Executive Board
Juan Jose Gonzalez
CEO Michael Højgaard
CFO
Board of Directors
Jens Bager
Chairman Mikael Worning
Vice-Chairman Oliver Johansen
Christian Sagild Henrik Ehlers Wulff Thomas Lykke Henriksen
Elected by the employees
Jakob Koch
Elected by the employees
Jakob Bønnelykke Kristensen
Elected by the employees

Page 18 Income statement and statement of comprehensive income – Group Page 19 Balance sheet – Group Page 20 Cash flow statement – Group Page 21 Statement of changes in equity – Group Page 22 Notes to the interim report
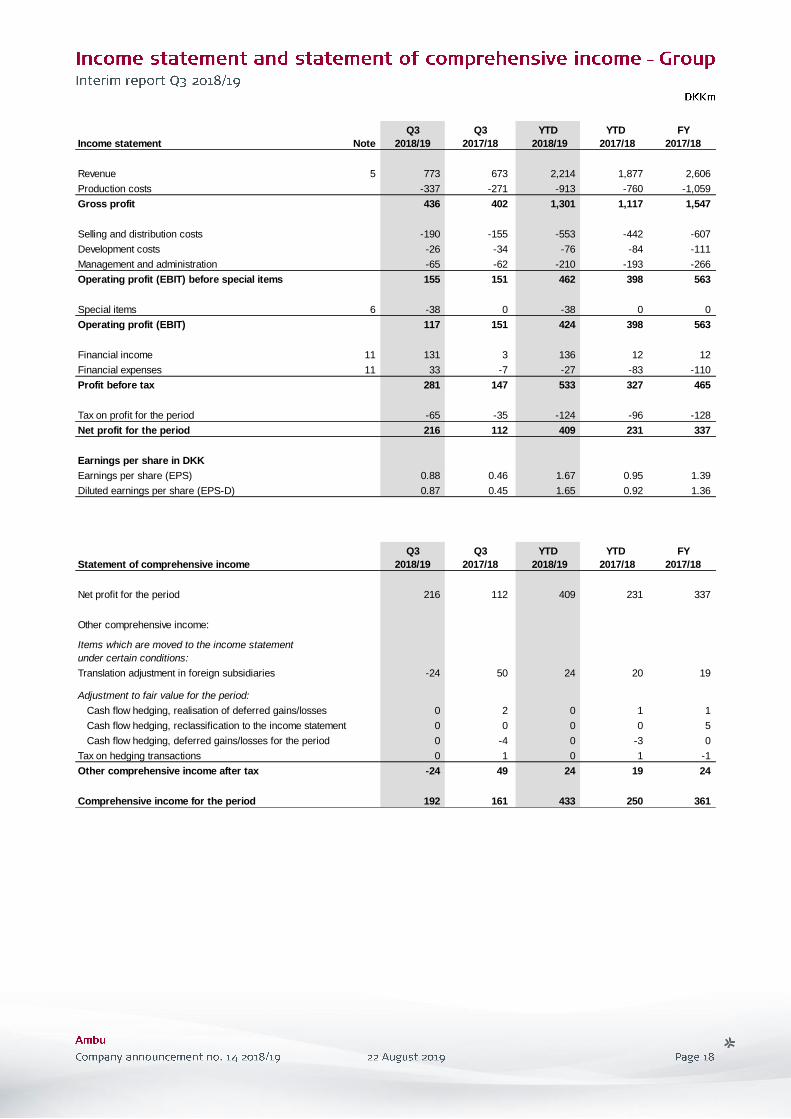
Income statement Note
Q3
2018/19
Q3
2017/18
YTD
2018/19
YTD
2017/18
FY
2017/18
Revenue 5 773 673 2,214 1,877 2,606
Production costs -337 -271 -913 -760 -1,059
Gross profit 436 402 1,301 1,117 1,547
Selling and distribution costs -190 -155 -553 -442 -607
Development costs -26 -34 -76 -84 -111
Management and administration -65 -62 -210 -193 -266
Operating profit (EBIT) before special items 155 151 462 398 563
Special items 6 -38 0 -38 0 0
Operating profit (EBIT) 117 151 424 398 563
Financial income 11 131 3 136 12 12
Financial expenses 11 33 -7 -27 -83 -110
Profit before tax 281 147 533 327 465
Tax on profit for the period -65 -35 -124 -96 -128
Net profit for the period 216 112 409 231 337
Earnings per share in DKK
Earnings per share (EPS) 0.88 0.46 1.67 0.95 1.39
Diluted earnings per share (EPS-D) 0.87 0.45 1.65 0.92 1.36
Statement of comprehensive income
Q3
2018/19
Q3
2017/18
YTD
2018/19
YTD
2017/18
FY
2017/18
Net profit for the period 216 112 409 231 337
Other comprehensive income:
Items which are moved to the income statement
under certain conditions:
Translation adjustment in foreign subsidiaries -24 50 24 20 19
Adjustment to fair value for the period:
Cash flow hedging, realisation of deferred gains/losses 0 2 0 1 1
Cash flow hedging, reclassification to the income statement 0 0 0 0 5
Cash flow hedging, deferred gains/losses for the period 0 -4 0 -3 0
Tax on hedging transactions 0 1 0 1 -1
Other comprehensive income after tax -24 49 24 19 24
Comprehensive income for the period 192 161 433 250 361

Assets Note 30.06.19 30.06.18 30.09.18
Acquired technologies, trademarks and customer relations 135 149 146
Acquired technologies in progress 661 660 661
Completed development projects 165 140 130
Development projects in progress 178 95 131
Rights 60 69 67
Goodwill 1,517 1,501 1,505
Intangible assets 2,716 2,614 2,640
Land and buildings 284 286 286
Plant and machinery 96 91 93
Other plant, fixtures and fittings, tools and equipment 55 49 47
Prepayments and plant under construction 57 25 29
Property, plant and equipment 492 451 455
Deferred tax asset 111 198 154
Other receivables 0 2 0
Other non-current assets 111 200 154
Total non-current assets 3,319 3,265 3,249
Inventories 418 387 382
Trade receivables 535 429 478
Other receivables 13 15 19
Income tax receivable 4 13 7
Prepayments 42 31 36
Cash 26 27 63
Total current assets 1,038 902 985
Total assets 4,357 4,167 4,234
Equity and liabilities Note 30.06.19 30.06.18 30.09.18
Share capital 126 125 126
Other reserves 2,100 1,738 1,756
Equity 2,226 1,863 1,882
Deferred tax 116 20 40
Provisions 35 35 36
Contingent consideration 14 109 487 498
Interest-bearing debt 12 1,125 1,431 1,304
Non-current liabilities 1,385 1,973 1,878
Provisions 4 4 4
Contingent consideration 14 254 0 0
Interest-bearing debt 12 13 6 4
Trade payables 154 143 194
Income tax 78 6 79
Other payables 230 163 186
Derivative financial instruments 13 9 7
Current liabilities 746 331 474
Total liabilities 2,131 2,304 2,352
Total equity and liabilities 4,357 4,167 4,234

Note
YTD
2018/19
YTD
2017/18
FY
2017/18
Operating profit (EBIT) 424 398 563
Adjustment of items with no cash flow effect 8 101 106 141
Changes in net working capital 9 -89 -85 -66
Interest expenses and similar items -15 -37 -44
Income tax paid -40 -44 -40
Cash flows from operating activities 381 338 554
Purchase of non-current assets -177 -177 -234
Divestment of subsidiary in respect of previous years 0 0 1
Cash flows from investing activities before acquisitions of enterprises and technology -177 -177 -233
Free cash flows before acquisitions of enterprises and technology 204 161 321
Acquisition of technology -2 -2 -2
Acquisitions of enterprises 0 -926 -926
Cash flows from acquisitions of enterprises and technology -2 -928 -928
Cash flows from investing activities -179 -1,105 -1,161
Free cash flows after acquisitions of enterprises and technology 202 -767 -607
Redemption of corporate bonds 0 -701 -701
Raising of long-term debt 50 1,960 1,960
Repayment of debt to credit institutions -225 -610 -760
Refund received in connection with the raising of lease debt 0 0 25
Repayment in respect of finance leases -6 -2 -3
Redemption of derivative financial instruments 0 -12 -12
Exercise of options 10 20 20
Purchase of treasury shares 0 -493 -493
Sale of treasury shares, employee share programme 7 6 6
Dividend paid -101 -92 -92
Dividend, treasury shares 3 2 2
Capital increase, Class B share capital 14 694 699
Cash flows from financing activities -248 772 651
Changes in cash and cash equivalents -46 5 44
Cash and cash equivalents, beginning of period 63 19 19
Translation adjustment of cash and cash equivalents 2 0 0
Cash and cash equivalents, end of period 19 24 63
Cash and cash equivalents, end of period, are composed as follows:
Cash 26 27 63
Bank debt -7 -3 0
19 24 63
Share capital
Share
premium
Reserve for
hedging
transactions
Reserve for
foreign
currency
translation
adjustment
Retained
earnings
Proposed
dividend Total
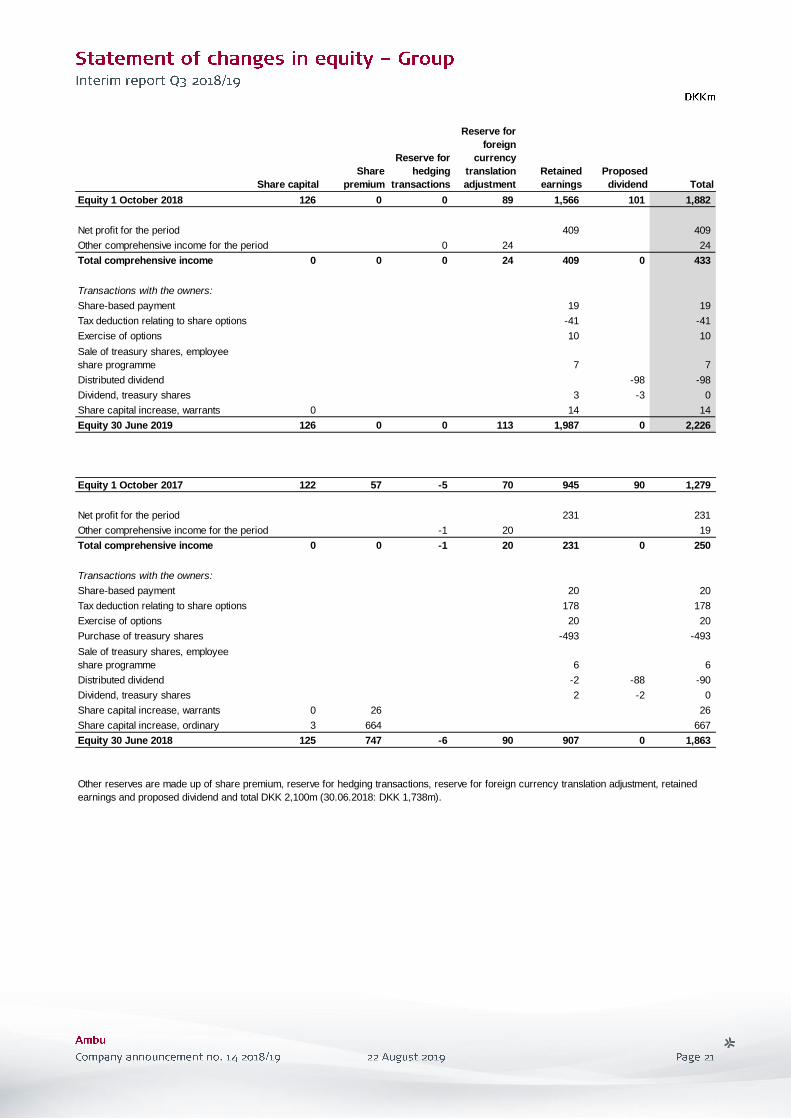
Equity 1 October 2018 126 0 0 89 1,566 101 1,882
Net profit for the period 409 409
Other comprehensive income for the period 0 24 24
Total comprehensive income 0 0 0 24 409 0 433
Transactions with the owners:
Share-based payment 19 19
Tax deduction relating to share options -41 -41
Exercise of options 10 10
7 7
Distributed dividend -98 -98
Dividend, treasury shares 3 -3 0
Share capital increase, warrants 0 14 14
Equity 30 June 2019 126 0 0 113 1,987 0 2,226
122 57 -5 70 945 90 1,279
Net profit for the period 231 231
Other comprehensive income for the period -1 20 19
Total comprehensive income 0 0 -1 20 231 0 250
Transactions with the owners:
Share-based payment 20 20
Tax deduction relating to share options 178 178
Exercise of options 20 20
Purchase of treasury shares -493 -493
6 6
Distributed dividend -2 -88 -90
Dividend, treasury shares 2 -2 0
Share capital increase, warrants 0 26 26
Share capital increase, ordinary 3 664 667
125 747 -6 90 907 0 1,863Equity 30 June 2018
Other reserves are made up of share premium, reserve for hedging transactions, reserve for foreign currency translation adjustment, retained
earnings and proposed dividend and total DKK 2,100m (30.06.2018: DKK 1,738m).
Equity 1 October 2017
Sale of treasury shares, employee
share programme
Sale of treasury shares, employee
share programme

Page 23 Note 1 – Basis of preparation of interim report Page 23 Note 2 – Changes in accounting estimates
Page 23 Note 3 – Seasonal fluctuations Page 23 Note 4 – Segment information Page 24 Note 5 – Revenue Page 24 Note 6 – Special items
Page 24 Note 7 – Development in balance sheet since 30 September 2018 Page 24 Note 8 – Adjustment of items with no cash flow effect Page 25 Note 9 – Changes in net working capital
Page 25 Note 10 – Risks Page 25 Note 11 – Net financials Page 26 Note 12 – Interest-bearing debt Page 26 Note 13 – Capital increases, treasury shares and dividend paid
Page 27 Note 14 – Contingent consideration Page 27 Note 15 – Contingent liabilities Page 27 Note 16 – Subsequent events

The interim report for the period 1 October 2018 to 30 June 2019 is presented in accordance with IAS 34 – Interim Financial Reporting as
adopted by the EU and additional Danish disclosure requirements for the interim reporting of listed companies. The accounting principles applied
are consistent with the principles applied in the annual report for 2017/18 with the exception of the implementation of IFRS 15 ‘Revenue from
Contracts with Customers’ described below. Basis of presentation for 'Special items' is defined as significant amounts concerning affairs which
cannot be attributed to normal operations. For definitions of ratios, reference is made to note 5.11 in the annual report for 2017/18.
Following the implementation of IFRS 15, Ambu’s long-standing accounting practice of offsetting fees paid to group purchasing organisations
(GPOs) against revenue will be changed. As from Q1 2018/19, the accounting policies have therefore been changed so that revenue is
presented without any deduction of these fees, while selling and distribution costs are increased accordingly, and operating profit (EBIT) is
therefore unaffected. The change is made as a consequence of the clarification of the principal/agent relationship. The standard has been
implemented using the catch-up method without restatement of comparative figures. The effect of the change in accounting policies amounts to a
total of DKK 31m in the first three quarters of 2018/19.
From Q1 2018/19, Ambu’s definition of geographical regions has been changed, so that the sale takes place in the country in which the control
over the goods is transferred to the customer and not as previously in the country to which the invoice is issued. Comparative figures for organic
growth in the geographic markets Europe and the Rest of the world have been restated in the overview table. The effect of this is minimal.
Contingent consideration
In connection with the preparation of the interim report, the management makes accounting estimates, assessments and assumptions which form
the basis of the presentation, recognition and measurement of the group’s assets and liabilities for accounting purposes. There are no changes
in the estimates or assessments reported in prior interim reports for 2018/19 or in the annual report for 2017/18 other than the change in
estimates regarding contingent consideration as described below.
As reported in note 3.9 and 4.2 to the annual report for 2017/18 the management apply unobservable data to measure fair value of the contingent
consideration from the acquisition of Invendo Medical GmbH. One of the key assumptions in this valuation is the revenue in the four-year period
of October 2017 until October 2021 from the technologies acquired from Invendo Medical GmbH in October 2017. The management no longer
estimate that the nominal earn-out payment of EUR 40m will materialise which causes the significant financial income reported in note 11. Please
refer to Management commentary and note 14 for further explanation.
Gross margin
Cash flows from operating activities
Historically, the gross margin is lower in H1 than in H2 due to higher activity levels in H2. The lowest gross margin is usually seen in Q1, where
revenue relative to other quarters is the lowest. The relatively lower gross margin reported in Q3 2018/19 is affected 3 ppts. by the discontinuation
of the SC210 which has led to one-off write-downs as described in Management commentary.
Cash flows from operating activities have historically been lower in Q1 as a result of bonuses paid, income tax as well as a lower earnings level
and increased net working capital. Cash flows from operating activities tend to increase gradually in Q2 and Q3, peaking in Q4. The increased
level of cash flows from operating activities in Q4 is due to the collection of revenue from Q3 as well as a reduction of net working capital.
Ambu has thus identified one segment.
Ambu is a supplier of medtech products for the global market. Except for the sales of the various products, no structural or organisational aspects
allow for a division of earnings from individual products, as sales channels, customer types and sales organisations are identical for all important
markets. Furthermore, production processes and internal controls and reporting are identical, which means that, with the exception of revenue,
everything else is unsegmented.

Q3
2018/19
Q3
2017/18
YTD
2018/19
YTD
2017/18
FY
2017/18
Revenue by activities:
Visualization 295 218 809 587 836
Anaesthesia 257 244 748 679 926
PMD 221 211 657 611 844
Total revenue 773 673 2,214 1,877 2,606
Revenue by markets:
North America 383 306 1,074 844 1,208
Europe 300 285 884 814 1,083
Rest of the world 90 82 256 219 315
Total revenue 773 673 2,214 1,877 2,606
Special items was a cost of DKK 38m related to the change of CEO including 18 months of salary to former CEO, a non-cash effect of cost-
accelaration of share-based payments and recruitment costs of a new CEO.
Inventories have been increased by DKK 36m as a consequence of planned higher activity levels and the establishment of safety stocks at the
factory in Malaysia. Trade receivables increased by DKK 57m, driven by the growth in the quarter and an increased USD/DKK exchange rate.
Contingent consideration relating to the acquisition of Invendo Medical GmbH amounted to DKK 363m, a decrease of DKK 135m. The decrease
is due to fair value adjustment of the contingent consideration of DKK 136m, as described in note 14.
Trade payables decreased by DKK 40m to DKK 154m, due to timing difference in the cash conversion cycle. Other payables increased by DKK
44m to DKK 230m due to accrual of special items in Q3 and the discontinuation of the SC210.
Since the beginning of the financial year, intangible and fixed assets have increased by a net amount of DKK 113m to DKK 3,208m. The
increase is driven by investments in ongoing development projects.
Deferred taxes was a net asset of DKK 114m at the beginning of the financial year. Since then, utilization of tax losses and the development of
taxes on share options have entailed that defered taxes as of 30.06.2019 is a net liability of DKK 5m.
YTD
2018/19
YTD
2017/18
FY
2017/18
Depreciation, amortisation and impairment losses 82 86 115
Share-based payment 19 20 26
101 106 141

YTD
2018/19
YTD
2017/18
FY
2017/18
Changes in inventories -29 -66 -62
Changes in receivables -53 12 -44
Changes in trade payables etc. -7 -31 40
-89 -85 -66
For a description of Ambu’s risks, see the ‘Risk management’ section in the annual report for 2017/18, pages 26-27.
Q3
2018/19
Q3
2017/18
YTD
2018/19
YTD
2017/18
FY
2017/18
Other financial income:
Foreign exchange gains, net -5 4 0 4 5
Value adjustment of contingent consideration 136 0 136 0 0
Fair value adjustment, swap 0 -1 0 8 7
Financial income 131 3 136 12 12
Q3
2018/19
Q3
2017/18
YTD
2018/19
YTD
2017/18
FY
2017/18
Interest expenses:
Interest expenses, banks 3 3 12 11 18
Interest expenses, leases 1 1 2 2 2
Interest expenses, bonds 0 0 0 11 11
Other financial expenses:
Foreign exchange loss, net 2 -18 2 0 0
Value adjustment of contingent consideration -43 20 0 57 71
Effect of shorter discount period, acquisition of technology 1 1 2 2 3
Ineffectiveness of interest rate swap 0 0 0 0 5
Fair value adjustment, swap 3 0 9 0 0
Financial expenses -33 7 27 83 110

30.06.19
YTD
2017/18
FY
2017/18
Credit institutions 1,025 1,350 1,200
Finance leases 100 81 104
Long-term interest-bearing debt 1,125 1,431 1,304
30.06.19
YTD
2017/18
FY
2017/18
Bank debt 7 3 0
Finance leases 6 3 4
Short-term interest-bearing debt 13 6 4
Capital increases
Changes in number of shares and share capital for the period:
30.09.18 Change 30.06.19
No. of Class A shares 34,320,000 0 34,320,000
No. of Class B shares 216,954,600 455,000 217,409,600
251,274,600 455,000 251,729,600
Share capital 125,637,300 227,500 125,864,800
Treasury shares
Dividend paid
A capital increase was implemented in November 2018 in connection with the exercise by employees of warrants allocated in 2015. In
consequence hereof, Ambu’s share capital was increased by a nominal amount of DKK 52,500 through the issue of 105,000 Class B shares with
a nominal value of DKK 0.50 each at a price of 39.26.
As at 30 September 2018, Ambu’s holding of treasury shares totalled 7,738,419 Class B shares with a nominal value of DKK 0.50 each. As at 30
June 2019, this had been reduced by 971,180 shares to 6,767,239 Class B shares. The reduction is attributable to disposals in connection with
the conclusion of the employee share programme for 2016 (matching shares) and the sale and transfer of own shares to Ambu’s employees
under the employee share programme for 2018 as well as sale of treasury shares relating to the management’s exercise of share option
programmes. There have been no transactions with Class A shares.
In May 2019, a capital increase was carried out for the third time in the financial year in connection with the exercise by employees of warrants
allocated in 2013, 2014 and 2015. In consequence hereof, Ambu’s share capital was increased by 50,000 Class B shares with a nominal value
of DKK 0.50 each at a price of 13.26, 50,000 Class B shares with a nominal value of DKK 0.50 each at a price of 23.06 and 120,000 Class B
shares with a nominal value of DKK 0.50 each at a price of 39.26.
The Board of Directors’ proposal for the distribution of dividend of DKK 0.40 per share with a nominal value of DKK 0.50 was adopted at the
company’s annual general meeting on 12 December 2018. The dividend declared totals DKK 101m and has subsequently been paid out.
In February 2019, another capital increase was carried out in connection with the exercise by employees of warrants allocated in 2013 and
2015. In consequence hereof, Ambu’s share capital was increased by 50,000 Class B shares with a nominal value of DKK 0.50 each at a price
of 13.26 and 80,000 Class B shares with a nominal value of DKK 0.50 each at a price of 39.26.

30.06.19
Contingent consideration 1 October 2018 498
Adjustments made through the income statement under financial expenses:
Value adjustment -136
Foreign currency translation adjustment 1
Contingent consideration 30 June 2019 363
Contingent consideration expected to fall due:
Non-current contingent consideration 109
Current contingent consideration 254
Contingent consideration 30 June 2019 363
Contingent consideration concerns outstanding liabilities relating to the acquisition of Invendo Medical GmbH. The contingent consideration is
valued on the basis of unobservable inputs, corresponding to level 3 in the fair value hierarchy.
The net value adjustment of DKK -136m posted to financials can be attributed to a drop in fair value upon remeasurement of the earn-out
agreement of DKK -187m, adjustment of timing in milestone payments of DKK -15m as well as the effect of the shorter discounting period of DKK
66m.
Ambu’s ongoing operations and the use of Ambu’s products in hospitals and clinics etc. involve the general risk of claims for damages and
sanctions against Ambu. The risk is deemed to be customary.
Ambu is involved from time to time in disputes with customers and patients about Ambu’s products. Appropriate provisions are made on an
ongoing basis, and product liability insurance has been taken out. The management believes that the likely outcomes of these disputes can be
covered by the provisions made and recognised in the balance sheet as at 30 June 2019. For a more detailed description of the group’s risks,
see the ‘Risk management’ section on pages 26-27 in the annual report 2017/18.
In addition to the matters described in this interim report, the management is not aware of any events subsequent to 30 June 2019 which could
be expected to have a significant impact on the group’s financial position except for the decision to fully transition the sales of aScopeTM products
from a major distributor in the US to Ambu. Please refer to Management commentary for further explanation.