in-plume emission test stand 2: emission factors for 10 ... · david sodeman, sebastian uppapalli,...
TRANSCRIPT
In-Plume Emission Test Stand 2: Emission Factors for 10- to100-kW U.S. Military Generators
Dongzi Zhu, Nicholas J. Nussbaum, Hampden D. Kuhns, M.-C. Oliver Chang,David Sodeman, Sebastian Uppapalli, Hans Moosmuller, Judith C. Chow, and John G. WatsonDivision of Atmospheric Sciences, Desert Research Institute, Reno, NV
ABSTRACTAlthough emissions of air pollutants from some militarytactical equipment are not subject to the emissions stan-dards, local communities near military bases must con-form to the National Ambient Air Quality Standards. Mil-itary diesel generators are widely used in training. Aportable in-plume system was used to measure fuel-basedemission factors (EFs) for particulate matter (PM), carbonmonoxide (CO), nitrogen oxides (NOx), and hydrocar-bons (HCs) for 30-, 60-, and 100-kW generators at fiveload levels and for cold starts. It was found that EFsdepend on multiple parameters including engine size,engine load, unit age, and total running hours. The aver-age CO EF of generators tested was 5% lower, and theaverage NOx EF was 63% lower than AP-42 estimates;average PM EF was 80% less than the AP-42 estimates. A2002 model-year 60-kW engine produced 25% less PMthan a 1995 engine of the same family with similar run-ning hours. CO EFs decrease with increasing engine load,NOx EFs increase up to mid-loads and decrease slightly athigh loads, PM EFs increase with loads for 30- and 60-kWengines. CO and PM have higher EFs and NOx has a lowerEF during cold starts than during hot-stabilized operation.PM chemical source profiles were also examined.
INTRODUCTIONEmissions of regulated air pollutants from military train-ing operations influence the ability of communities tomeet federal and state air quality regulations. Althoughtactical military vehicles may be granted a national secu-rity exemption from exhaust emission standards and die-sel fuel standards,1 communities located near military
bases must still conform with National Ambient Air Qual-ity Standards (NAAQS) and other regulations. Air qualityin the vicinity of military training facilities may be af-fected by exhaust from diesel generators and nonroadvehicles. Generators are widely used in military trainingto provide electricity to weapon systems, communica-tions, and aviation ground support.
Diesel engines emit nitrogen oxides (NOx), hydrocar-bons (HCs), carbon monoxide (CO), particulate matter(PM), and other pollutants.2 Diesel particulate matter(DPM) is a complex mixture of partially oxygenated fueland engine oil and falls almost entirely into the size rangeof PM less than 2.5 �m in aerodynamic diameter (PM2.5).DPM is primarily composed of elemental carbon (EC) andorganic carbon (OC), including polycyclic aromatic hy-drocarbons (PAHs)3 and is identified by the California AirResources Board (CARB) as a toxic air contaminant.4
Components of PM emissions, such as PAHs, have beenidentified as toxic and carcinogenic with potential ad-verse health effects.5,6 Available evidence indicates thatthere are human health hazards from exposure to dieselexhaust7; engine emissions have been associated withincreased cases of lung cancer and noncancer health ef-fects that impair respiratory function.8 Nationwide, emis-sions from nonroad diesel engines account for 44% oftotal DPM and 12% of total NOx emissions from mobilesources.9 Until the mid-1990s, emissions from nonroaddiesel sources were largely uncontrolled in the UnitedStates. Most nonroad diesel engines were exempt fromfuel formulation (e.g., sulfur content) requirements andexhaust gas aftertreatment. The U.S. Environmental Pro-tection Agency (EPA) has adopted more stringent emis-sion standards for NOx, HCs, and PM from new nonroaddiesel engines.10 More recently, regulations have beenissued to reduce stationary diesel emissions.11
Diesel backup generators (BUGs) are often locatedclose to hospitals, schools, and municipal buildings wherethe potential for human exposure is high. It has beenestimated that there were 626,000 installed units of dieselBUGs with a total generating capacity of 102,000 MW inthe United States in 1996 and the capacity is growing atan annual rate of 1.7%.12
A few characterizations of BUG emissions have beenreported.13–20 Liu et al.13 reported that the fraction of ECand OC of DPM emissions changed from 21 to 84% and62 to 9%, respectively, for a 75-kW BUG as load increasedfrom 0 to 75 kW. Oudejans et al.14 measured aromatic
IMPLICATIONSDiesel generators account for approximately 19% of allnonroad equipment fuel used by the U.S. Marine Corps.More stringent emission standards have been adopted forair pollutants such as NOx and PM from nonroad dieselengines. This study used a portable in-plume system tocharacterize gaseous and particulate fuel-based EFs frommilitary generators. Real-world EFs can be quantified byin-plume measurements and provide more realistic mea-sures for emissions inventories, source modeling, and re-ceptor modeling than certification measurements. Thesedata are essential to state and local air quality plannerscharged with maintaining regional air quality and protectinghuman health.
TECHNICAL PAPER ISSN:1047-3289 J. Air & Waste Manage. Assoc. 59:1446–1457DOI:10.3155/1047-3289.59.12.1446Copyright 2009 Air & Waste Management Association
1446 Journal of the Air & Waste Management Association Volume 59 December 2009

Report Documentation Page Form ApprovedOMB No. 0704-0188
Public reporting burden for the collection of information is estimated to average 1 hour per response, including the time for reviewing instructions, searching existing data sources, gathering andmaintaining the data needed, and completing and reviewing the collection of information. Send comments regarding this burden estimate or any other aspect of this collection of information,including suggestions for reducing this burden, to Washington Headquarters Services, Directorate for Information Operations and Reports, 1215 Jefferson Davis Highway, Suite 1204, ArlingtonVA 22202-4302. Respondents should be aware that notwithstanding any other provision of law, no person shall be subject to a penalty for failing to comply with a collection of information if itdoes not display a currently valid OMB control number.
1. REPORT DATE DEC 2009 2. REPORT TYPE
3. DATES COVERED 00-00-2009 to 00-00-2009
4. TITLE AND SUBTITLE In-Plume Emission Test Stand 2: Emission Factors for 10- to 100-kW U.S.Military Generators
5a. CONTRACT NUMBER
5b. GRANT NUMBER
5c. PROGRAM ELEMENT NUMBER
6. AUTHOR(S) 5d. PROJECT NUMBER
5e. TASK NUMBER
5f. WORK UNIT NUMBER
7. PERFORMING ORGANIZATION NAME(S) AND ADDRESS(ES) Division of Atmospheric Sciences,Desert Research Institute,Reno,NV
8. PERFORMING ORGANIZATIONREPORT NUMBER
9. SPONSORING/MONITORING AGENCY NAME(S) AND ADDRESS(ES) 10. SPONSOR/MONITOR’S ACRONYM(S)
11. SPONSOR/MONITOR’S REPORT NUMBER(S)
12. DISTRIBUTION/AVAILABILITY STATEMENT Approved for public release; distribution unlimited
13. SUPPLEMENTARY NOTES
14. ABSTRACT
15. SUBJECT TERMS
16. SECURITY CLASSIFICATION OF: 17. LIMITATION OF ABSTRACT Same as
Report (SAR)
18. NUMBEROF PAGES
13
19a. NAME OFRESPONSIBLE PERSON
a. REPORT unclassified
b. ABSTRACT unclassified
c. THIS PAGE unclassified
Standard Form 298 (Rev. 8-98) Prescribed by ANSI Std Z39-18

emissions from a BUG using resonance-enhanced mul-tiphoton ionization time-of-flight mass spectrometry(REMPI-TOFMS) and determined that HC and volatileorganic compound emissions rates were higher (e.g., up toa factor of 90 for benzene) during cold starts (i.e., duringthe first 40 sec after startup) than during hot-stabilizedoperation. Gullet et al.15 report that several organic airtoxic (e.g., benzene and naphthalene) emissions duringcold starts were 15 times those for a hot-stabilized 60-kWBUG.
Reported here are fuel-based particulate and gaseousemissions factors from 14 military diesel generators (Mo-bile Electrical Power) with rated capacities of 10, 30, 60,and 100 kW under different load conditions. Replicatemeasurements from different engines with the samemodel (rated capacity) of 10, 30 and 60 kW were made.On the basis of the fuel consumption reported by the U.S.Marine Corps (USMC), the 10-, 30-, and 60-kW generatorsaccount for 19.1% of total fuel consumption of USMCnonroad diesel engines.21 Fuel usage by 100-kW genera-tors was not reported.
EXPERIMENTAL METHODSTest engines (Table 1) were selected to represent a range ofoperating hours, manufacturers, and model years. Thetest cycle consisted of 5 min at 100, 75, 50, 25, and 10%engine loads simulated by an electrical resistance load.22
Cold-start emissions were measured separately during thefirst 5 min after ignition at 0% load after an overnightcold soak of at least 16 hr. Seventy-nine tests (13 coldstarts) of engines operating at a specific mode were per-formed between November 14 and 16, 2005. Fuel-basedemission factors (EFs; g pollutant emitted/kg fuel burned)were calculated from the ratio of the pollutant of interestto the sum of carbon dioxide (CO2) and CO concentration(above ambient background) in the plume and the carboncontent of the fuel.23 CO and CO2 typically account formore than 99% of the carbon emitted in engineexhaust.24
Gas and PM concentrations in the exhaust plumewere quantified using the Desert Research Institute (DRI)’s
In-Plume Emission Test Stand (IPETS). The instrumenta-tion and operating methods are described in detail byNussbaum et al.25 The IPETS uses a Fourier transforminfrared spectrometer (FTIR; Midac) to measure gas (CO,CO2, nitric oxide [NO], nitrogen dioxide [NO2], nitrousoxide [N2O], ammonia [NH3], sulfur dioxide [SO2], pro-pane, ethylene, and hexane) concentrations and an elec-trical low pressure impactor (ELPI; Dekati) to measurereal-time particle size distributions characterizing enginePM emissions after mixing with ambient air. Two Dust-Trak Model 8520 light scattering monitors26 (TSI) mea-sured PM2.5 and PM less than 10 �m in aerodynamicdiameter (PM10), and two GRIMM Model 1.108 opticalparticle counters27 characterized PM in the size range of0.3–20 �m by optical detection. A photoacoustic system28
was used to measure EC mass concentrations in theplume. With sample air drawn through a plenum using aBendix PM2.5 cyclone operating at a flow rate of 113L/min, PM2.5 samples were collected using two filter packsin parallel: (1) a 47-mm Teflon filter (gravimetric mass)followed by quartz fiber filter (volatilized PM OC), and (2)a quartz fiber filter (water-soluble ions, OC/EC) followedby a sodium-carbonate-coated cellulose fiber filter (forSO2) and a citric-acid-impregnated cellulose fiber filter(for NH3). Gaseous detection limits by the Midac Illumi-nator FTIR are reported in Table 2. The FTIR’s wavenum-
Table 1. Diesel BUGs tested.
Generator Test DateGenerator
ModelHoursUsed
Engine Year/Make
SerialNumber
Rated Power(kW)
1 November 14, 2005 MEP803A 2618 1999Onan FZ30644 102 November 14, 2005 MEP803A 3103 1995Onan RZC02845 103 November 14, 2005 MEP803A 2154 1994Onan RZC02061 104a November 15, 2005 MEP805A 1943 1995 JohnDeere RZH01043 305 November 15, 2005 MEP805A 3374 1995 JohnDeere RZH01023 306 November 15, 2005 MEP805A 1641 1995 JohnDeere RZH00999 307 November 15, 2005 MEP805B 636 2002 JohnDeere HX32455 308 November 15, 2005 MEP805B 85 2002 JohnDeere HX33185 309 November 15, 2005 MEP806B 1017 2002 JohnDeere HX62471 60
10 November 15, 2005 MEP806B 1084 2001 JohnDeere HX62182 6011 November 15, 2005 MEP806A 947 1995 JohnDeere RZJ02059 6012 November 15, 2005 MEP806B 366 2001 JohnDeere HX62178 6013 November 16, 2005 MEP007B 1874 NA RZ02630 10014b November 16, 2005 MEP805B 29 2002 JohnDeere HX33189 30
Notes: All are four-stroke diesel engines on the basis of military manuals. aTested for five engine loads with no cold start; bTested only for cold start.
Table 2. FTIR spectrometer detection limits of gaseous species.
Species Detection Limit (ppm)
CO2 12CO 0.2NH3 0.06NO 1H2O 60Butane 0.05Hexane 0.2Ethylene 0.1NO2 0.4SO2 0.5
Zhu et al.
Volume 59 December 2009 Journal of the Air & Waste Management Association 1447

ber scan resolution is 0.5 cm�1 with a sample flow of 50L/min through a 2-L optical cell with a 10-m folded lightpath. The data sampling rate was 1 per 1.5 sec. The sam-pling line and cell were not heated and the water was notremoved from the exhaust sample. For species of interest,particularly NO and NO2, the interference due to watervapor was greatly reduced by the least-squares algorithmwithin Midac’s Autoquant software.25
The sampling inlet is typically mounted approximately1 m from the generator’s exhaust pipe. The IPETS uses adirect ambient dilution method to measure pollutants fromreal-world dilution conditions. CO2 is used as a tracer for theexhaust plume. With a stoichiometric amount of air, theCO2 concentration in raw gasoline exhaust is approximately12.4%, or 124,000 parts per million (ppm).29 Diesel enginesalways operate with an excess of air, and the CO2 concen-trations in diesel exhaust range between approximately 2and 3% at low power and 10% at high power.30 Bergmannet al.31 also found a CO2 concentration range of approxi-mately 1–11% in undiluted exhaust from a diesel car. Theaverage CO2 concentration from testing cycles ranges from600 to 4500 ppm, which means the approximate ambientdilution ratio in this study ranged from 22 to 40. On thebasis of the flow rate of the system (�200 L/min), and anapproximately 4.7 m long (2.54 cm inner diameter [ID]) plus1 m long (1.27 cm ID) sampling line before the exhaust goesinto the ELPI, the residence time of exhaust in the samplingline is approximately 1.3 sec.
The background measurement for FTIR gas specieswas sampled 3 times in a day; that is, beginning, middle,and end of sampling day. Background CO2 and PM2.5
concentrations in ambient air were also quantified with aLI-COR LI-840 H2O/CO2 monitor and a PM2.5 filter sam-pler located approximately 20 m from the test engine tosubtract the effects of outdoor air mixed with the slightlydiluted plume. Ambient temperature and relative humid-ity (RH) were monitored and recorded every hour. Aver-age and standard deviations of ambient temperature andRH during the sampling period were 28.5 � 4.5 °C and25.8 � 10.1%, respectively. Figure 1 shows an examplefrom five load cycles.
A few fuel samples drawn from the supply jerry cansand the fuel tanks of the 60- and 100-kW generators withcompositions are shown in Table 3. Samples from thejerry cans were consistent with California no. 2 dieselspecification,32 having sulfur contents of 139 and 148 partsper million by weight (ppmw), respectively; whereas the 60-and 100-kW generator tank samples were consistent withthe JP-8 criteria,33 with sulfur contents of 311 and 349ppmw, respectively. At the time of sampling, the militarybase was temporarily unable to obtain JP-8 fuel for thegenerator sets and were using California no. 2 diesel to refuelthe generators when needed. On the basis of these facts,except for the 60-kW HX62178 and 100-kW RZ02630, theauthors were unable to confirm the exact type or relativeblend of fuels (JP-8 or California no. 2 diesel) used in thegenerators.
EF CalculationThe fuel-based EFi with units of g pollutant i emitted perkg fuel burned is23
EFi � CMFdiesel
�i
�CO2
CMFCO2 � CMFCO
�CO
�CO2
� �CMFHC
�HC
�CO2� ,
(1)
where �i, �CO2, �CO, and �HC are the excess (above ambi-ent) concentrations (�g/m3) of pollutant i, CO2, CO, andHC, respectively; and CMF is the carbon mass fraction ofeach pollutant with CMFCO � 42.9%, CMFCO2 � 27.3%,and CMFdiesel � 86.6% (assuming CH1.85 for diesel fuel).For most engines, the term in parentheses in eq 1 can beneglected because HC accounts for less than 0.5% of car-bon emissions. As shown in Figure 2, excess NO is highlycorrelated (R2 � 0.98) with the sum of the excess CO andCO2 in the exhaust plume. Mode-independent (weighted)EFs for a specific engine are calculated using weightingfactors of 0.10, 0.30, 0.30, 0.25, and 0.05 for the 10, 25,50, 75, and 100% loads, respectively.
Figure 1. Background-corrected (a) CO2, (b) CO, (c) ethylene, and(d) NO under five operating loads for a 30-kW generator on Novem-ber 15, 2005. The changes within each cycle are due to differentlevels of plume dilution, as indicated and compensated for by thefluctuating CO2 levels.
Zhu et al.
1448 Journal of the Air & Waste Management Association Volume 59 December 2009

Tabl
e3.
Prop
ertie
sof
mili
tary
dies
elfu
els
stan
dard
anal
ysis
(Inte
rtek
Cale
bBr
ett
Labo
rato
ries
inD
eer
Park
,TX
).32
Met
hod
Test
Units
Nove
mbe
r14
,20
05Sa
mpl
edfr
omRe
fuel
ing
Jerr
ycan
2005
-715
2-DR
PK-0
01
Nove
mbe
r15
,20
05Sa
mpl
edfr
omRe
fuel
ing
Jerr
ycan
2005
-715
2-DR
PK-0
02
Nove
mbe
r16
,20
05Sa
mpl
edfr
om60
-kW
,HX
6217
820
05-7
152-
DRPK
-003
Nove
mbe
r16
,20
05Sa
mpl
edfr
om10
0-kW
,RZ
0263
020
05-7
152-
DRPK
-004
JP-8
Spec
(MIL
-DT
L-83
1333
E)
Calif
orni
aDi
esel
Fuel
Regi
stra
tion
(CCR
Title
13,
Divi
sion
3,Ch
.5,
Art.
2)
ASTM
D250
0Cl
oud
poin
to C
�11
�12
�56
�56
Clou
dpo
int
o F12
.210
.4�
68.8
�68
.8AS
TMD2
622
Sulfu
rpp
m(w
t)14
813
931
134
9�
3000
<50
0AS
TMD2
709
Sedi
men
tan
dw
ater
vol%
00
00
ASTM
D405
2(IP
365)
APIg
ravi
ty15
.56
°C,
60°F
o API
35.0
35.3
41.0
41.2
37�
x�51
33<
x<
39AS
TMD8
6In
itial
boili
ngpo
int
o F37
2.5
366.
139
2.2
312.
534
0<x<
420
5%Re
cove
ryo F
415.
040
7.4
358.
435
3.7
10%
Reco
very
o F43
3.4
427.
636
2.0
355.
2�
401
400<
x<49
020
%Re
cove
ryo F
467.
345
5.7
376.
837
0.5
30%
Reco
very
o F49
5.5
484.
338
6.8
382.
340
%Re
cove
ryo F
523.
851
4.3
398.
639
3.6
50%
Reco
very
o F54
9.7
541.
441
0.4
405.
347
0<x<
560
60%
Reco
very
o F57
3.5
568.
442
1.9
417.
770
%Re
cove
ryo F
596.
959
2.9
436.
543
2.1
80%
Reco
very
o F61
7.8
614.
245
4.4
449.
190
%Re
cove
ryo F
638.
063
5.5
483.
147
5.1
550<
x<61
095
%Re
cove
ryo F
654.
465
5.5
513.
649
8.3
Fina
lboi
ling
poin
to F
658.
166
3.7
546.
453
0.4
�57
258
0<x<
660
%Re
cove
red
vol%
96.6
97.8
97.7
98.5
%Re
sidu
evo
l%1.
91.
12.
01.
4�
1.5
%Lo
ssvo
l%1.
51.
10.
30.
1�
1.5
ASTM
D93
(IP34
)M
etho
dA
Corr
ecte
dfla
shpo
int
o C96
.552
5171
�38
>55
Corr
ecte
dfla
shpo
int
o F20
5.5
125.
512
3.5
159.
5�
100
>13
0AS
TMD9
76(IP
364)
Calc
ulat
edce
tane
inde
x51
.150
.940
.639
.8>
48
Not
es:
Valu
esou
tsid
eof
the
mili
tary
JP-8
spec
ifica
tions
33ar
esh
own
inita
lics
and
valu
esou
tsid
eof
the
Calif
orni
ano
.2
dies
elsp
ecifi
catio
nar
esh
own
inbo
ld.
Zhu et al.
Volume 59 December 2009 Journal of the Air & Waste Management Association 1449

ELPI Particle Mass ConcentrationThe ELPI passes incoming particles by a corona chargerand measures the current dissipated from cascade impac-tor stages, onto which the particles are collected for thesize range from 7 nm to 10 �m with the filter stage. Thecharging efficiency of each particle depends on its mobil-ity diameter, dm, whereas the ELPI sizes particles on thebasis of their aerodynamic diameter, da. The effective par-ticle density, �e, establishes the relationship between dm
and da as34
�eCcdmdm2 � �0Ccdada
2, (2)
where Cc is the Cunningham correction coefficient.DPM size distributions are approximated by three
lognormal modes: nuclei (3–30 nm), accumulation (30–500 nm), and coarse (�500 nm). Approximately 80–90%of DPM mass is found in the range of the accumulationmode.35 ELPI as a measurement of number size distribu-tion is in good agreement with other instruments such asthe scanning mobility particle sizer (SMPS).36 The stan-dard data reduction software for ELPI converts the mea-sured current on each stage into a PM mass concentrationby assuming that the particles have unit density, arespheres, and dm � da. In fact, DPM particles are fractal-likeagglomerates of approximately spherical 10- to 30-nmprimary particles. Maricq et al.37 and Park et al.38 foundthat the DPM effective mass density decreases with parti-cle size.
The GRIMM optical counter measurements indicatedthat only a small concentration of particles larger than500 nm was in the military generator exhaust, whereasthe ELPI measured a large coarse mode (Figure 3). Maricqet al.39 have shown some charge-bearing nanoparticlediffusional deposition on the upper (i.e., large particle)stages of the impactor, thereby creating additional cur-rent on the upper stages of the impactor not associatedwith coarse particles. Virtanen et al.40 reported that thediffusion loss of fine particles onto upper stages of ELPI isless than 6%. The fine particle losses to the upper stagesare not critical for mass measurement because the realmass introduced by fine particles is insignificant. Maricqet al.39 reported that ELPI standard data reduction over-estimates the PM mass by as much as 115% compared
with gravimetric filter mass for diesel exhaust and deviseda least-squares fitting algorithm to account for changes indensity and the coarse artifact. This algorithm solves themean diameter, �g, and number concentrations, N0, fornuclei and accumulation modes that best describe theELPI currents. Following Maricq et al.,39 accumulationmode particles were assumed to have a geometric stan-dard deviation (GSD) �ac of 1.7 and a fractal dimension,df, of 2.3. The nuclei mode particles were assumed to bespherical, have a GSD �nuc of 1.2 with unit density, and adf of 3. The PM mass, M, is
M � Nnuc
�
6�nucunuc
3 e9ln�nuc2/2
� Nac
�
6�0d0
3 � df�acdf edf
2ln�ac2/2
(3)
where the �0 is the primary particle density of 2 g/cm3,41
and d0 is the primary particle diameter of 20 nm. PM massvalues from eq 3 were compared with those from thestandard ELPI reduction algorithm for stages 1–6 (D50 �322 nm) and the PM2.5 mass concentrations measured onTeflon filters are shown in Figure 4. Filter samples inte-grated results from a full test cycle or multiple engines inthe case of cold starts. On average, the ELPI-simulated PMmass was 19% higher than the filter measurements,whereas the ELPI standard PM mass was 99% higher onaverage than filter PM mass. Maricq et al.39 found similarcomparisons with PM mass collected on filters. The limi-tation of ELPI for PM mass measurement has been greatlyimproved via the correction algorithm. On the basis ofgravimetric filter measurements, PM concentrations inthe exhaust plumes were at least 2 orders of magnitudehigher than the ambient background, precluding theneed to subtract background PM concentrations duringthe engine tests. The IPETS fuel-based PM EFs were calcu-lated when valid measurements were available for CO,CO2, and ELPI. PM EFs were calculated using the averagebackground-subtracted gas concentrations measured bythe FTIR and bimodal fitting ELPI PM. The intercompari-son of the light scattering (DustTrak), impaction (ELPI),
Figure 2. Correlation of NO with CO CO2 concentration over a100% load cycle of 30-kW generator RZH01023 test on November15, 2005.
Figure 3. Composite size distribution of DPM measured by theELPI and the GRIMM optical particle counters. The dashed linerepresents a large particle artifact for the ELPI measurement.
Zhu et al.
1450 Journal of the Air & Waste Management Association Volume 59 December 2009

and gravimetric (filter) method was detailed in the firstpaper of the IPETS system by Nussbaum et al.25 Of thereal-time instruments, because of the fractal-like agglom-erate character of diesel soot and most particles less than500 nm, the 780-nm wavelength of DustTrak and theGrimm minimum sampling size of 300 nm limit theircapability to better characterize DPM. The ELPI-simulatedPM mass concentration has the best agreement withgravimetric filter PM mass concentration. Except for thePM source profile analysis, the PM reported in this paperresults from the corrected ELPI PM.
RESULTS AND DISCUSSIONReplicate Measurements
To evaluate the uncertainty of IPETS measurements, rep-licate tests for a 2000 model-year 250-kW Komatsu dieselgenerator running with JP-8 were conducted. The coeffi-cient of variation (COV) obtained for these tests are sum-marized in Table 4.
Gaseous EFsAverage EFs for each engine type are summarized in Fig-ures 5 and 6. CO, ethylene, and NO2 EFs decreased withincreasing engine load. Cold-start EFs (measured duringthe first 5 min of operation after an overnight cold soak)were higher than the hot-stabilized (i.e., running for at
least 20 min before measurement), steady-state, loadedmodes. Ethylene EFs are consistent with the emission ofunburned fuel during the initial fuel-rich combustion.42
As the engine cylinders heat up at higher load, the com-bustion efficiency improves, and less CO is produced.
NO (the primary constituent of NOx in exhaust) EFsare shown in Figure 5c. At 10% load, the air-to-fuel ratiois highest, leading to low combustion temperatures andlower NO emissions. During cold start (no load condi-tions), NO EFs were less than corresponding hot-stabilizedNO EFs at each generator power rating. With the excep-tion of 30-kW generators, all NO EFs were highest at 50%load and then decreased above 75% load. When the en-gine load approached 100%, the NO EFs increased slightlycompared with the 75% load for all but the 60-kW gen-erators. NO EF changes with engine load are consistentwith higher fuel-to-air ratio at 100% load.43 These
Figure 4. Comparison of PM from different generator tests by thestandard ELPI data reduction, the ELPI bimodal fitting procedure,and gravimetric mass on Teflon filters.
Table 4. IPETS replicate measurements on a 250-kW Komatsu dieselgenerator running with JP-8.
NOx EF (g/kg fuel) Filter PM2.5 EF (g/kg fuel)
29.34 0.3928.55 0.40.56 0.01
28.95 0.41.90% 2.20%
Notes: The COV between replica tests is much less than the interengine EFsvariation observed with the military generators in this study.
Figure 5. Average (a) CO, (b) ethylene, and (c) NO EFs for allengines tested.
Zhu et al.
Volume 59 December 2009 Journal of the Air & Waste Management Association 1451
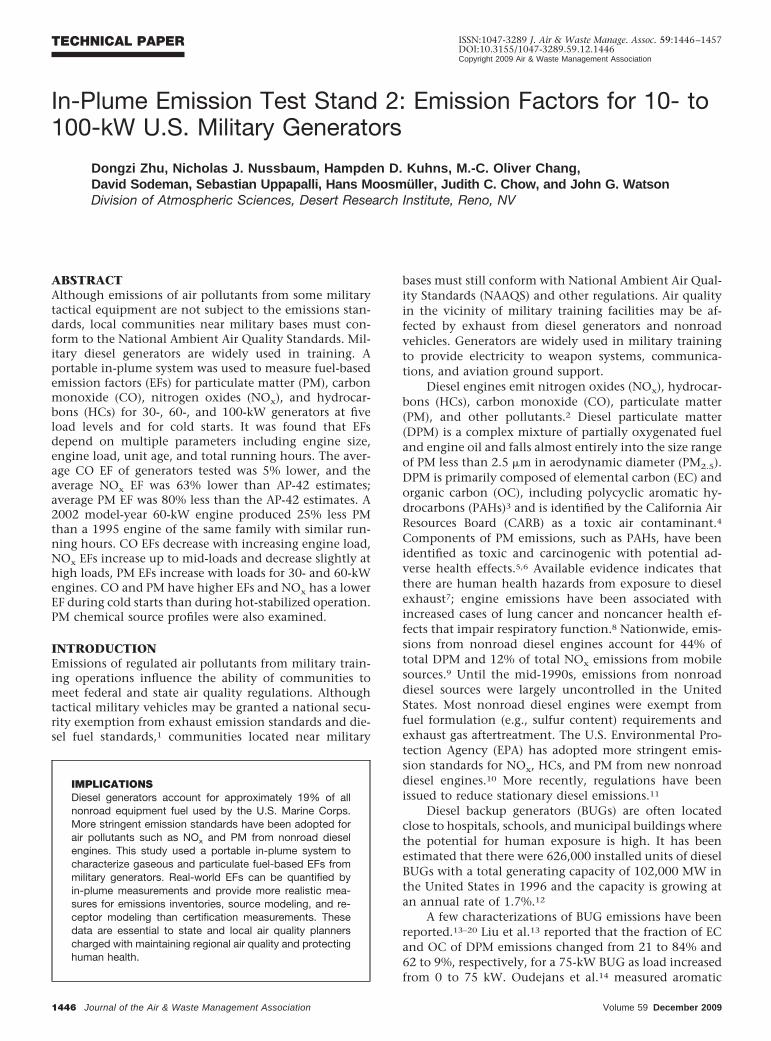
changes of NO EFs with load were also observed by Cockeret al.16 on a 350-kW BUG.
HC EFs (sum of ethylene, propane, and hexane) wereless than 20 g HC/kg fuel. HC emissions increased withengine load for 10- and 60-kW engines, but they de-creased with load for 30- and 100-kW engines. Except forthe 60-kW generators, the average cold-start HC EFs wereapproximately 7 times higher than the weighted HC EFsat hot-stabilized modes. This is consistent with the pres-ence of unburned fuel during the initial fuel-rich combus-tion. NH3 EFs were less than 0.2 g NH3/kg fuel and wereoften below the detection limits.
Comparison with Previous Generator EmissionStudies
Cocker et al.16 measured emissions from of a 350-kW BUGequipped with a CAT 3406C engine (model year 2000)using a mobile emission laboratory (MEL). Shah et al.18
compared emissions from 18 BUGs ranging in rated ca-pacity from 60 to 2000 kW and reported the regulatedpollutant EFs calculated on the basis of power output ofthe engine in units of g/kWh. Following the conventionof EPA regulations and the MEL reporting, NOx EFs arereported as 1.53 � NO EF 1 � NO2 EF such that NOx EFshave units equivalent to g NO2/kg fuel.
EPA’s AP-4244 EFs for small diesel-fueled internalcombustion engines (�440 kW) are based on energyoutput (i.e., units of g pollutants/kWh) and have beenconverted into fuel-based EFs (by converting kWh into
kg fuel) for comparison with the results presented here.An average brake-specific fuel consumption (BSFC) of9899 kJ/kWh (corresponding to an efficiency of 36.4%)and a diesel heating value of 44,889 kJ/kg44 yields aconversion factor of 4.53 kWh/kg fuel, which is multi-plied by EPA’s energy-based EFs to obtain fuel-based EFsin units of g pollutants/kg fuel. The conversion yieldsEPA AP-42 EFs for diesel engines less than 440 kW of85 g NOx/kg fuel, 18 g CO/kg fuel, 5.6 g SOx/kg fuel, 6 gPM/kg fuel, 1.4 g aldehydes/kg fuel, and 6.8 g total OC(TOC)/kg fuel.
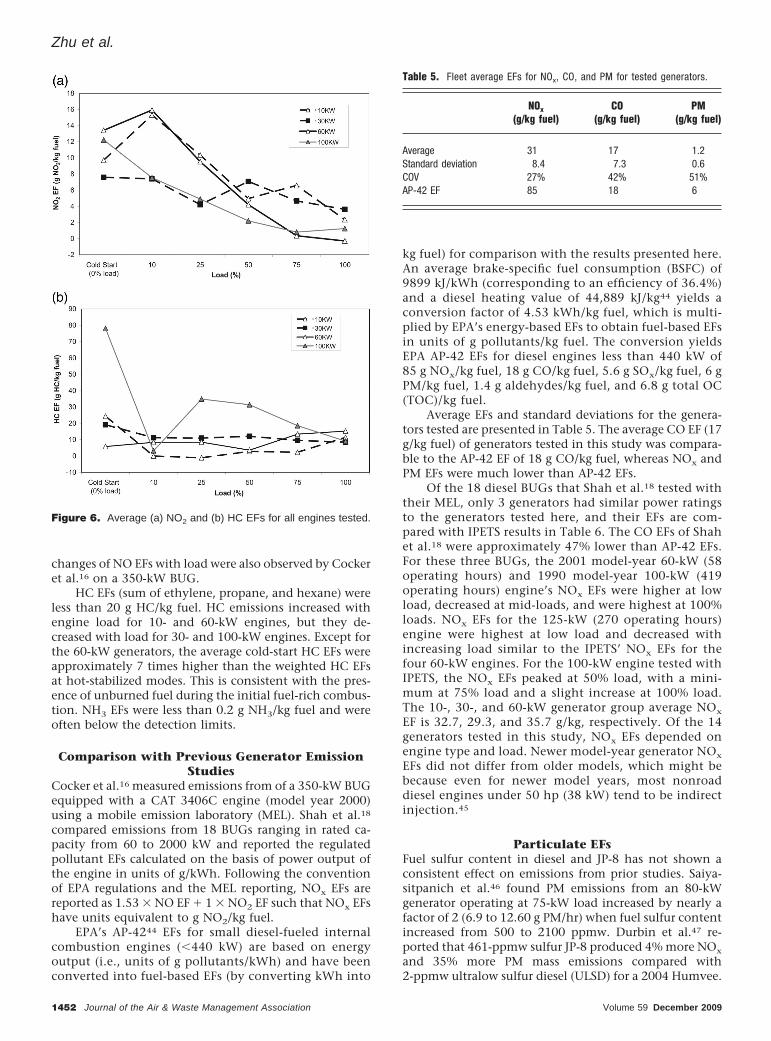
Average EFs and standard deviations for the genera-tors tested are presented in Table 5. The average CO EF (17g/kg fuel) of generators tested in this study was compara-ble to the AP-42 EF of 18 g CO/kg fuel, whereas NOx andPM EFs were much lower than AP-42 EFs.
Of the 18 diesel BUGs that Shah et al.18 tested withtheir MEL, only 3 generators had similar power ratingsto the generators tested here, and their EFs are com-pared with IPETS results in Table 6. The CO EFs of Shahet al.18 were approximately 47% lower than AP-42 EFs.For these three BUGs, the 2001 model-year 60-kW (58operating hours) and 1990 model-year 100-kW (419operating hours) engine’s NOx EFs were higher at lowload, decreased at mid-loads, and were highest at 100%loads. NOx EFs for the 125-kW (270 operating hours)engine were highest at low load and decreased withincreasing load similar to the IPETS’ NOx EFs for thefour 60-kW engines. For the 100-kW engine tested withIPETS, the NOx EFs peaked at 50% load, with a mini-mum at 75% load and a slight increase at 100% load.The 10-, 30-, and 60-kW generator group average NOx
EF is 32.7, 29.3, and 35.7 g/kg, respectively. Of the 14generators tested in this study, NOx EFs depended onengine type and load. Newer model-year generator NOx
EFs did not differ from older models, which might bebecause even for newer model years, most nonroaddiesel engines under 50 hp (38 kW) tend to be indirectinjection.45
Particulate EFsFuel sulfur content in diesel and JP-8 has not shown aconsistent effect on emissions from prior studies. Saiya-sitpanich et al.46 found PM emissions from an 80-kWgenerator operating at 75-kW load increased by nearly afactor of 2 (6.9 to 12.60 g PM/hr) when fuel sulfur contentincreased from 500 to 2100 ppmw. Durbin et al.47 re-ported that 461-ppmw sulfur JP-8 produced 4% more NOx
and 35% more PM mass emissions compared with2-ppmw ultralow sulfur diesel (ULSD) for a 2004 Humvee.
Figure 6. Average (a) NO2 and (b) HC EFs for all engines tested.
Table 5. Fleet average EFs for NOx, CO, and PM for tested generators.
NOx
(g/kg fuel)CO
(g/kg fuel)PM
(g/kg fuel)
Average 31 17 1.2Standard deviation 8.4 7.3 0.6COV 27% 42% 51%AP-42 EF 85 18 6
Zhu et al.
1452 Journal of the Air & Waste Management Association Volume 59 December 2009

For a 60-kW generator in the same study, PM emissionsusing JP-8 were 50% less than those for ULSD. For a250-kW generator, PM emissions using JP-8 were 14%higher than those for ULSD and NOx emissions changedless than 15% between these two fuels for the two gener-ators. The IPETS was collocated with the MEL used byDurbin et al.47 for the 250-kW generator tests, describedby Nussbaum et al.25; the IPETS PM2.5 EFs were approxi-mately 3% lower for JP-8 compared with ULSD, and theIPETS NOx EFs were approximately 13% higher for JP-8compared with ULSD, well within the range of in-terengine PM and NOx EFs observed with the militarygenerators reported in this study. In contrast, Yost et al.48
found that PM emissions decreased by 22% with 600-ppmw sulfur JP-8 versus 350-ppmw sulfur EPA certifica-tion fuel. CO, NOx, and HC emissions were the same forboth fuels in that study. Frame and Blanks49 found that a6.5-L HMMWV engine using 87.3-ppmw sulfur JP-8 pro-duced 11% less NOx and 28% less PM emissions than with37-ppmw low-sulfur certification diesel; the difference inBSFC between JP-8 and certification diesel in this 6.5-Lengine was 8%. Kouremenos et al.50 found that NOx, CO,HC, and PM emission rates were the same within experi-mental error for the 3000-ppmw sulfur no.2 diesel and1500-ppmw sulfur JP-8 in a four-stroke diesel engine. Thelack of consistency from these studies suggests that theinfluence of fuel type (i.e., JP-8 vs. no. 2 diesel) on EFs islikely to be less than 30% when fuel sulfur contents arebelow 500 ppmw.
Figures 7 and 8 summarize PM EFs using an ELPI PMcorrection algorithm. The 60-kW generator group averagePM EF (1.8 � 0.4 g PM/kg fuel) is more than twice as largeas the 30-kW generator group average (0.77 � 0.19 g
PM/kg fuel). The fleet average (30 and 60 kW) PM EF was1.2 � 0.6 g PM/kg fuel, one-fifth of the correspondingAP-42 value of 6 g PM/kg fuel. PM EFs measured by MELwere also 83% lower than the AP-42 values for smallengines (�441 kW). Some of these discrepancies may bedue to Method 5 used to measure the AP-42 PM. For EFsthat included filterable and condensable PM, the Method5 results in a mass loading that is up to three times higherthan the filter-based method.18,51
All engines showed an increase in PM EFs as the loadincreased to 75 or 100% of the maximum rating (Figure8). Only one valid PM EF is reported for the 100-kWengine at 100% load because the current measured on oneor more of the ELPI impactor stages exceeded the analyt-ical limit on the remainder to the operating mode tests.
For the 30- and 60-kW generators, cold-start PM EFswere 46 and 89% higher than the PM EFs at 10% loadconditions, consistent with fuel-rich combustion condi-tions during a cold start. The average IPETS PM EF of four60-kW BUGs (1.8 g/kg fuel) was 38% higher than MEL PMEFs of the 60-kW BUG (1.3 g/kg fuel) measured by filtersampling of the diluted exhaust. In addition to the vari-ation of emissions between engine models, some of thisdifference may be associated with the MEL DPM samplingtemperature. Cocker et al.16 reported a test with the MELfilter face temperature set at 27 °C versus the standardheated temperature of 47 °C. The high-temperature testsrecovered approximately 11% less PM mass than the testat 27 °C. The IPETS system operates near ambient temper-atures and may permit more semi-volatile components tocondense onto PM and onto filters before and duringcollection.52
Table 6. IPETS EFs from this study compared with previously reported results from a MEL.18
Instrument/Engine Type and Model Year Pollutant
Percent Load
AP-42b10 25 50 75 100 Weighteda
IPETS EF 60-kW Average (1995, 2001, 2001, 2002) THC 5.6 6.8 2.5 13 15 7.3 6.8CO 32 23 15 10 9 18 18NOx 43 38 37 29 26 36 85PM 1.1 1.2 1.9 2.6 2.1 1.8 60
IPETS 100 kW (LIBBY MEP007B, year unknown) THC 12 �0.3c 5.2 30 22 11 –CO 47 24 13 8.1 6.9 18 –NOx 19 23 25 18 19 22 –PM 0.5 –
MEL EF 60-kW John Deere (2001) THC 33 12 5.2 3.2 2.1 9.3 –CO 36 13 4.6 2.4 6.3 9.7 –NOx 50 32 35 44 55 39 –PM 2 1.6 1.0 1.0 1.8 1.3 –
MEL 100-kW Cummins 6BT, 1990 THC 31 16 6.6 4.1 1.9 11 –CO 32 14 3.5 5.0 26 11 –NOx 54 49 48 68 79 55 –PM 3.0 2.3 0.8 0.6 1.5 1.5 –
MEL 125-kW John Deere 6076, 1991 THC 26 9.3 5.0 3.5 3.0 7.9 –CO 30 8.6 4.2 3.8 6.0 8.1 –NOx 150 89 77 74 74 87 –PM 4.0 1.5 0.8 0.7 0.8 1.3 –
Notes: Values presented in g pollutant/kg fuel. aWeighting factors of 0.1, 0.3, 0.3, 0.25, and 0.05 for the 10, 25, 50, 75, and 100% loads respectively; bAP-42EFs for uncontrolled diesel industrial engines; cThe THC EF is below the detection limit of the FTIR instrument.
Zhu et al.
Volume 59 December 2009 Journal of the Air & Waste Management Association 1453

For 60-kW engines, the 2002 John Deere generatordid show a 25% PM EF reduction compared with the 1995John Deere, which may reflect the engine changes to meetmore stringent 2004 emission standards. For 30-kW en-gines, such PM reduction was not observed between 1995and 2002 models, possibly because of the preferred indi-rect injection used in the small-capacity engine group.45
DPM Source Profiles and EC/OC
Filter samples were analyzed by gravimetry, ion chroma-tography, X-ray fluorescence, colorimetry, and thermal/
optical reflectance (TOR).53,54 Source profiles of the rela-tive abundance of chemical species collected on the filterwere calculated from the sum of particles species mea-sured above the ambient background. Most exhaust PM2.5
mass is composed of total carbon (TC), which equals thesum of OC and EC, with EC accounting for 9–47% of thePM2.5 mass. TC accounts for between 94 and 98% of PM2.5
mass under various start conditions. On average, OC ac-counts for 65 and 82% and EC accounts for 31 and 16%for hot-stabilized and cold-start conditions, respectively.
PM2.5 mass fraction values were reported for water-soluble ions and gaseous SO2 and NH3. PM2.5 sulfate(SO4
2�) values were low and variable, averaging 1.3 �1.1% of PM2.5 mass for hot-stabilized operation and 0.5 �0.5% of PM2.5 mass for cold starts. Higher SO2 (41 � 37%of PM2.5 mass) was reported for cold starts than hot-stabilized operation (24 � 19%). PM2.5 SO4
2� and SO2
levels were also lower than the 2.4 � 1% and 67 � 24% ofPM2.5 mass reported by Watson et al.55 This reflects thereduction of sulfur content in diesel fuel over the past 2decades. PM2.5 ammonium was low, averaging 0.6 � 0.4%of PM2.5 mass for hot-stabilized operation and 0.3 � 0.3%for cold starts. Low levels of NH3 were detected, with0.05 � 0.05% of PM2.5 mass for hot-stabilized operationand 0.3 � 0.6% for cold starts. Other water-soluble ionssuch as chloride, nitrate, sodium, and potassium were low(typically �0.05% of PM2.5 mass).
On average, the OC/EC mass ratio for hot-stabilizedengine operation (3.98) was approximately 40% less
Figure 7. PM fuel-based EFs for (a) 30- and (b) 60-kW generators tested between November 14 and 16, 2005. Because of insufficient dilution,if the 25% of current data recorded by ELPI exceeded the 400,000-fA instrument limit, the PM data were invalid for that cycle.
Figure 8. Average PM EFs as function of load for three generatorload ratings. For the 100-kW generator, only the 100% load has validELPI data with �25% of current data exceeding the instrument limit.
Zhu et al.
1454 Journal of the Air & Waste Management Association Volume 59 December 2009

than that for cold starts (5.60). Approximately 69% ofEC mass reported in this study was present in the high-temperature EC2 fraction (740 °C at 98% He/2% oxygen[O2] atmosphere), with 0.3–15% of EC mass in the EC3fraction (840 °C at 98% He/2% O2 atmosphere). On aver-age, PM2.5 OC accounted for 48–89% of PM2.5 mass, with31–40% of OC mass found in the low-temperature OC1(140 °C at 100% He atmosphere) and 45% of OC massfound in the OC2 fraction (280 °C at 100% He atmo-sphere) during hot-stabilized engine operation—twicethose found during cold starts (23%). During TOR analy-sis, the thermal OC fraction abundances decreased withincreasing temperature (i.e., OC fraction 1 concentrationthrough OC fraction 4 concentration), indicating that theOC is quite volatile.
To estimate the EC/OC ratio change at different loadconditions, it was assumed that PM mass measured byELPI provides a real-time TC concentration. Real-time ECmass was approximated by the photoacoustic instrumentusing a mass absorption efficiency of 5 m2/g.56 The cycle-averaged OC concentration (�g/m3) was calculated bysubtracting the EC from the PM mean values of each5-min load test, similar to the procedure used by Moos-muller et al.57 The ratio of EC mass concentration mea-sured by the photoacoustic instrument to the total aerosolmass concentration can change as a function of engine,operating load, and air fuel mixture.58 The EC EF in-creased with engine load for all generator models. As seenin Figure 9, the EC/OC ratios of 30-kW units increasedwith load, indicating more OC results from the incom-plete combustion at lower loads. The generator RZH01043had the largest EC/OC ratio by a factor of 2, which may bedue to different engine maintenance. The EC/OC ratiocan vary between 0.16 to 4.3 according to engine type,wear, and operating conditions.59 Cold-start EC/OC ratioswere less than hot-stabilized operations, consistent withthat of fuel-rich, incomplete combustion at cold start.
CONCLUSIONSFourteen diesel generators ranging from 10 to 100 kWfrom a U.S. military base were tested with the IPETS tomeasure fuel-based gaseous and PM EFs. Gaseous EFs wereconsistent across engine types. EFs of CO, ethylene, and
NO2 decreased with increasing engine load, and cold-startemissions of these species were higher than hot-stabilizedoperation emissions. Emissions of NO increased with en-gine load up to mid-loads and a slight decrease with loadat high loads. Cold-start NO EFs were 14–56% lower thanhot-stabilized EFs. HC EFs (sum of ethylene, propane, andhexane) were generally small (�20 g HC/kg fuel) anddecreased at higher load for 30- and 100-kW engines,whereas NH3 emissions were below the detection limit.The average CO EF of the 14 generators tested was 5%lower than EPA AP-42, and the average NOx EF was 63%lower than the AP-42 value. Bimodal fitting procedureswere used to convert ELPI currents into PM mass andshowed agreement within 20% of gravimetric mass mea-surements. The tested generators’ average PM EF was 1.2g/kg fuel, 80% less than the AP-42 estimates. The 30- and60-kW generator engines showed an increase in PM EF asload increased from 10 to 75%. PM EF increased 46–89%for the cold-start tests as compared with the 10% load ofthe hot-stabilized operation on 30- and 60-kW engines.The 10-, 30-, and 60-kW group average NOx EFs differwithin approximately 20%, and the 60-kW group averagePM EF is more than twice than EF of 30-kW group. EFsmeasured during this study were comparable with thoseobtained by the MEL of the College of Engineering Centerfor Environmental Research and Technology of the Uni-versity of California–Riverside for similar engine sizes.
Filter sample analyses indicate the TC/PM mass ratioranged from 94 to 98%, OC/PM mass ratios ranged from48 to 89%, and the EC/PM mass ratios ranged from 9 to47% under various operating conditions for all testeddiesel generators. The EC/OC ratio generally increasedwith engine load.
For the same-size engines, measured EF COVs were27% for NOx, 42% for CO, and 51% for PM. For the 60-kWgenerator, the 2002 model-year engine produced 25% lessPM emissions than a 1995 model, which may reflect en-gine changes to meet 2004 Tier 2 nonroad regulations.The change of PM and NOx EFs between different dieselgenerators indicates that diesel generators EFs are depen-dent on engine size, engine load, unit age, and runninghours. As such, averages of multiple generator EFs areneeded to accurately represent emissions from a largerfleet for the purposes of emission inventories. Real-worldEFs can be quantified by in-plume measurements andprovide more realistic measures for emissions inventories,source modeling, and receptor modeling than certifica-tion measurements.
ACKNOWLEDGMENTSThis work was partially sponsored by the Federal TransitAdministration (contract 26-70030), and the Strategic En-vironmental Research and Development Program (con-tract CP-1336). The USMC provided extraordinary coop-eration and assistance in providing access to the enginesand assisting with the tests.
REFERENCES1. Control of Emissions from New and In-Use Nonroad Compression Ignition
Engines. CFR, Part 89, Title 40, Subpart J, 2004.2. Lloyd, A.C.; Cackette, T.A. Critical Review—Diesel Engines: Environ-
mental Impact and Control; J. Air & Waste Manage. Assoc. 2001, 51,809-847.
Figure 9. EC/OC ratios for PM emissions from five 30-kW dieselgenerators.
Zhu et al.
Volume 59 December 2009 Journal of the Air & Waste Management Association 1455

3. Schauer, J.; Kleeman, M.; Cass, G.; Simoneit, B. Measurement of Emis-sions from Air Pollution Sources. 2. C1 through C30 Organic Com-pounds from Medium Duty Diesel Trucks; Environ. Sci. Technol. 1999,33, 1578-1587.
4. Identification of Particulate Emissions from Diesel-Fueled Engines as aToxic Air Contaminant; California Air Resources Board: Sacramento,CA, 1998.
5. Straif, K.; Baan, R.; Grosse, Y.; Secretan, B.; Ghissassi, F.E.; Cogliano, V.Carcinogenicity of Polycyclic Aromatic Hydrocarbons; Lancet Oncol.2005, 6, 931-932.
6. Pope, C.A., III; Dockery, D.W. Critical Review: Health Effects of FineParticulate Air Pollution: Lines that Connect; J. Air & Waste Manage.Assoc. 2006, 56, 709-742.
7. Health Assessment Document for Diesel Exhaust; EPA/600/8-90/057F;U.S. Environmental Protection Agency; National Center for Environ-mental Assessment; Office of Transportation and Air Quality: Wash-ington, DC, 2002.
8. Control of Emissions of Hazardous Air Pollutants from Mobile Sources (40CFR Parts 80 and 86). Fed. Regist. 2001, 66(61), 17229-17273.
9. Reducing Air Pollution from Nonroad Engines; EPA420-F-03-011; U.S.Environmental Protection Agency; Office of Transportation and AirQuality and Air Radiation: Washington, DC, 2003; available at http://www.epa.gov/otaq/cleaner-nonroad/f03011.pdf (accessed July 2009).
10. Environmental Protection of the Environment. CFR Part 1068, Title40, Subpart C. §1068.225, 2004.
11. Standards of Performance for Stationary Compression Ignition InternalCombustion Engines; U.S. Environmental Protection Agency: Washing-ton, DC, 2006; available at http://www.epa.gov/ttn/oarpg/t3/fr_notices/ci_nsps_fnl.pdf (accessed July 2009).
12. Singh, V. Blending Wind and Solar into the Diesel Generator Market;Research Report No. 12; Renewable Energy Policy Project: Washing-ton, DC, 2001; available at http://www.repp.org/repp_pubs/pdf/diesel.pdf(accessed July 2009).
13. Liu, Z.F.; Lu, M.M.; Birch, M.E.; Keener, T.C.; Khang, S.J.; Liang, F.Y.Variations of the Particulate Carbon Distribution from a NonroadDiesel Generator; Environ. Sci. Technol. 2005, 39, 7840-7844.
14. Oudejans, L.; Touatl, A.; Gullett, B.K. Real-Time, On-Line Character-ization of Diesel Generator Air Toxic Emissions by Resonance-Enhanced Multiphoton Ionization Time-of-Flight Mass Spectrometry;Anal. Chem. 2004, 76, 2517-2524.
15. Gullett, B.K.; Touati, A.; Oudejans, L.; Ryan, S.P. Real-Time EmissionCharacterization of Organic Air Toxic Pollutants during Steady Stateand Transient Operation of a Medium Duty Diesel Engine; Atmos.Environ. 2006, 40, 4037-4047.
16. Cocker, D.R.; Shah, S.D.; Johnson, K.; Zhu, X.; Miller, J.W.; Norbeck,J.M. Development and Application of a Mobile Laboratory for Mea-suring Emissions from Diesel Engines 2. Sampling for Toxics andParticulate Matter; Environ. Sci. Technol. 2004, 38, 6809-6816.
17. Shah, S.D.; Cocker, D.R.; Miller, J.W.; Norbeck, J.M. Emission Rates ofParticulate Matter and Elemental and Organic Carbon from In-UseDiesel Engines; Environ. Sci. Technol. 2004, 38, 2544-2550.
18. Shah, S.D.; Cocker, D.R.; Johnson, K.C.; Lee, J.M.; Soriano, B.L.; Miller,J.W. Emissions of Regulated Pollutants from In-Use Diesel Back-UpGenerators; Atmos. Environ. 2006, 40, 4199-4209.
19. Shah, S.D.; Cocker, D.R.; Johnson, K.C.; Lee, J.M.; Soriano, B.L.; Miller,J.W. Reduction of Particulate Matter Emissions from Diesel BackupGenerators Equipped with Four Different Exhaust Aftertreatment De-vices; Environ. Sci. Technol. 2007, 41, 5070-5076.
20. Sawant, A.A.; Shah, S.D.; Zhu, X.; Miller, J.W.; Cocker, D.R. Real-World Emissions of Carbonyl Compounds from In-Use Heavy-DutyDiesel Trucks and Diesel Back-Up Generators (BUGs); Atmos. Environ.2007, 41, 4535-4547.
21. Kemme, M.R.; Brown, W.T.; Frame, E.A.; Alvarez, R.A. Diesel-PoweredEquipment Properties and Activity Database for DoD Off-Road Sourc-es; Strategic Environmental Research and Development Program(SERDP) Project WP-1338; Prepared for SERDP by Construction Engi-neering Research Laboratory: Champaign, IL, 2006.
22. 40 CFR Parts 9, 69, 80, 86, 89, 94, 1039, 1048, 1051, 1065, and 1068.Control of Emissions of Air Pollution from Nonroad Diesel Engines andFuel; U.S. Environmental Protection Agency, 2004; available at http://www.epa.gov/otaq/url-fr/fr29jn04.pdf (accessed July 2009).
23. Moosmuller, H.; Mazzoleni, C.; Barber, P.W.; Kuhns, H.D.; Keislar,R.E.; Watson, J.G. On-Road Measurement of Automotive ParticleEmissions by Ultraviolet Lidar and Transmissometer Instrument; En-viron. Sci. Technol. 2003, 37, 4971-4978.
24. Yanowitz, J.; McCormick, R.L.; Graboski, M.S. In-Use Emissions fromHeavy-Duty Diesel Vehicles; Environ. Sci. Technol. 2000, 34, 729-740.
25. Nussbaum, N.J.; Zhu, D; Kuhns, H.D.; Mazzoleni, C.; Chang, M.-C.O.;Moosmuller, H.; Watson, J.G. The In-Plume Emissions Test Stand: aNovel Instrument Platform for the Real-Time Characterization of Fuel-Based Combustion Emissions; J. Air & Waste Manage. Assoc. 2009, 59,1437–1445; doi: 10.3155/1047-3289.59.12.1437.
26. O’Shaughnessy, P.T.; Slagley, J.M. Photometer Response Determina-tion Based on Aerosol Physical Characteristics; AIHA J. 2002, 63,578-585.
27. Linnainmaa, M.; Laitinen, J.; Leskinen, A.; Sippula, O.; Kalliokoski, P.Laboratory and Field Testing of Sampling Methods for Inhalable andRespirable Dust; J. Occup. Environ. Hyg. 2008, 5, 28-35.
28. Arnott, W.P.; Moosmuller, H.; Rogers, C.F.; Jin, T.; Bruch, R. Photo-acoustic Spectrometer for Measuring Light Absorption by Aerosol:Instrument Description; Atmos. Environ. 1999, 33, 2845-2852.
29. Canagaratna, M.R.; Jayne, J.T.; Ghertner, D.A.; Herndon, S.; Shi, Q.;Jimenez, J.L.; Silva, P.J.; Williams, P.; Lanni, T.; Drewnick, F.; Demer-jian, K.L.; Kolb, C.E.; Worsnop, D.R. Chase Studies of ParticulateEmissions from In-Use New York City Vehicles; Aerosol Sci. Technol.2004, 38, 555-573.
30. Heywood, J.B. Internal Combustion Engine Fundamentals; McGraw-Hill:New York, 1988.
31. Bergmann, M.; Kirchner, U.; Vogt, R.; Benter, T. On-Road and Labo-ratory Investigation of Low-Level PM Emissions of a Modern DieselParticulate Filter Equipped Diesel Passenger Car; Atmos. Environ. 2009,43, 1908-1916.
32. Standard Specification for Diesel Fuel Oils; ASTM Standard D975; ASTMInternational: West Conshohocken, PA, 2008; available at http://www.astm.org (accessed 2009).
33. Detail Specification: Turbine Fuels, Aviation, Kerosene Types, NATOF-34(JP-8), NATO F-35, and JP-8 100; U.S. Military Specification MIL-DTL-83133E; U.S. Department of Defense: Washington, DC, 1999;available at http://www.desc.dla.mil/DCM/Files/t83133e.pdf (accessedJuly 2009).
34. Hinds, W.C. Aerosol Technology: Properties, Behavior, and Measurement ofAirborne Particles; Wiley: New York, 1999.
35. Kittelson, D.B.; Watts, W.F.; Johnson, J.P. Diesel Aerosol SamplingMethodology; Coordinating Research Council (CRC) E-43 Final Re-port; CRC: Alpharetta, GA, 2002; available at http://www.crcao.com/reports/recentstudies00-02/E-43FinalReport.pdf (accessed July 2009).
36. Kinsey, J.S.; Mitchell, W.A.; Squier, W.C.; Linna, K.; King, F.G.; Logan,R.; Dong, Y.; Thompson, G.J.; Clark, N.N. Evaluation of Methods forthe Determination of Diesel-Generated Fine Particulate Matter: Phys-ical Characterization Results; J. Aerosol. Sci. 2006, 37, 63-87.
37. Maricq, M.M.; Xu, N. The Effective Density and Fractal Dimension ofSoot Particles from Premixed Flames and Motor Vehicle Exhaust; J.Aerosol. Sci. 2004, 35, 251-1274.
38. Park, K.; Cao, F.; Kittelson, D.B.; McMurry, P.H. Relationship betweenParticle Mass and Mobility for Diesel Exhaust Particles; Environ. Sci.Technol. 2003, 37, 577-583.
39. Maricq, M.M.; Xu, N.; Chase, R.E. Measuring Particulate Mass Emis-sions with the Electrical Low Pressure Impactor; Aerosol Sci. Technol.2006, 40, 68-79.
40. Virtanen, A.; Marjamaki, M.; Ristimaki, J.; Keskinen, J. Fine ParticleLosses in Electrical Low-Pressure Impactor; J. Aerosol. Sci. 2001, 32,389-401.
41. Braun, A.; Huggins, F.E.; Seifert, S.; Ilavsky, J.; Shah, N.; Kelly, K.E.;Sarofim, A.; Huffman, G.P. Size-Range Analysis of Diesel Soot withUltra-Small Angle X-Ray Scattering; Combust. Flame 2004, 137, 63-72.
42. Boesl, U.; Nagel, H.; Weickhardt, C.; Frey, R.; Schlag, E. In The Ency-clopedia of Environmental Analysis and Remediation, John Wiley & Sons:New York, 1998; pp 5000-5022.
43. Burtscher, H.; Kunzel, S.; Huglin, C. Characterization of Particles inCombustion Engine Exhaust; J. Aerosol Sci. 1998, 29, 389-396.
44. AP-42, Emission Factors for Uncontrolled Industrial Diesel Engines, Section3.3 Small Engines, Updated 5th ed.; Contract No. 68-D2-0160, WorkAssignment 50; U.S. Environmental Protection Agency, 1996; avail-able at http://www.epa.gov/ttn/chief/ap42/ch03/final/c03s03.pdf (ac-cessed July 2009).
45. Frame, E.A. Tactical Vehicle Engine Emissions Investigations. Interim Re-port; TFLRF No. 365. Prepared for U.S. Army Corps of Engineers bySouthwest Research Institute: San Antonio, TX, 2002.
46. Saiyasitpanich, P.; Lu, M.; Keener, T.C.; Liang, F.; Khang, S.J. The Effectof Diesel Fuel Sulfur Content on Particulate Matter Emissions for aNonroad Diesel Generator; J. Air & Waste Manage. Assoc. 2005, 55,993-998.
47. Durbin, T.D.; Cocker, D.R.; Sawant, A.A.; Johnson, K.; Miller, J.W.;Holden, B.B.; Elgeson, N.L.; Jack, J.A. Regulated Emissions fromBiodiesel Fuels from On/Off-Road Applications; Atmos. Environ. 2007,41, 5647-5658.
48. Yost, D.M.; Montalvo, D.A; Frame, E.A. U.S. Army Investigation ofDiesel Exhaust Emissions Using the JP-8 Fuels with Varying SulfurContent. Society of Automotive Engineers (SAE) Technical Paper961981; SAE: Warrendale, PA, 1996; available at http://www.sae.org/technical/papers/961981 (accessed July 2009).
49. Frame, E.A; Blanks, M.G. Emissions from a 6.5-L HMMWV Engine onLow Sulfur Diesel Fuel and JP-8; Prepared for U.S. Army Corps of Engi-neers, Contract No. DAAE-07-99-C-L053 by Southwest Research Insti-tute: San Antonio, TX, 2004
50. Kouremenos, D.A.; Rakopoulos, C.D.; Hountalas, D.T. ExperimentalInvestigation of the Performance and Exhaust Emissions of a SwirlChamber Diesel Engine Using JP-8 Aviation Fuel; Int. J. Energy Res.1997, 21, 1173-1185.
Zhu et al.
1456 Journal of the Air & Waste Management Association Volume 59 December 2009

51. Miller, J.W.; Lents, J. Air Quality Implications of Backup Generators inCalifornia. Vol. 2: Emission Measurements from Controlled and Uncon-trolled Backup Generators; Prepared for the California Energy Commis-sion by the University of California–Riverside; Bourns College of En-gineering; Center for Environmental Research and Technology:Riverside, CA, 2005.
52. Plee, S.L.; MacDonald, J.S. Some Mechanisms Affecting the Mass ofDiesel Exhaust Particulate Collected following a Dilution Process; So-ciety of Automotive Engineers (SAE) Technical Paper 800186; SAE:Warrendale, PA, 1980; available at http://www.sae.org/technical/papers/800186 (accessed July 2009).
53. Chow, J.C.; Watson, J.G.; Chen, L.-W.A.; Paredes-Miranda, G.; Chang,M.-C.O.; Trimble, D.; Fung, K.K.; Zhang, H.; Yu, J.Z. Refining Temper-ature Measures in Thermal/Optical Carbon Analysis; Atmos. Chem.Phys. 2005, 4, 2961-2972.
54. Chow, J.C.; Watson, J.G.; Chen, L.-W. A.; Chang, M.C.O.; Robinson,N.F.; Trimble, D.; Kohl, S.D. The IMPROVE_A Temperature Protocolfor Thermal/Optical Carbon Analysis: Maintaining Consistency with aLong-Term Database; J. Air & Waste Manage. Assoc. 2007, 57, 1014-1023; doi: 10.3155/1047-3289.57.9.1014.
55. Watson, J.G.; Chow, J.C.; Lowenthal, D.H.; Pritchett, L.C.; Frazier,C.A.; Neuroth, G.R.; Robbins, R. Differences in the Carbon Composi-tion of Source Profiles for Diesel- and Gasoline-Powered Vehicles;Atmos. Environ. 1994, 28, 2493-2505.
56. Arnott, W.P.; Zielinska, B.; Rogers, C.F.; Sagebiel, J.; Park, K.; Chow,J.C.; Moosmuller, H.; Watson, J.G.; Kelly, K.; Wagner, D.; Sarofim, A.;Lighty, J.; Palmer, G. Evaluation of 1047-nm Photoacoustic Instru-ments and Photoelectric Aerosol Sensors in Source-Sampling of BlackCarbon Aerosol and Particle-Bound PAHs from Gasoline and DieselPowered Vehicles; Environ. Sci. Technol. 2005, 39, 5398-5406.
57. Moosmuller, H.; Arnott, W.P.; Rogers, C.F.; Bowen, J.L.; Gillies, J.A.;Pierson, W.R.; Collins, J.F.; Durbin, T.D.; Norbeck, J.M. Time-ResolvedCharacterization of Particulate Emission. 2. Instruments for Elementaland Organic Carbon Measurements; Environ. Sci. Technol. 2001, 35,1935-1942.
58. Faxvog, F.R.; Roessler, D.M. Mass Concentration of Diesel ParticleEmissions from Photoacoustic and Opacity Measurement; Aerosol. Sci.Technol. 1982, 1, 225-234.
59. Zielinska, B.; McDonald, J.; Hayes, T.; Chow, J.C.; Fujita, E.; Watson,J.G. Northern Front Range Air Quality Study, Final Report, Volume B:Source Measurements; Prepared for Colorado State University, Cooper-ative Institute for Research in the Atmosphere, by Desert ResearchInstitute: Reno, NV, 1998.
About the AuthorsDongzi Zhu and Nicholas Nussbaum are graduate researchassistants; Hampden Kuhns is a research professor; DavidSodeman is an assistant research professor; SebastianUppapalli is an assistant engineer; and Hans Moosmuller,Judith Chow, and John Watson are research professors inthe Division of Atmospheric Sciences at Desert ResearchInstitute (Nevada System of Higher Education). M.-C. OliverChang is an air resources supervisor I at California AirResources Board. Please address correspondence to:Dongzi Zhu, Division of Atmospheric Sciences, Desert Re-search Institute, 2215 Raggio Parkway, Reno, NV 89512;phone: 1-775-674-7086; fax: 1-775-674-7007; e-mail:[email protected].
Zhu et al.
Volume 59 December 2009 Journal of the Air & Waste Management Association 1457

Copyright of Journal of the Air & Waste Management Association (1995) is the property of Air & Waste
Management Association and its content may not be copied or emailed to multiple sites or posted to a listserv
without the copyright holder's express written permission. However, users may print, download, or email
articles for individual use.