in hiv‐1 infected women - predictive... · aichelburg, cid, 2009 hiv infected adults incidence in...
TRANSCRIPT
Predictive Value of IGRAs during Pregnancy for Postpartum Active
Tuberculosis in HIV 1 Infected WomenTuberculosis in HIV‐1 Infected Women
Jonnalagadda S1, Brown E1, Lohman‐Payne B1, Wamalwa D2, Farquhar C1, John‐Stewart G1
3rd Global Symposium on IGRAs
January 13, 2012
1 University of Washington, Seattle 2 University of Nairobi, Kenya
TB and HIV – deadly combination during pregnancy and postpartum
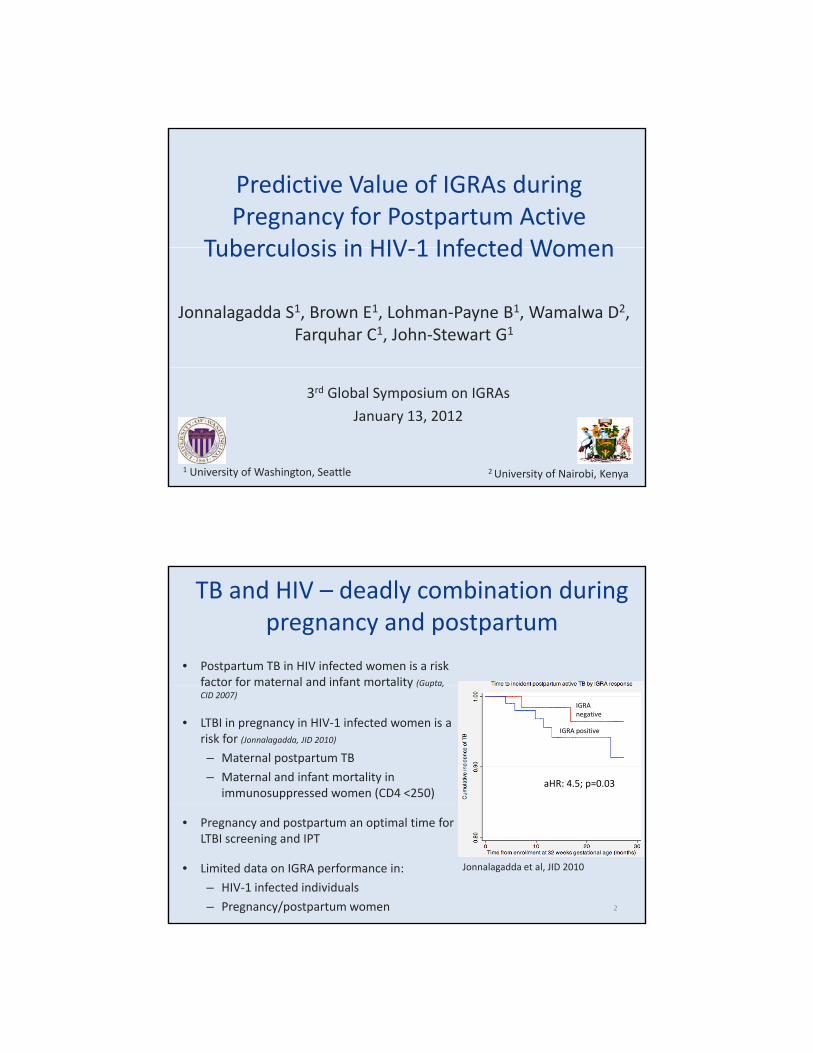
• Postpartum TB in HIV infected women is a risk factor for maternal and infant mortality (Gupta,factor for maternal and infant mortality (Gupta, CID 2007)
• LTBI in pregnancy in HIV‐1 infected women is a risk for (Jonnalagadda, JID 2010)
– Maternal postpartum TB
– Maternal and infant mortality in immunosuppressed women (CD4 <250)
IGRA negative
IGRA positive
aHR: 4.5; p=0.03
• Pregnancy and postpartum an optimal time for LTBI screening and IPT
• Limited data on IGRA performance in:
– HIV‐1 infected individuals
– Pregnancy/postpartum women 2
Jonnalagadda et al, JID 2010
IGRAs in HIV infected individuals
• Pooled sensitivity for LTBI in HIV infected individuals1:– 72% (T‐SPOT.TB)
– 61% (QFT‐GIT)
– Gold standard: active TB, assessed concurrently with IGRA
• IGRA positivity associated with risk for future TB
Author, Journal, Year Study populationMeasure of association (unadjusted) Unadjusted Estimate
31 Cattamanchi, JAIDS 2010
Rangaka, Lancet ID 2011 Meta‐analysis Pooled relative risk 2 to 3
Aichelburg, CID, 2009 HIV infected adults Incidence in IGRA positive 8%
Jonnalagadda, JID 2010 HIV infected women HR 2.7
IFN‐γ response as a predictive marker for future TB
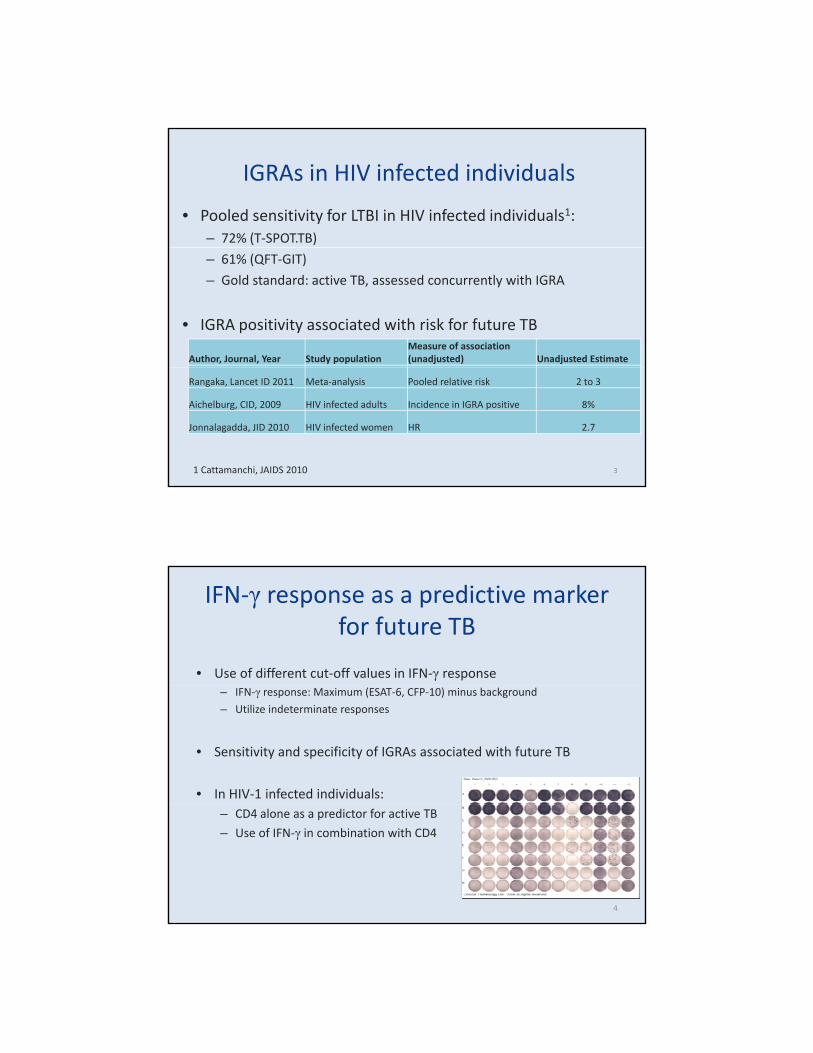
• Use of different cut‐off values in IFN‐γ response– IFN‐γ response: Maximum (ESAT‐6, CFP‐10) minus background
– Utilize indeterminate responses
• Sensitivity and specificity of IGRAs associated with future TB
• In HIV‐1 infected individuals:– CD4 alone as a predictor for active TB
– Use of IFN‐γ in combination with CD4
4
AimTo determine sensitivity, specificity and positive predictive value of varied cut‐offs in IFN‐γ response and CD4 cell count during pregnancy for (future) postpartum active TB.
IGRA during pregnancy
Postpartum active TBPresent Absent
Above IFN‐γ cut‐offa (true
positives)b (false positives)
a+b
Below IFN‐γ cut‐offc (false
negatives)d (true
negatives)c+d
• IFN‐γ cut‐off values (spot forming cells (SFCs)/well)
• >0 (least conservative)
• ≥6 (T‐SPOT.TB cut‐off for a positive response)
• ≥10 (most conservative)
5
a+c b+d
Sensitivity a/a+cSpecificity d/b+d
PPV a/a+b
Pregnancy Delivery Postpartum 1 year• CD4 cell count (cells/μL)
• <250
• <350
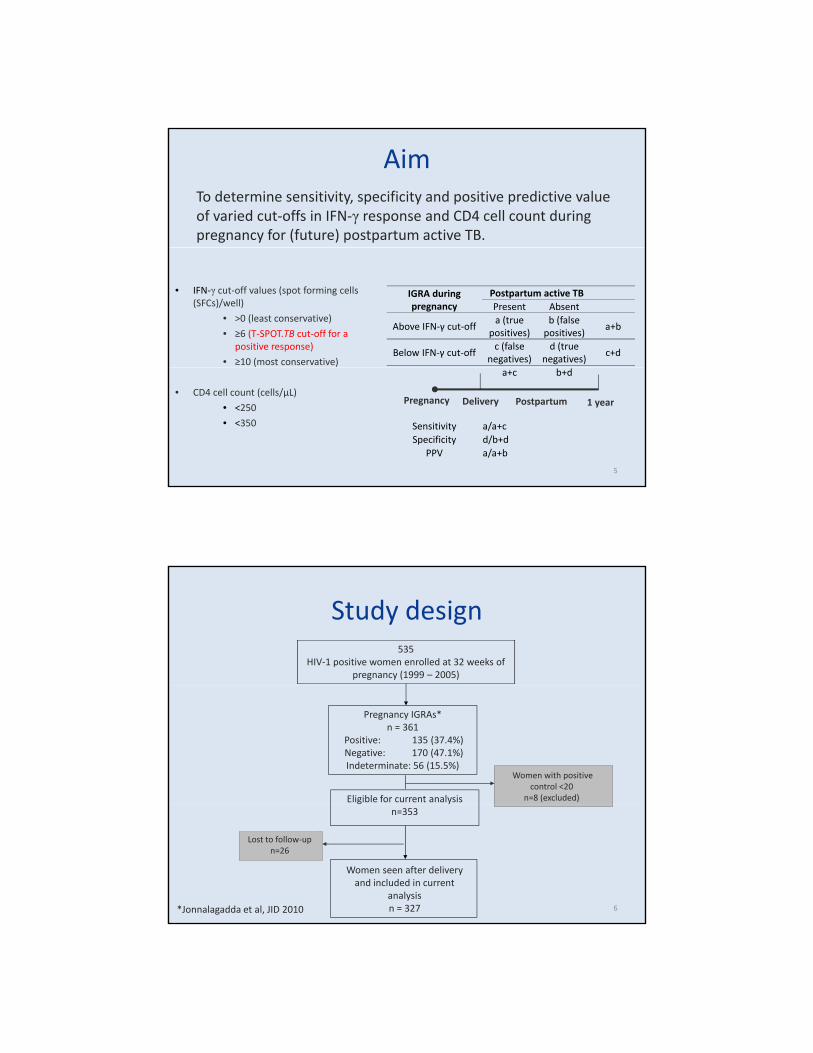
Study design535
HIV‐1 positive women enrolled at 32 weeks of pregnancy (1999 – 2005)
Pregnancy IGRAs*n = 361
Positive: 135 (37.4%) Negative: 170 (47.1%) Indeterminate: 56 (15.5%)
Women with positive control <20
n=8 (excluded)Eligible for current analysisn=353
Women seen after delivery and included in current
analysisn = 327
Lost to follow‐upn=26
6*Jonnalagadda et al, JID 2010
Analysis
• Sensitivity, Specificity
– Estimated from a time‐dependent ROC curve taking– Estimated from a time‐dependent ROC curve taking censoring into account1
• Positive predictive value (PPV)
– Kaplan Meier estimate of cumulative incidence rate and 95% CI
71 Heagerty, Biometrics 2000
Results
8
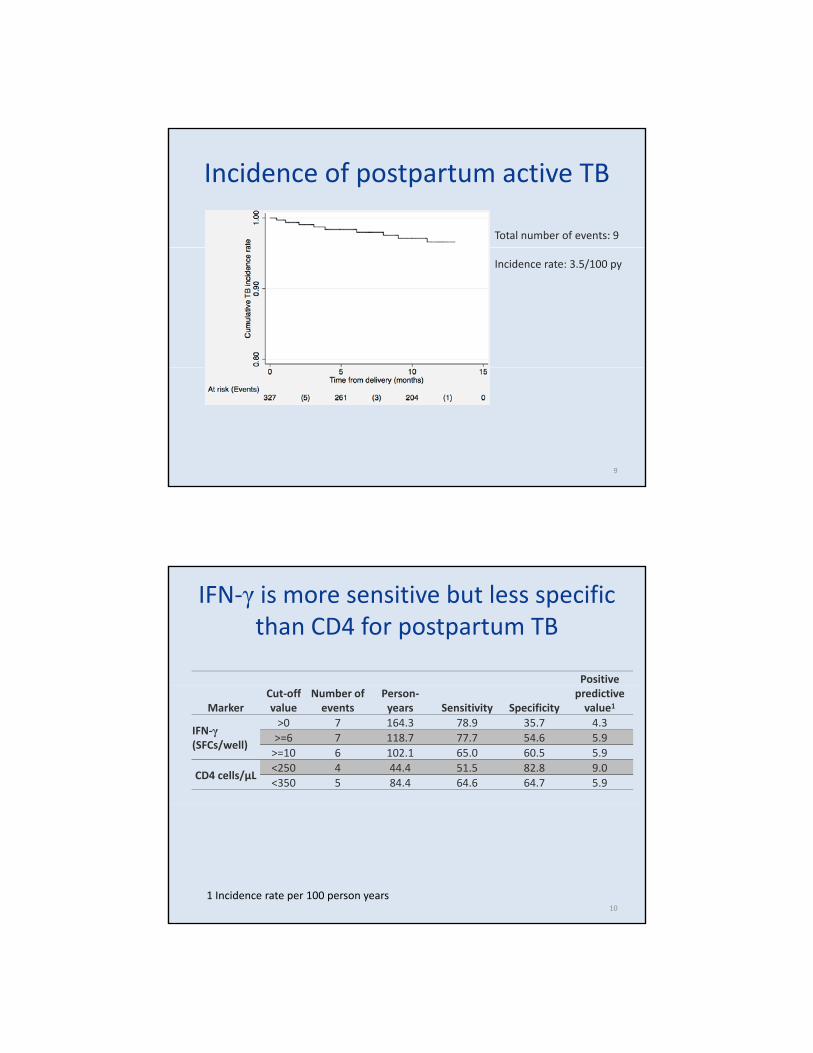
Incidence of postpartum active TB
Total number of events: 9
Incidence rate: 3.5/100 py
9
IFN‐γ is more sensitive but less specific than CD4 for postpartum TB
Positive
MarkerCut‐off value
Number of events
Person‐years Sensitivity Specificity
predictive value1
IFN‐γ(SFCs/well)
>0 7 164.3 78.9 35.7 4.3>=6 7 118.7 77.7 54.6 5.9>=10 6 102.1 65.0 60.5 5.9
CD4 cells/μL<250 4 44.4 51.5 82.8 9.0<350 5 84.4 64.6 64.7 5.9
101 Incidence rate per 100 person years
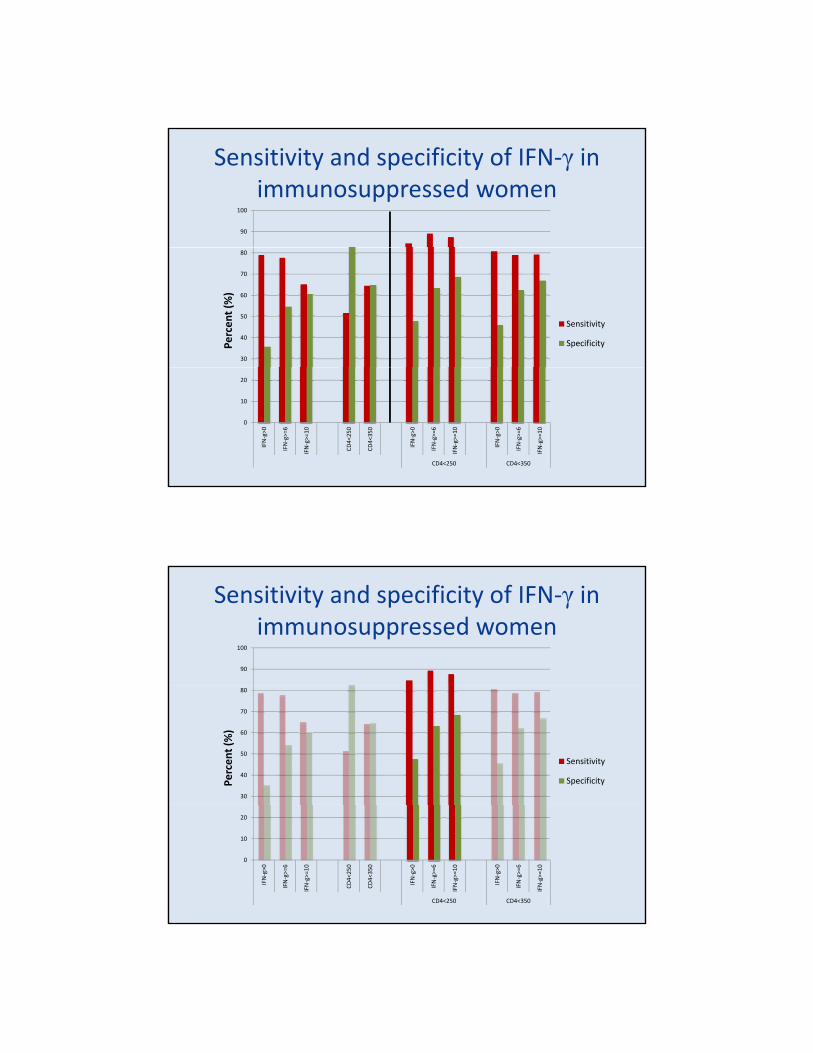
Sensitivity and specificity of IFN‐γ in immunosuppressed women
90
100
30
40
50
60
70
80
Sensitivity
SpecificityPercen
t (%)
0
10
20
IFN‐g>0
IFN‐g>=6
IFN‐g>=10
CD4<250
CD4<350
IFN‐g>0
IFN‐g>=6
IFN‐g>=10
IFN‐g>0
IFN‐g>=6
IFN‐g>=10
CD4<250 CD4<350
Sensitivity and specificity of IFN‐γ in immunosuppressed women
90
100
30
40
50
60
70
80
Sensitivity
SpecificityPercen
t (%)
0
10
20
IFN‐g>0
IFN‐g>=6
IFN‐g>=10
CD4<250
CD4<350
IFN‐g>0
IFN‐g>=6
IFN‐g>=10
IFN‐g>0
IFN‐g>=6
IFN‐g>=10
CD4<250 CD4<350
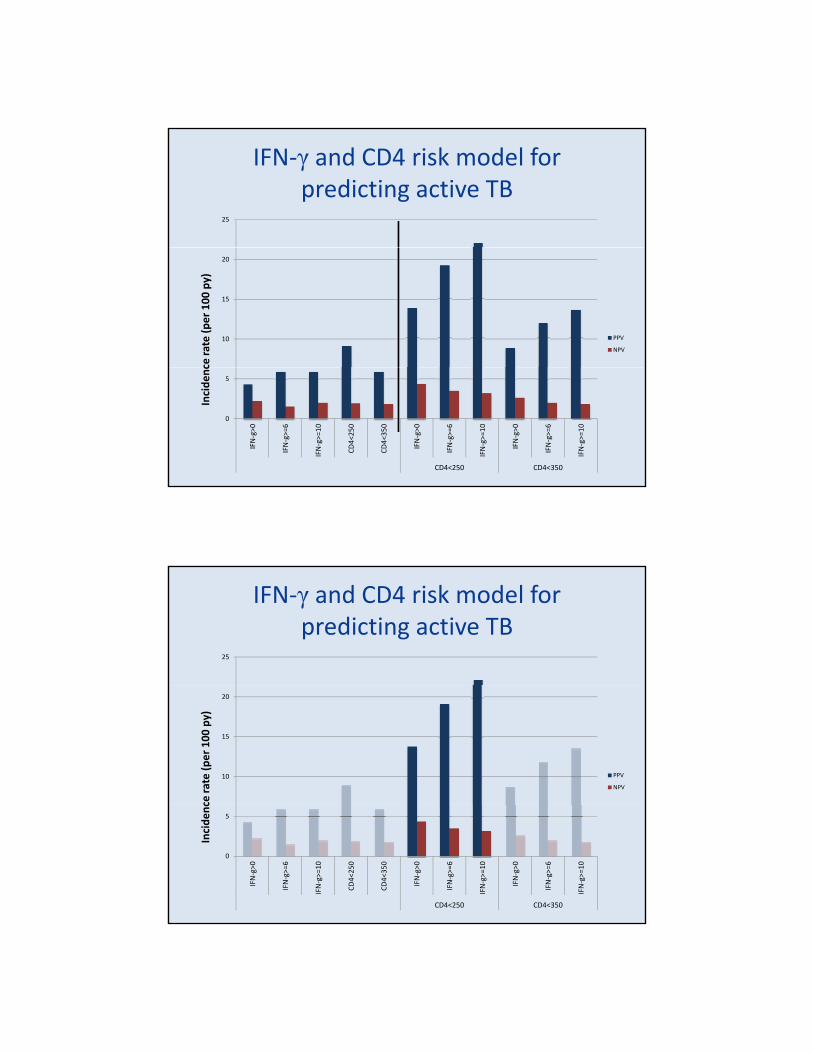
IFN‐γ and CD4 risk model for predicting active TB
25
ce ra
te (p
er 100
py)
10
15
20
PPV
NPV
Incide
nc
0
5
IFN‐g>0
IFN‐g>=6
IFN‐g>=10
CD4<25
0
CD4<35
0
IFN‐g>0
IFN‐g>=6
IFN‐g>=10
IFN‐g>0
IFN‐g>=6
IFN‐g>=10
CD4<250 CD4<350
IFN‐γ and CD4 risk model for predicting active TB
25
ce ra
te (p
er 100
py)
10
15
20
PPV
NPV
Incide
nc
0
5
IFN‐g>0
IFN‐g>=6
IFN‐g>=10
CD4<25
0
CD4<35
0
IFN‐g>0
IFN‐g>=6
IFN‐g>=10
IFN‐g>0
IFN‐g>=6
IFN‐g>=10
CD4<250 CD4<350
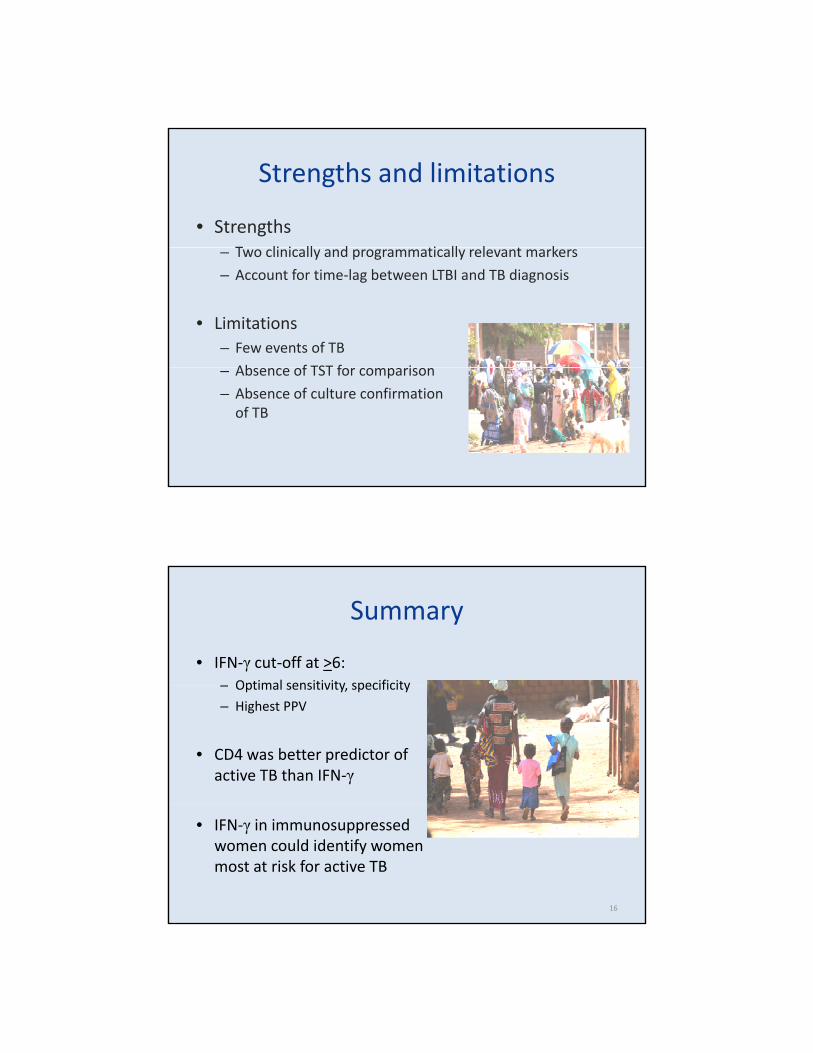
Strengths and limitations
• StrengthsT li i ll d ti ll l t k– Two clinically and programmatically relevant markers
– Account for time‐lag between LTBI and TB diagnosis
• Limitations– Few events of TB
Ab f TST f i– Absence of TST for comparison
– Absence of culture confirmation of TB
Summary
• IFN‐γ cut‐off at >6:Optimal sensitivity specificity– Optimal sensitivity, specificity
– Highest PPV
• CD4 was better predictor of active TB than IFN‐γ
• IFN‐γ in immunosuppressed women could identify women most at risk for active TB
16
Acknowledgements
• Study participants
K tt N ti l H it l P di t i R h L b• Kenyatta National Hospital, Pediatrics Research Lab, Nairobi, Kenya
• Funding sources
– NIH R21 HD058477‐01
– Firland Foundation Grant
LTBI detection
• T‐SPOT.TB IGRA used for LTBI detection
Positive control > 20 spots
ESAT‐6
CFP‐10
Positive response: ≥6 or 2x background
Negative control or background < 10 spots
18
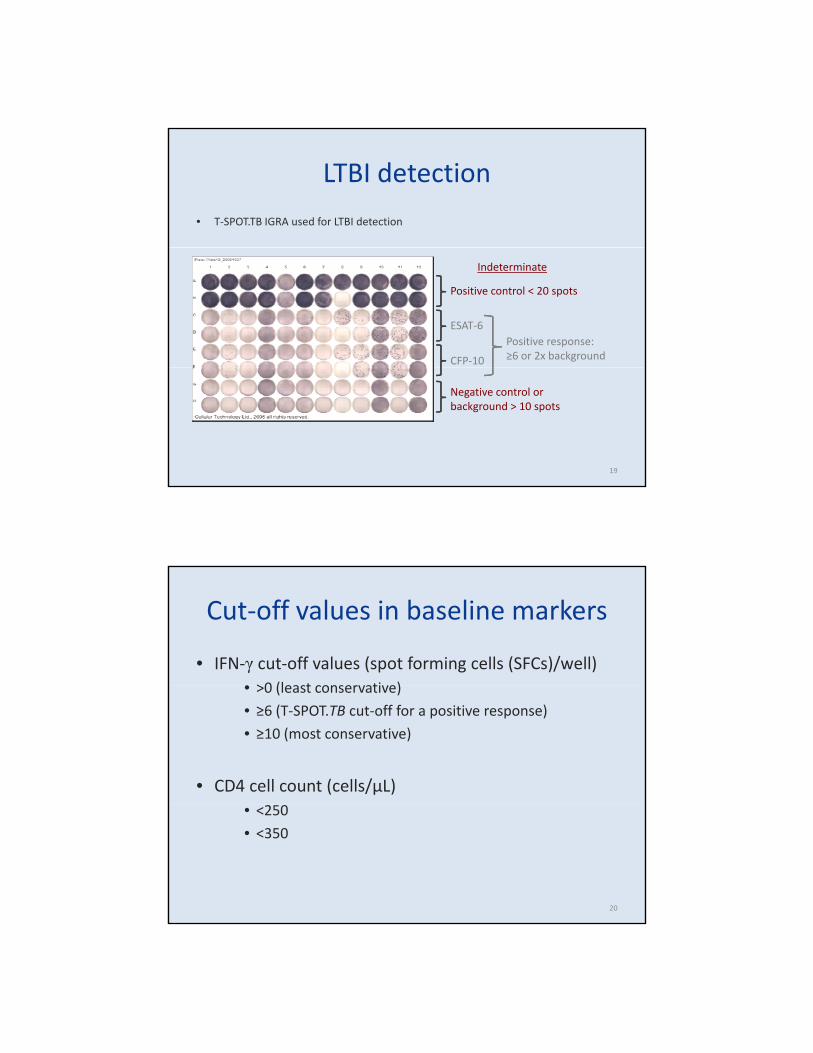
LTBI detection
• T‐SPOT.TB IGRA used for LTBI detection
Positive control < 20 spots
ESAT‐6
CFP‐10
Positive response: ≥6 or 2x background
Indeterminate
Negative control or background > 10 spots
19
Cut‐off values in baseline markers
• IFN‐γ cut‐off values (spot forming cells (SFCs)/well)>0 (l t ti )• >0 (least conservative)
• ≥6 (T‐SPOT.TB cut‐off for a positive response)
• ≥10 (most conservative)
• CD4 cell count (cells/μL)• <250
• <350
20

PPV of IFN‐γ in immunosuppressed women
25ce ra
te (p
er 100
py)
10
15
20
Incide
nc
0
5
IFN‐g>0 IFN‐g>=6 IFN‐g>=10 CD4<250 CD4<350 IFN‐g>0 IFN‐g>=6 IFN‐g>=10 IFN‐g>0 IFN‐g>=6 IFN‐g>=10
CD4<250 CD4<35021
IGRA predictive value, sensitivity, specificity
• Positive predictive valueIGRA positivity and risk for TB– IGRA positivity and risk for TB
– Association does not imply prediction
• Sensitivity, specificity– IGRA cut‐off values are based on active TB as gold‐standard
– Concurrent measurement of outcome (TB) and marker (IGRA)
• Limited data among:– HIV‐1 infected individuals
– Women during pregnancy and postpartum22
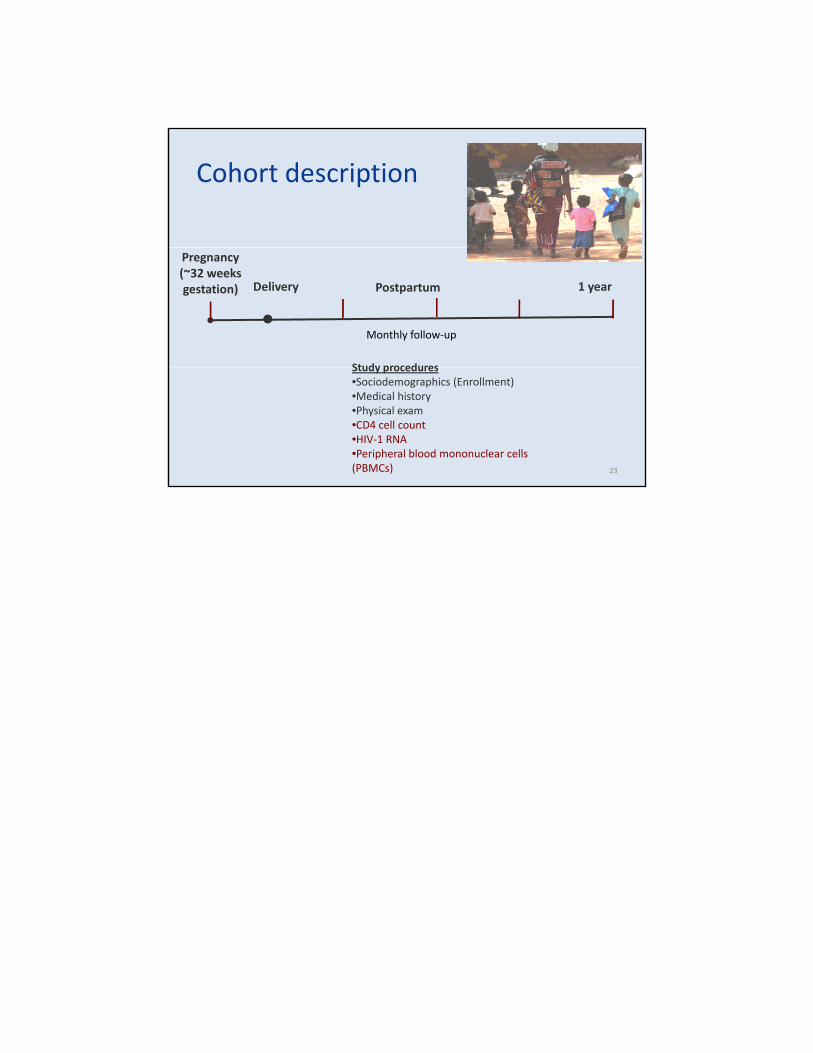
Cohort description
Pregnancy (~32 weeks gestation) Delivery Postpartum 1 year
Study procedures
Monthly follow‐up
Study procedures•Sociodemographics (Enrollment)•Medical history•Physical exam•CD4 cell count•HIV‐1 RNA •Peripheral blood mononuclear cells (PBMCs) 23