in depression and schizophrenia and cost-effectiveness of...
TRANSCRIPT

Economía y SociedadInformes 2008
Economía y Sociedad
Reducing the Burden of M
ental Illness in SpainInform
es 2008
José Luis Ayuso-MateosPedro Gutiérrez Recacha
Josep Maria HaroLuis Salvador Carulla
Francisco José Vázquez PoloMiguel Ángel Negrín Hernández
Daniel Chisholm
Gran Vía, 1248001 BilbaoEspañaTel.: +34 94 487 52 52Fax: +34 94 424 46 21
Paseo de Recoletos, 1028001 MadridEspañaTel.: +34 91 374 54 00Fax: +34 91 374 85 22
Reducing the Burden of Mental Illnessin SpainPopulation-Level Impactand Cost-Effectiveness of Treatmentsin Depression and Schizophrenia


Reducing the Burdenof Mental Illness in SpainPopulation-Level Impact andCost-Effectiveness of Treatmentsin Depression and Schizophrenia

Reducing the Burdenof Mental Illness in SpainPopulation-Level Impact andCost-Effectiveness of Treatmentsin Depression and Schizophrenia
José Luis Ayuso-MateosPedro Gutiérrez RecachaJosep Maria HaroLuis Salvador CarullaFrancisco José Vázquez PoloMiguel Ángel Negrín HernándezDaniel Chisholm

First published in May 2008
© the authors, 2008
© Fundación BBVA, 2008Plaza de San Nicolás, 4. 48005 [email protected]
A digital copy of this report can be downloaded free of charge at www.fbbva.es
The BBVA Foundation’s decision to publish this report does not imply anyresponsibility for its content, or for the inclusion therein of any supplementarydocuments or information facilitated by the authors.
Edition and production: Rubes Editorial
ISBN: 978-84-96515-69-7Legal deposit no.: B-25060-2008
Printed in Spain
Printed by Valant 2003
This book is produced with 100% recycled paper made from recoveredfibres, in conformity with the environmental standards required by currentEuropean legislation.

5
AUTHORS .................................................................................................................. 9
ACKNOWLEDGEMENTS .............................................................................................. 11
SUMMARY – RESUMEN .............................................................................................. 13
INTRODUCTION ......................................................................................................... 15Cost-effectiveness analysis and health .................................................................... 16The WHO-CHOICE programme ............................................................................... 25Application of WHO-CHOICE in mental health ........................................................ 29
PART 1Comparative Analysis at the Population Level of the Cost-Effectiveness
of Therapeutic Interventions in Depression
1. INTRODUCTION TO PART 11.1. Depression in global burden of disease studies ............................................... 331.2. Depression in Spain ...................................................................................... 341.3. Comparative cost-effectiveness analysis of interventions for depression ............ 341.4. Differentiated objectives ............................................................................... 35
2. RESEARCH METHODOLOGY2.1. Population ................................................................................................... 372.2. Methodology for estimating the burden of disease ........................................... 372.3. Cost-effectiveness analysis methodology, measured in DALYs, of depression
interventions in Spain ................................................................................... 402.3.1. Selected interventions for the cost-effectiveness study ........................ 402.3.2. Impact of interventions at the population level ................................... 402.3.3. Analysis of intervention costs ............................................................ 412.3.4. Sensitivity and uncertainty analyses .................................................. 422.3.5. Constraints ...................................................................................... 43
2.4. Cost-effectiveness analysis methodology, measured in QALYs, of depressioninterventions in Spain ................................................................................... 43
Contents

6
REDUCING THE BURDEN OF MENTAL ILLNESS IN SPAIN
3. RESULTS3.1. Burden of disease for depression in Spain in the year 2000 ............................. 473.2. Cost-effectiveness analysis, measured in DALYs, of depression interventions
in Spain ....................................................................................................... 483.2.1. Effectiveness of interventions and avoided depression ......................... 483.2.2. Contextualization and cost-effectiveness of interventions ..................... 483.2.3. Uncertainty analysis .......................................................................... 50
3.3. Cost-effectiveness analysis, measured in DALYs, of depression interventionsin Spain ....................................................................................................... 52
4. DISCUSSION4.1. Depression, a priority that can be dealt with .................................................... 534.2. Addressing depression in the community: The research agenda......................... 534.3. Conclusion .................................................................................................... 55
PART 2Comparative Analysis at the Population Level of the Cost-Effectiveness
of Therapeutic Interventions in Schizophrenia
5. INTRODUCTION TO PART 25.1. Schizophrenia and global burden of disease studies ......................................... 59
5.1.1. Disability and functioning in schizophrenia ......................................... 595.1.2. Mortality and schizophrenia ............................................................... 66
5.2. Schizophrenia in Spain .................................................................................. 665.3. Comparative cost-effectiveness analysis of interventions for schizophrenia ......... 685.4. Differentiated objectives ................................................................................ 68
6. RESEARCH METHODOLOGY6.1. Population .................................................................................................... 696.2. Methodology for estimating the burden of disease ............................................ 696.3. Methodology for estimating the prevalence and incidence of schizophrenia
in Spain ....................................................................................................... 696.3.1. Incidence figures .............................................................................. 706.3.2. Relative mortality risk ....................................................................... 716.3.3. Remission ........................................................................................ 716.3.4. Prevalence figures............................................................................. 71
6.4. Cost-effectiveness analysis methodology, measured in DALYs,of schizophrenia interventions in Spain ........................................................... 726.4.1. Selected interventions for the cost-effectiveness study ........................ 726.4.2. Impact of interventions at the population level .................................... 736.4.3. Analysis of intervention costs ............................................................. 736.4.4. Sensitivity and uncertainty analyses ................................................... 746.4.5. Constraints ....................................................................................... 74
6.5. Cost-effectiveness analysis methodology, measured in QALYs,of schizophrenia interventions in Spain ........................................................... 75

7
CONTENTS
7. RESULTS7.1. Burden of disease for schizophrenia in Spain in the year 2000 ......................... 777.2. Cost-effectiveness analysis, measured in DALYs, of schizophrenia
interventions in Spain .................................................................................... 777.2.1. Cost of interventions ......................................................................... 777.2.2. Effectiveness of interventions (avoidedburden) .................................... 787.2.3. Cost-effectiveness of interventions ..................................................... 797.2.4. Sensitivity and uncertainty analyses ................................................... 80
7.3. Cost-effectiveness analysis, measured in QALYs, of schizophreniainterventions in Spain .................................................................................... 83
8. DISCUSSION ........................................................................................................... 85
REFERENCES ............................................................................................................. 89
LIST OF FIGURES ....................................................................................................... 97
LIST OF TABLES ......................................................................................................... 99


9
José Luis Ayuso-Mateos, MDChair in PsychiatryLa Princesa University HospitalAutonomous University of [email protected]
Pedro Gutiérrez Recacha, PhDResearcher, Psychiatry DepartmentAutonomous University of Madrid
Josep Maria Haro, MDSpecialist in PsychiatryDirector of the San Juan de Dios Foundationfor Research and Teaching, BarcelonaCIBERSAM
Luis Salvador Carulla, MDProfessor of PsychiatryPSICOST Scientific Association
Francisco José Vázquez Polo, PhDChairmanDept. of Quantitative Methods,Faculty of Economics and Business ScienceUniversity of Las Palmas de Gran Canaria
Miguel Ángel Negrín Hernández, PhDAssistant ProfessorDept. of Quantitative Methods,Faculty of Economics and Business ScienceUniversity of Las Palmas de Gran Canaria
Daniel Chisholm, PhDEvidence and Information for PolicyWorld Health Organization, Geneva, Switzerland
Authors


11
The authors would like to thank the BBVA Founda-tion for its support in funding this project and mak-ing possible its publication. The work was coordi-nated by the Affective Disorders MultidisciplinaryResearch Group, which is funded by the UAM, theInstituto de Salud Carlos III through CIBERSAM,
Acknowledgements
and the 6th Framework Programme of the EuropeanUnion through the Marie-Curie Research TrainingNetworks within the MURINET project (MRTN-CT-2006-035794). The views expressed are those ofthe authors, and not necessarily those of any of theinstitutions named.


13
SummaryResumen
The present study aims to estimate the cost-effec-tiveness of interventions for reducing the burden ofdepression and schizophrenia in Spain and evalu-ate their population level impact. The study exam-ines the cost-effectiveness of different types ofclinical interventions at the level of the Spanishpopulation. For depression, the interventions con-sidered are the following: 1) tricyclic antidepres-sants (imipramine); 2) SSRIs (fluoxetine); 3) psy-chotherapy; 4) tricyclic antidepressants pluspsychotherapy; 5) SSRIs plus psychotherapy; 6)proactive collaboration management with tricyclicantidepressants; and 7) proactive collaborationmanagement with SSRIs. In our analysis, interven-
tions based on tricyclic antidepressants turned outto be the most cost-efficient option. For schizophre-nia, the interventions considered are the following:1) current situation; 2) older antipsychotics alone;3) new antipsychotics alone (risperidone); 4) olderantipsychotics plus psychosocial treatment; 5)new antipsychotics plus psychosocial treatment;6) older antipsychotics plus case management andpsychosocial treatment; and 7) new antipsychoticsplus case management and psychosocial treatment.Interventions based on the combination of old antip-sychotics with psychosocial treatment or psychosocialtreatment plus case management proved to be themost efficient strategies according to our analysis.
El presente estudio pretende estimar el coste-efec-tividad de las intervenciones para reducir la cargaasociada a la depresión y la esquizofrenia en Espa-ña y evaluar su impacto a nivel poblacional. El es-tudio examina el coste-efectividad de diferentes ti-pos de intervenciones en la población española.Para depresión, las intervenciones consideradas sonlas siguientes: 1) antidepresivos tricíclicos (imi-pramina); 2) ISRSs (fluoxetina); 3) psicoterapia;4) tricíclicos más psicoterapia; 5) ISRSs más psi-coterapia; 6) manejo colaborativo proactivo contricíclicos; 7) manejo colaborativo proactivocon ISRSs. En nuestro análisis, la intervención ba-sada en antidepresivos tricíclicos resulta la opciónmás coste-efectiva. Para esquizofrenia, las inter-
venciones consideradas son las siguientes: 1) si-tuación actual; 2) antipsicóticos típicos por sepa-rado; 3) antipsicóticos atípicos por separado (rispe-ridona); 4) antipsicóticos típicos más tratamientopsicosocial; 5) antipsicóticos atípicos más trata-miento psicosocial; 6) antipsicóticos típicos másprograma de continuidad de cuidados más trata-miento psicosocial; 7) antipsicóticos atípicos másprograma de continuidad de cuidados más trata-miento psicosocial. Las intervenciones basadas enuna combinación de antipsicóticos típicos y trata-miento psicosocial o tratamiento psicosocial y pro-grama de continuidad de cuidados resultan las es-trategias más eficientes según nuestro análisis.


15
The Global Burden of Disease (GBD) study con-ducted by the World Health Organization (Murrayand Lopez 1996) brought neuropsychiatric dis-eases to the forefront of the public health field.Part of the originality of the study’s approach layin the decision to set as a health measure forpopulations a combination of data regarding mor-tality caused by the different pathologies, and dataon disabilities suffered by affected people. Disabil-ity-Adjusted Life Years, or DALYs, were used as asummarised measure of the populations’ health.DALYs make it possible to jointly assess mortal andnon-mortal consequences of each of the patholo-gies under study. When this measure was used toestimate the burden of disease, the proportionlinked to world mental illnesses was found to be10.5% of the 1990 total. The latest estimates byour research group, in collaboration with the WHO,corresponding to the year 2000, indicate that de-pressive disorders account for 4.5% of the globalburden of disease in the world (65 million DALYsin all); this places the burden on par with ischemicheart disease, diarrhoea-related diseases, or thecombined impact of asthma and Chronic Obstruc-tive Pulmonary Disease (COPD). According to theclassification based on life Years Lost due to Dis-ability (YLD), four mental disorders appear amongthe top 10: unipolar depressive disorders, schizo-phrenia, alcohol abuse disorder and bipolar disor-der (World Health Organization 2001a; Ustun etal. 2004a). WHO projections to 2020 indicate thatthe relative importance of mental disorders willaccount for 15% of the total, due primarily tolonger life expectancy of the population and to areduction in the burden attributable to infectiousdiseases.
What can be done to reduce the burden of mentaldisorders, and at what cost? First of all, in order toreduce burden it is necessary to have informationabout mental health intervention strategies that areeffective, that can be generalised and adopted bythe healthcare system where they are going to beimplemented. There are many available tests re-garding the effectiveness and the costs of a widerange of drug and psychosocial interventions fortreating and managing these disorders. When itcomes to deciding which of these are the most ap-propriate for addressing health problems from apopulation perspective, one of the criteria to betaken into account is the advantage of the choicein terms of cost-effectiveness. Cost-effectivenessanalysis is an economic assessment techniquewhere the effects of two or more healthcare tech-nologies are compared in terms of natural units ofeffectiveness, while costs are assessed in monetaryunits. The following pages of this introduction pro-vide a more detailed description of the cost-effective-ness method and its application in the healthcarefield. The methods used in burden of disease stud-ies allow us to have a single unit of effectiveness—like the DALYs mentioned above—for comparingdifferent interventions with regard to the same pa-thology. However, methods based on individual pref-erences have also been used in the economic as-sessment of healthcare technologies. There arevarious generic healthcare-related Quality of Life(QoL) measures with Spanish versions that havebeen correctly validated (Badia 1995), but only oneof them—EuroQol (Gaminde and Cabasés 1996)—offers measurement units, called Quality-AdjustedLife Years (QALYs), that also take into account yearsof life and are useful for cost-effectiveness analy-
Introduction
16
REDUCING THE BURDEN OF MENTAL ILLNESS IN SPAIN
sis. Another recent instrument, the SF-36, is oneof the generic scales with the greatest potential foruse in assessing clinical results. This instrumentalso has a validated Spanish version (Alonso, Prietoand Anto 1995) and has been used in the field ofmental disorders among the general population(Ayuso-Mateos et al. 1999). Although it was de-signed to assess a health profile, it has managed tooffer a synthetic index based on individual prefer-ences of a sample of health conditions using theVisual Analogue Scale (VAS) and the standard set,after first reducing the health profile to six dimen-sions (Brazier et al. 1998).
In order to perform systematic comparisons, theWorld Health Organization set up the WHO-CHOICE(CHOosing Interventions that are Cost-Effective)project, proposing a cost-effectiveness analysismodel for interventions in the healthcare field. Themain characteristics of this project are also de-scribed in the following pages of this introduction.
Given the high prevalence of mental disorders andthe wide diversity of intervention strategies in-volved, one of the criteria to be taken into accountin the decision-making process within a healthcaresystem should be based, among other aspects, onthe cost of the different options and their cost-ef-fectiveness. Until now, most complete economicassessments in mental health have focused on spe-cific treatment modes for psychosis and mood dis-orders, in particular on the cost-effectiveness analy-sis of different drug treatments (Knapp et al. 2002;Hotopf, Lewis and Normand 1996). Only recentlyhave psychotherapeutic interventions (Patel et al.2003) and healthcare organizational models in pri-mary care (Simon, Katon and VonKorff 2001) beenincluded in these analyses. Our research group hasincluded these interventions in the studies it hascarried out as part of the WHO-CHOICE programmefocusing on depression disorders and schizophrenia.
COST-EFFECTIVENESS ANALYSISAND HEALTH
Cost-effectiveness analysis involves a technique forselecting an option from amongst a group of com-petitive strategies in a setting of restricted re-sources. This tool was originally applied in the mili-
tary, but obviously its usefulness can easily be ex-tended to other areas, such as, for example, theclinical environment (Warner and Hutton 1980).The need to establish some type of priority whenallocating resources is becoming more and moreimportant in the healthcare field, for three basicreasons (Vos et al. 2005):
• The growing amount of evidence pointing to thefact that the present use of resources is far fromoptimal.
• The constant growth in mental health expenses,both in absolute terms and percentage-wise.
• The desire to avoid the possibility that governmentresource-allocation decisions will not cover theirintended social objectives.
In a scenario marked by a drive to minimise theresources used, a method for deciding which clini-cal interventions can be implemented as efficientlyas possible given this situation is becoming moreand more necessary. Cost-effectiveness analysescan be a useful tool for such a purpose. The goal ofany cost-effectiveness analysis can be defined ei-ther as the maximization, for a given level of avail-able resources, of the aggregate health benefits tobe achieved with them, or the minimization, givena total level of health benefits defined as a target,of the costs involved in achieving this target(Weinstein and Stason 1977).
The technique used in cost-effectiveness analysisprovides the link between the cost and effective-ness of a certain intervention. The former is quan-tified in monetary units. To calculate costs ad-equately, one must take into account that healthexpenses and health benefits usually occur at dif-ferent times, with a certain time lapse betweenthem. Such a situation makes it advisable for ana-lysts to apply a specific discount rate to costs asso-ciated with previous years to account for the loss ofvalue experienced by the monetary unit during theinterval being considered. This loss of value is dueto two basic factors: first, inflation (one dollar in1999, for instance, could buy more goods and serv-ices than that same dollar in 2000), and second,the fact that at the present time, if the dollars allo-cated to costs had not been spent, they could havebeen invested productively, yielding interest to beearned in the future. Although widespread consen-sus appears to exist among economists with regard
17
INTRODUCTION
to the need to apply discount rates when estimat-ing costs, certain discrepancies exist when it comesto defining how they should be estimated (Weinsteinand Stason 1977). Moreover, in addition to directcosts (e.g., the cost of drugs applied in the inter-vention), it is possible to take indirect costs (orearnings) into consideration, such as the possibleeffect of the intervention on patients’ ability to per-form their work (Drummond et al. 1997).
Effectiveness can be measured in natural units—e.g, life years, the likelihood of surviving five yearsafter a cancer treatment, loss of weight after an in-tervention to eliminate obesity (Eddy 1992b)—orthrough some sort of scale that takes into accountvarious clinically significant dimensions. Weinsteinand Stason recommend orienting the estimation ofeffectiveness based on life prognosis estimates, as-sessing it in terms of QoL or total years lived, under-scoring the need to contemplate subjective values(Weinstein and Stason 1977). David M. Eddy iden-tifies three particularly complex properties thatshould meet measures of effectiveness in this typeof analysis: being able to capture all the necessaryinformation on the nature, frequency and desirabil-ity for the patient of all the significant treatmentresults, including any additional treatment charac-teristics that may affect its desirability to the pa-tient; and being additive (it should be possible toadd the “health units” associated with different pa-tients in order to obtain overall sums) (Eddy 1992c).A measure of effectiveness that has been proposedwith notable success is the so-called health-statusindex. A system of weights (generally ranging from0 to 1) is used to assess the possible health statusof an individual at a given point in time. By multi-plying each of these rates by the number of yearslived in each status by the individual, we reach anestimate of the total number of years lived in fullhealth by the subject (Weinstein and Stason 1977).QALYs are one of these measures of effectivenessbased on health indices (Torrance and Feeny 1989).They assume the existence of two basic dimensionsfor summarising the result of a treatment: its effecton the duration of the patient’s life, and its effecton the patient’s QoL. The purpose of the QALY meas-ure is to unify both dimensions and combine theminto a single dimension, which can be defined as an“equivalent life duration”, in which years lived areweighted as a function of the QoL achieved by thepatient. The underlying idea of this measure is that
individuals would accept losing a certain number oflife years in exchange for living the remainder oftheir years with a better QoL, which would enablethe translation of QoL measures into equivalent timemeasures (years) (Eddy 1992c). Other units suggest-ing the same philosophy are DALYs, which the WorldBank proposed as a measure of the burden associ-ated with a specific disease (World Bank 1993).These types of measures have the advantage of mak-ing it possible to compare a wide range of diseases.An important question that all analysts should askif they seek to draw general conclusions from theiranalysis (e.g., when deciding the allocation of re-sources) is whether all significant interventions havebeen examined (Drummond et al. 1997).
In short, we can conclude by saying that measuresof effectiveness should try to “capture” all the neces-sary information about the significant dimensionsof the results of a treatment (basically, the likeli-hood of recovery, relative mortality and morbidity,and QoL following treatment). However, in order tobe useful, a cost-effectiveness analysis does nothave to be absolutely inclusive and consider all thepossible dimensions associated with the result ofan intervention. On occasion, it is enough to con-sider a small number of significant dimensions (oreven a single dimension), since adding others wouldmake the study more complicated and less com-prehensible, depending on the specific case towhich it is being applied and the objectives set bythe analysts (Eddy 1992c).
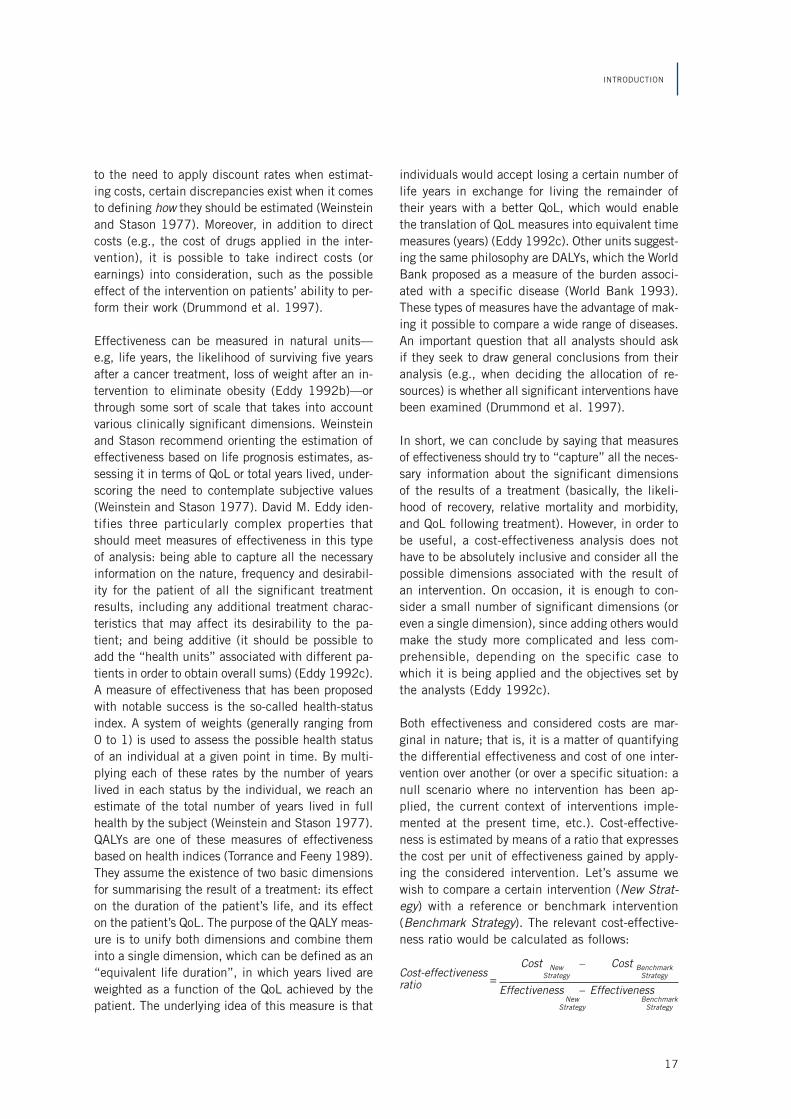
Both effectiveness and considered costs are mar-ginal in nature; that is, it is a matter of quantifyingthe differential effectiveness and cost of one inter-vention over another (or over a specific situation: anull scenario where no intervention has been ap-plied, the current context of interventions imple-mented at the present time, etc.). Cost-effective-ness is estimated by means of a ratio that expressesthe cost per unit of effectiveness gained by apply-ing the considered intervention. Let’s assume wewish to compare a certain intervention (New Strat-egy) with a reference or benchmark intervention(Benchmark Strategy). The relevant cost-effective-ness ratio would be calculated as follows:
Cost – Cost =
Effectiveness – Effectiveness
Cost-effectivenessratio
NewStrategy
NewStrategy
BenchmarkStrategy
BenchmarkStrategy
18
REDUCING THE BURDEN OF MENTAL ILLNESS IN SPAIN
The lower the magnitude of the ratio obtainedthrough this calculation, the more cost-effective theNew Strategy will be. The technique could be ap-plied to compare other alternative interventionsagainst the benchmark. The strategy with the low-est cost-effectiveness ratio would be the most cost-effective strategy. Individual ratios can also be cal-culated for each intervention by dividing theirassociated cost by their effectiveness. Moreover, thecost-effectiveness analysis can also be used inabsolute terms if we set a few benchmarks andthresholds for comparison. For instance, if the mag-nitude of the ratios obtained is below a certain pre-determined threshold, then we can say that thestrategy is cost-effective. Different studies can havedifferent thresholds defined by their authors, so theapplication of the term cost-effective would dependon the context (Azimi and Welch 1998). The ratiosobtained can also be ordered by magnitude, estab-lishing a classification of the interventions from thelowest to the highest cost per unit of effectiveness,so that the people in charge of implementing inter-ventions can select them sequentially until avail-able resources are depleted.
Given the above explanation, it is easy to deduce inwhich situations a cost-effectiveness analysis be-comes a relevant decision-making tool. If it candemonstrate clearly, when assessing a new inter-vention, that it is more effective and less costly thanthe one currently being implemented, then no ad-ditional analyses would be required (in such cases,this intervention is said to be dominant). The choicewould be equally clear if the new intervention wereassociated with higher costs and less effectiveness(in which case, the intervention would be consid-ered a dominated intervention). However, there is a
grey area covering those cases where both the costand the effectiveness of the new intervention arehigher or lower than the intervention that is beingconsidered as a benchmark for comparison. In suchsituations, the cost-effectiveness analysis repre-sents a tool that can shed light on the decision-making process.
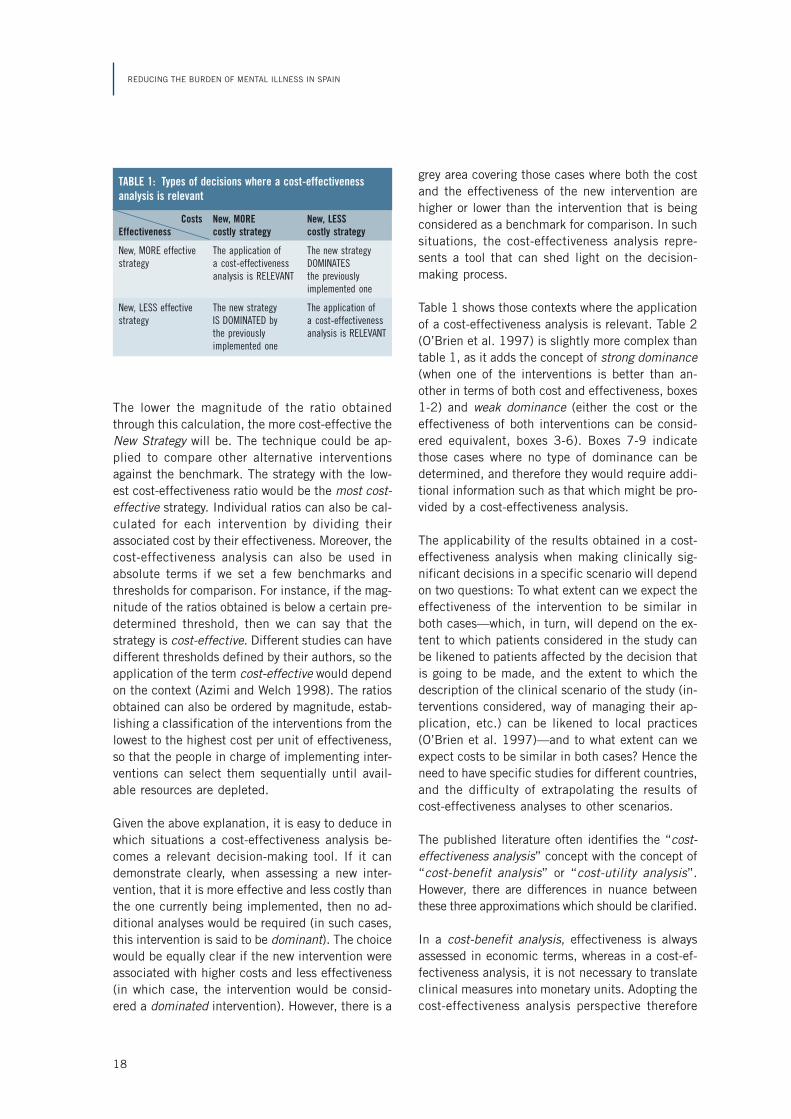
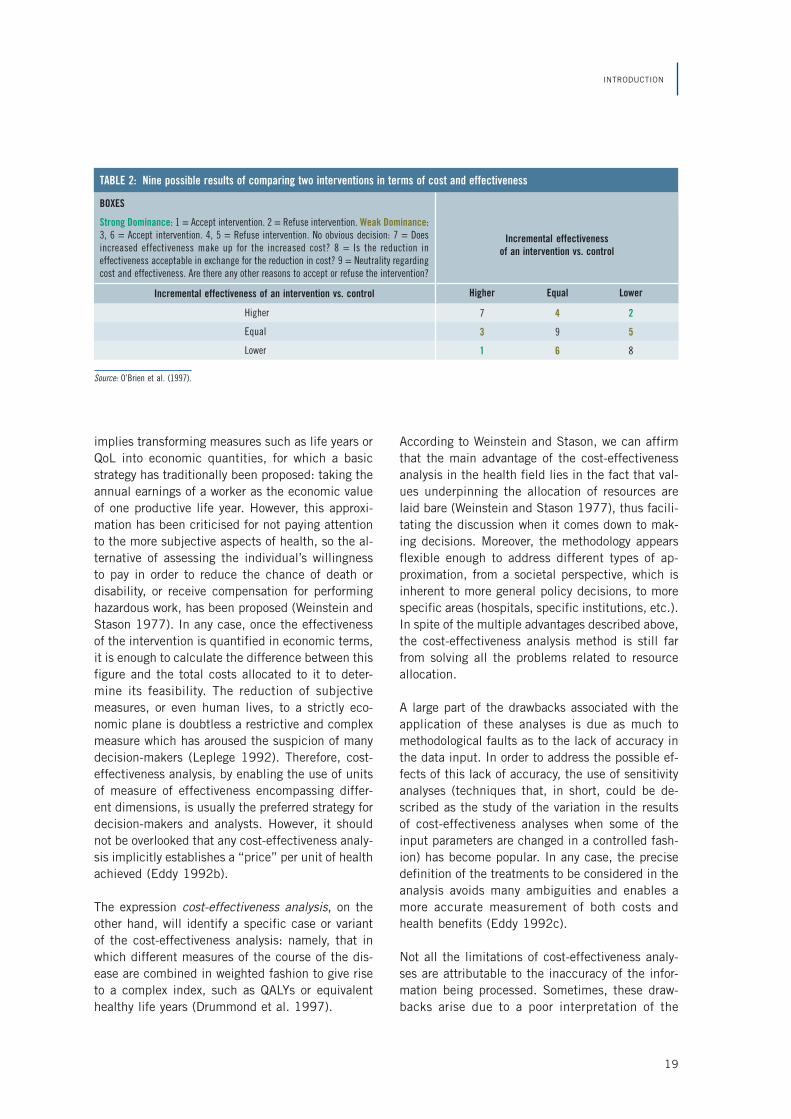
Table 1 shows those contexts where the applicationof a cost-effectiveness analysis is relevant. Table 2(O’Brien et al. 1997) is slightly more complex thantable 1, as it adds the concept of strong dominance(when one of the interventions is better than an-other in terms of both cost and effectiveness, boxes1-2) and weak dominance (either the cost or theeffectiveness of both interventions can be consid-ered equivalent, boxes 3-6). Boxes 7-9 indicatethose cases where no type of dominance can bedetermined, and therefore they would require addi-tional information such as that which might be pro-vided by a cost-effectiveness analysis.
The applicability of the results obtained in a cost-effectiveness analysis when making clinically sig-nificant decisions in a specific scenario will dependon two questions: To what extent can we expect theeffectiveness of the intervention to be similar inboth cases—which, in turn, will depend on the ex-tent to which patients considered in the study canbe likened to patients affected by the decision thatis going to be made, and the extent to which thedescription of the clinical scenario of the study (in-terventions considered, way of managing their ap-plication, etc.) can be likened to local practices(O’Brien et al. 1997)—and to what extent can weexpect costs to be similar in both cases? Hence theneed to have specific studies for different countries,and the difficulty of extrapolating the results ofcost-effectiveness analyses to other scenarios.
The published literature often identifies the “cost-effectiveness analysis” concept with the concept of“cost-benefit analysis” or “cost-utility analysis”.However, there are differences in nuance betweenthese three approximations which should be clarified.
In a cost-benefit analysis, effectiveness is alwaysassessed in economic terms, whereas in a cost-ef-fectiveness analysis, it is not necessary to translateclinical measures into monetary units. Adopting thecost-effectiveness analysis perspective therefore
Costs New, MORE New, LESSEffectiveness costly strategy costly strategy
New, MORE effective The application of The new strategystrategy a cost-effectiveness DOMINATES
analysis is RELEVANT the previouslyimplemented one
New, LESS effective The new strategy The application ofstrategy IS DOMINATED by a cost-effectiveness
the previously analysis is RELEVANTimplemented one
TABLE 1: Types of decisions where a cost-effectivenessanalysis is relevant
19
INTRODUCTION
implies transforming measures such as life years orQoL into economic quantities, for which a basicstrategy has traditionally been proposed: taking theannual earnings of a worker as the economic valueof one productive life year. However, this approxi-mation has been criticised for not paying attentionto the more subjective aspects of health, so the al-ternative of assessing the individual’s willingnessto pay in order to reduce the chance of death ordisability, or receive compensation for performinghazardous work, has been proposed (Weinstein andStason 1977). In any case, once the effectivenessof the intervention is quantified in economic terms,it is enough to calculate the difference between thisfigure and the total costs allocated to it to deter-mine its feasibility. The reduction of subjectivemeasures, or even human lives, to a strictly eco-nomic plane is doubtless a restrictive and complexmeasure which has aroused the suspicion of manydecision-makers (Leplege 1992). Therefore, cost-effectiveness analysis, by enabling the use of unitsof measure of effectiveness encompassing differ-ent dimensions, is usually the preferred strategy fordecision-makers and analysts. However, it shouldnot be overlooked that any cost-effectiveness analy-sis implicitly establishes a “price” per unit of healthachieved (Eddy 1992b).
The expression cost-effectiveness analysis, on theother hand, will identify a specific case or variantof the cost-effectiveness analysis: namely, that inwhich different measures of the course of the dis-ease are combined in weighted fashion to give riseto a complex index, such as QALYs or equivalenthealthy life years (Drummond et al. 1997).
According to Weinstein and Stason, we can affirmthat the main advantage of the cost-effectivenessanalysis in the health field lies in the fact that val-ues underpinning the allocation of resources arelaid bare (Weinstein and Stason 1977), thus facili-tating the discussion when it comes down to mak-ing decisions. Moreover, the methodology appearsflexible enough to address different types of ap-proximation, from a societal perspective, which isinherent to more general policy decisions, to morespecific areas (hospitals, specific institutions, etc.).In spite of the multiple advantages described above,the cost-effectiveness analysis method is still farfrom solving all the problems related to resourceallocation.
A large part of the drawbacks associated with theapplication of these analyses is due as much tomethodological faults as to the lack of accuracy inthe data input. In order to address the possible ef-fects of this lack of accuracy, the use of sensitivityanalyses (techniques that, in short, could be de-scribed as the study of the variation in the resultsof cost-effectiveness analyses when some of theinput parameters are changed in a controlled fash-ion) has become popular. In any case, the precisedefinition of the treatments to be considered in theanalysis avoids many ambiguities and enables amore accurate measurement of both costs andhealth benefits (Eddy 1992c).
Not all the limitations of cost-effectiveness analy-ses are attributable to the inaccuracy of the infor-mation being processed. Sometimes, these draw-backs arise due to a poor interpretation of the
TABLE 2: Nine possible results of comparing two interventions in terms of cost and effectiveness
Incremental effectivenessof an intervention vs. control
Higher Equal Lower
7 4 2
3 9 5
1 6 8
BOXES
Strong Dominance: 1 = Accept intervention. 2 = Refuse intervention. Weak Dominance:3, 6 = Accept intervention. 4, 5 = Refuse intervention. No obvious decision: 7 = Doesincreased effectiveness make up for the increased cost? 8 = Is the reduction ineffectiveness acceptable in exchange for the reduction in cost? 9 = Neutrality regardingcost and effectiveness. Are there any other reasons to accept or refuse the intervention?
Incremental effectiveness of an intervention vs. control
Higher
Equal
Lower
Source: O’Brien et al. (1997).

20
REDUCING THE BURDEN OF MENTAL ILLNESS IN SPAIN
cost-effectiveness analysis concept itself. Doubilet,Weinstein and McNeil identify two common prob-lem situations (Doubilet, Weinstein and McNeil1986). The first refers to the use of the expression“cost-effective” in papers where no explicit infor-mation is provided about the interventions underdiscussion, so that one simply tries to justify theaffirmation by appealing to qualitative rationales.The second refers to the diversity of meanings thatcan be attributed to the expression “cost-effective-ness”. The authors, providing abundant examplesfrom medical literature, find up to four possiblemeanings for the expression, namely:
1) “Cost-effectiveness” as a synonym of cost sav-ings. According to this criterion, a strategy willonly be considered cost-effective if it savesmoney with regard to those to which it is com-pared. These types of decisions may be appro-priate in an economic or administrative setting,but they are less satisfactory when applied to aclinical setting, where not all the major dimen-sions to be considered can be reduced withoutambiguity to monetary values.
2) “Cost-effectiveness” as a synonym of effecti-veness. According to this criterion, a strategy willbe considered cost-effective if it is more effec-tive in terms of health benefits than those towhich it is compared. This is a mistaken use ofthe term, since adding “cost” to “effectiveness”implies that some form of economic analysis wasrequired.
3) “Cost-effectiveness” as cost savings with equal(or better) health results. This criterion is usedrather frequently in literature, and interventionsthat meet it are obviously desirable. However, itbecomes an exceedingly restrictive conditionwhen applied to clinical decisions. It would ex-clude more effective strategies that do not pro-duce cost savings or those that increase effec-tiveness only marginally while achieving a con-siderable reduction in costs.
4) “Cost-effectiveness” as obtaining an addedhealth benefit that makes up for the added cost.According to this criterion, a strategy is viewedas being “more cost-effective” than another oneif it meets one of these three conditions:
a) It is less costly, and at least as effective, asthe other one.
b) It is more effective and more costly than the
other one, and its added benefit makes up forthe extra cost.
c) It is less effective and costly, but the addedbenefit from the alternative strategy does notmake up for the extra cost.
According to the authors, this fourth interpretationis the best suited to the true purpose of a cost-ef-fectiveness analysis. On the other hand, it is thehardest to apply in practice, as it requires complexvalue judgments from decision-makers when noneof the interventions is less costly and more effec-tive than the rest of the alternatives. Doubilet et al.propose the use of the expression “cost-effective”without providing any type of additional clarifica-tions only in those cases that meet condition a ofthe three conditions proposed under criterion 4. Forthose others that meet conditions b or c, they rec-ommend adding some form of clarifying remark re-ferring to the decision-maker’s willingness to pay,thus qualifying the results obtained (example citedby the authors: “Strategy X is cost-effective pro-vided one is willing to pay at least $30,000 per lifeyear gained”).
Finally, Doubilet et al. discuss two mistaken con-cepts commonly associated with the cost-effective-ness analysis methodology. The first is enunciatedas follows: “The strategy with the best (i.e., the low-est) cost-effectiveness ratio is the most cost-effec-tive, and therefore the one that should be adopted.”In their opinion, the affirmation conceals two short-comings. In the first place, it would be necessaryto indicate at which cut-off value the strategy be-comes cost-effective, or regarding which interven-tions. In the second, there are no theoreticalgrounds to justify that the most cost-effective op-tion should be the one that is finally implementedin practice. The authors offer a hypothetical exam-ple. Imagine a disease that, if left untreated, causesdeath within one week. However, if treated with in-tervention A (which costs $100), life expectancy isone year, and if treated with intervention B (whichcosts $1,000), life expectancy increases to fiveyears. If we compare intervention B to interventionA, we find that it is less cost-effective, obtainingan incremental ratio of $225 per life year gained:($1,000 – $100) / (5 years – 1 year). The ratio inthis case does not allow the most desirable strat-egy from a clinical standpoint to be selected, sincecomplex values (prolonging life as one of medicine’s

21
INTRODUCTION
basic goals) come into play in the final decision.As for the second mistaken conception regardingcost-effectiveness analysis pointed out by Doubiletet al., it is formulated thus: “When choosing themost cost-effective alternative among available strat-egies, it is not necessary to ‘make trade-offs’ be-tween patients’ health and monetary costs.” Unlessone option is clearly more effective and less costlythan the others, this type of discussion is inevita-ble, so the final decision will inevitably pose a prob-lem that is not only strictly clinical, but also ethical.
In addition to considering the conceptual misinter-pretations of the cost-effectiveness methodology,some authors have also recommended that we payattention to possible biases in the analyses (espe-cially in those sponsored by the pharmaceutical in-dustry) (Hillman et al. 1991; Kassirer and Angell1994; Azimi and Welch 1998). In drawing up thepolicy guidelines of The New England Journal ofMedicine, Kassirer and Angell indicate that cost-effectiveness analyses present a certain hybrid na-ture that places them halfway between original sci-entific articles and reviews, participating partiallyin the characteristics of both. Like the former, theyexplicitly set out the methods and data used, andthe conclusions are based on the results obtained.Like the latter, they allow the use of assumptionswhen choosing models or selecting collected datathat, in the authors’ opinion, would be permeableto biases (particularly with regard to the economicside of analyses) (Kassirer and Angell 1994). How-ever, it would not be fair to attribute this risk exclu-sively to cost-effectiveness analyses; rather, itshould be said that they are inherent to clinical re-search in general (Steinberg 1995).
In a series of articles where reviewing a number offundamental questions regarding cost-effectivenessanalyses, David M. Eddy—under the peculiar guiseof a conversation with his father, Maxon H. Eddy,who was also a physician but was sceptical aboutthe benefits of applying this tool—identifies somefactors that, in his opinion, would explain the con-troversy that has sometimes been sparked by the useof this methodology (Eddy 1992a; Eddy 1992b; Eddy1992c; Eddy 1992d). Eddy establishes four basiccategories of factors, which would be as follows:
1) Clinical reasons. Many health professionals donot feel very comfortable with the cost-effective-
ness methodology. From the clinician’s view-point, the results obtained from such analysescan sometimes be anti-intuitive, as it is possiblefor treatments with proven effectiveness not tobe cost-effective. The recommendations of acost-effectiveness analysis, therefore, can some-times run contrary to the judgment of clinicians,since while clinicians seek to achieve the maxi-mum benefit in terms of health for a single pa-tient or a small group of patients, the recommen-dations usually seek to maximise the benefit ata population level with limited resources. For theclinician, the priority of each treatment wouldbe determined by the degree of benefit producedin a specific patient (e.g., a life-saving operationwould be more important than eliminating cavi-ties). The application of a cost-effectivenessanalysis means shifting from the health profes-sional’s perspective to that of society as a whole,which would require clinicians to make two as-sumptions:
a) Adopting a broad perspective covering a largenumber of patients, not only those assignedto him.
b) Thinking in terms of the total volume of dif-ferent treatments that can be applied with afixed set of resources.
Moreover, there is a widespread belief that a glo-bal perspective is associated with biases detri-mental to those diseases less prevalent amongthe public. However, in actuality, the measure isindependent from the epidemiology: since thenumerator and denominator of the cost-effective-ness ratio depend on the number of patients,their possible effects would be cancelled out inthe quotient.
2) Methodological reasons. We have already spokenof the difficulty in obtaining accurate measuresof the costs and benefits in terms of health. Mosttreatments present benefits (or side effects) thataffect different dimensions of health; all of thesemust be measured and ultimately integrated. Inaddition, cost-effectiveness analysis relies on theassumption that the health benefits to differentindividuals are accrued (e.g., a gain of 10“health units” for a single subject would be as-sumed to equal a gain of 5 “health units” fortwo different subjects, something that is, at thevery least, debatable: following the example
22
REDUCING THE BURDEN OF MENTAL ILLNESS IN SPAIN
given earlier, eliminating the risk of death in asmall group of patients can be more importantthan reducing the risk of cavities in a large per-centage of the population). Therefore, it is advis-able to compare interventions of similar impor-tance using the mentioned cost-effectivenessmethodology.
3) Psychological reasons. Any novel technique, likecost-effectiveness analysis in the medical field,is usually received with certain scepticism byprofessionals. This effect is aggravated by thefact that the methodology implies abstract con-cepts, both mathematical and economic, withwhich clinicians do not seem to be very familiar(although it could be argued that cost-effective-ness analysis principles have been implicitly ap-plied to traditional medical practice for sometime). In many cases, the abstruseness of theresults obtained using this technique make itdifficult for them to be verified in practice. It isnecessary in many cases to have specialists (e.g.,statisticians, mathematicians, and economists)interpret the resulting data and determine thepriorities, which some clinicians can view as in-terference. These types of problems would not beexclusive to cost-effectiveness analyses, as theycould extend to a long list of multidisciplinarytechniques that seek to facilitate decision-mak-ing processes in various fields of healthcare (Sal-vador-Carulla, Haro and Ayuso-Mateos 2006). Inaddition, a classification of treatments accord-ing to their cost-effectiveness can turn some ofthem into “winners” and others into “losers”.It is very likely that clinicians specialising intreatments that are not judged to be cost-effec-tive would, understandably, be wary of themethodology.
4) Philosophical and political reasons. These implypersonal and social values, which are often mis-matched. We have already referred in point 1,by way of example, to the possible conflicts aris-ing between the clinician’s viewpoint and a popu-lation-based perspective. Besides, political fac-tors subject to public debate can influence de-cisions deriving from cost-effectiveness analyses.For instance, the technique is useful only if weconsider a scenario in which resources are lim-ited. However, if we assume that health outlayscan be increased indefinitely, the concept ofcost-effectiveness would lose its supposed use-fulness.
Another type of controversy refers to the matter ofwhether the cost-effectiveness method is a usefulmeans of achieving the objectives for which it wasproposed. For example, Azimi and Welch questionthe hypothesis that the application of this tech-nique leads to savings in total health expenditures(Azimi and Welch 1998). Revising 109 articlespublished between 1990 and 1996 in which a cost-effectiveness ratio was mentioned explicitly, theyfind that the authors’ conclusions for 58 of them(53%) recommended strategies whose implemen-tation required additional investment. As Azimi andWelch themselves acknowledge, the reduction ofoverall costs is not in itself the main goal of cost-effectiveness analyses; rather, it is more related tothe efficient allocation of limited resources (oftenby establishing a classification of interventions ac-cording to their cost-effectiveness, such that thoseregarded as more cost-effective are applied withpreference over those deemed less cost-effective).Even so, the authors note a number of drawbacksthat should be taken into account, including thedifficulty in accurately determining the total usablebudget (i.e., the resources that can be allocated)and the impossibility of providing cost-effectivenessratios for all the available interventions. In the faceof this criticism, it should be noted that the cost-effectiveness study is simply an analytical tool(Eddy 1992b), whose aim is none other than to pro-vide information. It is possible that this informa-tion is not always used to achieve the same goals,as the end-goals to be achieved are not always laidout by the analysis methodology, but rather attunedto the specific interests of the decision-maker whowill assess its results.
Another type of limitation is inherent to the ap-proach of cost-effectiveness studies. For example,the costs and accrued effects are assessed for agroup of individuals (or even entire populations)from the perspective of this methodology, disregard-ing the study of individual cases (or of cases ofhighly specific groups of individuals, e.g. marginalminorities) (Weinstein and Stason 1977). Therefore,such fundamental aspects when making decisionslike ensuring fairness in the distribution of thera-peutic interventions among the members of a popu-lation lie beyond the reach of this type of analysis.Their results can be considered as providing orien-tation in economic terms, but there are also othertypes of values that determine the final decision.

23
INTRODUCTION
The well-known Oregon case is a good example ofthe drawbacks of using cost-effectiveness analysesas the sole criterion when allocating resources. In abid to optimise the investment provided by a lim-ited Medicaid public health budget, which is gearedtoward meeting the health needs of the low-incomesegments of the American population, the OregonHealth Services Commission implemented a prior-ity system based on the application of cost-effec-tiveness ratios from 1990 to 1996. The proposedresource allocation policy generated such a contro-versy that it finally had to be withdrawn. In reply tothe criticism received, the Commission finally es-tablished a selection process where priorities wereassigned according to 13 different factors, includ-ing—not as the main factor, but as one among the13—the cost-effectiveness of the interventions.Other factors included by the Commission referredto key issues, such as fairness or the benefit of themajority. Therefore, it would be a mistake to con-sider that the function of all cost-effectivenessanalyses is to determine the allocation of resourcesby itself, excluding all other criteria. Rather, theyshould be viewed as a tool providing supplemen-tary information for the decision-making processthat should be taken into account, together withother different considerations. The main contribu-tion of these types of techniques is to provide stand-ardised quantitative estimates to facilitate the com-parison between interventions (Russell et al. 1996).
Indeed, the disparity of methods used by cost-ef-fectiveness analyses is one of the biggest downsidesof this methodology (Udvarhelyi et al. 1992). Vari-ous solutions have been proposed to address thesecontroversies and ensure the standardization andcomparability of the results. For instance, nationalguidelines have been developed for cost-effective-ness studies in countries like Canada (CanadianCoordinating Office for Health Technology Assess-ment 1994) and the UK (Joint Strategy Group ofthe Government and the Association of the BritishPharmaceutical Industry 1994), advising the useof sensitivity analyses. The efforts in America by apanel of cost-effectiveness experts (the Panel onCost-Effectiveness in Health and Medicine) con-vened by the US Public Health Service (PHS) areworthy of note. After a consensus process thatspread out over 11 meetings and two-and-a-halfyears involving PHS personnel and methodologistsfrom federal agencies, the panel drew up the con-
clusions of the discussion in the form of a set ofguidelines referring to different aspects of cost-ef-fectiveness analyses (Russell et al. 1996; Weinsteinet al. 1996; Siegel et al. 1996):
1) Nature and limits of the cost-effectiveness analy-sis. The panel of experts reflected on some is-sues relating to cost-effectiveness analyseswhich we have referred to earlier: the possibleperspectives to be adopted (individual or soci-ety-centred) and the auxiliary nature of the in-formation provided by this type of methodologyto the decision-making process involving the al-location of resources, notwithstanding that otherdimensions (ethical, social, etc.) should also beconsidered. The authors indicate that no singlestudy can provide, by itself, all the informationrequired to compare health services in a widerange of conditions and interventions, so it is vi-tal to ensure the possibility of comparing the dif-ferent analyses. Hence the advisability of deter-mining certain standards to which the individualstudies should be subjected.
2) Components pertaining to the numerator and de-nominator in a cost-effectiveness ratio. By con-vention, the numerator of the ratio should reflectthe changes in the use of resources associatedwith the application of a given intervention, andthe denominator should reflect the resultinghealth improvements. However, the question isopen to certain ambiguity in some cases, likequantifying intervals of time. The authors recom-mend considering the time individuals invest infinding healthcare or being subjected to treat-ment as one more component of the interventionthat should be assessed in monetary terms as partof the numerator. The time elapsed while the in-dividual suffers from the disease (the period ofmorbidity), however, would be viewed as a meas-ure of the effect on the patient’s health of apply-ing the intervention being considered, and there-fore should be included in the denominator.
3) Measure of numerator terms (costs) in a cost-effectiveness ratio. The authors underscore theneed to assess variations in the use of resourcesconsigned in the numerator of the ratio accord-ing to opportunity costs; i.e., in reference to thevalue that the resources could have produced ifthey had been invested in the best possible wayamong the possible alternatives. In addition, theuse of constant monetary measures (referring to
24
REDUCING THE BURDEN OF MENTAL ILLNESS IN SPAIN
a specific year) is recommended to avoid the dis-tortion introduced by inflation. Another matterthat can commonly give rise to ambiguity is thequantification of the costs associated with thework force to which individuals pertain. In otherwords, the common solution of considering aworker’s salary to estimate the opportunity costis hailed by the authors as being appropriate,although they advise that estimates of salary ac-cording to the composition of the population bygender and age should be taken into account.Another important issue refers to the inclusionof what the authors call “induced costs” con-cept, which encompass five different main cat-egories:
• Costs originated by diseases related with theintervention that appear in the life years thatwould have been lived anyway if the interven-tion had not been applied (e.g., the cost orsavings in treating heart attacks by applyingan intervention to control hypertension). Costsoriginated by diseases not related to the in-tervention that appear in the life years thatwould have been lived anyway if the interven-tion had not been applied.
• Costs related directly to health originated bydiseases related to the intervention that ap-pear in the life years added (or subtracted) asa result of applying the intervention.
• Costs related directly to health originated bydiseases not related to the intervention thatappear in the life years added (or subtracted)as a result of applying the intervention.
• Costs not related directly to health yet linkedto the provision of services (food, board, etc.)that occur in the life years added (or sub-tracted) as a result of applying the interven-tion.
The authors recommend including the costs as-sociated with diseases related to the interven-tion, while leaving at the discretion of the ana-lyst the decision of whether or not to considerthe costs produced by diseases not related to theintervention. As for costs not directly related tohealth, the panel of experts does not recommendtheir inclusion.
4) Assessment of the health consequences in thedenominator of a cost-effectiveness ratio. Thepanel of experts recommends the use of meas-
ures based on weights according to preferences,like DALYs, but acknowledging at the same timethat their application can generate some contro-versy on an ethical or social plane. These sameauthors cite the following example: an interven-tion that would lengthen the life of 80-year-oldpatients could appear to be “less cost-effective”than an identically effective intervention appliedto a group of subjects in their twenties, not onlydue to the lower number of years gained but alsobecause the QoL of years gained would be lowerin the former case.
5) Estimation of the effectiveness of interventions.It is possible to obtain valid effectiveness datafrom different sources: controlled randomisedtrials, observational studies, uncontrolled ex-periments or series of descriptions. The authorsalso recognise that the use of models can con-stitute a valid and necessary scientific processto estimate these measures, bearing in mindthat the models should always be viewed ascomplementary and not as substitutes for em-pirical data.
6) Time preference and discount. The panel of ex-perts proposes the use of discounts to reflect theregular preference of individuals toward receiv-ing benefits as quickly as they become available.Moreover, they also point out that the empiricalevidence seems to demonstrate that this dis-count rate would hover around 3%, the figurerecommended by the authors for cost-effective-ness analyses, although they underscore the con-venience of performing sensitivity analyses ac-counting for the effects on results of a variationin the discount percentage.
7) Handling uncertainty in cost-effectiveness stud-ies. Even acknowledging the unit of applicationof one-way sensitivity analyses, where the valueof a single parameter varies each time, the au-thors point to the convenience of also perform-ing multiway sensibility analyses where the valueof several significant parameters is varied simul-taneously, thus enabling correlations betweenthem to be uncovered.
8) Recommendations for presenting results. For anoptimum use of the results of cost-effectivenessanalyses, these should be presented accordingto standardised procedures. The differences inthe presentation of results of different analysescould hamper the interpretation and comparisonof the information provided.
25
INTRODUCTION
Although initially the application of the cost-effec-tiveness analysis technique was characterised by acertain methodological heterogeneity, the appear-ance of guidelines and standards has vastly im-proved the possibilities of comparing between stud-ies and their rigor, and therefore their practicalusefulness. The following paragraph, taken from thepanel of experts from the US Public Health Serv-ice, can provide a good summary of the situationby way of conclusion:
If researchers endeavour to follow a standard setof methods in CEA [cost-effectiveness analysis]and to obtain the required inputs for their stud-ies, much will have been accomplished towardimproving the utility of this form of analysis. Itis hoped that the recommendations containedhere will stimulate rapid progress toward avail-ability of the necessary data and tools, so thatthe practice of CEA can soon become as estab-lished as many other forms of scientific enquiry(Weinstein et al. 1996).
THE WHO-CHOICE PROGRAMME
The functions of the World Health Organization in-clude giving advice to the persons responsible forhealthcare policy in each country so that they canhave information on which to base priorities for amore efficient allocation of resources. With thispurpose in mind, the WHO designed the WHO-CHOICE (CHOosing Interventions that are Cost-Ef-fective) programme, which started to be developedin 1998. This programme’s basic goals include col-lecting regional databases on cost, the health im-pact on the population, and the cost-effectivenessanalyses of the main interventions against variousdiseases (Tan Torres, Baltussen and Adam 2003).
The WHO-CHOICE programme has adopted a sec-tor-based perspective regarding the development ofcost-effectiveness studies. Thus, for each analysisit has attempted to assess all the possible alterna-tive uses for the available resources in order to of-fer the authorities in charge of allocation a classifi-cation or league table of such alternatives, orderedaccording to their cost-effectiveness (Hutubessy etal. 2001) and including uncertainty analyses(Baltussen et al. 2002). In this regard the pro-
gramme can be considered ground-breaking, sinceuntil its launch there were very few published analy-ses adopting such a broad perspective, in spite ofthe fact that the World Bank had already carriedout cost-effectiveness comparisons at the interna-tional level to identify priorities in controlling dis-eases in developing countries (Jamison et al. 1993)and care programmes for nations with different lev-els of economic development (World Bank 1993).The analyses developed by the Oregon Health Serv-ices Commission (Dixon and Welch 1991) and theHarvard Life Saving Project (Tengs et al. 1995) arealso worthy of note.
In particular, through the WHO-CHOICE programmethe WHO attempted to solve some of the difficul-ties traditionally faced by authorities in charge ofallocating resources in various countries, which canessentially be summarised as follows (Hutubessy,Chisholm and Edejer 2003):
1. Methodological inconsistencies. The heterogene-ous nature of the methods used until now to as-sess costs has been a drawback, regarding boththe interpretation and the comparison of the re-sults of different studies.
2. Lack of data. Of note is the absence of informa-tion that has regularly affected certain services andpopulations (especially in developing countries).
3. Lack of generalization. The results of specificcost-effectiveness studies have rarely been pre-sented in a way that can easily be transferred toother scenarios and systems.
4. Limited technical or implementation capability.In addition to the shortage of expert personnelcapable of performing economic assessments insome settings (developing countries), there arealso limited possibilities and (sometimes) inter-est when it comes to translating the results ofthe analyses into decisions regarding the alloca-tion of healthcare resources.
Some of these problems could be due to the regu-lar adoption of an incremental perspective whenperforming cost-effectiveness studies. Incrementalcost-effectiveness analyses start off with thepresent situation in a specific scenario (i.e., con-sidering the alternatives that have been put intopractice at the present time) in order to take thiscontext as the point of reference for determiningthe cost and differential effectiveness associated
26
REDUCING THE BURDEN OF MENTAL ILLNESS IN SPAIN
with adding or replacing an intervention comparedto the alternatives already in place. This approachinvolves, among others, the following pitfalls(Hutubessy et al. 2002):
• The incremental approach is appropriate whenallocation decisions are restricted by the meas-ures already in place (i.e., when it comes tochanging them). However, this type of analysisis not helpful in planning long-term policies, andtells us nothing about whether the currently ap-plied interventions are cost-effective or not.
• By taking the interventions already being appliedin certain scenarios as the starting point, the useof the incremental analysis is limited to thosescenarios, because the alternatives applied toother scenarios do not necessarily have to be thesame, thus hindering any generalization.
• The incremental approach does not consider thesynergy effect that can arise between differentinterventions.
In a bid to overcome these obstacles, commonlyassociated with sector-based studies, the WHO-CHOICE programme adopted the generalised cost-effectiveness analysis perspective. The novelty ofsuch a perspective is the consideration of a “nullscenario”, which would reflect the situation whereno type of intervention is applied. The introductionof this null (or “counterfactual”) scenario makes itpossible to establish a standard with which the dif-ferent interventions may be compared. The fact thatalternative interventions are assessed in relation tothe non-intervention situation does not necessarilyhamper a hypothetical decision to reallocate re-sources in the short term (which, a priori, would besimpler if based on an incremental analysis; i.e.,estimating the marginal variations caused by achange in the intervention currently being imple-mented in terms of cost and effectiveness). Sufficeit to consider the present intervention as one morealternative to be assessed in relation to the nullscenario, thus making it possible to establishdifferential comparisons between the cost-effective-ness of the rest of the operations and the one cur-rently being implemented. Furthermore, a general-ised perspective distinguishes the possibility ofgrouping different interventions that interact interms of cost-effectiveness (that is, those interven-tions whose costs or effectiveness changes whenapplied simultaneously, so that they cannot be con-
sidered additive or accruable) with the purpose ofassessing not only the cost-effectiveness of individualalternatives, but also the cost-effectiveness of com-binations of the various alternatives (Hutubessy,Baltussen, Torres-Edejer and Evans 2002; Hutubessy,Chisholm and Edejer 2003). The WHO-CHOICEprogramme has developed its own guidelines forapplying generalised cost-effectiveness analysis(Murray et al. 2000) and for reducing variabilitywhen estimating costs (Adam, Koopmanschap andEvans 2003).
Thus, in addition to the main goal acknowledgedby the WHO-CHOICE programme (the search for anefficient allocation of resources), other goals in-clude the need to generalise results and the con-sideration of long-term effects (Hutubessy, Bendiband Evans 2001). To achieve its objectives, theWHO-CHOICE programme has implemented a se-ries of strategies (Hutubessy, Chisholm and Edejer2003). These include the development of a set ofanalytical tools enabling the comparison of studiesperformed with different methodologies. The CostIt(Costing Intervention Templates) software was de-signed for the purpose of storing and analysing costdata. Its main function is to automatically calcu-late the economic expense of considered interven-tions. It consists of a set of templates where costsare consigned at different levels: hospital, serviceprovider, family, and also programme costs—thatis, costs generated at the administrative level andnot directly linked to the application of healthcareresources to beneficiaries. These costs have regu-larly been dodged by cost-effectiveness studies thusfar (Johns, Baltussen and Hutubessy 2003). CostItuses macros to perform complex calculations, suchas automatically converting the costs measured inany year to costs in the base year selected by theanalyst, or adjusting costs to different levels of use.The PopMod application was designed to modeldiseases according to different stages of transition,making it possible to simulate the evolution of dif-ferent cohorts (by age and gender) after applying agiven intervention (Lauer et al. 2003).
The WHO-CHOICE programme chose to assess theefficacy of interventions based on the savings theygenerate in terms of DALYs. One of the advantagesof using DALYs as a unit of efficacy is that it ena-bles the analyst to express gains at the populationlevel as a proportion of the current burden of dis-

27
INTRODUCTION
ease (which is likewise assessed in DALYs). Anadded advantage is the simplicity of cataloguing anintervention as either cost-effective or not cost-ef-fective. The WHO-CHOICE programme applies thecriterion suggested by the WHO Commission onMacroeconomics and Health (Commission on Mac-roeconomics and Health 2001), which can be sum-marised as follows:
• If the cost per DALY saved is lower than the an-nual per capita income of the region or countrybeing considered, the intervention is assumed tobe “highly cost-effective”.
• If the cost per DALY saved is lower than threetimes the annual per capita income of the re-gion or country being considered, the interven-tion is assumed to be “cost-effective”.
• If the cost per DALY saved is higher than threetimes the annual per capita income of the re-gion or country being considered, the interven-tion is assumed to be “not cost-effective”.
The WHO-CHOICE programme established a divi-sion of the world’s population into 14 epidemio-logical subregions. The choice of the “subregion”as the geographic unit for carrying out each analy-sis owes its existence to a compromise between thegeneral and the specific. On one hand, the need toovercome the global approaches used in the pastwas taken into account, since these approachesprovided scant information for decision-making inspecific national contexts. On the other hand, theunfeasibility of performing specific studies focus-ing on each one of the 192 WHO member coun-tries (an objective that is doubtless desirable, yetimpossible in the short term) is also assumed.
Based on this philosophy, the WHO-CHOICE pro-gramme has promoted global or regional cost-effec-tiveness studies on different health-related inter-ventions and preventive measures: policies for thesafe and adequate administration of injections toavoid the hypothetical spread of lethal pathologies,such as hepatitis or the HIV virus (Dziekan et al.2003), proposals to reduce the risk of cardiovascu-lar diseases through the reduction of systolic pres-sure and cholesterol levels (Murray et al. 2003),measures to stem air pollution caused by the useof solid fuels in indoor spaces (Mehta and Shahpar2004), anti-smoking policies (Shibuya et al. 2003),interventions aimed at reducing iron deficiency
(Baltussen, Knai and Sharan 2004), different cata-ract surgical procedures (Baltussen, Sylla andMariotti 2004), strategies for reducing the globalburden associated with alcohol abuse (Chisholm etal. 2004a), measures for controlling trachoma(Baltussen et al. 2005), and interventions target-ing breast cancer (Groot et al. 2006).
The subregional studies of the WHO-CHOICE pro-gramme use international dollars as cost units.Therefore, cost-effectiveness estimates are meas-ured in terms of international dollars per DALYsaved. The international dollar is a hypotheticalcurrency given the same buying power that a USdollar would have in the United States at a givenpoint in time. Conversion of the local currency tointernational dollars is not done according to tradi-tional currency exchange rules, but rather accord-ing to the purchasing power parity criterion intro-duced in the 1990s by the International MonetaryFund. It allows one to realistically compare livingstandards in different countries, taking into accountprice variations, and is insensitive to the “monetaryillusion” caused by possible appreciations or de-valuations of the local currency. Obviously, the useof the international dollar seeks to streamline costcomparisons between the different regions.
In short, the WHO-CHOICE programme has alreadyapplied generalised cost-effectiveness studies inthe 14 worldwide subregions it established, and hasalready generated a substantial amount of signifi-cant information for a wide number of diseases andrisk factors (World Health Organization 2002). Theresults have made it possible to establish compari-sons between the different subregions, but this doesnot mean that their conclusions are easily export-able for application in health-related policies anddecisions at the national level. Moreover, imple-menting detailed studies focusing on specific coun-tries is unfeasible. The need to find methods foradapting the available information to more specificenvironmental, political, economic and social con-texts seems inevitable (Paalman et al. 1998). TheWHO-CHOICE programme has proposed the use ofpopulation and disease models that can be adaptedto the specific scenario of each country. The soft-ware tools mentioned earlier were designed takinginto account the possibility of applying nationaldata (economic, population, epidemiological, etc.)and thus obtaining specific results that would help

28
REDUCING THE BURDEN OF MENTAL ILLNESS IN SPAIN
local health authorities in their decision-makingtasks. The methodology seeking to transfer the re-sults of cost-effectiveness studies obtained in moregeneral studies to the national level would be struc-tured into a series of phases. The proposed stepsare summarised as follows:
1) Election of interventions. This includes the de-scription of the interventions (attending not onlyto technical or clinical characteristics, but alsoto organizational aspects) and their possiblegrouping into combinations.
2) Contextualization of the effectiveness of interven-tions. In order to adequately estimate the DALYssaved at the national level, it is necessary to havea number of readily available key parameters:demographic structure of the population, epide-miological figures (incidence, prevalence, casefatality, mortality) and health status assessmentsrelating to the disease under consideration.Moreover, the efficacy of the intervention wouldbe measured according to coverage and adher-ence levels associated with each intervention.
3) Contextualization of intervention costs. It wouldbe advisable to have information available re-garding the national costs for each individualcountry. Contrary to the use of the internationaldollar in the regional studies, the unit of meas-ure to be used in studies at the national levelshould be the local currency, which would makeit easier to obtain information and for the hypo-thetical decision-making authority to betterassess the results. For those cases where nolocal information on unit costs exists, the WHO-CHOICE programme proposes its own estimationmethodology based on data culled from more gen-eral contexts (Adam, Evans and Murray 2003).
4) Contextualization for different specific scenariosat the national level. WHO-CHOICE proposes theimplementation of three different options:
a) To assume that the different interventions areapplied in a technically efficient manner.
b) To assume that there are certain local restric-tions preventing a completely efficient imple-mentation (e.g., if a shortfall in healthcarestaff is assumed).
c) To assume that the interventions are carriedout at the current level of resource use andthat there are local limitations in terms of theavailability of infrastructure.
It is necessary to consider that the determinationof the most cost-effective interventions in no waymarks the end of the decision-making process;rather, it constitutes a key input—but not the soleone—in any task involving the setting of priorities(Hutubessy, Chisholm and Edejer 2003). As men-tioned earlier, a wide range of values—political,ethical, and social—comes into play in decisionsof such import. For instance, in many places theconcern for reducing inequalities in access to medi-cal services is an overriding one compared to theobjective of a more efficient distribution of re-sources, so in such cases the alternatives that willmost benefit an underprivileged populace will takeprecedence over all others.
Indeed, the ability to transfer information from aglobal or regional level to specific population-basedcontexts has made it possible to extend cost-effec-tiveness studies to developing countries, overcom-ing the traditional drawback of a lack of availableinformation.
The objectives of the WHO-CHOICE programme areperfectly aligned with the United Nations Millen-nium Declaration of September 2000 (United Na-tions 2000), which, among other points, recognisedthe need to fight against the main causes of dis-ease in poor countries: poor childbirth and perinatalconditions, childhood diseases, and communicablediseases. The WHO-CHOICE methodology is a valu-able decision-making aid in the health field, mak-ing it possible to use resources in developing coun-tries more efficiently, making comparisons possiblebetween different individual interventions andgroups of interventions, and permitting the extrapo-lation of regional or population-based data for caseswhere more specific information is not available(Evans et al. 2005a; Evans et al. 2005b; Evans etal. 2005c). Recent years have seen the publicationof studies that, adopting the WHO-CHOICE meth-odology, have analysed the main strategies forachieving the Millennium Declaration’s goalsfor developing countries: promoting children’shealth (Edejer et al. 2005), guaranteeing maternaland perinatal health (Adam et al. 2005), reducinginfant mortality (Darmstadt et al. 2005), andfighting specific diseases—HIV/AIDS (Hogan etal. 2005), tuberculosis (Baltussen, Floyd andDye 2005) and malaria (Morel, Lauer and Evans2005).
29
INTRODUCTION
More recently, the work of the WHO-CHOICE pro-gramme has focused essentially on obtaining resultsat the national level and applying them to establishhealth policies based on them.
APPLICATION OF WHO-CHOICEIN MENTAL HEALTH
Given the growing consensus attributing a large pro-portion of the Global Burden of Disease (GBD) tomental disorders (World Health Organization 2001),it is small wonder that mental health is one of theareas where the WHO-CHOICE programme has de-veloped greater research activity. Three basic crite-ria have guided the selection of disorders to be ana-lysed (Chisholm 2005a):
• Public health burden and importance of disor-ders.
• Availability of efficient and potentially cost-ef-fective interventions.
• Availability of data on epidemiology, clinical ef-fectiveness, use of resources and costs.
In keeping with the first guideline, schizophrenia,bipolar disorder, depression (unipolar) and obses-sive-compulsive disorder (OCD) should be consid-ered pathologies of choice, since all of them areamong the top ten in the list of causes of disabilitythroughout the world (World Health Organization2001). A set of specific interventions (includingdrug as well as psychosocial treatment) was definedfor each of these disorders, and their efficacy wasestimated by means of reviewing the available lit-erature. Sufficiently robust tests were found to de-termine the effectiveness of treatments associatedwith three of the pathologies in question, but notfor OCD, so it was replaced by panic disorder as aprototypical example representing anxiety disorders.The results of the global cost-effectiveness analy-sis of these pathologies show, among other conclu-sions, the following:
1) The most effective interventions for treating com-mon mental disorders (depression and panic) canbe considered highly cost-effective (in accord-ance with the aforementioned criterion by theWHO Commission on Macroeconomics andHealth, i.e., the cost per DALY saved is lower
than the annual per capita income of the regionunder consideration).
2) Community-based interventions for more severemental disorders (typical antipsychotics andmood stabilisers for schizophrenia and bipolardisorder) meet the cost-effectiveness criterion(cost per DALY saved lower than three times theannual per capita income).
Analyses dedicated to depression and bipolar dis-order have been published in independent articles.With regard to depression (Chisholm et al. 2004b),the considered treatment alternatives—old antide-pressants (tricyclic), new antidepressants (selectiveserotonin reuptake inhibitors), short-term psycho-therapy, old antidepressants plus short-term psy-chotherapy, new antidepressants plus short-termpsychotherapy, proactive care combined with oldantidepressants, proactive care and new antidepres-sants—all gave signs of clear potential for reducingthe world burden associated with the disorder (spe-cifically, by 10–30 %). It was estimated that thestrategies involving the use of tricyclics (with orwithout proactive care) were more cost-effectivethan those based on the administration of selectiveserotonin reuptake inhibitors, especially in devel-oping regions. Effective interventions in primarycare were “highly cost-effective” according to theWHO’s criterion, underscoring the priority nature ofsuch interventions when addressing depression(Ayuso-Mateos 2004). As a fundamental conclusion,the need to increase the coverage of interventionsas a priority measure to reduce the world burden ofdepression was indicated. As for bipolar disorder(Chisholm et al. 2005), the results point to treat-ment with lithium and psychosocial care as the mostcost-effective of the alternatives under study(lithium, valproic acid, lithium plus psychosocialtreatment, valproic acid plus psychosocial treat-ment; all of these considered within a communitytreatment model as well as within a model basedonly on hospital services). The community interven-tions showed more effectiveness than those basedon hospital services, moving within the range thatruns from “cost-effective” to “highly cost-effective”according to the WHO criterion. Finally, in the caseof schizophrenia, the WHO-CHOICE programme con-sidered four interventions: traditional antipsychot-ics (neuroleptics), new antipsychotics (atypical), tra-ditional antipsychotics with psychosocial treatment,and new antipsychotics with psychosocial treatment.

30
REDUCING THE BURDEN OF MENTAL ILLNESS IN SPAIN
The work of the WHO-CHOICE programme has alsobeen extended to the neurological field, includingboth the analysis of specific pathologies—epilepsy(Chisholm 2005b)—and the use of resources (Ferriet al. 2004), in both cases for developing coun-tries. Compared with the results obtained for othermental disorders, the results for schizophrenia arecharacterised by the modest effectiveness of avail-able treatments, even assuming a high coverage.The most cost-effective intervention would be thatwhich involves the administration of typical anti-psychotropic drugs plus the application of a psy-chosocial treatment. The high price of atypicaldrugs would account for their lower cost-effective-ness, making their application in developing coun-tries, for instance, questionable. However, the ap-pearance of generic drugs could considerably alterthis perspective (Chisholm 2005a). A recent studythat applies the WHO-CHOICE methodology specifi-cally to analyse the treatment of schizophrenia inthe developing world (both at the inter-regional andmultinational level) repeats these conclusions(Chisholm et al. 2006).
These results provide new and significant informa-tion for preparing health policies and can guide thefirst steps to allocating resources more efficiently,thus reducing the burden associated with mentaldisorders. However, once again, it is important tonote that the results obtained for regions definedwith a high degree of aggregation do not guaranteethat the possible guidelines resulting from themcan be put into practice at the national level.Therefore, it is necessary to propose attempts atcontextualising the estimates for large regions atthe national level, since many of the factors deter-mining the results of a cost-effectiveness analysiscan vary considerably from one local scenario to
another (epidemiological data, potential effectivepopulation coverage level, availability of resources,local prices, etc.). The change in the level of analy-sis would impose minor methodological variationswith regard to the study’s approach. For instance,costs calculated by the WHO-CHOICE programmeat the level of world regions are expressed in in-ternational dollars, because this makes it possibleto compare different areas. However, in an analy-sis at the national level, it would be more appro-priate to express costs according to the localcurrency.
Several papers have been published regarding thecost of mental disorders in Spain (Haro et al. 1998;Salvador-Carulla et al. 1999), but these were lim-ited to collecting information about healthcare out-lays resulting from current care levels for thesepathologies in our setting, with the healthcare cov-erage currently in existence. No impact or cost-ef-fectiveness study of a broad number of interven-tions in mental health in our setting has beenperformed to date.
We propose a comparative cost-effectiveness analy-sis of mental health interventions in Spain focus-ing on two pathologies, depression and schizophre-nia, for the following reasons: importance from apublic health perspective, due to their being preva-lent pathologies that are responsible for a signifi-cant percentage of the global burden of disease inEurope-wide estimates (World Health Organization2001; Ayuso-Mateos 2002); the availability of ef-fective and potentially cost-effective interventionsthat can be applied in a generalised way in ourcountry; and, finally, the availability of data on epi-demiology, clinical effectiveness of the interven-tions, use of services, and their cost in Spain.
PART 1
Comparative Analysisat the Population Levelof the Cost-Effectivenessof Therapeutic Interventionsin Depression


33
1Introduction to Part 1
1.1 DEPRESSION IN GLOBAL BURDENOF DISEASE STUDIES
The findings of the first study on the Global Bur-den of Disease (GBD) (Murray and Lopez 1996),published in 1991, were conducted at the HarvardSchool of Public Health and funded by the WorldBank and the World Health Organization (WHO).This study provided a set of summarised indicatorsand measures that assessed the fatal and disablingconsequences of diseases and injuries in the dif-ferent regions of the world. To ensure the rational-ity of epidemiological estimates, the GBD studydeveloped internally consistent calculations for dataon incidence, prevalence, duration and lethalityused to assess 107 health problems, and 483 in-capacitating consequences associated with them.As a result, a broad and consistent series of mor-tality and morbidity estimates by age, gender andregion were generated, which in turn served to in-troduce and calculate a new way of measuring theburden of disease: Disability-Adjusted Life Years(DALYs). The use of DALYs makes it possible tocombine, in a single indicator, the Years of Life Lost(YLLs) due to premature death and the Years of LifeLost due to Disability (YLDs), weighted accordingto severity. This was without a doubt one of the mostsalient findings of the study, as the assessment ofdisability together with mortality made it possibleto include mental disorders, which are highly inca-pacitating but rarely mortal, among the majorcauses of the burden of disease in the world. TheGBD study thus revealed the true magnitude of theimpact of mental health problems, which had tra-ditionally been underestimated. When disability isincluded in the assessment of the consequences of
diseases, mental disorders become as important ascardiovascular or respiratory diseases, and moreimportant than malignant tumours or HIV. The GBDstudy showed that unipolar depression causes a tre-mendous burden of disease, to such a degree thatit ranks fourth worldwide, accounting for 3.7% oftotal DALYs and 10.7% of total YLDs. Projectionsby the WHO within the GBD study to 2020 indi-cate that the relative importance of mental diseasewill reach 15% of the total, due primarily to greaterlife expectancy of the population and a lowering ofthe burden attributable to infectious diseases.Hence, by 2020 depression will be second only toischemic cardiopathy as a major cause of DALYsworldwide (Murray and Lopez 1997).
The WHO has conducted a new GBD study, thistime for the year 2000 (GBD 2000), including thesame goals as the first study and a review of theoriginal methodology (Mathers et al. 2002). TheGBD 2000 working group identified the need torevise and update the epidemiological prevalenceand incidence estimates used to calculate theDALYs. A decade after the first GBD study (WorldHealth Organization 2001; World Health Organiza-tion 2002), depressive disorders continue to be oneof the main causes of DALYs throughout the world.Globally, they account for 4.46% of total DALYs and12.1% of YLDs. Perinatal diseases, lower respira-tory tract infections, AIDS and HIV, and unipolardepression constitute the four main causes ofDALYs for both sexes combined. A gender differ-ence exists in depression, which is the fourth-ranked cause of DALYs in women and the seventh-ranked among men (5.6% versus 3.4% of totalDALYs, respectively) (Ustun et al. 2004). There arealso marked differences in epidemiological patterns

34
REDUCING THE BURDEN OF MENTAL ILLNESS IN SPAIN
between the world’s rich and poor regions. In de-veloped countries, the proportion of the burden ofdisease due to sexually transmitted, maternal,perinatal and nutritional diseases hovers around5%, while in Africa it ranges from 70% to 75%.Depression contributed 1.2% to the total burdenof disease in Africa, while accounting for 8% of theGBD in the Americas. Globally, the burden of dis-ease in high per capita income countries reached8.9%, while it reached only 4.1% of total DALYs inlow and medium per capita income countries.
1.2 DEPRESSION IN SPAIN
Depression is also the most prevalent mental disor-der in Spain, although European comparative stud-ies reflect lower rates of depression among the gen-eral population than in other European countries(Ayuso-Mateos et al. 2001). In recent years, severalepidemiological studies using comparable method-ologies and diagnostic criteria to those applied inthe most salient international studies have beencompleted in our country. It is estimated that 5%to 10% of the population suffers from a depressiveepisode over the course of their lives.
The degree of clinical severity is lower in patientswith depression as measured against the generalpopulation than among those in contact withhealthcare resources. However, depression is asso-ciated with significantly lower levels of perceivedhealth among the general population (Ayuso-Mateoset al. 1999). Mortality rates due to depression ob-tained from death certificates are very low, with anannual average risk estimated at 3 per 1,000(Harris and Barraclough 1998), although death bysuicide can affect up to 15% of people sufferingfrom depression (World Health Organization 2002).Nevertheless, studies in which verbal autopsies (in-terviews with relatives and primary care physiciansof the deceased) are performed reveal that depres-sion is the main background factor in 30%-45% ofsuccessful suicides. As a result, a large part ofdeaths by suicide should be counted as attribut-able to depression. In Spain, depression is beingincreasingly recognised as a cause of death.
In addition to bearing a significant social burdenstemming both from the suffering of patients and
relatives and from the premature deaths by suicide,depressive disorders also have a high social impact,due to the costs associated with their morbidity andcare. The total cost of depression in Spain variesdepending on the source, but some papers have setthe figure at 745 million euros per year (Ofisalud1998), 535 million of which are accounted for bydirect costs arising from patient management andtreatment, and the rest is attributed to loss of pro-ductivity generated by the attending temporary jobdisability. Only 15.9% of the direct costs are as-cribable to drug treatment (Alonso et al. 1997),with the biggest direct cost component being thatlinked to outpatient care and monitoring. Hospitali-zation due to depression also accounts for a rela-tively small percentage of expenses stemming fromthe disorder (15.9%).
1.3 COMPARATIVE COST-EFFECTIVENESSANALYSIS OF INTERVENTIONSFOR DEPRESSION
As mentioned in the introduction, the WHO-CHOICE(CHOosing Interventions that are Cost-Effective)project is a WHO initiative developed in 1998 toprovide evidence helping health policy-makers todecide which interventions and programmes to im-plement in order to achieve the best possible effec-tiveness with the available resources. The specificobjectives of the WHO-CHOICE programme includedeveloping a standardised method of cost-effective-ness analysis that can be applied to different inter-ventions in different scenarios, and developing therequired tools to assess the costs and the impact ofthe interventions on the population.
Public health systems have multiple objectives, butthe fundamental reason for their existence is doubt-less to improve the health of the population. How-ever, such an improvement cannot be viewed as alinear function of expenses allocated to achievingit, as healthcare systems with similar per capitalcost levels exhibit dramatic variations in results.Some of the differences can be due to factors thatare unrelated to the health sphere, such as the edu-cational level of the population. But others couldbe explained by an inefficient allocation of re-sources (devoting excessive resources to expensiveinterventions with small effects on the population,

35
INTRODUCTION TO PART 1
not implementing enough low-cost interventionsthat would potentially generate more benefits).
Cost-Effectiveness Analysis (CEA), as mentioned inthe introduction, constitutes a tool that healthcaresystem decision-makers can use to assess and im-prove performance. It indicates which interventionsmake the most of the investments made and helpschoose the programmes that maximise health inkeeping with the available resources.
Cost-effectiveness analyses constitute the basis ofthe WHO-CHOICE programme. Its specific method-ology makes it possible to compare existing inter-ventions and new interventions at the same time.Until it was developed, cost-effectiveness analyseshad been basically limited to assessing the efficacyof a single intervention added to the currently ex-isting scenario, or with a view to replacing an exist-ing intervention with another alternative. Thanks tothe methodology provided by the WHO-CHOICE pro-gramme, analysts are no longer constrained by theimplemented scenario of interventions that havealready been applied. The WHO-CHOICE method-ology makes it possible to compare currently exist-ing interventions as well as interventions whoseimplementation is still being considered. Decision-makers can even revise choices made in the past ifnecessary, obtaining rational criteria enabling themto distribute resources among the various optionsand thus achieve the proposed objectives.
When applying this methodology to the analysis ofmental health interventions in Spain, we initiallyintended to conduct work on depression for the fol-lowing reasons, which have already been mentioned
in the introduction: importance from a public healthperspective due to it being a prevalent pathologywhich is responsible for a significant percentage ofthe GBD in Europe-wide estimates (World HealthOrganization 2001; Ayuso-Mateos 2002; Ustun etal. 2004); the availability of effective and poten-tially cost-effective interventions that can be ap-plied in a generalised way in our country; and, fi-nally, the availability of data on epidemiology,clinical effectiveness of the interventions, use ofservices, and their cost in Spain. Epidemiologicaldata on depressive disorders were available throughrecent studies conducted by members of the re-search team. There is evidence of the effectivenessof drug, psychological and health-care organiza-tional interventions applicable to our current health-care system (Dowrick et al. 2000; Serrano-Blancoet al. 2006).
1.4 DIFFERENTIATED OBJECTIVES
This research set for itself the following differenti-ated objectives:
• Quantification of DALYs associated with depres-sive disorders in Spain in the year 2000.
• Comparative study of the cost-effectiveness ofdifferent interventions aimed at managing de-pressive disorders in our setting.
• Application to our health system of the newmethodology developed by the World Health Or-ganization within the WHO-CHOICE project toanalyse the impact of therapeutic interventionsat the population level.

37
2Research Methodology
2.1 POPULATION
The study was carried out taking the Spanish popu-lation in the year 2000 as a benchmark. The de-mographic data needed for our research (the gen-eral population in Spain in the year 2000 and itsdistribution by gender and age groups) were ob-tained from census figures drawn up by the Na-tional Statistics Institute (INE). These census fig-ures are publicly accessible and can be consultedat the INE’s website (www.ine.es). In addition, theepidemiological studies that will be used to obtainprevalence and incidence parameters were carriedout around the same date.
2.2 METHODOLOGY FOR ESTIMATINGTHE BURDEN OF DISEASE
Different types of measures were proposed to as-sess the estimated burden of a disease in a popula-tion. In our study we will use DALYs, whose calcu-lation method is described below. This methodologyis common to any type of pathology, so its validityalso extends to analyses focusing on schizophrenia,which makes up the second part of this report.
DISABILITY-ADJUSTED LIFE YEARS (DALYS)
The number of DALYs associated with a given dis-ease is calculated as the sum of the life years lostdue to premature death (YLLs) and the life yearslost due to disability (YLDs).
DALYs = YLLs + YLDs
YEARS OF LIFE LOST DUE TO PREMATURE DEATH
(YLLS)
The Years of Life Lost (YLL) concept reflects thedifference between the age of death and an agelimit (established according to the life expectancyat the age of death, which can be obtained bymeans of standard low-mortality life charts) for eachdeath attributable to the disease being considered.In burden of disease studies, the sum of the YLLscorresponding to the deaths attributable to the dis-ease being considered within a given period of timewould determine the premature mortality associatedwith the disease.
The years of life lost due to premature death areestimated according to the following formula:
Years of Life Lost (YLL) = ∑ dx ex
where: ex = standard life expectancy for each age,dx = number of deaths at each age, l = last agegroup.
Therefore, the variables needed to calculate theYLLs would be as follows:
• Mortality of the Spanish population during therelevant year, broken down according to causeof death and to age groups and gender.
• Life expectancy at each age and for each gen-der, using the West level 26 standard low-mor-tality life table for women (with a life expectancyat birth of 82.5 years) and the West level 25standard low-mortality life table for men (with alife expectancy at birth of 80 years).
x = l
x = 0

38
REDUCING THE BURDEN OF MENTAL ILLNESS IN SPAIN
YEARS OF LIFE LOST DUE TO DISABILITY (YLDS)
The consequences of living in conditions below thatof a perfect state of health are assessed accordingto the time spent in each state and its severity.Without applying discount rates or weighing byage, the value of each year of life lost due to dis-ability would be calculated applying the followingformula:
AVD = (YLL) = ∑ Ni × Ii × Ti × D
where: Ni = population in each age group, Ii = inci-dence at each age group, Ti = average duration ofdisease at each age, D = level of disability (0 = per-fect health; 1 = death).
To calculate the Years of Life Lost due to Disability(YLDs), the following variables are required:
• Incidence, by age groups and gender, of the dif-ferent diseases and injuries.
• Average duration of each of the diseases for thedifferent age groups and genders.
• Average age of onset of each disease for eachage group and gender.
• Severity of the disability on a scale of 0 (perfecthealth) to 1 (death).
MATHEMATICAL CALCULATION OF DALYS
The calculation of the DALYs regularly includes twotypes of social assessments:
1) Weight by ages. The value of each year of lifelost can be weighted by a factor expressing therelative importance that is socially accorded tothe different ages. A year lost during youth isnot assessed the same as a year lost in old age.The formula proposed by the WHO to calculatethese weights is as follows:
Weight = Cxe–βx
where: x = age for each year of life lost, C = 0.1658,β = 0.04.
This function can be adjusted by introducing a con-stant to change the weighting by age (K ):
Weight = KCxe–βx + (1 – K)
If = 0 each year of life lost has the same value, andif = 1 the value of each year increases from birth(value = 0) up to a maximum at age 25, and thengradually declines at more advanced ages.
2) Time discount. Represents the relative value forindividuals of a gain in health today comparedto a gain in health in the future. The discountpercentage applied in the DALY formula is 3%.Each year lost would be assessed according tothe following continuous discount formula:
Discount function = e–r (x–a)
where: r = discount rate, set at 0.03; x = age; a =year of onset of disability.
FORMULAS FOR CALCULATING DALYS
As mentioned before, DALYs are the sum of Yearsof Life Lost (YLLs) and Years of Life Lost due toDisability (YLDs):
DALYs = YLLs + YLDs
YLLs due to premature death are estimated accord-ing to the following formula:
YLL = e –(r +β)(L+a) [–(r +β)(L+a) – 1]
– e –(r +β)a [–(r +β)a –1] + (1 – e –rL)
where: K = 1, C = 0.1658, r = 0.03, a = age ofdeath (modified West 26 table), b = 0.04, L = lifeexpectancy at age of death (modified West 26 ta-ble).
YLDs are estimated according to the following for-mula:
YLD = D e –(r +β)(L+a) [–(r +β)(L+a) – 1]
– e –(r +β)a [–(r +β)a –1] + (1 – e –rL)
where: D = weighted value of the disability (between0 and 1), K = 1, C = 0.1658, r = 0.03, a = age atonset of disability (modified West 26 table), β =0.04, L = duration of disability.
1
0
] }1 – Kr
{ [KCe ra
(r +β)2
[KCe ra
(r +β)2
] 1 – Kr
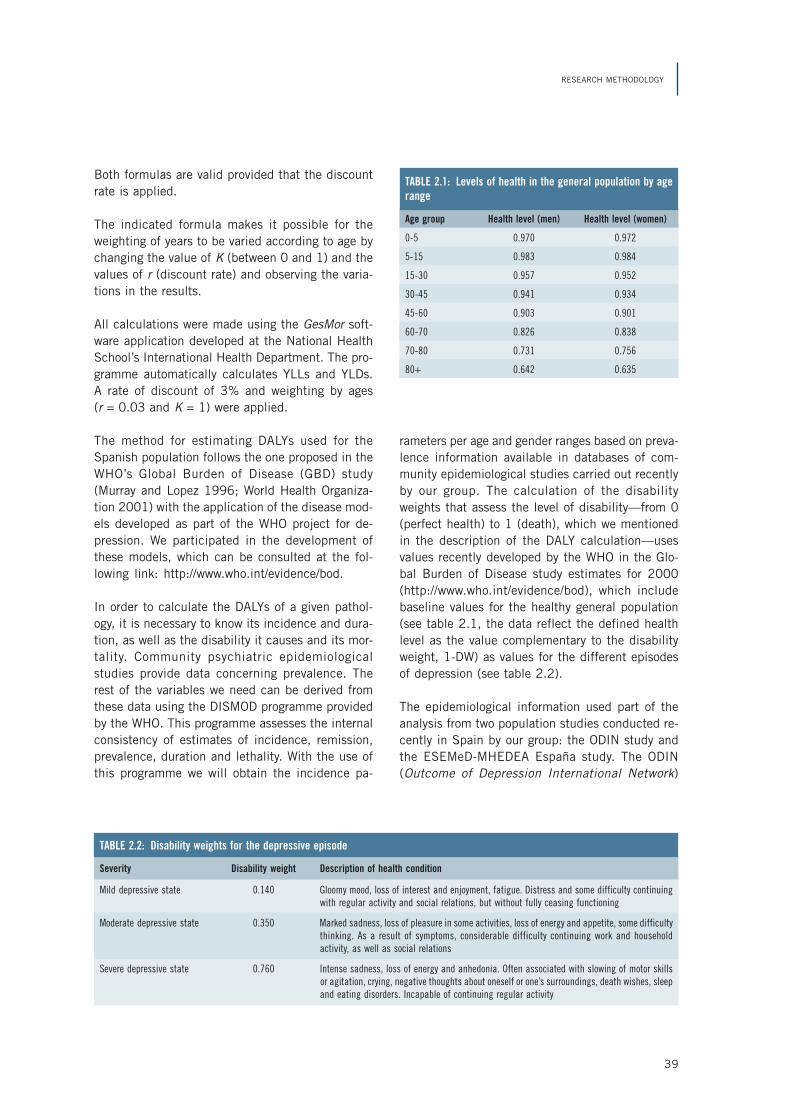
39
RESEARCH METHODOLOGY
Both formulas are valid provided that the discountrate is applied.
The indicated formula makes it possible for theweighting of years to be varied according to age bychanging the value of K (between 0 and 1) and thevalues of r (discount rate) and observing the varia-tions in the results.
All calculations were made using the GesMor soft-ware application developed at the National HealthSchool’s International Health Department. The pro-gramme automatically calculates YLLs and YLDs.A rate of discount of 3% and weighting by ages(r = 0.03 and K = 1) were applied.
The method for estimating DALYs used for theSpanish population follows the one proposed in theWHO’s Global Burden of Disease (GBD) study(Murray and Lopez 1996; World Health Organiza-tion 2001) with the application of the disease mod-els developed as part of the WHO project for de-pression. We participated in the development ofthese models, which can be consulted at the fol-lowing link: http://www.who.int/evidence/bod.
In order to calculate the DALYs of a given pathol-ogy, it is necessary to know its incidence and dura-tion, as well as the disability it causes and its mor-tality. Community psychiatric epidemiologicalstudies provide data concerning prevalence. Therest of the variables we need can be derived fromthese data using the DISMOD programme providedby the WHO. This programme assesses the internalconsistency of estimates of incidence, remission,prevalence, duration and lethality. With the use ofthis programme we will obtain the incidence pa-
rameters per age and gender ranges based on preva-lence information available in databases of com-munity epidemiological studies carried out recentlyby our group. The calculation of the disabilityweights that assess the level of disability—from 0(perfect health) to 1 (death), which we mentionedin the description of the DALY calculation—usesvalues recently developed by the WHO in the Glo-bal Burden of Disease study estimates for 2000(http://www.who.int/evidence/bod), which includebaseline values for the healthy general population(see table 2.1, the data reflect the defined healthlevel as the value complementary to the disabilityweight, 1-DW) as values for the different episodesof depression (see table 2.2).
The epidemiological information used part of theanalysis from two population studies conducted re-cently in Spain by our group: the ODIN study andthe ESEMeD-MHEDEA España study. The ODIN(Outcome of Depression International Network)
Age group Health level (men) Health level (women)
0-5 0.970 0.972
5-15 0.983 0.984
15-30 0.957 0.952
30-45 0.941 0.934
45-60 0.903 0.901
60-70 0.826 0.838
70-80 0.731 0.756
80+ 0.642 0.635
TABLE 2.1: Levels of health in the general population by agerange
TABLE 2.2: Disability weights for the depressive episode
Severity Disability weight Description of health condition
Mild depressive state 0.140 Gloomy mood, loss of interest and enjoyment, fatigue. Distress and some difficulty continuingwith regular activity and social relations, but without fully ceasing functioning
Moderate depressive state 0.350 Marked sadness, loss of pleasure in some activities, loss of energy and appetite, some difficultythinking. As a result of symptoms, considerable difficulty continuing work and householdactivity, as well as social relations
Severe depressive state 0.760 Intense sadness, loss of energy and anhedonia. Often associated with slowing of motor skillsor agitation, crying, negative thoughts about oneself or one’s surroundings, death wishes, sleepand eating disorders. Incapable of continuing regular activity
40
REDUCING THE BURDEN OF MENTAL ILLNESS IN SPAIN
study, conducted with the participation of five Eu-ropean academic institutions and funded by theEuropean Union under its 1995 BIOMED-2 pro-gramme (PL 951681), sought to provide reliableand valid data on the epidemiology and assessmentof depressive disease (in the rural and urban set-ting) through a representative epidemiological sam-ple, and to assess the impact on the evolution ofdepression of an approach with a low-cost preven-tive intervention focusing on the individual. InSpain, the epidemiological study was carried out inthe northern city of Santander. The prevalence datahave already been published (Ayuso-Mateos et al.2001). In addition to information about the preva-lence of depressive disorders in the general popu-lation, the database provides data on the level ofclinical severity and healthcare coverage of subjectswith depression in the general population.
ESEMeD-MHEDEA España is an epidemiologicalstudy on mental disorders in Spain, and it is inte-grated into the WHO’s World Mental Health SurveyInitiative. In the study, a representative sample ofthe non-institutionalised Spanish population wasinterviewed. The project’s objectives were:
1) To assess and quantify the prevalence of the dif-ferent psychiatric disorders in the Spanish gen-eral population and associated risk factors.
2) To assess the QoL, disabilities and handicaps ofpeople suffering from these disorders.
3) To assess healthcare needs and the use of serv-ices and treatment received by people with psy-chiatric disorders.
A total of 5,500 personal interviews were conductedwith a representative sample of the non-institution-alised Spanish population aged 18-64, obtainedthrough a multistage stratified design. The individu-als were interviewed using Spanish-language ver-sions of various tools (CIDI, WHO-DAS II, EuroQol-5D and SF-36) plus a general questionnaire onsocio-demographic variables. A trained clinician re-interviewed a sample of some 200 individuals out ofthe above population using the SCID questionnaire.
The DALYs for the Spanish population can be gen-erated based on incidence, duration and disabilityestimates with the use of the GesMor software ap-plication developed by the Carlos III Health Insti-tute’s International Health Department.
2.3 COST-EFFECTIVENESS ANALYSISMETHODOLOGY, MEASURED IN DALYS,OF DEPRESSION INTERVENTIONSIN SPAIN
2.3.1 SELECTED INTERVENTIONSFOR THE COST-EFFECTIVENESS STUDY
We assessed the expected impact at the populationlevel of several interventions (individual or com-bined) that can be implemented in our healthcaresystem to improve depressive disorders. Informa-tion about their efficacy in controlled clinical trialsis available for all of them. The impact at the popu-lation level of seven interventions to be developedin the primary care field was assessed:
1) Tricyclic antidepressants (imipramine).2) SSRIs (fluoxetine).3) Psychotherapy: short-term cognitive therapy, in-
terpersonal therapy for depression, problem-solv-ing therapy.
4) TCAs + psychotherapy.5) SSRIs + psychotherapy.6) Proactive collaboration management with TCAs
(management protocol that includes diverse si-multaneous strategies with the goal of achievingadherence to protocols for treatment of depres-sion, patient education and increased primary-care medical support for the management ofthese conditions).
7) Proactive collaboration management with SSRIs.
2.3.2 IMPACT OF INTERVENTIONSAT THE POPULATION LEVEL
The impact of interventions in the Spanish popula-tion was assessed through the analysis of popula-tion models provided by the PopMod programme,which enables the development of a population tobe established taking into account births, mortalityand the disease being studied.
The programme model distinguishes between themale and female population and includes segmen-tation by age ranges of one year. According to thismodel, the susceptible population (i.e., individualsnot depressed at the moment being considered)produces new cases at an instantaneous transitionrate of i (incidence, including recurrence); individu-

41
RESEARCH METHODOLOGY
als suffering a depressive episode become suscep-tible again at a remission rate of r; depressive casesare subject to a specific instantaneous mortalityrate of f; both susceptible individuals and cases aresubject to a general mortality rate of m.
In addition, the model includes information on thedisability weights associated with each disease—on a scale of 0 to 1, where 1 equals a completestate of health and 0 equals death—for the timeelapsed both while in the depression and suscepti-ble states. The programme also makes it possibleto obtain models for a situation where no interven-tion for the disease is implemented and comparethe results with those of the alternative model gen-erated by the implementation of the proposed thera-peutic interventions among the study population ina 10-year period. The difference between the twomodels would represent the gain at the populationlevel linked to the intervention under study (meas-ured as a reduction of DALYs).
As their main therapeutic effect, the consideredinterventions cause a reduction in the depressiveepisode that can be likened to an increase in theremission rate (which, in turn, translates intochanges in the disability weights with respect to asituation of untreated depression). These changescan be modelled according to the methodology de-scribed by Andrews et al. (2000) which makes itpossible to transform the effect sizes estimated inclinical trials (standardised difference between theintervention group mean and the control groupmean) into changes in the disability weight. Esti-mates of the efficacy of different interventions wereobtained from data relating to the natural history ofthe disease (Ayuso-Mateos 2002) and from theanalysis of information available in the literatureregarding the effect of the different interventionson the duration of the depressive episode, remis-sion rates achieved with the treatment, and, for thecase of collaborative management strategies, theireffect on the incidence of successive depressiveepisodes (Simon, Katon and VonKorff 2001;Chisholm et al. 2004b).
2.3.3 ANALYSIS OF INTERVENTION COSTS
When considering costs, our study takes on the fin-ancier’s perspective, without considering costs as-sociated with the patient’s and his/her relatives’
perspective (e.g., lost production capacity). Thecost of interventions was established at the patientlevel and at the level of the programme implemen-tation cost. Costs at the programme level includecentral administration and training (2 or 3 dayswere estimated for training primary care physiciansand depression case handlers, while 10 days oftraining and 2 days of supervision were considerednecessary for psychosocial interventions) (Dowricket al. 2000). The use of services at the patient levelduring the 6-month treatment period was estimatedfor each of the clinical severity categories of de-pression based on service usage data in depressivepatients from the ESEMeD-MHEDEA Españaproject (Alonso et al. 2002) and on the opinion ofexperts from the research team. Depending on eachintervention model, the healthcare usage compo-nents included estimates of drug dosage and fre-quency (e.g., 20 mg of fluoxetine daily), the dura-tion of short-term psychotherapy (8 sessions), thenumber of contacts in collaborative case manage-ment (6 contacts); the number of primary care con-tacts (6 visits), the number of visits to outpatientmental health services (4-6 visits in 33% of cases)and psychiatric admissions (5% of moderate andsevere cases during one or two weeks).
We used the units of cost available for our healthcaresystem that were developed according to preliminarystudies by the PSICOST group, and which have al-ready been used previously by members of the re-search team in economic analyses of mental healthinterventions in Spain (Haro et al. 1998; Salvador-Carulla et al. 1999; Saldivia et al. 2005). The health-care costs used were not estimated on the basis ofprices, but rather on the basis of estimated actualcosts. The SOIKOS (Soikos 2001) unit cost databasewas used to determine the cost for the rest of thehealthcare services used. As for antidepressantmedication costs, the costs of the lowest-priced ge-neric presentation of the two agents included in ourstudy, imipramine and fluoxetine, were considered.
The average cost per episode was multiplied by theaverage number of episodes treated in the Spanishpopulation in the year 2000, considering a health-care coverage of 50%. The healthcare coverage ofthe Spanish population suffering from depressionwas obtained from analysing the ESEMeD-MHEDEAEspaña study. Thus, a total healthcare cost for de-pression over a year of implementation was calcu-

42
REDUCING THE BURDEN OF MENTAL ILLNESS IN SPAIN
lated. A 3% discount was applied to all the base-line analyses during the 10-year implementationperiod considered in our model. The final economicvalues were expressed in euros.
2.3.4 SENSITIVITY AND UNCERTAINTYANALYSES
Cost-effectiveness analyses rely on a large amountof data input from various sources. In many cases,it is complicated to perform an adequate samplingto calculate costs or estimate the associated effec-tiveness. One way of ensuring more robust resultsfrom such analyses consists of assuming a certainvariability of the input and verifying to what extentthis affects the final estimated cost-effectivenessvalues. Therefore, the best-suited approach would beto replace the estimates for certain parameters(costs, efficacy measures, etc.) with a range of values.
Two possible strategies can be used to this end. Thefirst, traditionally known as sensitivity analysis, con-sists of replacing the specific initially consideredestimate with various deterministic values estab-lished by the researchers.
However, the methodology associated with any sen-sitivity analysis presents certain constraints thatshould be considered. Firstly, it is the researcher’sresponsibility to decide which alternative values areassigned to the selected variables to which theanalysis is going to be applied. Secondly, the inter-pretation of the results is necessarily arbitrary, asthere are no established guidelines or standardsdetermining under what conditions the analysis canbe considered to be robust. Finally, varying differ-ent parameters separately presents the drawbackof overlooking the possible effects of interaction.
A second type of methodology, the uncertaintyanalysis, which is probabilistic rather than deter-ministic, was applied to avoid these constraints. Itconsists of assuming that the values assigned tothe parameters whose influence in the final resultswe seek to determine are but momentary “walks”of a random distribution. Monte Carlo simulationswere used in our research to carry out the uncer-tainty analysis of the results, and we assumed acost and effectiveness behaviour according to ran-dom distributions, of which a high number of mo-mentary “walks” were taken so as to obtain a dis-
tribution (in the form of a cluster of points that canbe graphically depicted) of the final values of thecost-effectiveness ratios associated with each of theinterventions.
However, these results are not without difficultiesin interpretation. The results of the uncertaintyanalysis can be depicted in the form of point clus-ters, and it is simple to order the final cost-effec-tiveness results according to the position of theseclusters if they do not overlap. However, there is norecommended interpretation when different clus-ters overlap.
It would be desirable for uncertainty analyses toprovide results in the form of classification tableswhere the different interventions appear orderedaccording to cost-effectiveness ratios associatedwith each of them. In a deterministic analysis, it isassumed that decision-makers will begin by con-sidering the first intervention on the list (the mostcost-effective) and then go down the list until theystop when the funds are depleted. Adding an ele-ment of uncertainty to such an analysis allows for amore realistic approach by considering intervals ofpossible cost-effectiveness ratio values, but diffi-culties would appear when determining the order-ing of interventions when the different intervalsoverlap. It would simply be assumed that a deci-sion over which alternative would be the most effi-cient cannot not be reached.
To overcome these difficulties, a different uncer-tainty analysis method was proposed. This methodshows the information to decision-makers in theform of “stochastic league tables”. The idea is topresent the probability with which each of the al-ternatives would be included in the optimal distri-bution of interventions for different levels of avail-able resources, taking into account the uncertaintyassociated with costs and measures of efficacy. Theconstruction of stochastic league tables requiresfour steps.
1) In the first place, the use of Monte Carlosimulations to provide “random walks” for costand efficacy values. This first step would be com-mon with the probabilistic uncertainty analysisdescribed above.
2) In the second place, the determination of theoptimum assignment of interventions for differ-

43
RESEARCH METHODOLOGY
ent levels of resource availability following theprocedure for choosing between independentand mutually exclusive alternatives described byMurray et al. (2000). The most cost-effectiveintervention is assessed according to its averagecost-effectiveness ratio (as against not applyingany intervention), while the ratios of the othermutually exclusive alternatives are incrementallyassessed, comparing them to the most efficientintervention.
3) Thirdly, this process is repeated a high numberof times to obtain as many estimates of the opti-mum distribution in the way interventions areassigned. If P represents the number of timesan intervention has been included in the opti-mum distribution, P divided by the number ofsimulations will represent the probability that theintervention will be included in the optimum dis-tribution.
4) The fourth step involves repeating the previousprocess assuming different levels of resourceavailability, obtaining a distribution (or “expan-sion path” of resources) showing the probabilitythat each intervention is included in the opti-mum distribution for each resource availabilitylevel.
To perform this type of simulation, the WHO-CHOICE programme provides a tool, the MonteCarlo League (MC League) software application,which generates stochastic league tables. This ap-plication makes it possible to consider the exist-ence of covariance between the costs and resultsof the analysis, for which it simulates different val-ues (use of health services, proportion of individu-als using secondary services and treatment effec-tiveness—efficacy and adherence). MC Leagueprovides its output data in the form of stochasticdecision tables and graphs depicting the probabil-ity of inclusion of each of the mutually exclusivealternatives in the optimum distribution of interven-tions for the different resource availability levels.
2.3.5 CONSTRAINTS
Some of the estimations under this analysis have adegree of uncertainty inherent to the measure ofthe parameter in question. These include, for in-stance, epidemiological prevalence estimates, costunits (medication costs, number of visits in psy-chotherapeutic interventions, proportion of cases
using healthcare services not included in the inter-vention) and, finally, those linked to the effect ofthe intervention. In order to mitigate some of theseconstraints, an uncertainty analysis was conductedaccording to the methodology described in the pre-vious section.
In addition, to offset some of the constraints inher-ent to an analysis that quantifies efficacy by meansof a synthetic measure, the DALYs, which includeinformation about operation as well as about therelative mortality associated with the disorder, a sec-ond analysis in which efficacy was assessed by QoLunits (Quality-Adjusted Life Years, or QALYs) wasperformed, as described in the following section.
2.4 COST-EFFECTIVENESS ANALYSISMETHODOLOGY, MEASURED IN QALYS,OF DEPRESSION INTERVENTIONSIN SPAIN
In recent years, the clinical relevance of QoL meas-ures has been gaining recognition in the health re-search field. The improved QoL of patients ob-tained thanks to a reduction in clinical symptomsis starting to be taken into account in treating de-pression. With this in mind, our work includes asecond cost-effectiveness analysis of depressioninterventions in Spain in which the improved QoLof patients, assessed in QALYs, was chosen as ameasure of efficacy.
QALYs can be estimated using the scores obtainedwith the EQ-5D (EuroQol-5 Dimensions) tool(Williams 1990). The EQ-5D was designed to be ageneric, simple, self-administered tool with a lowcognitive burden for the individual and preference-based, whose purpose is to describe and assess QoLrelated to health, obtaining a descriptive health pro-file on one hand, and a general health index on theother. The questionnaire comprises four parts. Thefirst part contains a description by the patient ofhis/her own state of health using 5 dimensions (mo-bility, personal care, day-to-day activities, pain/dis-comfort, and anxiety/depression), with 3 levels ofseverity for each (1 = no problem, 2 = a few prob-lems, 3 = lots of problems). The individual mustmark the problem level for each dimension that bestdescribes his/her state of health at the moment. The

44
REDUCING THE BURDEN OF MENTAL ILLNESS IN SPAIN
state of health is determined by the combination ofthe degree of severity in each of its dimensions.This combination of 5 dimensions and 3 levels ofseverity gives rise to 243 different states of health.The second part consists of a vertical Visual Ana-logue Scale (VAS) measuring 20 cm, marked off bymillimetres, with two clearly defined end points: thebest state of health imaginable, with a point valueof 100, and the worst state of health imaginable,with a point value of 0. The individual is asked toassess his/her state of health on the day of assess-ment by drawing a line from the lowest point in thescale (0) to the point that, in his/her opinion, indi-cates how good his/her state of health is. The thirdpart of the questionnaire is designed to obtain in-dividual values that represent the preferences for,or usefulness of, the states of health of the descrip-tive system of the EQ-5D, in addition to the uncon-scious and death states that cannot be defined bythe descriptive system. The individual assessmentis presented on two consecutive pages, each ofwhich contains a VAS in its central portion witheight states of health described in boxes on bothsides of the scale. The interview subjects are askedto imagine that they find themselves at each stateof health, and to draw lines between the boxes con-taining the state of health and a value in the VAS,thus indicating their preference for each of thestates of health. Once the values are assigned tothe states of health on both pages, the interviewsubjects are asked to assign a value to death onthe same VAS on both pages. Based on the valuesobtained for the states of health in this exercise,and using regression models, an index value can beobtained for each of the 243 states of health in theEQ-5D. Finally, the fourth part contains informationabout the interview subject, including: age, gender,disease experience (own, family members or otherpeople), difficulty filling in the questionnaire, andexperience completing similar questionnaires.
The QALY methodology seeks to include the quan-titative increase in life years resulting from a healthimprovement by weighting this increase accordingto the quality of the life years gained. An assess-ment of the quality of the various states of healthinvolved in the decision is required. To this endthere are several basic techniques, each of whichin turn has been subjected to different applicationsand interpretations. Each of these techniques pro-vides different results, since a detailed examina-
tion of the techniques reveals differences in termsof subject matter, instructions, decision-makingframework and description of the issues. The threetechniques with the broadest-based theoretical andpractical grounds are the Standard Gamble (SG),the Time Trade-off (TTO) and the Person Trade-off(PTO). Health status values based on two scaletechniques were used in this project: the VisualAnalogue Scale, which is the scale used by the EQ-5D questionnaire and provides the health statusvalues described by the interview subjects, and theTime Trade-off (TTO) technique.
A recent study performed by the DAPGA (Depressióen Atenció Primaria de Gavà—Depression in Pri-mary Care in Gavà) research group was used as asource of data for a representative assessment ofthe QoL of the Spanish population with depressivedisorders, the purpose of this choice being to over-come some of the constraints that are inherent torandomised clinical trials with antidepressant drugs(exceedingly restrictive criteria, exceedingly specificresults) and that hinder the generalization of theirresults to clinical practice. This study, which adoptsa naturalistic perspective, focused on the compari-son of two drugs (fluoxetine and imipramine) witha sample of 103 depressive patients in three pri-mary healthcare centres in the metropolitan area ofBarcelona, which were tracked for a period of sixthmonths (Serrano-Blanco et al. 2006).
Since only the application of drug therapy wastaken into account (i.e., psychosocial interventionswere disregarded), our study on the QoL impactfocused only on the two alternative interventionsmentioned earlier: fluoxetine and imipramine. Thebaseline sample value was taken as a measure ofthe QoL of individuals with depression before theyreceived any form of treatment. The average EQ-5D scores by age range and gender obtained fromthe Spanish sample of the ESEMeD / MHEDEA2000 study (Alonso et al. 2002) were taken asmeasures of the QoL for the Spanish population.The effectiveness of the two compared interven-tions was estimated based on the variation in theEQ-5D scores after the sixth-month tracking pe-riod (see table 2.3).
The same software tools provided by the WHO-CHOICE programme for the cost-effectivenessanalysis with DALYs can be used on this input data.

45
RESEARCH METHODOLOGY
In the results obtained here, the effectiveness atthe population level reflects the variation in Qual-ity-Adjusted Life Years (QALYs). As for the costs as-
TABLE 2.3: EQ-5D scores (baseline and after 6 months of tracking)
Drug Measure N Median Average Standard deviation
Fluoxetine Baseline 49 0.46 0.48 0.30
Six months 42 0.83 0.74 0.27
Imipramine Baseline 45 0.54 0.57 0.25
Six months 37 0.88 0.82 0.22
sociated with the interventions, the same that wereconsidered for the analysis in terms of DALYs wereassumed.


47
3Results
3.1 BURDEN OF DISEASEFOR DEPRESSION IN SPAININ THE YEAR 2000
The burden of disease associated with depressionin Spain for 2000 is estimated at 301,697.06DALYs—108,130.14 in men and 193,566.92 inwomen—which means a raw rate per 100,000 in-habitants of 553.44 (men) and 949.34 (women).
By age group, the greatest number of DALYs corre-sponds to the 15-59 age range in both sexes (seetables 3.1 and 3.2).
According to severity, the greatest burden of dis-ease, percentage-wise, is caused by moderate de-pressive episodes (42.5%), followed by severe epi-sodes (39.66%) and mild episodes (17.84%) (seethe details differentiated by sex in tables 3.3 and3.4).
TABLE 3.1: Burden of disease outcome for depression in Spain. Men
Age group YLDs due to depression YLLs due to depression DALYs DALYs per 100,000 inhabitants
0-4 0.00 0.00 0.00 0.00
5-14 8,833.14 0.00 8,833.14 425.67
15-44 72,905.76 0.00 72,905.76 780.14
45-59 18,044.84 29.16 18,074.00 526.34
60+ 8,268.83 48.41 8,317.24 223.31
TOTAL 108,052.58 77.56 108,130.14 553.44
YLDs: Years of Life Lost due to Disability; YLLs: Years of Life Lost due to Death; DALYs: Disability-Adjusted Life Years.
TABLE 3.2: Burden of disease outcome for depression in Spain. Women
Age group YLDs due to depression YLLs due to depression DALYs DALYs per 100,000 inhabitants
0-4 0.00 0.00 0.00 0.00
5-14 8,400.81 0.00 8,400.81 429.11
15-44 132,496.89 0.00 132,496.89 1,459.38
45-59 38,917.65 43.97 38,961.62 1,102.81
60+ 13,566.29 141.30 13,707.59 278.79
TOTAL 193,381.64 185.27 193,566.92 949.34
YLDs: Years of Life Lost due to Disability; YLLs: Years of Life Lost due to Death; DALYs: Disability-Adjusted Life Years.

48
REDUCING THE BURDEN OF MENTAL ILLNESS IN SPAIN
Tables 3.5 and 3.6 show the burden of disease ex-pressed in DALYs for depressive episodes, lung can-cer in men and breast cancer in women. Unlikedepression, these last two diseases cause a signifi-cant number of deaths. However, their proportionof YLDs is minimal, both for lung cancer (9,336.09YLDs versus 134,023.5 YLLs) and for breast can-cer (28,919.12 YLDs versus 56,587.79 YLLs).That is to say, YLDs account for 6.5% of DALYs forlung cancer and 33.8% for breast cancer, while inthe case of depression, YLDs account for nearly100% of the DALYs.
3.2 COST-EFFECTIVENESS ANALYSIS,MEASURED IN DALYS, OF DEPRESSIONINTERVENTIONS IN SPAIN
3.2.1 EFFECTIVENESS OF INTERVENTIONSAND AVOIDED DEPRESSION
“Proactive” collaborative interventions have agreater impact on the health of the population, ba-
TABLE 3.3: Distribution of the burden of disease of depressive episodes according to level of severity. Men
Mild depression Moderate depression Severe depression Total
Percentage 17.84 42.50 39.66 100
0-4 0.00 0.00 0.00 0.00
5-14 1,576.27 3,754.51 3,503.3 8,834.07
15-44 13,010.01 30,988.43 28,915.0 72,913.40
45-59 3,220.10 7,669.92 7,156.7 18,075.89
60+ 1,475.57 3,514.65 3,279.5 8,318.10
TOTAL 19,281.95 45,927.51 42,854.4 108,141.47
TABLE 3.4: Distribution of the burden of disease of depressive episodes according to level of severity. Women
Mild depression Moderate depression Severe depression Total
Percentage 17.84 42.50 39.66 100
0-4 0.00 0.00 0.00 0.00
5-14 1,499.12 3,570.75 3,331.82 8,401.69
15-44 23,644.03 56,317.51 52,549.24 132,510.78
45-59 6,944.84 16,541.86 15,435.02 38,965.69
60+ 2,420.90 5,766.32 5,380.49 13,709.02
TOTAL 19,281.95 82,196.44 76,696.57 193,587.18
sically due to the added beneficial effects by avoid-ing a considerable proportion of recurring depres-sive episodes. Thus, they manage to double thenumber of DALYs avoided when antidepressanttherapy and psychotherapy are administered sepa-rately. The total gains over the health of the popu-lation can be expressed in terms of the proportionof the global burden that is alleviated with each ofthe interventions. Table 3.7 shows the effectivenessof each considered treatment, estimated in DALYsavoided per year.
3.2.2 CONTEXTUALIZATION ANDCOST-EFFECTIVENESS OF INTERVENTIONS
The costs per treated episode are shown in table3.8. The total application costs associated witheach intervention are shown in table 3.9. As antici-pated, there is a considerable variation in the costof the interventions. The lowest costs are those fortricyclic antidepressants (332 euros). At the otherend of this variable is the cost of implementing theproactive collaborative programme (1,401 euros).Development costs for this programme account for

49
RESULTS
TABLE 3.5: Comparison of depression with lung cancer. Men
Depressive episode Lung cancer
Age groups DALYs DALYs per 100,000 inhabitants DALYs DALYs per 100,000 inhabitants
0-4 0.0 0.0 0.0 0.0
5-14 8,833.1 425.7 0.0 0.0
15-44 72,905.8 780.1 11,193.0 119.8
45-59 18,074.0 526.3 50,628.3 1,474.4
60+ 8,317.2 223.3 81,538.3 2,189.3
TOTAL 108,130.1 553.4 143,359.6 733.8
TABLE 3.6: Comparison of depression with breast cancer. Women
Depressive episode Breast cancer
Age groups DALYs DALYs per 100,000 inhabitants DALYs DALYs per 100,000 inhabitants
0-4 0.0 0.0 0.0 0.0
5-14 8,400.8 429.1 0.0 0.0
15-44 132,496.9 1,459.4 19,337.2 213.0
45-59 38,961.6 1,102.8 29,820.4 844.1
60+ 13,707.6 278.8 36,349.3 739.3
TOTAL 193,566.9 949.3 85,506.9 419.4
Intervention Cost in international dollars Cost in euros
Tricyclic antidepressants (imipramine) 391.16 332.41
SSRIs (fluoxetine) 416.75 405.07
Psychotherapy 611.15 413.01
TCAs + psychotherapy 681.76 537.62
SSRIs + psychotherapy 709.76 610.28
Proactive collaboration management with TCAs 655.56 1,133.74
Proactive collaboration management with SSRIs 685.77 1,401.67
Interventions Incremental ratios(DALYs avoided per year)
Tricyclic antidepressants (imipramine) 35,719
SSRIs (fluoxetine) 37,602
Psychotherapy 37,286
TCAs + psychotherapy 44,516
SSRIs + psychotherapy 44,516
Proactive collaboration management with TCAs 72,234
Proactive collaboration management with SSRIs 72,234
TABLE 3.7: Efficacy associated with the proposedinterventions
TABLE 3.8: Costs per treated episode(in euros)
a very low percentage of total costs. The highestcosts are those linked to the programme that arebased on psychotherapy, due to the higher cost oftraining.
The concept of average costs per avoided DALYmakes it possible to perform comparisons from theperspective of the cost-effectiveness of interven-tions (see figure 3.1). Of all of these, the use oftricyclic antidepressants is the most cost-effectiveoption. Moreover, table 3.10 shows the incremen-tal ratios, defined as the quotient of the incremen-

50
REDUCING THE BURDEN OF MENTAL ILLNESS IN SPAIN
Intervention Patient Programme Training Total
Tricyclic antidepressants (imipramine) 106,903,389 2,438,261 3,537,948 112,879,598
SSRIs (fluoxetine) 131,577,853 2,438,261 3,537,948 137,554,061
Psychotherapy 130,169,198 2,438,261 7,643,079 140,250,537
TCAs + psychotherapy 168,943,655 2,438,261 11,181,026 182,562,942
SSRIs + psychotherapy 193,618,118 2,438,261 11,181,026 207,237,405
Proactive collaboration management with TCAs 372,174,776 2,438,261 10,379,454 384,992,490
Proactive collaboration management with SSRIs 463,678,558 2,438,261 9,861,473 475,978,291
Figure 3.1 Cost-effectiveness of interventions
tal change in costs divided by the incrementalchange in effectiveness between interventions. Theyindicate the interventions that would be elected (ifwe apply only a cost-effectiveness criterion) if avail-able resources were to increase. They start with themost cost-effective intervention, then the next one,and so on. The term dominated denotes those in-terventions that are more costly and less effectivethan others, and therefore they are not included inthe expansion path of the most cost-effective strat-egies.
3.2.3 UNCERTAINTY ANALYSIS
Figures 3.2 and 3.3 show the results of the uncer-tainty analysis. These were obtained using the MCLeague software application, which involved 1,000“walks” assuming a normal global truncated distri-bution of total costs. The first graph below showsthe point clusters associated with each of the inter-ventions. The second shows the results in the formof a stochastic league table.
The most notable phenomenon that can be seen infigure 3.2 is the overlap along the effectiveness axisof the clusters associated with baseline interven-tions in pharmacotherapy and psychotherapy with-out collaborative management, on one hand, andof the clusters associated with interventions includ-ing proactive collaborative management, on theother. However, no overlap appears between bothgroups of interventions; the distance in terms ofefficacy between them can be explained by the ad-dition of proactive intervention.
Of special interest as well is the stochastic leaguetable obtained in our uncertainty analysis (figure
Interventions Incremental ratios(euros per DALY avoided)
Tricyclic antidepressants (imipramine) 3,160
SSRIs (fluoxetine) Dominated
Psychotherapy Dominated
TCAs + psychotherapy Dominated
SSRIs + psychotherapy Dominated
Proactive collaboration management with TCAs 7,542
Proactive collaboration management with SSRIs Dominated
TABLE 3.10: Incremental cost-effectiveness ratiosassociated with the proposed interventions (DALYs)
TABLE 3.9: Total application costs(in euros)
Imipramine (IMI) 3,160
Fluoxetine (FLUOX) 3,658
Psychotherapy 3,761
IMI + psychotherapy 4,101
FLUOX + psychotherapy 4,655
IMI + proactive 5,330
FLUOX + proactive 6,589
Per capita income: 20,000 euros
Euros / DALY

51
RESULTS
Figure 3.3 Uncertainty analy-sis results - stochastic leaguetable
Figure 3.2 Uncertainty analy-sis results - cluster graph
1
0.9
0.8
0.7
0.6
0.5
0.4
0.3
0.2
0.1
0100 200 300 400 500 600
E. SSRI + psychotherapyF. TCA + proactive careG. SSRI + proactive care
A. Pharmacotherapy: TCAsB. Pharmacotherapy: SSRIsC. PsychotherapyD. TCA + psychotherapy
Prob
abili
ty o
f bei
ng a
cos
t-ef
fect
ive
inte
rven
tion
Available resources (millions of euros)
900
800
700
600
500
400
300
200
100
00 10,000
Cost
(mill
ion
of e
uros
per
yea
r)
Effect (DALYs averted per year)
20,000 30,000 40,000 50,000 60,000 70,000 80,000 90,000
E. SSRI + psychotherapyF. TCA + proactive careG. SSRI + proactive care
A. Pharmacotherapy: TCAsB. Pharmacotherapy: SSRIsC. PsychotherapyD. TCA + psychotherapy

52
REDUCING THE BURDEN OF MENTAL ILLNESS IN SPAIN
3.3). According to the estimated results, with avail-able resources of more than 400 million euros peryear, the most widely applied intervention of choicewould be that based on the administration oftricyclics with proactive management. With re-sources ranging from 200 to 400 million euros, theintervention based on tricyclic antidepressants pluspsychotherapy would present the greatest possibi-lity of being cost-effective. At under 200 millioneuros, the top choice would be the application ofpsychotherapy alone, while under 125 million
Intervention Average cost per QALYgained (in euros)
Imipramine 2,244
Fluoxetine 3,040
TABLE 3.11: Cost-effectiveness ratios associated with theproposed interventions (QALYs)
euros, it would be the administration of tricyclicantidepressants alone.
3.3 COST-EFFECTIVENESS ANALYSIS,MEASURED IN QALYS, OF DEPRESSIONINTERVENTIONS IN SPAIN
When the same cost-effectiveness analysis meth-odology as above is applied to the two selected in-terventions (fluoxetine and imipramine), but con-sidering the effect on the variation in the subjectsQoL (measured by means of QALYs) rather than thevariation in disability (DALYs), treatment withimipramine (cost per QALY gained: 2,244 euros) isa more cost-effective option than the administra-tion of fluoxetine (cost per QALY gained: 3,040euros) according to the population model used (ta-ble 3.11).

53
4Discussion
4.1 DEPRESSION, A PRIORITYTHAT CAN BE DEALT WITH
Basically, in a cost-effectiveness analysis one de-termines numerically the relationship between thecosts of a given intervention and its consequences,with the particularity that the consequences aremeasured with the same natural units that can beused in regular clinical practice (e.g., life yearsgained, number of lives saved) (Prieto et al. 2004).The methodology of burden of disease studies ena-bles us to have the same unit of effectiveness (inthis case, DALYs) to compare the different inter-ventions for a given process and compare in termsof cost-effectiveness the result of different inter-ventions involving different pathologies. The resultsobtained for the Spanish population show that themost effective interventions for depression arehighly cost-effective in relative terms if we comparethem to other therapeutic strategies used in medi-cine. The most cost-effective alternative was thegeneralised application of imipramine, while theapplication of fluoxetine plus a collaborative modelwas situated at the opposite side of the spectrum.The low cost of interventions based on tricyclic anti-depressants explains why they are ultimately morecost-effective than those based on selectiveserotonin reuptake inhibitors. This difference ap-pears not only in the DALY-based analysis, but alsoin the QALY-based one.
Beyond comparisons between intervention alterna-tives for a single disease, it is possible to make com-parisons between interventions addressing differenthealth problems. For the purpose of comparison, ifwe consider other health interventions assessed to
date as part of the WHO-CHOICE programme, de-pression-related interventions have a higher cost perDALY avoided than primary prevention strategiesagainst infant malnutrition, but are similar in costto treatments aimed at reducing hypertension andcholesterol levels (World Health Organization 2002;Murray et al. 2003). Interestingly, in all the regionsof the world that were studied using this analysis,the cost of avoiding a DALY in depression was lowerthan the annual per capita income value. This isthe cost level established by experts to considerhealth interventions as cost-effective (Commissionon Macroeconomics and Health 2001). This is alsothe case for the analysis we conducted in Spain,where all interventions have a lower cost per DALYthan the annual per capita income (20,000 euros).
This type of information can be useful when pre-senting an argument in favour of the advantages ofinvesting in depression treatment to the health au-thorities in charge of allocating healthcare re-sources. On one hand, it allows us to place the re-sults of mental health assessments in a broadercontext, and on the other, it serves as a tool to makeinformed decisions about the distribution of health-care resources between alternative programmes orinterventions that compete against each other forsuch resources.
4.2 ADDRESSING DEPRESSIONIN THE COMMUNITY:THE RESEARCH AGENDA
The analysis of the burden of disease and the im-pact of the various interventions on the analysis

54
REDUCING THE BURDEN OF MENTAL ILLNESS IN SPAIN
allow us to identify what the limits of the avail-able therapeutic strategies are at the presenttime, and can help us to identify different re-search and development needs in the field of de-pressive disorders from a population perspective(see figure 4.1).
Thus, there is a proportion of the burden of depres-sion that is adequately addressed with the inter-vention strategies currently in use in our health sys-tem. There is also a part of the burden of depressionthat could be avoided with the available treatmentstrategies if the efficiency of health systems wereincreased. Thus, for example, we know that a signif-icant percentage of patients with depression con-sulting with primary care physicians are not adequate-ly diagnosed. This lack of recognition of depressivedisorders from a primary care perspective is due tomany factors, the most important of which is theform of clinical presentation of depressive disordersin primary care, where somatic symptoms typicallyprevail (Bair, Robinson and Katon 2003). The de-velopment and generalised application of instru-ments for quickly assessing the presence of depres-sive disorders in patients with unexplained somaticsymptoms could be a way of improving the qualityof care in depression in these resources.
In many other cases, patients are prescribed anadequate treatment, but fail to experience thetherapeutic effects due to a lack of compliance.As a result, they cannot benefit from available in-
terventions that are effective against this pathol-ogy and can be covered by the existing healthcarebudget. The type of research required to act onthis level focuses on implementing training pro-grammes in primary care that are centred not onlyon acquiring diagnostic and therapeutic skills, butalso on developing strategies that favour therapeu-tic compliance.
A significant part of the burden of disease is avoid-able with treatment strategies that already exist butare not cost-effective at the present time. The typeof research required at this level should be focusedon reducing the cost of interventions. Thus, for ex-ample, our health system could not shoulder theburden of referring all depression-related contactsto specialised care resources so as to receive a drugtreatment supplemented by a psychotherapeuticapproach. One objective of research could focus ondeveloping cost-effective intervention models inprimary care that would allow depression to be effi-ciently addressed at this level with a protocol forintervention in resistant cases and referral to spe-cialised care in a very small number of cases(Simon, Katon and VonKorff 2001).
Finally, there is a very significant proportion of thetotal global burden of depression that cannot beaddressed adequately with any of the currently ex-isting interventions. Research at this level shouldbe geared towards developing new interventionstrategies. This would justify, for example, invest-
Figure 4.1 Model for identifying research needs through the analysis of the burden of disease
Effective coverage in the population
Com
bine
d ef
ficac
y of
inte
rven
tion
mix
100%
100%
Research on healthsystems and policies
Biomedical researchand development to reduce thecost of existing interventions
Biomedical researchand development
to identifynew interventions
Unavertable with existing interventions
Averted with current mixof interventions andpopulation coverage
Avertable withimproved efficiency
Avertable with existingbut non-cost-effective
interventions

55
DISCUSSION
ing in the development of new treatments thatwould reduce the time of onset of the therapeuticresponse, and also in the development of drugs thatcould reduce the number of depressions resistantto the first antidepressant agent and the develop-ment of new drugs for efficiently treating the re-sidual symptoms of depression. Research at thislevel should not be exclusively biological. It is wellknown that a significant percentage of individualssuffering from depression among the general popu-lation do not contact the healthcare resources orseek out consultation for this disease. This wouldjustify investing research resources in the develop-ment of population intervention techniques to urgesubjects with this disorder to consult the health-care resources and thus benefit from availabletherapeutic interventions.
4.3 CONCLUSION
When considering the analysis of the health ofpopulations in terms of disability, depressive disor-ders are among the processes accounting for thehighest burden of disease in the world, in spite oftheir low mortality. This significant contribution tothe burden of disease is due to a combination ofhigh prevalence of depression, its major influenceon functioning and its onset at early stages of life,with a highly recurrent course.
Until very recently, mortality statistics were the cen-tral element in the identification of public healthcarepriorities and in the monitoring of the success orfailure of interventions in healthcare. Today, with thedevelopment of new synthetic measures to describethe state of health of populations, such as theDALYs, we can assess the impact on the populationof a wide range of interventions, simultaneously tak-ing into account their effect on mortality and mor-bidity. We thus have a common metric to identifypriorities and assess interventions that is usable inmany diverse processes and makes comparisons incost-effectiveness terms possible. This has enabledus to demonstrate that interventions for depressionare cost-effective. However, the total burden of dis-ease for depression that cannot be addressed usingthe currently available treatment strategies is verylarge. Even in countries like Spain, with a high levelof development of healthcare services and coverage,the total burden due to depression that could beavoided with the implementation of currently devel-oped treatment strategies is very limited. Therefore,there is a wide margin for research in this field andenough scientific evidence to advocate the develop-ment of healthcare policies that take these data intoaccount when allocating healthcare resources in amanner that is proportional to the magnitude of theproblem, and that recognise the need to implementadequate intervention programmes, basically at theprimary care level.

PART 2
Comparative Analysisat the Population Levelof the Cost-Effectivenessof Therapeutic Interventionsin Schizophrenia


59
5Introduction to Part 2
5.1 SCHIZOPHRENIA AND GLOBALBURDEN OF DISEASE STUDIES
Schizophrenia is a severe disorder, which typicallyappears during adolescence or early adulthood. Aclassic study carried out by the World Health Or-ganization in the early 1980s to estimate the inci-dence of schizophrenia analysed the presence ofthe disorder in ten different countries. Using a re-strictive definition of schizophrenia, the study foundan average incidence of approximately 10 per100,000 inhabitants per year (Jablensky et al.1992). The WHO’s Global Burden of Disease (GBD)project reports a worldwide prevalence of schizo-phrenia of 0.4% (World Health Organization 2001).A recent study on disability associated with physi-cal and mental condition, conducted in 14 coun-tries, found that the positive symptoms of schizo-phrenia (active psychosis) ranked third among themost incapacitating conditions for the generalpopulation, ahead of such conditions as paraplegiaor blindness (Ustun et al. 1999). In the GBD study,schizophrenia accounted for 1.1% of the worldpopulation’s DALYs and 2.8% of the YLDs. The eco-nomic cost of schizophrenia to society is high. Itwas estimated that the total cost associated withschizophrenia in the United States in 1991amounted to 19 billion dollars in direct costs, plusan additional $46 billion due to the effect of pro-ductivity losses (World Health Organization 2001).However, burden of disease data alone, whetherexpressed in epidemiological or economic terms,are not grounds enough to allocate resources andestablish action priorities. The cost-effectivenessanalysis of current intervention strategies, includ-ing the estimate of the amount of burden that can
be avoided, could provide additional informationuseful in the decision-making process. Differentstudies have focused on the differences in cost-ef-fectiveness of interventions applied to certainpopulations (Knapp 2000; Palmer et al. 2002;Andrews et al. 2003; Basu 2004; Magnus et al.2005). However, our study considers, for the firsttime, a cost-effectiveness comparison between thedifferent schizophrenia interventions applied to theSpanish population.
5.1.1 DISABILITY AND FUNCTIONINGIN SCHIZOPHRENIA
Psychiatric research has traditionally focused on thestudy of clinical symptoms. However, the ascertain-ment of other idiosyncratic problems of undoubtedrisk for schizophrenics has opened up new path-ways for exploration. The discovery that an improve-ment in psychopathological terms squares up onlymoderately with subjects’ adequate social and func-tional integration into their environment has givenrise to the inclusion of alternative recovery meas-ures (criteria of functioning, employment, rehospi-talization, QoL, social adjustment, etc.). However,the World Health Organization’s guidelines remainfaithful to criteria based on signs and symptoms,establishing that psychosocial indicators do notconstitute measures of the course of the disorder,but rather consequences of it (International Classi-fication of Impairments, Disabilities, and Handi-caps, WHO, 1980).
As part of our research, we reviewed the literatureon the course and prognosis of schizophrenia pub-lished in the last five years. This involved a key-word search on the MEDLINE database. The differ-

60
REDUCING THE BURDEN OF MENTAL ILLNESS IN SPAIN
ent measures of course that we considered are re-flected in the titles of the following subsections,which describe the results obtained. This review il-lustrates the difficulty of finding a single criterionthat could make possible a truly functional progno-sis for schizophrenic disorder. It is true that signifi-cant progress has been made in recent years withthe addition of functional assessments to efficacymeasures in the more traditional therapeutic (symp-tom-based) interventions. However, we still need todevote more attention to prognosis scales centredon the patient’s functioning, and create new toolsthat include multidimensional criteria that wouldallow us to go beyond the heterogeneous results thatexist today.
MEASURES OF FUNCTIONING AND SOCIAL DISABILITY
In recent years, the assessment of how individualsdiagnosed with schizophrenia function and adjustsocially has spurred great interest, both as an ob-ject of study in itself and in relation to other meas-ures. For example, Loebel et al. (2004), in a re-analysis that tracks 270 patients treated withziprasidone, found that cognitive function, assessedusing the PANSS (Positive and Negative SyndromeScale) subscales, is a significant predictor of so-cial functioning.
In analysing the results of the WHO ISoS study(Hopper and Wanderling 2000), Harrison et al.(Harrison et al. 2001) use two favourable coursemeasures regarding functioning and disability: ascore above 60 on the GAF (Global Assessment ofFunctioning, adopted from DSM-III-R) scale, anda final grade of “excellent” or “good” (<2) on thethe WHO-DAS (Disability Assessment Schedule)tool. Table 5.1 shows the percentages of subjectswho met these criteria at the end of the trackingperiod.
Ganev (2000) addresses the problem of the courseof social disability in a sample (part of the afore-mentioned ISoS study by the WHO) of 60 Bulgar-ian patients with recent onset (at the most, 2 yearsbefore the start of the study) of non-affective psy-chosis diagnosed between 1978 and 1980 (ICD-9), who were tracked over a period of 16 years.Three assessments were made (using functioningmeasurement tools, such as the DAS scale), andthe authors analysed whether the course improved,worsened, or remained stable. Results showed that29.1% of the subjects tended towards improve-ment, whereas 45.5% got worse.
Ruggeri et al. (2004) used their work on the GAFscale to analyse the overall functioning of a sampleof 107 Italian subjects diagnosed with schizophre-nia (ICD-10 diagnosis). The overall results were notvery positive, since the assessed subjects presentedpoor functioning at the baseline, and on averagetended to worsen after 3 years of tracking. How-ever, this drop in the average score of the sample isnot so great as to be statistically significant. Ana-lysing individual by individual, the figures also re-flect functional deterioration: almost half the sub-jects worsened (47%), although 30% improvedtheir score, and 23% remained stable.
In a recent article, Häfner et al. (2003) reviewedthe results they had published previously (Häfneret al. 1999), assessing the social disability (meas-ured by the DAS) of 115 individuals diagnosed withschizophrenia over a tracking period of 5 years.There were significant differences in the course ofthe illness between men and women (more favour-able for the latter). Male subjects scored approxi-mately 2.75 at the time of their inclusion, and af-ter applying treatment (1 year later), they stabilisedat around 2 (threshold value for social disabilityaccording to the DAS scale) throughout the track-ing period. Female subjects, on the other hand,scored slightly above 1.5 (hence lower than the so-cial disability threshold), which remained stable(declining slightly) throughout the tracking period.
In their comprehensive study of a group of 65 sub-jects diagnosed with schizophrenia (from 1976 to1987) with onset before age 18 (according to ICD-9 criteria) and a tracking period of ten years, Lay etal. (2000), using the DAS, found an absence orminimal level of dysfunction in a relatively small
Incidence samples Prevalence samples
DAS 33.4 47.7
GAF-D 50.7 60.3
Source: Harrison et al. (2001)
TABLE 5.1: Percentage of subjects diagnosed with schizophreniawith good social-functional course according to scores usingthe DAS and GAF-D tools following tracking in the ISoS sample

61
INTRODUCTION TO PART 2
proportion (no dysfunction, 12.5%; minimal,14.1%), whereas almost two-thirds of the samplesuffered from severe dysfunction (severe, 29.7%;very severe, 31.3%; maximum, 4.7%). The authors’report also included a logistical regression analysisof the possible predictive factors of long-term so-cial disability, with significant findings in the fol-lowing: degree of symptoms at discharge (OR =1.46), level of social competence at discharge (OR= 0.87), and having suffered more than two epi-sodes requiring admission (OR = 10.69).
The social functioning of the subgroup of patientspresenting onset during childhood or adolescencewas also examined by Hollis (2000) in a study thatcompared 51 individuals diagnosed with schizo-phrenia with a control group of 42 individuals withanother type of diagnosed psychosis (in both caseswith early onset). In this case, the GAF (disabilityscale) was used as an assessment measure. Theauthor concluded that there are significant differ-ences between the two groups, which are clearlyunfavourable towards those diagnosed with schizo-phrenia. The average score for this group was 42.6,whereas the control group scored 59.7 on average.
The use of qualitative measures and less restrictivecriteria could give more positive results on social func-tioning for subjects diagnosed as having schizophre-nia. For instance, in a recent article, Haro et al.(2005) reported more optimistic results after analys-ing the sample of more than 10,000 outpatients witha schizophrenia diagnosis in ten European Unioncountries (SOHO study, European Schizophrenia Out-patient Health Outcomes). By assessing the percent-age of “socially active” subjects (subjects who havemaintained some form of social contact in the 4weeks prior to the assessment are given this consid-eration) at the time of starting or changing treatmentwith antipsychotics, and after 6 months of moni-toring, a clear increase can be seen regardless ofthe type of antipsychotic prescribed (see table 5.2).
EMPLOYMENT INTEGRATION
According to the information compiled from the in-cidence sample of the ISoS study by Harrison et al.(2001b), 56.8% of the subjects diagnosed withschizophrenia had performed a job over most of thetwo years prior to the assessment. Prevalence ratesshow a slightly higher outcome of 69.2%. However,
the definition of employment used by Harrison etal. is too broad, since it encompasses both finan-cially remunerated work and household chores. Theapplication of a more restrictive criterion—i.e., onlya remunerated job is considered employment—re-duces the percentages to about 65% of the initialvalues: 37.0% (incidence samples) and 46.2%(prevalence samples). In addition, a significant dif-ference in gender can be seen, favouring men, prob-ably due to job market conditions in the less devel-oped countries included in the study (unfortunately,the authors do not analyse the effect of the coun-try’s degree of economic progress in their final re-sults): 45.4% men with remunerated work, com-pared with only 28.4% in the incidence samples,and the gap widens even more in the prevalencesamples (64.8% and 18.8%, respectively).
The differences between developed and developingcountries in the ISoS study are addressed by Hop-per and Wanderling (2000), who use the same defi-nition of employment (including both paid work andhousehold chores, over the last two years), obtain-ing percentages that differ significantly, dependingon the countries being considered: 46% (devel-oped) versus 73% (developing). Unfortunately,these percentages are not broken down by genderor by type of work performed (paid work or house-work). If we extrapolate the data obtained byHarrison et al., we can assume that approximately65% of these subjects will earn a salary for theirwork, so the gross proportion of employees in de-
TABLE 5.2: Increased percentage of “socially active” patientsdiagnosed as having schizophrenia according to the treatmentfollowed after 6 months of monitoring
Treatment Baseline After 6 monthsmonitoring
Olanzapine 66.5 84.6
Risperidone 69.7 82.4
Quetiapine 67.4 78.9
Amisulpride 69.8 82.2
Clozapine 64.6 81.6
Typical antipsychotics (oral) 70.2 80.3
Typical antipsychotics (depot) 66.9 78.3
More than one antipsychotic 61.2 84.8
Total 67.3 83.0
Source: Haro et al. (2004).

62
REDUCING THE BURDEN OF MENTAL ILLNESS IN SPAIN
veloped countries would be close to one out of everythree subjects diagnosed with schizophrenia (ap-proximately 30%).
Some articles published since show less favourableresults regarding the ability of subjects diagnosedwith schizophrenia to adapt to the job market.Resnick et al. (2004), working with a sample of825 patients assessed in the PORT (SchizophreniaPatient Outcomes Research Team) study, found thatonly 15.9% of the subjects worked in exchange fora salary. However, 78.6% of the subjects reportedhaving earned income during the previous monthin excess of $300 (50.2% from $300 to $900,28.4% more than $900). This reveals the need toconsider, before drawing any conclusions, the sys-tem of public aid provided to disabled subjects ineach country. A strong monetary outlay in the formof disability-related pensions and furloughs or leavecould halt their integration into the labour market,and since such forms of aid are more common inaffluent countries, it could be a factor to bear inmind when explaining the difference in percentagesobserved by Hopper and Wanderling, clearly in fa-vour of developing countries.
In relation to the sample of the SOHO study, Haroet al. (2005), based on two assessments (one be-fore switching antipsychotic treatments or startingantipsychotic treatment for the first time, and theother six months later), find that 20.7% of the sub-jects were gainfully employed at the baseline, and22.9% had paying jobs at the end of the monitor-ing period. Given this outcome, it could be deducedthat, at least in the short term, treatment does notsignificantly favour the job prospects of subjectsdiagnosed with schizophrenia. In their research onthe course of the disorder, Di Michele and Bolino(2004) found that only 22.5% of the sample pa-tients had a job. However, the relatively smallnumber of subjects in the sample can be a disad-vantage for the generalizability of the outcomes withregard to the studies mentioned above. Using theaforementioned sample of 65 patients with onsetduring adolescence, Lay et al. (2000) found that24.6% (26.3% in men, 22.2% in women) hadsources of income that depended on themselves(the remaining percentage was divided betweenpublic assistance [36.9%] and family care [parentsor spouse—38.5%]). In addition, they found that29% of the subjects had unprotected jobs at the
time of the assessment, 23% had protected jobsoutside the clinical sphere, 23% were employedwithin the clinical sphere with little or no remu-neration, and 25% lacked employment of any kind.It is interesting to note that gender-based differ-ences were smaller compared with those reportedby Harrison et al., which seems to corroborate thatthese were due to the weight of underdevelopedcountries in the total percentages. Researchers alsopaid attention to the subjects’ educational and oc-cupational disability: 18.5% did not present anydisability, 24.6% showed slight disability, with 20%moderate, 18% severe and 9.2% complete. Usinga logistical regression analysis, it was found thatthe two main predictors of educational/occupationaldisability were the duration of hospitalization dur-ing the first episode (OR = 1.25) and having expe-rienced more than two episodes requiring admis-sion (OR = 15.11). However, a certain pessimisticbias in these outcomes should be considered dueto the early age of onset (age of first admission be-tween 11 and 18), which implies serious limita-tions in terms of the subjects’ academic and pro-fessional training that undoubtedly complicate theirentry in the job market. Therefore, in overall terms,the actual percentage of subjects diagnosed withschizophrenia can be expected to be considerablyhigher than that provided by Lay et al. (2000).
Häfner et al. (2003) considered the early course ofschizophrenia as the period of study, defining it asthe period of time elapsed from the onset of thefirst signs of mental disorder up to the first admis-sion. The outcomes: a 33% employment rate at thetime of the first pathological sign (average age: 24),rising to 44% on first contact with healthcare re-sources (average age: 30). The data are limited bythe relatively low number of subjects, but the studyhas in its favour the use of a paired control groupof healthy individuals, making it possible to inferthe employment rate among the population with nopsychiatric disorders (42% and 58% at ages 24and 30, respectively). The comparison betweenboth groups only shows significant differences be-tween subjects diagnosed with schizophrenia andhealthy ones at the time of the first admission,which seems to indicate that the employment prob-lems of the diagnosed group appeared before theyare diagnosed, and not as an effect of their being“labelled” as mentally ill. The article can be inter-preted as a warning regarding how dangerous a
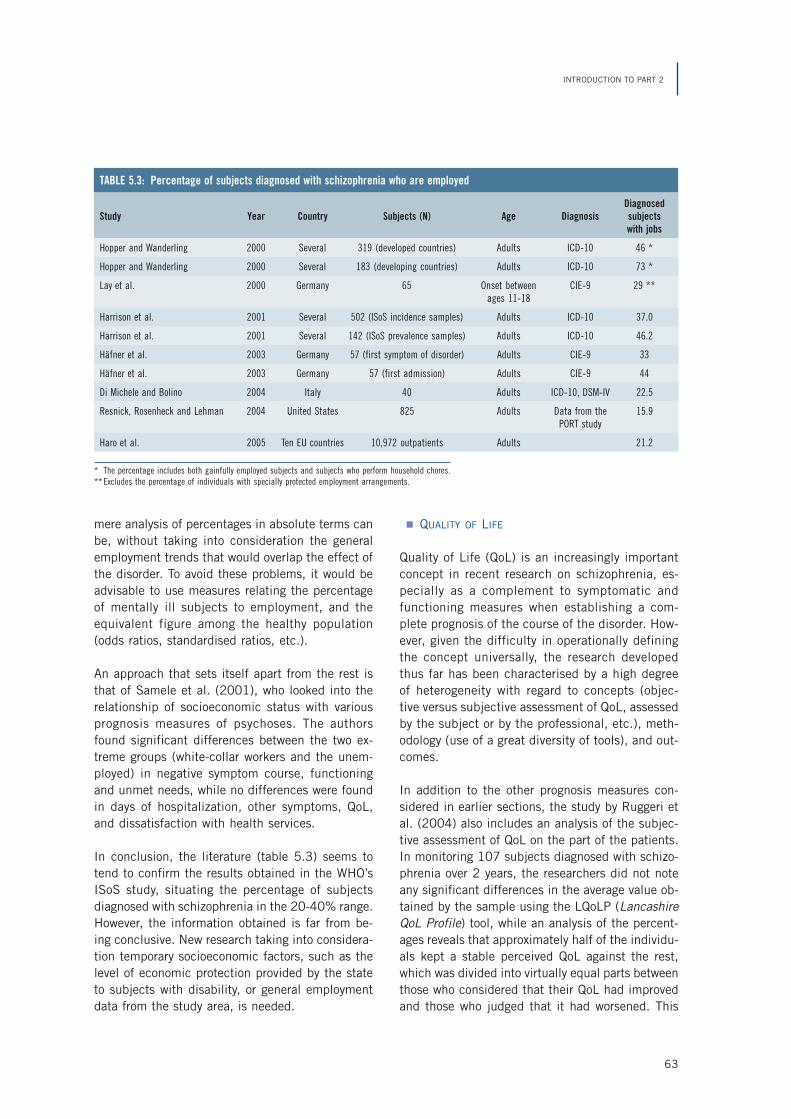
63
INTRODUCTION TO PART 2
mere analysis of percentages in absolute terms canbe, without taking into consideration the generalemployment trends that would overlap the effect ofthe disorder. To avoid these problems, it would beadvisable to use measures relating the percentageof mentally ill subjects to employment, and theequivalent figure among the healthy population(odds ratios, standardised ratios, etc.).
An approach that sets itself apart from the rest isthat of Samele et al. (2001), who looked into therelationship of socioeconomic status with variousprognosis measures of psychoses. The authorsfound significant differences between the two ex-treme groups (white-collar workers and the unem-ployed) in negative symptom course, functioningand unmet needs, while no differences were foundin days of hospitalization, other symptoms, QoL,and dissatisfaction with health services.
In conclusion, the literature (table 5.3) seems totend to confirm the results obtained in the WHO’sISoS study, situating the percentage of subjectsdiagnosed with schizophrenia in the 20-40% range.However, the information obtained is far from be-ing conclusive. New research taking into considera-tion temporary socioeconomic factors, such as thelevel of economic protection provided by the stateto subjects with disability, or general employmentdata from the study area, is needed.
QUALITY OF LIFE
Quality of Life (QoL) is an increasingly importantconcept in recent research on schizophrenia, es-pecially as a complement to symptomatic andfunctioning measures when establishing a com-plete prognosis of the course of the disorder. How-ever, given the difficulty in operationally definingthe concept universally, the research developedthus far has been characterised by a high degreeof heterogeneity with regard to concepts (objec-tive versus subjective assessment of QoL, assessedby the subject or by the professional, etc.), meth-odology (use of a great diversity of tools), and out-comes.
In addition to the other prognosis measures con-sidered in earlier sections, the study by Ruggeri etal. (2004) also includes an analysis of the subjec-tive assessment of QoL on the part of the patients.In monitoring 107 subjects diagnosed with schizo-phrenia over 2 years, the researchers did not noteany significant differences in the average value ob-tained by the sample using the LQoLP (LancashireQoL Profile) tool, while an analysis of the percent-ages reveals that approximately half of the individu-als kept a stable perceived QoL against the rest,which was divided into virtually equal parts betweenthose who considered that their QoL had improvedand those who judged that it had worsened. This
TABLE 5.3: Percentage of subjects diagnosed with schizophrenia who are employed
DiagnosedStudy Year Country Subjects (N) Age Diagnosis subjects
with jobs
Hopper and Wanderling 2000 Several 319 (developed countries) Adults ICD-10 46 *
Hopper and Wanderling 2000 Several 183 (developing countries) Adults ICD-10 73 *
Lay et al. 2000 Germany 65 Onset between CIE-9 29 **ages 11-18
Harrison et al. 2001 Several 502 (ISoS incidence samples) Adults ICD-10 37.0
Harrison et al. 2001 Several 142 (ISoS prevalence samples) Adults ICD-10 46.2
Häfner et al. 2003 Germany 57 (first symptom of disorder) Adults CIE-9 33
Häfner et al. 2003 Germany 57 (first admission) Adults CIE-9 44
Di Michele and Bolino 2004 Italy 40 Adults ICD-10, DSM-IV 22.5
Resnick, Rosenheck and Lehman 2004 United States 825 Adults Data from the 15.9PORT study
Haro et al. 2005 Ten EU countries 10,972 outpatients Adults 21.2
* The percentage includes both gainfully employed subjects and subjects who perform household chores.** Excludes the percentage of individuals with specially protected employment arrangements.

64
REDUCING THE BURDEN OF MENTAL ILLNESS IN SPAIN
strong trend towards maintaining the same out-comes after monitoring was also seen when consid-ering the profile subdomains: only the emotionalbalance scale and the “religion” dimension showeda significant reduction in score, while the rest re-mained approximately constant (dimensions in-cluded overall well-being, work, leisure activities,financial status, life, safety and legal status, familyrelations, social relations, health and the self-es-teem scale). Moreover, Ruggeri et al. (2001), in aprevious longitudinal study, made use of the sametool to assess the changes in subjective QoL in asample of 183 subjects diagnosed with schizophre-nia who were tracked over a period of two years.The outcomes were relatively uniform on the differ-ent scales: approximately one third of the subjectsimproved their assessment, another third worsenedit, and the remainder kept it constant.
In recent years, various lines of research have soughtto link the QoL concept to other clinically signifi-cant dimensions. One matter of special interest isthe influence of the type of treatment. The SOHOstudy is doubtless one of the greatest research ef-forts in recent years concerning the QoL conceptapplied to the prognosis of schizophrenia. The studyfocused on the effect of antipsychotic treatmenton a sample of more than 10,000 outpatients in10 countries of the European Union. In a recentarticle, Haro et al. (2005) analysed the results af-ter 6 months of prospective monitoring of the sam-ple, considering, among other dimensions, the pa-
tients’ subjective QoL. This was assessed using theEQ-5D (EuroQuol-5 Dimensions) questionnaire,validated in the population of the ten countries con-sidered (Prieto et al. 2002), which consist of fiveindependent dimensions: mobility, self-care, regu-lar activities, pain and anxiety/depression. The out-comes are moderately optimistic: all patients, re-gardless of the treatment followed, experiencedincreases in their QoL scores (see table 5.4).
The authors also performed a preliminary assess-ment 3 months into the course of the treatment.Most of the rise in scores had already taken placeby this early stage, remaining approximately con-stant over the next 3-month period (rising slightly).As for the differential behaviour of the differenttreatments, the researchers, based on a multivariateanalysis taking as reference the application ofolanzapine, calculated different odds ratios (>1 in-dicates a diminished response). Olanzapine ob-tained better scores in EQ-5D than the rest of theantipsychotics (odds ratios: risperidone, 2.3;quetiapine, 3.0; etc.), except clozapine (odds ra-tio: 0.5). The authors link these outcomes to goodpsychopathological evolution, affirming that im-proved symptoms (basically negative ones) and cog-nitive function may be responsible for the enhancedQoL. However, they warn that more research is stillrequired to determine the differential impact ofantipsychotics on the patients’ QoL.
Some researchers (Hellewell 2002) have noted thatthe subjective well-being and QoL perceived by pa-tients diagnosed with schizophrenia could influencetheir adherence to medication, thus influencing theprognosis. The relationship could well be two-way,since the absence of secondary effects and im-proved symptoms could be associated with a morepositive subjective feeling. Along this line, variousstudies have addressed the effect of different typesof treatment, some focusing on the results of spe-cific drugs—such as Nasrallah et al. (2004), whoreported a significant improvement in QoL relativeto health in a group treated with risperidone ascompared to the placebo group, and Beasley etal. (2003), who found analogous results forolanzapine—and others comparing two differentantipsychotics, such as Gureje et al. (2003), whoreport better results in treatment with olanzapinethan by applying risperidone, or Hertling et al.(2003), who did not discover significant differences
Treatment Baseline After 6 monthsmonitoring
Olanzapine 45.7 63.2
Risperidone 46.9 61.2
Quetiapine 47.2 59.9
Amisulpride 45.7 59.5
Clozapine 42.2 61.0
Typical antipsychotics (oral) 47.4 58.8
Typical antipsychotics (depot) 48.5 59.4
More than one antipsychotic 43.0 61.4
Total 46.1 61.9
Source: Haro et al. (2004).
TABLE 5.4: Improvement in the QoL score (EQ-5D tool, 0[worst] to 100 [best]) after 6 months’ monitoring in the SOHOstudy

65
INTRODUCTION TO PART 2
in QoL comparing the application of flupentixol andrisperidone.
One hypothesis that enjoys certain acceptancegrants a preponderant role to the influence of thesecondary effects of antipsychotics on the self-per-ception of QoL. Miller et al. (2000) considered theadverse effects of akathisia on patients’ well-being.Hofer et al. (2004), after applying a multiple linearregression analysis to the scores obtained from asample of 80 outpatients diagnosed with schizo-phrenia on scales for measuring QoL and the sec-ondary effects caused by antipsychotic medication,concluded that parkinsonism, an after-effect prima-rily associated with typical neuroleptics, was theonly side-effect that had an impact on subjects’general satisfaction and self-esteem. The effects oflate-generation drugs, sedation or weight gain wereshown to have little influence on QoL. Theseaffirmations align the authors with those who advo-cate the hypothesis of improved QoL related to theswitch from typical to atypical medication. In addi-tion to these general conclusions drawn from re-gression analysis, researchers have also found nega-tive links between some of the side effects andspecific domains of QoL, e.g. between akathisia andself-esteem, between erectile dysfunction and af-fection and self-esteem, and between depressionand general satisfaction, affection and self-esteem.Ritsner et al. (2002) addressed the problem in-depth with their analysis of 161 Israeli patients di-agnosed with schizophrenia (Ohayon 1997). Inspite of finding a correlation between the adverseeffects of medication and QoL, the authors de-fended the idea that this influence appears to bemediated by a subjective discomfort factor (i.e.,how the subject perceives these adverse conse-quences). Using a multiple regression analysis, theyconcluded that adverse effects would only explain3.2% of the QoL variance, which would be deter-mined primarily by psychosocial factors (20.9%)and clinical symptoms and associated discomfort(World Health Organization 1992).
Furthermore, the link between pathological meas-ures and QoL has been addressed abundantly byvarious researchers. In a recent 3-year study track-ing a group of 25 American patients diagnosed withschizophrenia or schizoaffective disorder who under-went a switch from typical to atypical antipsychoticmedication, Zhang et al. (2004) found a marked
improvement in self-assessed QoL, which rosethroughout the treatment monitoring period. Theperceived evolution of symptoms also presentedimprovements over time, although more qualifiedthan in the case of QoL. The authors point to a lackof sensitivity of the instrument used in the self-as-sessment of symptoms (the Saint Louis SymptomScale or SLSS, empirically developed by the Uni-versity of Missouri), as a possible explanation of thescant correlation between the two measures. How-ever, other studies published in the last five yearsindicate the lack of a significant relationship be-tween symptom and QoL measures, including Lam-bert et al. (2004), who concluded, after analysinga sample of 150 diagnosed subjects treated withatypical antipsychotics, that psychopathologicalmeasures have only a very slight influence on sub-jective QoL assessments. In a recent article, Naberet al. (2005) compared the use of olanzapine andclozapine in samples of patients with schizophre-nia and assessed the subjective impact of treatmentusing two tools: the SWN (Subjective Well-beingunder Neuroleptic Treatment) scale, which assessessubjective well-being, and the MLDL (Munich QOLDimension List), which focuses on QoL. The authorsfound a notable increase in both measures after 26weeks of treatment in groups of 50 patients, butwithout significant differences depending on thedrug (average SWN score of 132.6 to 154.5 witholanzapine, and of 138.7 to 152.4 with clozapine;average MLDL score of 4.7 to 6.0 with olanzapine,and of 4.5 to 5.8 with clozapine), whose resultsseem to indicate that the perception patients haveof their own situation improves when they benefitfrom the advantages of medication. However, theyfound a moderate correlation of these subjectivemeasures with clinical measures assessed by psy-chiatrists (correlation between the change of SWNand PANSS, r = -0.45, correlation between changesin MLDL and PANSS, r = -0.16), figures that ap-proach those obtained by the same authors in aprevious study (Naber et al. 2001), which they in-terpret as a sign that patients and psychiatrists donot share the same perception regarding symptomimprovements.
Finally, the importance of the differential culturalinfluence of each society is reflected in the studyby Gaite et al. (2002), who found significant dif-ferences in the data from five European countrieswith regard to some QoL domains (such as life situ-
66
REDUCING THE BURDEN OF MENTAL ILLNESS IN SPAIN
ation and family relations). They attribute this dis-crepancy to cultural differences: subjects in south-ern European centres (Santander, Spain and Ve-rona, Italy), for instance, give more importance tofamily relations and less to health services (socially,the family plays the role of the subject’s primarycare provider), establishing significant differenceswith the rest of the centres considered in the study(Copenhagen, London, and Amsterdam).
5.1.2 MORTALITY AND SCHIZOPHRENIA
It is generally accepted that all severe mental disor-ders increase the risk of premature death to thosesuffering from them. Schizophrenia is not an excep-tion, particularly when it comes to the risk of deathdue to non-natural causes (Harris and Barraclough1998). Studies on general mortality in subjects withschizophrenia appear to show that it is two to threetimes higher than among the normal population(Miles 1977; Tsuang and Woolson 1977; Black andFisher 1992). In their comprehensive analysis aspart of the ISoS study (Hopper and Wanderling2000), Harrison et al. (2001) obtained standardmortality ratios ranging from 1.04 to 8.88. The au-thors found that when going from non-industrial-ised countries to industrialised ones, the proportionof non-natural deaths (especially suicide) jumpsdramatically, and the ratios obtained rise.
Suicide deserves special attention within the studyof mortality among schizophrenia subjects as themain cause of non-natural death. The differencesestablished between the population with schizo-phrenia and the population that does not sufferfrom the disorder would be qualitative (greaternumber of previous attempts, more serious andmore lethal in the case of subjects with schizophre-nia, to the extent that the disorder itself could beconsidered a risk factor) as well as quantitative(published literature on the matter seems to coin-cide on the fact that the risk of suicide among di-agnosed subjects is about ten times higher thanthe general population; for instance, a review pub-lished in 2002 [Meltzer 2002] places it between8 and 13 times higher). These figures are alarm-ing enough to consider the incidence of suicide inschizophrenic populations as a priority researchobjective. In a bid to shed more light on the possi-ble ways of increasing prevention, various predic-tors and risk factors have been pointed out, includ-
ing youth, male gender, lack of a partner, good pre-morbid functioning, having suffered a recent lossor rejection, limited social support, high intelli-gence, high expectations, chronic course of the dis-order, or the presence of despair. Pompili et al.(2004) point to a possible link between suicide andsymptoms: two positive symptoms, suspicion anddelirium, seem to increase the risk (which wouldexplain a higher percentage of suicides in the para-noid subtype), whereas some prominent negativesymptoms seem to constitute a protective factor.In their review, the same authors explored pub-lished data on the preventive effect of drug treat-ment, which seems to be more favourable in thecase of atypical antipsychotics, especiallyclozapine, although the evidence is not conclusive.Although factors associated with treatment withtypical neuroleptics—e.g., certain side effects andslight induced depression—have traditionally beenthought to be able to have an indirect impact onincreased risk of suicide, Meltzer’s review (2002)questioned the validity of such a claim. Its conclu-sions do provide evidence, however, of the greaterefficacy of clozapine in reducing the risk of sui-cide. However, the existence of other studies thatdo not show a significant reduction in the risk ofsuicide among patients treated with clozapine(Sernyak et al. 2001) underscores the need formore research in order to reach definitive conclu-sions.
The complexity of the phenomenon, both concep-tually (the suicide study is markedly multidimen-sional, encompassing psychological, social andeven physiological approaches) and methodologi-cally (the need to work with large samples and havemortality data concerning the general population),can account for the traditional lack of studies onthe matter. However, research has increased con-stantly in recent years. It is to be hoped that thisincrease will ultimately be translated into more ef-fective prevention measures.
5.2 SCHIZOPHRENIA IN SPAIN
Very few studies on the epidemiology of schizophre-nia have been conducted in Spain, and in mostcases they focus their attention on highly localisedareas with a small number of cases. One of the

67
INTRODUCTION TO PART 2
most important contributions to this field of re-search is the study by Vázquez Barquero et al.(1995) on first episodes in the population ofCantabria, a northern region of Spain. The authorstake into consideration all the subjects in Cantabriawho contacted a psychiatrist for the first time andwere diagnosed as having schizophrenia (DSM-III-R or ICD-9) over a 2-year period (the study beganin 1989). The conclusions reached by this groupof researchers with regard to the incidence of thedisorder in Cantabria are consistent with the datafrom international studies: there is an estimatedincidence of 19 per 100,000 (18.8 for males,19.3 for females) for the population at risk (de-fined by the authors as the population group agedbetween 15 and 54). If the total population wereconsidered instead of this group, the incidencewould drop to 8.0 per 100,000 (8.4 for males, 8.0for females). The figure is also estimated when thediagnosis used is the S+ diagnosis of the CATEGOtool. For the population at risk, the incidence valueobtained is 13 per 100,000 (12.7 for men, 14.4for women). One detail to be noted is that the au-thors found no significant differences regarding thedistribution of the disorder by gender. They did finddifferences between the sexes, however, in relationto the type of environment: in rural settings, sig-nificantly more women develop the disorder thanmen. Vázquez Barquero et al.’s research also pro-vided the average age of the 96 subjects that makeup the study. Since having suffered from the onsetof the disorder within the previous year was oneof the requirements for inclusion in the study, thefigures can be taken as an approximation to theage at onset, although it is slightly overestimated.The average age obtained is 26, with an earlieronset in males (24 among men versus 27 amongwomen).
The growing number of case records in Spain aris-ing in recent years provides new perspectives forepidemiological research and makes it possible tomore reliably estimate the actual figures relating toschizophrenic disorders in the country. However, atleast for now, there is no record encompassing theentire national territory. Annual prevalence figuresfor 1998 compiled from the records of differentSpanish provinces are consistent with regularly as-sumed worldwide prevalence values, ranging ap-proximately from 2 to 4.5 per 1,000 (MorenoKüstner et al. 2005) (see table 5.5).
As for the evolution of the disorder’s epidemiologyover time in Spain, Iglesias García (Iglesias García,2001), using data collected by the CumulativeRecord of Psychiatric Cases in Asturias (RegistroAcumulativo de Casos Psiquiátricos de Asturias—RACPAS) from 1987 to 1997 (which includes in-formation about new cases aged 15-64—ICD-9 di-agnosis—in all the public hospitals and clinics ofthe northwestern region of Asturias), found that theannual incidence tended to decline among thepopulation of Asturias during the period under con-sideration. The administrative incidence of the dis-order declined from 3.60 per 10,000 (1987) to1.81 per 10,000 (1997). Although the decline inthe total population is statistically significant, dif-ferential results appear when this information isbroken down into age groups. The declining inci-dence affects all ages except the 15-24 age group.The author views the hypothesis of genetic antici-pation and higher consumption of psychotropicdrugs among younger individuals as possible expla-nations, as they could inflate the schizophrenic in-cidence figure due to overinclusion in this diagno-sis of psychotic episodes due to intoxication. Thedownward trend can also be seen both in thesubsample of men and women. Iglesias García ob-served that the total number of men diagnosed withschizophrenia virtually doubles the figure for women(63.1% versus 36.9%).
In spite of the relative dearth of epidemiologicalstudies performed in Spain, the existent researchdoes seem to point to the fact that no significantdifferences exist compared with other developedcountries.
Psychiatric case records, Prevalenceby regions (per 1,000 inhabitants)
Alava 1.98
Asturias 2.16
Granada-South 2.40
Navarre 2.70
La Rioja 3.10
Guipuzcoa 3.22
Biscay 4.51
Source: Moreno Küstner et al. (2005).
TABLE 5.5: Annual prevalence of schizophrenia and relateddisorders according to Spanish case records, 1998

68
REDUCING THE BURDEN OF MENTAL ILLNESS IN SPAIN
5.3 COMPARATIVE COST-EFFECTIVENESSANALYSIS OF INTERVENTIONSFOR SCHIZOPHRENIA
In previous sections we have already described thebasics of this methodology with the objectives andapproaches of the WHO-CHOICE programme. Fol-lowing this philosophy, our study seeks to performa cost-effectiveness analysis of interventions capa-ble of reducing the burden of schizophrenia disor-der in the Spanish population. The purpose of thisanalysis is to assign a relative position to each ofthe interventions in an order of priority of applica-tion. This information is particularly useful whenthe level of analysis is that of a national population.
Mood disorders and psychoses have taken the li-on’s share of the cost-effectiveness analyses thathave appeared in the mental health field. Severalstudies have analysed the differential cost-effective-ness associated with various schizophrenia interven-tions in different countries, such as Australia (An-drews et al. 2003; Andrews et al. 2004; Magnus etal. 2005), Mexico (Palmer et al. 2002), and evenSpain (Sacristan, Gomez and Salvador-Carulla1997). However, we should note with regard to theSpanish study that the criterion for measuring ef-fectiveness chosen by the authors was different
from the one applied in our research. Since themethodology for cost-effectiveness analysis in theWHO’s Global Burden of Disease (GBD) study hadnot been developed at the time of the study’s ap-pearance, these authors were unable, obviously, toconsider the amount of DALYs avoided taking as areference unit the number of months elapsed withpartial remission. Until our study, this methodologyhad not been applied to any study of the Spanishpopulation.
5.4 DIFFERENTIATED OBJECTIVES
This research set for itself the following differenti-ated objectives:
• Quantification of DALYs associated with schizo-phrenia in Spain in the year 2000.
• Comparative study of the cost-effectiveness ofdifferent interventions for handling schizophre-nia in our setting, using DALYs and QALYs asmeasures of effectiveness.
• Application to the Spanish health system of thenew methodology developed by the World HealthOrganization within the WHO-CHOICE project toanalyse the impact of therapeutic interventionsat the population level.

69
6Research Methodology
6.1 POPULATION
The demographic data needed for our research (thegeneral population in Spain in the year 2000 andits distribution by gender and age group) were ob-tained from census figures drawn up by the Na-tional Statistics Institute (INE). These census fig-ures are publicly accessible and can be consultedat the INE’s website (www.ine.es).
6.2 METHODOLOGY FOR ESTIMATINGTHE BURDEN OF DISEASE
The applied methodology for estimating the DALYsis identical to the one considered in estimating theburden of depression, which we discussed in therelevant section.
6.3 METHODOLOGY FOR ESTIMATINGTHE PREVALENCE AND INCIDENCEOF SCHIZOPHRENIA IN SPAIN
The epidemiology of schizophrenia can be ad-dressed through prevalence as well as incidencestudies. Since the total number of cases in a popu-lation is partially determined by the number of newcases, an obvious link is established between preva-lence and incidence values, or, what is in essencethe same, the rate of prevalence can be estimatedthrough the incidence and vice-versa. The calcula-tion of the prevalence or incidence rate involvesdifferent methodological approaches. Incidence
studies focus on cases involving the first episodeof the disorder. Such an assumption can involvecertain practical restrictions, but in exchange, itprovides additional advantages, such as the abilityto estimate the age of onset. The methodologicalrigour of most incidence studies accounts for theconsistency of their results. In order to benefit fromthis advantage, for our research we estimated theprevalence of schizophrenia in the Spanish popu-lation based on the data from an incidence study.To calculate one starting with the other, a diseasemodel was used that applies the specific method-ology of the WHO’s GBD study and assumes acausal link between prevalence and incidence. Thisassumption is of a causal but not a linear link, sincethe competitive effect of other diseases is takeninto consideration, thus arriving at a more realisticmodel. These types of models have already beensuccessfully applied to the study of variousdiseases, including some subtypes of cancer(Kruijshaar, Barendregt and Hoeymans 2002;Kruijshaar, Barendregt and Van De Poll-Franse2003) or non-insulin-dependent diabetes mellitus(Barendregt, Baan and Bonneux 2000). However,they had not been used until now in mental health.
The model was implemented using a software ap-plication called DISMOD, designed by Barendregtet al. within the WHO’s Global Programme on Evi-dence for Policy (GPE) (Barendregt et al. 2003).DISMOD was designed to provide consistent esti-mates of incidence, duration and mortality rates inburden of disease studies. It uses an approachbased on mortality tables to monitor an initiallyhealthy cohort over time, applying to this cohort therisks associated with a specific disease (e.g., inci-dence, remission, rate of lethality) as well as the
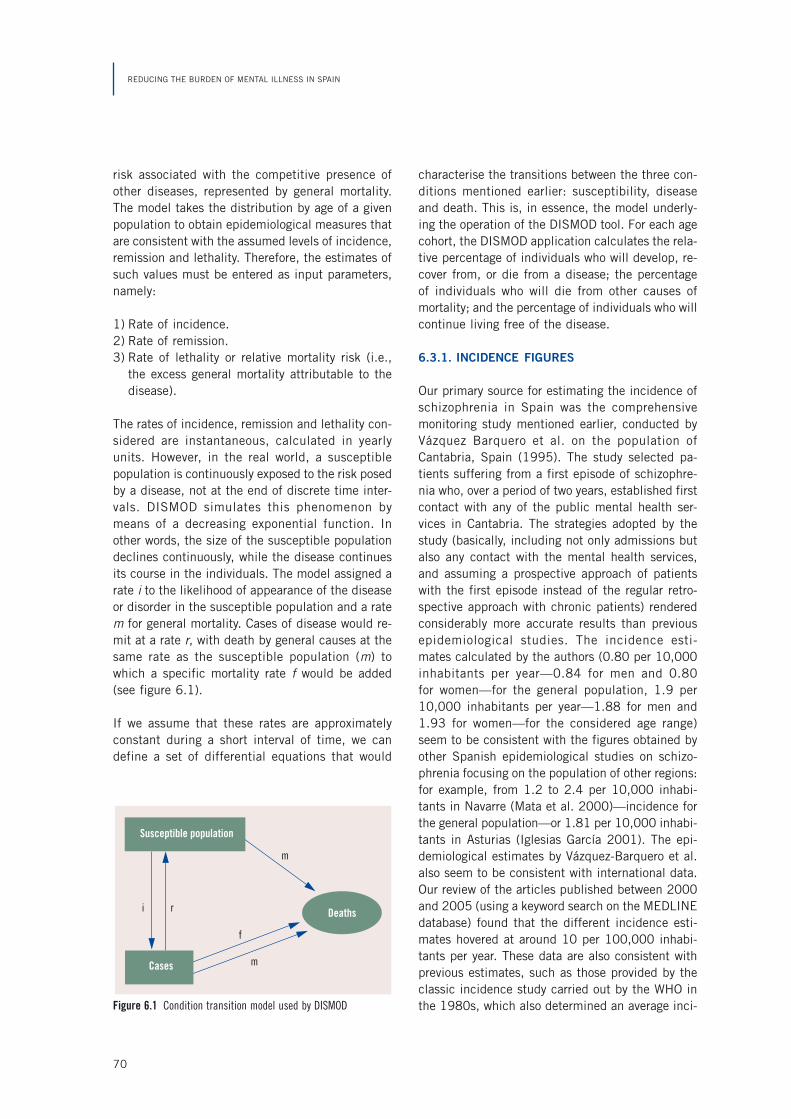
70
REDUCING THE BURDEN OF MENTAL ILLNESS IN SPAIN
risk associated with the competitive presence ofother diseases, represented by general mortality.The model takes the distribution by age of a givenpopulation to obtain epidemiological measures thatare consistent with the assumed levels of incidence,remission and lethality. Therefore, the estimates ofsuch values must be entered as input parameters,namely:
1) Rate of incidence.2) Rate of remission.3) Rate of lethality or relative mortality risk (i.e.,
the excess general mortality attributable to thedisease).
The rates of incidence, remission and lethality con-sidered are instantaneous, calculated in yearlyunits. However, in the real world, a susceptiblepopulation is continuously exposed to the risk posedby a disease, not at the end of discrete time inter-vals. DISMOD simulates this phenomenon bymeans of a decreasing exponential function. Inother words, the size of the susceptible populationdeclines continuously, while the disease continuesits course in the individuals. The model assigned arate i to the likelihood of appearance of the diseaseor disorder in the susceptible population and a ratem for general mortality. Cases of disease would re-mit at a rate r, with death by general causes at thesame rate as the susceptible population (m) towhich a specific mortality rate f would be added(see figure 6.1).
If we assume that these rates are approximatelyconstant during a short interval of time, we candefine a set of differential equations that would
characterise the transitions between the three con-ditions mentioned earlier: susceptibility, diseaseand death. This is, in essence, the model underly-ing the operation of the DISMOD tool. For each agecohort, the DISMOD application calculates the rela-tive percentage of individuals who will develop, re-cover from, or die from a disease; the percentageof individuals who will die from other causes ofmortality; and the percentage of individuals who willcontinue living free of the disease.
6.3.1. INCIDENCE FIGURES
Our primary source for estimating the incidence ofschizophrenia in Spain was the comprehensivemonitoring study mentioned earlier, conducted byVázquez Barquero et al. on the population ofCantabria, Spain (1995). The study selected pa-tients suffering from a first episode of schizophre-nia who, over a period of two years, established firstcontact with any of the public mental health ser-vices in Cantabria. The strategies adopted by thestudy (basically, including not only admissions butalso any contact with the mental health services,and assuming a prospective approach of patientswith the first episode instead of the regular retro-spective approach with chronic patients) renderedconsiderably more accurate results than previousepidemiological studies. The incidence esti-mates calculated by the authors (0.80 per 10,000inhabitants per year—0.84 for men and 0.80for women—for the general population, 1.9 per10,000 inhabitants per year—1.88 for men and1.93 for women—for the considered age range)seem to be consistent with the figures obtained byother Spanish epidemiological studies on schizo-phrenia focusing on the population of other regions:for example, from 1.2 to 2.4 per 10,000 inhabi-tants in Navarre (Mata et al. 2000)—incidence forthe general population—or 1.81 per 10,000 inhabi-tants in Asturias (Iglesias García 2001). The epi-demiological estimates by Vázquez-Barquero et al.also seem to be consistent with international data.Our review of the articles published between 2000and 2005 (using a keyword search on the MEDLINEdatabase) found that the different incidence esti-mates hovered at around 10 per 100,000 inhabi-tants per year. These data are also consistent withprevious estimates, such as those provided by theclassic incidence study carried out by the WHO inthe 1980s, which also determined an average inci-Figure 6.1 Condition transition model used by DISMOD
Deaths
Cases
Susceptible population
m
m
f
ri

71
RESEARCH METHODOLOGY
dence of schizophrenia for European countries ofapproximately 10 per 100,000 inhabitants/year.
6.3.2. RELATIVE MORTALITY RISK
To estimate the relative risk of mortality (whichshould be entered as an input parameter in theDISMOD tool to achieve the estimate sought forprevalence figures), the results provided by theWHO GBD study in 2000, based on meta-analyses(Harris and Barraclough 1998; Inskip, Harris andBarraclough 1998), were accepted given the lackof studies focusing on the Spanish population. Thevalue taken as the relative mortality risk associatedwith schizophrenia was 1.4. Our own review of in-ternational publications on the issue appearing from1998 (the year in which the meta-analyses takenas reference by the GBD study appeared) to 2004(using the MEDLINE database) provided a range ofoutcomes that varied between 1.54 (for men) and1.62 (for women) (Kelly et al. 1998) and 4.41(Enger et al. 2004). However, since none of the ar-ticles found in our review involved a meta-analysis,we decided to take 1.4 as a valid input parameter.
6.3.3. REMISSION
Remission (another of the input parameters neededto estimate the prevalence values) in developedcountries was estimated using the WHO GBD study,placing it at 10% of cases over a period of 11.5
years, which in turn corresponds to an instantane-ous rate per person of 1 per 100 (the GBD consid-ers remission the fact that the subject stops beingtreated as a case and goes back to forming part ofthe “susceptible population”). Our review of the lit-erature on the subject between 2000 and 2004(once again, availing ourselves of a MEDLINE key-word search) provided heterogeneous results, noneof which contradicted the GBD estimate.
6.3.4. PREVALENCE FIGURES
The prevalence figure was estimated using theDISMOD tool described earlier. We assumed a rela-tive mortality risk of 1.4 (except for the 0-4 and 5-14 age groups, for which we respectively assumeda rate of 0 [they are not considered schizophreniacases] and 1 [same mortality as in the generalpopulation]) and a remission rate of 10 per 1,000(except in the 0-4 age group, for which no schizo-phrenia cases were considered to exist) as inputparameters. The prevalence figures obtained perage group are shown in figure 6.2 for both men(brown line) and women (blue line).
The estimated average prevalence was 3.00 per1,000 inhabitants per year in the case of men, andslightly lower in the case of women: 2.86 per1,000. The average age at onset of the disorder(24.04 for men, 27.00 for women) and the outputvalues obtained for incidence (0.084 per 1,000 for
Figure 6.2 Estimated preva-lence for the Spanish popula-tion in 2000 by age
0-4 5-14 15-29 30-44 45-59 60-69 70-79 80+
5
4.5
4
3.5
3
2.5
2
1.5
1
0.5
0
Age
Prev
alen
ce
WomenMen
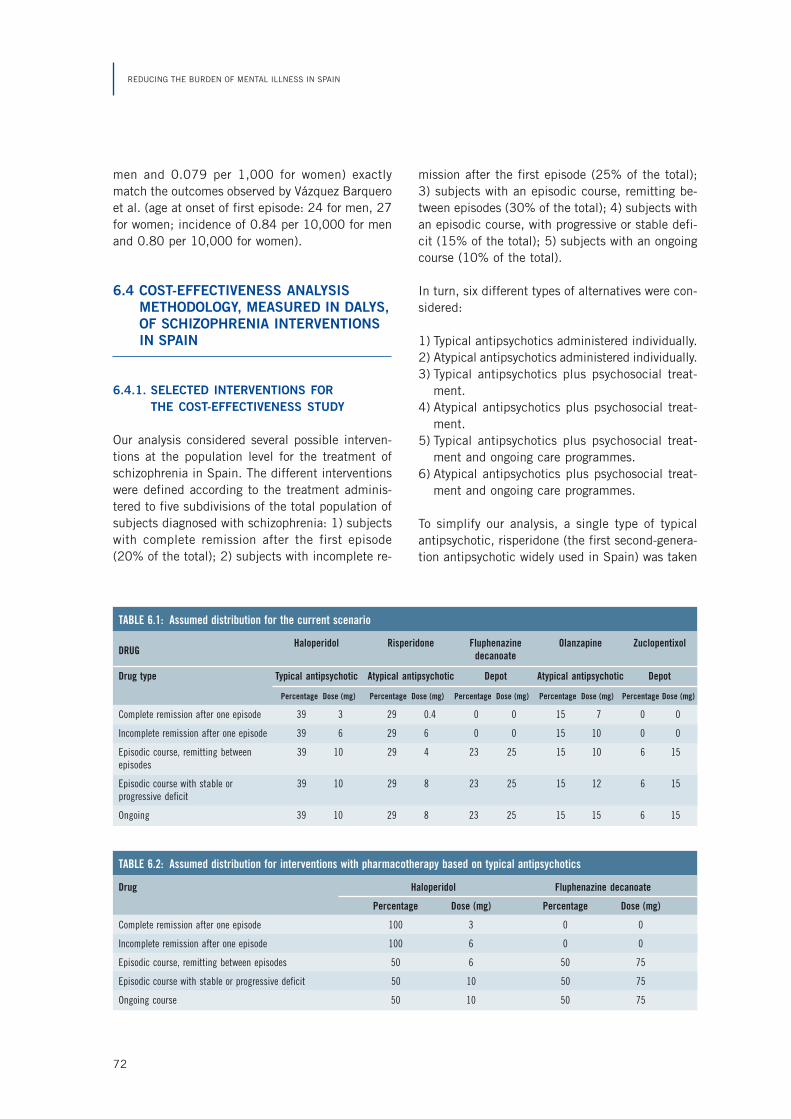
72
REDUCING THE BURDEN OF MENTAL ILLNESS IN SPAIN
men and 0.079 per 1,000 for women) exactlymatch the outcomes observed by Vázquez Barqueroet al. (age at onset of first episode: 24 for men, 27for women; incidence of 0.84 per 10,000 for menand 0.80 per 10,000 for women).
6.4 COST-EFFECTIVENESS ANALYSISMETHODOLOGY, MEASURED IN DALYS,OF SCHIZOPHRENIA INTERVENTIONSIN SPAIN
6.4.1. SELECTED INTERVENTIONS FORTHE COST-EFFECTIVENESS STUDY
Our analysis considered several possible interven-tions at the population level for the treatment ofschizophrenia in Spain. The different interventionswere defined according to the treatment adminis-tered to five subdivisions of the total population ofsubjects diagnosed with schizophrenia: 1) subjectswith complete remission after the first episode(20% of the total); 2) subjects with incomplete re-
mission after the first episode (25% of the total);3) subjects with an episodic course, remitting be-tween episodes (30% of the total); 4) subjects withan episodic course, with progressive or stable defi-cit (15% of the total); 5) subjects with an ongoingcourse (10% of the total).
In turn, six different types of alternatives were con-sidered:
1) Typical antipsychotics administered individually.2) Atypical antipsychotics administered individually.3) Typical antipsychotics plus psychosocial treat-
ment.4) Atypical antipsychotics plus psychosocial treat-
ment.5) Typical antipsychotics plus psychosocial treat-
ment and ongoing care programmes.6) Atypical antipsychotics plus psychosocial treat-
ment and ongoing care programmes.
To simplify our analysis, a single type of typicalantipsychotic, risperidone (the first second-genera-tion antipsychotic widely used in Spain) was taken
TABLE 6.1: Assumed distribution for the current scenario
DRUGHaloperidol Risperidone Fluphenazine Olanzapine Zuclopentixol
decanoate
Drug type Typical antipsychotic Atypical antipsychotic Depot Atypical antipsychotic Depot
Percentage Dose (mg) Percentage Dose (mg) Percentage Dose (mg) Percentage Dose (mg) Percentage Dose (mg)
Complete remission after one episode 39 3 29 0.4 0 0 15 7 0 0
Incomplete remission after one episode 39 6 29 6 0 0 15 10 0 0
Episodic course, remitting between 39 10 29 4 23 25 15 10 6 15episodes
Episodic course with stable or 39 10 29 8 23 25 15 12 6 15progressive deficit
Ongoing 39 10 29 8 23 25 15 15 6 15
TABLE 6.2: Assumed distribution for interventions with pharmacotherapy based on typical antipsychotics
Drug Haloperidol Fluphenazine decanoate
Percentage Dose (mg) Percentage Dose (mg)
Complete remission after one episode 100 3 0 0
Incomplete remission after one episode 100 6 0 0
Episodic course, remitting between episodes 50 6 50 75
Episodic course with stable or progressive deficit 50 10 50 75
Ongoing course 50 10 50 75
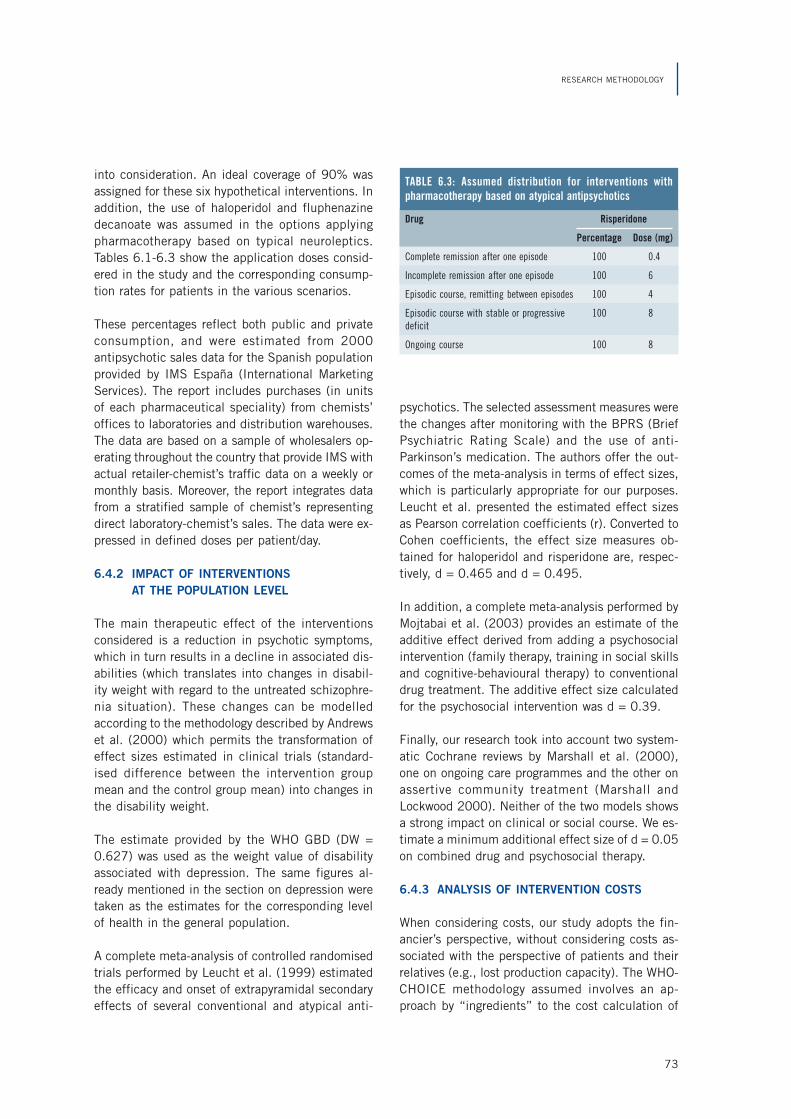
73
RESEARCH METHODOLOGY
into consideration. An ideal coverage of 90% wasassigned for these six hypothetical interventions. Inaddition, the use of haloperidol and fluphenazinedecanoate was assumed in the options applyingpharmacotherapy based on typical neuroleptics.Tables 6.1-6.3 show the application doses consid-ered in the study and the corresponding consump-tion rates for patients in the various scenarios.
These percentages reflect both public and privateconsumption, and were estimated from 2000antipsychotic sales data for the Spanish populationprovided by IMS España (International MarketingServices). The report includes purchases (in unitsof each pharmaceutical speciality) from chemists’offices to laboratories and distribution warehouses.The data are based on a sample of wholesalers op-erating throughout the country that provide IMS withactual retailer-chemist’s traffic data on a weekly ormonthly basis. Moreover, the report integrates datafrom a stratified sample of chemist’s representingdirect laboratory-chemist’s sales. The data were ex-pressed in defined doses per patient/day.
6.4.2 IMPACT OF INTERVENTIONSAT THE POPULATION LEVEL
The main therapeutic effect of the interventionsconsidered is a reduction in psychotic symptoms,which in turn results in a decline in associated dis-abilities (which translates into changes in disabil-ity weight with regard to the untreated schizophre-nia situation). These changes can be modelledaccording to the methodology described by Andrewset al. (2000) which permits the transformation ofeffect sizes estimated in clinical trials (standard-ised difference between the intervention groupmean and the control group mean) into changes inthe disability weight.
The estimate provided by the WHO GBD (DW =0.627) was used as the weight value of disabilityassociated with depression. The same figures al-ready mentioned in the section on depression weretaken as the estimates for the corresponding levelof health in the general population.
A complete meta-analysis of controlled randomisedtrials performed by Leucht et al. (1999) estimatedthe efficacy and onset of extrapyramidal secondaryeffects of several conventional and atypical anti-
psychotics. The selected assessment measures werethe changes after monitoring with the BPRS (BriefPsychiatric Rating Scale) and the use of anti-Parkinson’s medication. The authors offer the out-comes of the meta-analysis in terms of effect sizes,which is particularly appropriate for our purposes.Leucht et al. presented the estimated effect sizesas Pearson correlation coefficients (r). Converted toCohen coefficients, the effect size measures ob-tained for haloperidol and risperidone are, respec-tively, d = 0.465 and d = 0.495.
In addition, a complete meta-analysis performed byMojtabai et al. (2003) provides an estimate of theadditive effect derived from adding a psychosocialintervention (family therapy, training in social skillsand cognitive-behavioural therapy) to conventionaldrug treatment. The additive effect size calculatedfor the psychosocial intervention was d = 0.39.
Finally, our research took into account two system-atic Cochrane reviews by Marshall et al. (2000),one on ongoing care programmes and the other onassertive community treatment (Marshall andLockwood 2000). Neither of the two models showsa strong impact on clinical or social course. We es-timate a minimum additional effect size of d = 0.05on combined drug and psychosocial therapy.
6.4.3 ANALYSIS OF INTERVENTION COSTS
When considering costs, our study adopts the fin-ancier’s perspective, without considering costs as-sociated with the perspective of patients and theirrelatives (e.g., lost production capacity). The WHO-CHOICE methodology assumed involves an ap-proach by “ingredients” to the cost calculation of
Drug Risperidone
Percentage Dose (mg)
Complete remission after one episode 100 0.4
Incomplete remission after one episode 100 6
Episodic course, remitting between episodes 100 4
Episodic course with stable or progressive 100 8deficit
Ongoing course 100 8
TABLE 6.3: Assumed distribution for interventions withpharmacotherapy based on atypical antipsychotics

74
REDUCING THE BURDEN OF MENTAL ILLNESS IN SPAIN
interventions in the health field that requires sepa-rate identification and assessment of the amountof inputs of the involved resources (e.g., healthcarepersonnel figures) and the unit price or cost of suchresources (e.g., the salary of a healthcare profes-sional). It assumes two categories of resource andcost inputs: costs per patient, which refer to theinput of resources used or provided at the patientor supplier level (including days admitted, outpa-tient visits, medications, laboratory tests; the unitcosts of these resource inputs at the patient levelinclude the costs per day of hospitalization or peroutpatient visit, or the price of prescribed drugs andof any test carried out by the laboratory) and pro-gramme costs, which refer to the resources used inimplementing an intervention above the patient orsupplier level; these resources include central plan-ning, policy and function administration issues, aswell as resources that go to training healthcare serv-ice providers and preventive programmes.
The estimates at the programme level are based onexisting guidelines (e.g., regarding the duration oftraining). A unit cost line item was also generatedfor every resource item in Spain in order to esti-mate the total cost of activities at the programmelevel. Unit costs for mental healthcare were esti-mated by the PSICOST group (Salvador-Carulla etal. 1999; Saldivia et al. 2005). These units havebeen used in the financial analysis of mental healthinterventions in Spain (Vazquez-Polo et al. 2005).The SOIKOS unit cost database was used to deter-mine the cost for the rest of the healthcare serv-ices used. All of these elements of the total costare estimated and assembled in a series of tem-plates implemented in spreadsheets (CostIt) de-signed specifically by the WHO-CHOICE programme(available at www.who.int/evidence/ceachoice). Adiscount of 3% was considered in all the baselinecost analyses for the 10-year implementation pe-riod. All costs were estimated in euros.
6.4.4 SENSITIVITY AND UNCERTAINTY ANALYSIS
In our study we performed three different types ofsensitivity analyses. The first considered the impactof applying social preference measures in calculat-ing DALYs on the final estimate of the cost-effec-tiveness ratios: age discount (i.e., granting moreweight to ages that are closer to the current age ofthe subject and less weight to ages that are farther
away) and weight by age (which weighs each ageby a predetermined coefficient, granting moreweight to the central life years of individuals as theyare considered to be the most productive). The sec-ond sensitivity analysis looked at the variation inthe price of a dose of risperidone between two pos-sible values. Two different costs were estimated: thefirst considering its price as a patented drug, andthe second, considering its price as a generic drug.The generic version of risperidone has recently ap-peared on the Spanish mental health market; it wasnot available in the year 2000, the date our studyfocuses on. However, by weighting the prices of thedifferent versions of generic risperidone currentlyavailable on the Spanish market, we estimated aprice for the year 2000 (0.63 euros per 2-mg dose,while the estimated cost for the same dose of pat-ented risperidone was 1.76 euros). The purpose ofthis sensitivity analysis was to determine if the vari-ation in the cost per dose resulting from the appear-ance of generic versions of atypical antipsychoticcaused a significant variation in the estimated cost-effectiveness of interventions based on applyingthese drugs. Finally, a third sensitivity analysis wasconducted, leading to a ±10% variation on the ef-fect size of each treatment over the disability weight.
With regard to the uncertainty analysis, the meth-odological considerations made in the section ondepression are also applied to the analysis ofschizophrenia.
6.4.5 CONSTRAINTS
The constraints due to the inherent presence ofuncertainty in the estimates of some parametershave already been discussed. Moreover, the uncer-tainty analysis applied to our outcomes in order tooffset these constraints has already been describedin previous sections.
Due to the lack of rigorous epidemiology studiesencompassing the Spanish population at the na-tional level, most of the data needed to calculateour estimates were extrapolated either from regionalstudies or from international meta-analyses. How-ever, until it becomes feasible to have robust evi-dence at a truly national level, our results can beconsidered a valid means to approach the differ-ences in terms of cost-effectiveness of the differ-ent schizophrenia treatments in Spain.
75
RESEARCH METHODOLOGY
Among the limitations of our study, we must alsomention those inherent to the methodology used.The use of models can be a useful solution whenfacing certain problems in epidemiological re-search, but any model implies assumptions andhypotheses that cannot always be verified in real-life situations. A model always represents a simpli-fication, to a certain degree, of reality. For exam-ple, in our case it would have been enriching toassume a broader economic perspective and alsocontemplate indirect costs related to patients’ lossof productivity, etc., instead of adopting a perspec-tive that focused primarily on the healthcare sys-tem. It is also obvious that our model does not coverall the possible intervention alternatives that couldbe applied. For example, it does not contemplatethe effect of a possible change in the assignedmedication (e.g., patients who switch from typicalto atypical antipsychotics).
The use of multidimensional and population-basedmeasures of the burden of disease, such as DALYs,presents clear advantages (the chance of compar-ing the burden of different diseases of a dramati-cally different nature, for instance), but it also in-volves assumptions that are not always admissible,such as the additive nature of these measures (e.g.,can it be accepted a priori that the sum of the bur-den due to several mild disorders affecting broadswathes of the population equals that caused by asevere disorder affecting a small number of indi-viduals?). Neither do these types of measures fullycover the entire range of possibilities that can bederived from an intervention. We have already com-mented earlier on the need to assess other types ofphenomena related to patients’ lives. In the con-text of schizophrenia, there are important additionalbenefits including the reduction of the family bur-den, absenteeism and unemployment (with the at-tendant rise in productivity). In spite of the clearsocial focus of the WHO-CHOICE programme, chal-lenges still remain, such as implementing measure-ment procedures for including cost-effectivenessanalyses of productivity gains, as well as the timespent on care (both by the patient and by “infor-mal care givers”) (Tan Torres, Baltussen and Adam2003). In an attempt to make up in part for theseshortcomings, we performed an alternative analysisassessing efficacy in terms of QoL improvementsaccording to the QALY methodology, as discussedin the following section.
In addition to the intrinsic constraints of our meth-odology, it is necessary to consider other restraintsdue to estimates of the different input parametersused as a basis for applying this methodology. Oneof these, for example, would be the use of interna-tional estimates given the lack of specific data forSpain. To take a case in point, our study used thedisability weights proposed by the WHO GBD studyinstead of calculating specific values for the Span-ish population. Since these reflect values that de-pend on subjective assessments, cultural variationscould exist. However, the calculation of theseweights would have exceeded the bounds of theobjectives proposed in the present study.
6.5 COST-EFFECTIVENESS ANALYSISMETHODOLOGY, MEASURED IN QALYS,OF SCHIZOPHRENIA INTERVENTIONSIN SPAIN
The improved QoL of patients obtained thanks to areduction in clinical symptoms is also one of thegoals of schizophrenia treatments. Some recentstudies indicate that an improvement of symptomsis correlated with improvements in QoL (Pyne et al.2003; Saleem, Olie and Loo 2002). However, thiscorrelation is often weak, so it would be advisableto assess the impact of treatment on the QoL ofpatients by means of specific and independentmethods. With this in mind, our work includes asecond cost-effectiveness analysis of schizophreniainterventions in Spain in which the improved QoLof patients, assessed in QALYs, which has alreadybeen described in the section on depression, waschosen as a measure of efficacy.
The SOHO (European Schizophrenia OutpatientHealth Outcomes) study, which we have alreadymentioned in earlier sections, was taken as a sourceof data, the goal being to overcome some of the limi-tations inherent to randomised clinical trials withantipsychotic drugs (short duration of monitoring,use of selected patient samples, restrictions ongeneralising outcomes due to the administration ofhighly specific treatment regimes, absence of meas-ures to assess QoL and social functioning) (Haro etal. 2003). The SOHO study constitutes the largestnaturalist study conducted to date on antipsychoticmedication. It was based on prospectively monitor-

76
REDUCING THE BURDEN OF MENTAL ILLNESS IN SPAIN
ing patients from ten European countries over aperiod of three years, during which they were ad-ministered an outpatient antipsychotic treatment.
For our analysis we have considered only the QoLmeasures of the Spanish sample of SOHO, assessedwith the EQ-5D (EuroQol-5 Dimensions) tool(Williams 1990). Since only the application of drugtherapy is taken into account in the SOHO study,and not psychosocial interventions, our study on QoLfocused only on two alternative interventions: typi-cal antipsychotics (haloperidol) and atypical anti-psychotics (risperidone). The baseline of the Spanishsample (average EQ-5D score: 0.59) was taken as a
Drug Measure N Median Average Standarddeviation
Haloperidol Baseline 363 0.70 0.58 0.34
12 months 329 0.83 0.76 0.28
Risperidone Baseline 1,830 0.70 0.60 0.32
12 months 1,591 0.83 0.79 0.25
TABLE 6.4: EQ-5D scores (baseline and after 12 months oftracking)
measure of the QoL of individuals with schizophrenicdisorders before they received any type of treatment.The average EQ-5D scores by age range and genderobtained from the Spanish sample of the ESEMeD/ MHEDEA 2000 study (European Study of Epide-miology of Mental Disorders) (Alonso et al. 2002)were considered as measures of QoL in the nationalgeneral population. The effectiveness of the two in-terventions being compared was estimated based onthe variation obtained in the EQ-5D scores after 12months of treatment (total European samples ofpatients treated with haloperidol and risperidonewere considered as they presented a considerablyhigher N, thus enabling a more reliable estimate ofthe effect size) (see table 6.4).
The same software tools provided by the WHO-CHOICE programme for the cost-utility analysis canbe used on this input data. In the results obtainedhere, the effectiveness reflects the variation in qual-ity-adjusted life years (QALYs). As for the costs as-sociated with the interventions, the same that wereconsidered for the analysis in terms of DALYs wereassumed. For risperidone, the cost of the patentedversion of the drug was assumed.

77
7Results
7.1 BURDEN OF DISEASEFOR SCHIZOPHRENIA IN SPAININ THE YEAR 2000
According to our results, the burden of disease as-sociated with schizophrenia in Spain for 2000 isestimated at 60,215.90 DALYs—30,740.49 inmen and 29,475.41 in women—which means a rawrate per 100,000 inhabitants of 155.89 (men) and143.47 (women).
By age group, the highest number of DALYs corre-sponds to the 15-44 age range for both sexes.Table 7.1 shows the distribution by age group ofyears lived with disability, years of life lost andDALYs corresponding to the male population, whiletable 7.2 shows the data corresponding to the fe-male population.
7.2 COST-EFFECTIVENESS ANALYSIS,MEASURED IN DALYS,OF SCHIZOPHRENIA INTERVENTIONSIN SPAIN
7.2.1 COST OF INTERVENTIONS
The estimated annual costs for each of the consid-ered interventions are shown in table 7.3. The totalannual cost of each of the considered options wasbroken down into three components, namely: costper patient, cost associated with the programme,and cost associated with the required specialisedprofessional training. The estimated cost of thepresent scenario amounted to 210 million euros.Costs associated with alternative interventionsranged from 161 million euros (typical neurolepticswith a 90% rate of coverage) and 323 million euros
TABLE 7.1: Burden of disease outcome for schizophrenia in Spain. Men
Age group YLDs due to YLLs due to DALYs DALYs perschizophrenia schizophrenia 100,000 inhabitants
0-4 1,335.67 0.00 1,335.67 139.72
5-14 3,402.69 0.00 3,402.69 161.83
15-29 20,221.63 35.94 20,257.57 429.91
30-44 5,233.17 128.79 5,361.96 114.12
45-59 82.85 149.09 231.95 6.67
60-69 2.08 73.27 75.34 3.99
70-79 0.00 64.36 64.36 4.70
80 + 0.05 10.90 10.96 2.12
TOTAL 30,278.08 462.36 30,740.49 155.89
YLDs: Years of Life Lost due to Disability. YLLs: Years of Life Lost due to death. DALYs: Disability-Adjusted Life Years.

78
REDUCING THE BURDEN OF MENTAL ILLNESS IN SPAIN
(risperidone and psychosocial intervention with on-going care programme).
The differences observed between costs basicallydepend on the psychopharmaceutical product pro-vided in the intervention. The options based on ap-plying risperidone have appreciably higher associ-ated costs than those using typical antipsychoticsas the drugs of choice. However, as expected, theuse of a generic drug instead of patented risperi-done results in a steep decline in costs: from 291to 193 million euros (in the option applying pharma-cotherapy alone); from 307 to 208 million euros(in the option including risperidone and psychoso-cial intervention); and from 323 to 224 million
euros (in the option combining the administration ofrisperidone and psychosocial intervention with theongoing care programme).
However, the addition of psychosocial treatment orof an ongoing care programme does not give rise toan appreciable increase of total costs.
7.2.2 EFFECTIVENESS OF INTERVENTIONS(AVOIDED BURDEN)
The amount of DALYs avoided per year by applyingeach of the considered interventions is shown intable 7.4. If we do not take into considerationweighting by age or discounts, the intervention
TABLE 7.2: Burden of disease outcome for schizophrenia in Spain. Women
Age group YLDs due to YLLs due to DALYs DALYs perschizophrenia schizophrenia 100,000 inhabitants
0-4 150.20 0.00 150.20 16.63
5-14 3,101.35 0.00 3,101.35 155.82
15-29 17,771.03 0.00 17,771.03 394.05
30-44 7,545.06 0.00 7,545.06 162.09
45-59 698.03 33.18 731.21 20.53
60-69 17.34 99.34 116.67 5.52
70-79 0.00 33.67 33.67 1.87
80 + 0.00 26.23 26.23 2.59
TOTAL 29,282.99 192.42 29,475.41 143.47
YLDs: Years of Life Lost due to Disability. YLLs: Years of Life Lost due to death. DALYs: Disability-Adjusted Life Years.
TABLE 7.3: Costs associated with the proposed interventions
Description of the intervention Costs (in millions of euros per year)
Patient Programme Training TOTAL
Current situation 206 4 0 210
Typical antipsychotics 149 7 5 161
Risperidone (patented) 279 7 5 291
Risperidone (generic) 180 7 5 193
Typical antipsychotics + psychosocial treatment 153 7 11 171
Risperidone (patented) + psychosocial treatment 289 7 11 307
Risperidone (generic) + psychosocial treatment 190 7 11 208
Typical antipsychotics + psychosocial treatment + ongoing care programme 193 12 16 221
Risperidone (patented) + psychosocial treatment + ongoing care programme 296 12 16 323
Risperidone (generic) + psychosocial treatment + ongoing care programme 197 12 16 224

79
RESULTS
modelling the current situation would avoid 3,008DALYs and the proposed reduction alternativeswould range from 3,302 (typical antipsychotics) to8,538 DALYs (risperidone with psychosocial inter-vention and ongoing care programme).
The differences between the different interventionsare appreciable. The use of risperidone is moder-ately more effective than that of typical antipsychot-ics (the number of DALYs avoided rises from 3,302to 4,018, a 22% increase). The differences in theresults of applying atypical and typical antipsychot-ics are slightly attenuated by adding psychosocialtreatment (with a 17% increase in the number ofDALYs avoided by replacing conventional antipsy-chotics with risperidone). When an ongoing care pro-gramme is also added, the discrepancy in effective-ness between the two types of drugs declines notably(the increase in saved DALYs by replacing conven-tional antipsychotics with risperidone is then 3%).
The greatest differences in terms of effectivenessof the various interventions are determined prima-rily by whether or not psychosocial treatment andongoing care programmes are included. By addingthe psychosocial treatment, the number of DALYssaved nearly doubles (97% increase when tradi-tional antipsychotics are considered, and 90% ifthe administered drug is risperidone). If an ongo-ing care programme (including psychosocial treat-ment) is added, the effectiveness rises by 150%(traditional antipsychotics) and 113% (risperidone)with respect to interventions that consider onlypharmacotherapy. However, the application of theongoing care programme only leads to a slight in-
crease in effectiveness compared to interventionsthat already include psychosocial treatment: 27%(typical antipsychotics) and 12% (risperidone).
The amount of DALYs avoided ranges from 2,808to 7,259 after considering the discount. If the dis-count and weighting by age are considered, the fig-ures range from 3,315 to 8,571 avoided DALYs. Ineither of the two cases, the relative differences be-tween the different interventions we have com-mented remain roughly the same.
7.2.3 COST-EFFECTIVENESS OF INTERVENTIONS
Two interventions stand out as the most cost-effec-tive when the effectiveness results are weightedwith population costs and the relevant average costsper avoided DALY are determined: typical antipsy-chotics plus psychosocial treatment, with or with-out an ongoing care programme (which, respec-tively, would generate a cost per DALY avoidedannually of 26,343 and 26,713 euros). At the op-posite end, the least cost-effective option would beadministration of risperidone alone (72,552 eurosper DALY avoided). The current situation wouldimply a ratio of 69,816 euros per avoided DALY.The results obtained in the rest of the interventionsare approximately similar. These are, expressed ineuros per avoided DALY, as follows: 48,839 (onlytypical antipsychotics), 40,186 (risperidone andpsychosocial treatment) and 37,855 (risperidonewith ongoing care programme).
Replacing the patented version of risperidone withits generic equivalent causes a considerable reduc-
TABLE 7.4: Effectiveness associated with the proposed interventions
Effectiveness (DALYs avoided per year)
Description of the intervention Weighting by age Discount only Without weighting by ageand discount and without discount
Current situation 3,020 2,558 3,008
Typical antipsychotics 3,315 2,808 3,302
Risperidone (patented or generic) 4,033 3,416 4,018
Typical antipsychotics + psychosocial treatment 6,531 5,532 6,506
Risperidone (patented or generic) + psychosocial treatment 7,662 6,489 7,632
Typical antipsychotics + psychosocial treatment + ongoing care programme 8,296 7,027 8,264
Risperidone (patented or generic) + psychosocial treatment + ongoing care 8,571 7,259 8,538programme

80
REDUCING THE BURDEN OF MENTAL ILLNESS IN SPAIN
tion in the cost per DALY saved, so that the ratiosobtained are along the same lines as those esti-mated for interventions based on conventional an-tipsychotics. In fact, in this case the option thatincludes the administration of generic risperidone,psychosocial treatment and an ongoing care pro-gramme is the most cost-effective solution (26,289euros per DALY avoided).
The above figures are estimates obtained when nei-ther weighting by age nor discounts are applied. Inthese cases, the outcomes do not represent a sub-stantial variation from those we have already men-tioned. Table 7.5 shows all the cost-effectivenessratios obtained. Moreover, table 7.6 shows the in-cremental ratios, defined as the quotient of incre-mental change in costs divided by the incrementalchange in effectiveness between interventions. They
indicate the interventions that would be elected (ifwe apply only a cost-effectiveness criterion) if avail-able resources were to increase. They start with themost cost-effective intervention, and then the nextone, and so on. The term dominated denotes thoseinterventions that are more costly and less effec-tive than others, and therefore they are not includedin the expansion path of the most cost-effectivestrategies. The administration of a generic versionof risperidone was not contemplated when estimat-ing the incremental ratios.
7.2.4 SENSITIVITY AND UNCERTAINTY ANALYSES
Figure 7.1 depicts the results of the sensitivityanalysis. The different bars represent the percent-age increase or decrease experienced by the aver-age cost-effectiveness ratio under different assump-
TABLE 7.5: Cost-effectiveness ratios associated with the proposed interventions
Average cost per DALY avoided (in euros)
Description of the intervention Weighting by age Discount only Without weighting by ageand discount and without discount
Current situation 69,546 82,108 69,816
Typical antipsychotics 48,650 57,438 48,839
Risperidone (patented) 72,272 85,326 72,552
Risperidone (generic) 47,789 56,421 47,975
Typical antipsychotics + psychosocial treatment 26,241 30,980 26,343
Risperidone (patented) + psychosocial treatment 40,031 47,261 40,186
Risperidone (generic) + psychosocial treatment 27,143 32,045 27,248
Typical antipsychotics + psychosocial treatment + ongoing care programme 26,610 31,417 26,713
Risperidone (patented) + psychosocial treatment + ongoing care programme 37,709 44,520 37,855
Risperidone (generic) + psychosocial treatment + ongoing care programme 26,188 30,918 26,289
TABLE 7.6: Incremental cost-effectiveness ratios associated with the proposed interventions
Incremental cost per DALY avoided (in euros)
Description of the intervention Weighting by age Discount only Without weighting by ageand discount and without discount
Current situation Dominated Dominated Dominated
Typical antipsychotics Dominated Dominated Dominated
Risperidone (patented) Dominated Dominated Dominated
Typical antipsychotics + psychosocial treatment 26,241 30,980 26,343
Risperidone (patented) + psychosocial treatment Dominated Dominated Dominated
Typical antipsychotics + psychosocial treatment + ongoing care programme 27,977 33,031 28,086
Risperidone (patented) + psychosocial treatment + ongoing care programme Dominated Dominated Dominated
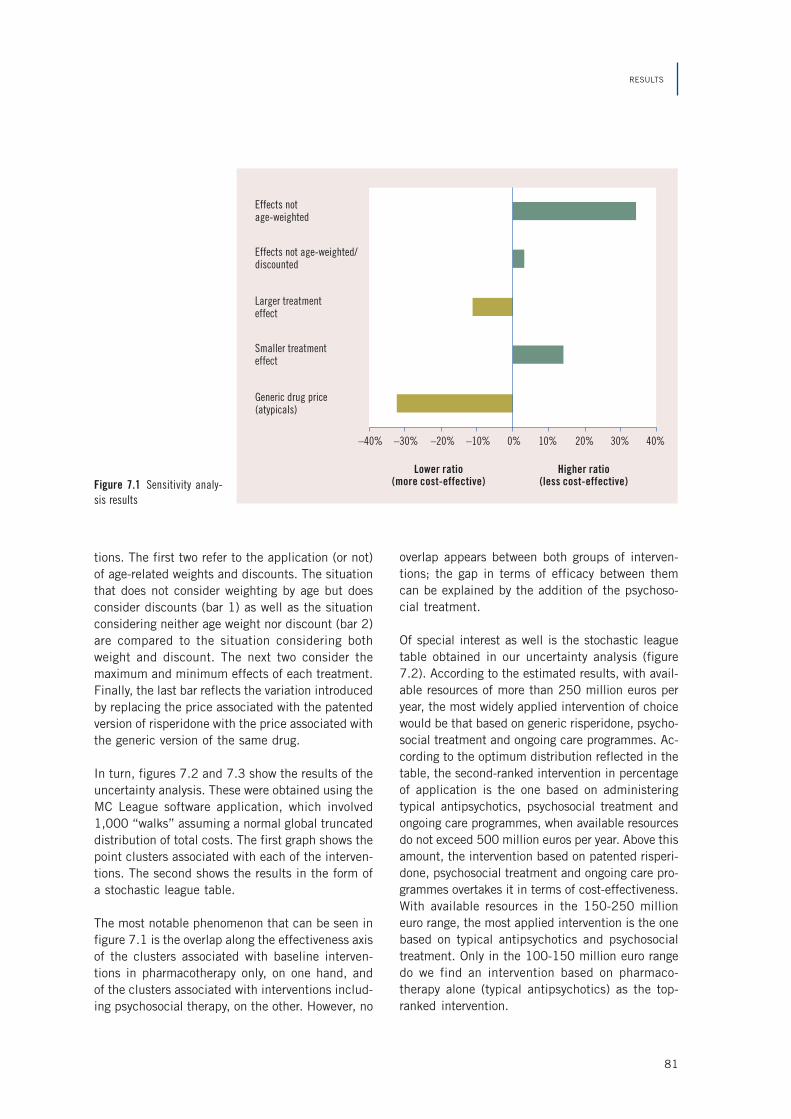
81
RESULTS
tions. The first two refer to the application (or not)of age-related weights and discounts. The situationthat does not consider weighting by age but doesconsider discounts (bar 1) as well as the situationconsidering neither age weight nor discount (bar 2)are compared to the situation considering bothweight and discount. The next two consider themaximum and minimum effects of each treatment.Finally, the last bar reflects the variation introducedby replacing the price associated with the patentedversion of risperidone with the price associated withthe generic version of the same drug.
In turn, figures 7.2 and 7.3 show the results of theuncertainty analysis. These were obtained using theMC League software application, which involved1,000 “walks” assuming a normal global truncateddistribution of total costs. The first graph shows thepoint clusters associated with each of the interven-tions. The second shows the results in the form ofa stochastic league table.
The most notable phenomenon that can be seen infigure 7.1 is the overlap along the effectiveness axisof the clusters associated with baseline interven-tions in pharmacotherapy only, on one hand, andof the clusters associated with interventions includ-ing psychosocial therapy, on the other. However, no
overlap appears between both groups of interven-tions; the gap in terms of efficacy between themcan be explained by the addition of the psychoso-cial treatment.
Of special interest as well is the stochastic leaguetable obtained in our uncertainty analysis (figure7.2). According to the estimated results, with avail-able resources of more than 250 million euros peryear, the most widely applied intervention of choicewould be that based on generic risperidone, psycho-social treatment and ongoing care programmes. Ac-cording to the optimum distribution reflected in thetable, the second-ranked intervention in percentageof application is the one based on administeringtypical antipsychotics, psychosocial treatment andongoing care programmes, when available resourcesdo not exceed 500 million euros per year. Above thisamount, the intervention based on patented risperi-done, psychosocial treatment and ongoing care pro-grammes overtakes it in terms of cost-effectiveness.With available resources in the 150-250 millioneuro range, the most applied intervention is the onebased on typical antipsychotics and psychosocialtreatment. Only in the 100-150 million euro rangedo we find an intervention based on pharmaco-therapy alone (typical antipsychotics) as the top-ranked intervention.
Figure 7.1 Sensitivity analy-sis results
Generic drug price(atypicals)
Smaller treatmenteffect
Larger treatmenteffect
Effects not age-weighted/discounted
Effects notage-weighted
–40% –30% –20% –10% 0% 10% 20% 30% 40%
Lower ratio(more cost-effective)
Higher ratio(less cost-effective)

82
REDUCING THE BURDEN OF MENTAL ILLNESS IN SPAIN
Figure 7.3 Uncertainty analysis results - stochastic league table
Figure 7.2 Uncertainty analysis results - cluster graph
100 200 300 400 500 600
0.6
0.5
0.4
0.3
0.2
0.1
0.0
Risperidone (generic) +psychosocial treatment
Current situation
Available resources (millions of euros)
Prob
abili
ty o
f bei
ng a
cos
t-ef
fect
ive
inte
rven
tion
Risperidone (patented) +psychosocial treatment
Typical antipsychotics +psychosocial treatment
Risperidone (generic)
Risperidone (patented)
Typical antipsychotics
Risperidone (generic) +psychosocial treatment +ongoing care programme
Risperidone (patented) +psychosocial treatment +ongoing care programme
Typical antipsychotics +psychosocial treatment +ongoing care programme
450
400
350
300
250
200
150
100
50
00 2,000
Cost
(Mill
ions
of e
uros
per
yea
r)
Effect (DALYs averted per year)
4,000 6,000 8,000 10,000 12,000
Current situationHaloperidol at 90% coverageRisperidone (patented) at 90% coverageRisperidone (generic) at 90% coverageHaloperidol + psychosocial treatment at
90% coverageRisperidone (patented) + psychosocial treatment
at 90% coverageRisperidone (generic) + psychosocial treatment
at 90% coverageHaloperidol + psychosocial treatment + case
management at 90% coverageRisperidone (patented) + psychosocial treatment
+ case management at 90% coverageRisperidone (generic) + psychosocial treatment
+ case management at 90% coverage
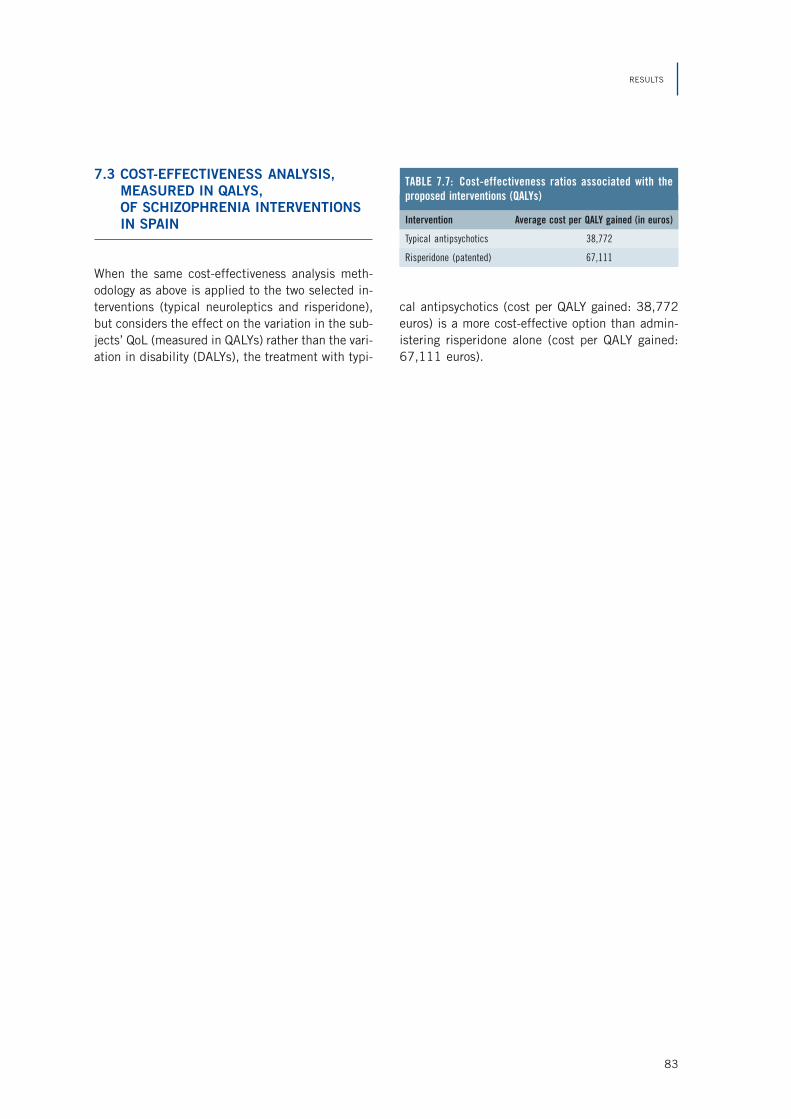
83
RESULTS
7.3 COST-EFFECTIVENESS ANALYSIS,MEASURED IN QALYS,OF SCHIZOPHRENIA INTERVENTIONSIN SPAIN
When the same cost-effectiveness analysis meth-odology as above is applied to the two selected in-terventions (typical neuroleptics and risperidone),but considers the effect on the variation in the sub-jects’ QoL (measured in QALYs) rather than the vari-ation in disability (DALYs), the treatment with typi-
Intervention Average cost per QALY gained (in euros)
Typical antipsychotics 38,772
Risperidone (patented) 67,111
TABLE 7.7: Cost-effectiveness ratios associated with theproposed interventions (QALYs)
cal antipsychotics (cost per QALY gained: 38,772euros) is a more cost-effective option than admin-istering risperidone alone (cost per QALY gained:67,111 euros).


85
8Discussion
The results obtained in the cost-effectiveness analy-sis (measured in terms of costs per DALY saved)enable us to make three key comparisons: tradi-tional vs. new antipsychotics (risperidone); pharma-cotherapy plus psychosocial treatment vs. pharma-cotherapy alone; and pharmacotherapy plus ongoingcare programmes (which include psychosocial treat-ment) vs. pharmacotherapy alone. It is to be ex-pected that interventions involving the administra-tion of risperidone will be more effective, sinceevidence seems to indicate that, when comparedto haloperidol, the use of riperidone leads more toimprovements on the PANSS (Positive and Nega-tive Symptom Scale), reduces the risk of relapse,and presents a significant reduction in the appear-ance of side-effects (Hunter et al. 2003).
Given the high cost of atypical antipsychotics ingeneral (and of risperidone in particular), we havefound that interventions involving the administra-tion of antipsychotics are more cost-effective. How-ever, when the administration of patented risperi-done is replaced by a generic version of the drug,the costs become roughly equal and no differencesof note are observed in terms of cost-effectivenesswith regard to interventions based on the use oftypical neuroleptics (however, we assumed that thedrug’s effectiveness is identical in its patented andgeneric version, an affirmation that is, of course,open to discussion).
As expected, the inclusion of psychosocial treat-ment together with the use of antipsychotic medi-cation translates into an improvement of the inter-vention in terms of cost-effectiveness. Psychosocialtherapy ensures better adherence to drug therapyand the added costs it generates are more than off-
set by the reduction in new hospital admissions.Finally, the inclusion of ongoing care programmesmakes for more efficient use of resources and pro-vides an improvement in terms of cost-effectivenessthat is of the same order of magnitude as that ob-tained by adding psychosocial therapy; in somecases it is slightly less cost-effective (when the ba-sic drug treatment consists of the administration oftypical antipsychotics), and in other cases it isslightly more cost-effective (when the basic drugtreatment consists of the administration of risperi-done, either patented or generic).
The cost-effectiveness ratios calculated in our studyrange between one and three times the estimatedper capita income figure (20,000 euros) for theSpanish population, except in two interventions: theoption modelling the present situation, and thatwhich contemplates the administration of risperi-done alone. Therefore, most of the considered op-tions are within the range set by the WHO’s Com-mission on Macroeconomics and Health, whichconsiders “cost-effective” those interventionswhose cost per DALY avoided does not exceed thethreshold of three times the national per capita in-come. The intervention based on the administra-tion of risperidone alone, however, would be con-sidered “not cost-effective”, as it exceeds thatthreshold.
Comparisons with other studies that apply a na-tional level of analysis are limited by economic andpopulation-related constraints, as well as by thedifferent methodological approaches used. Sinceinternational cost-effectiveness studies often quan-tify the effectiveness of schizophrenia interventionsmaking use of a wide range of criteria—such as

86
REDUCING THE BURDEN OF MENTAL ILLNESS IN SPAIN
improved score on the BPRS scale (Palmer et al.2002), or variation in years of life lived with thedisorder (Andrews et al. 2004)—our comparisonshould focus only on those that, like our study, of-fer estimates in terms of cost per DALY avoided forit to be considered valid.
A recent study on the Australian population com-pared the use of typical and atypical antipsychot-ics in terms of cost-effectiveness (Magnus et al.2005). According to the results provided by Magnuset al., the replacement of typical neuroleptics byrisperidone would imply an increase in the cost-ef-fectiveness ratio of 48,000 Australian dollars(which would equal 36,400 international dollars ifwe apply the currency exchange rate in effect in2000). According to our study, a switch in treat-ments would increase the cost per DALY avoided(considering discount, as Magnus et al. do) by be-tween 11,142 euros (14,700 international dollarsat the 2000 exchange rate)—if psychosocialtherapy and ongoing care programmes are also ap-plied—and 23,713 euros (31,200 internationaldollars) when the drug treatment alone is applied.Some of the conclusions that the same authorsreached about the advantages of applying the cost-effectiveness methodology to priority decision-mak-ing in mental health (Vos et al. 2005) are consist-ent with those drawn from our own findings: inparticular, those referring to improved cost-effec-tiveness achieved thanks to psychosocial treatmentand the reduction of cost-effectiveness associatedwith the widespread use of atypical antipsychoticsas the treatment of choice.
If we compare them with the strategies applied toother disorders using the WHO-CHOICE methodol-ogy, the results we obtained for interventions in-volving schizophrenia present a high cost in rela-tion to the outcome achieved. Our estimated costper avoided DALY (26,343 to 72,552 euros, or34,662 to 95,463 in 2000 international dollars)exceeds by a factor of about five the average costassociated with bipolar disorder interventions,which amounts to between 5,487 and 21,123international dollars for developed subregions(Chisholm et al. 2005). The disparity we found be-tween the cost-effectiveness of interventions inschizophrenia and bipolar disorder cannot be ex-plained as a function of the costs (between 8.4 and17.6 million international dollars per million inhab-
itants in interventions involving bipolar disorder indeveloped subregions, and between 6 and 10.5million international dollars per million inhabitantsin interventions involving schizophrenia in theSpanish population). Rather, it is due to differencesin effectiveness: the total number of DALYs avoidedfor schizophrenia with the alternative interventionsunder consideration in our study varies between 81and 211 per million inhabitants, while interventionsfor bipolar disorder manage to save between 375and 517 DALYs per million inhabitants in devel-oped subregions. The differences are even greaterwhen we compare our results to those for interven-tions for depression, since the average cost perDALY avoided by interventions involving depressionbased on primary care was estimated between1,600 and 1,700 international dollars a year permillion inhabitants (Chisholm et al. 2004).
In any case, the comparison between the cost-ef-fectiveness results obtained for the three disordersis clearly limited by methodological differences:while our estimates were made taking into accounta national population analysis level (Spain), the fig-ures provided for interventions involving bipolar dis-order or depression come from aggregate studiesconsidering populations from different subregions,so a greater heterogeneity can be expected fromthese. It should be noted that the main objective ofthe present study is to compare interventions asso-ciated with the same disorder, and not to comparedifferent disorders.
Our uncertainty analysis enables us to draw a sig-nificant conclusion for clinical practice: the addi-tion of psychosocial treatment (whether alone oras part of an ongoing care programme) to phar-macotherapy (based on either typical or atypicalantipsychotics) significantly increases the cost-ef-fectiveness of the interventions, as reflected in theuncertainty analysis results: there is no overlap be-tween clusters corresponding to interventions thatinclude psychosocial treatment and those that donot; moreover, on the stochastic league table, in-terventions with psychosocial treatment constitutethe first choice for available resource levelsin excess of 150 million euros.
Consequently, our results show the advisability ofimplementing psychosocial strategies as a comple-ment to current pharmacological interventions,

87
DISCUSSION
since the benefits resulting from their applicationseem to be more pronounced than those from asimple switch to atypical antipsychotics. In addi-tion, the sensitivity analysis of our study contrib-utes to highlighting the need to reconsider theusual controversy regarding the cost-effectiveness
of interventions with typical vs. atypical antipsy-chotics, given the appearance on the Spanishhealth market of generic versions of some atypicaldrugs, which considerably reduces the correspond-ing price, making it virtually equal to that of typi-cal antipsychotics.


89
References
ADAM, T., D. B.EVANS and C.J. MURRAY. “Econometricestimation of country-specific hospital costs”. Cost EffResour Alloc 1 (2003): 3.
ADAM, T., M.A. KOOPMANSCHAP and D.B. EVANS. “Cost-effectiveness analysis: can we reduce variability in cost-ing methods?” Int J Technol Assess Healthcare 19(2003): 407-420.
ADAM, T., S.S. LIM, S. MEHTA, Z.A. BHUTTA, H. FOGSTAD,M. MATHAI, J. ZUPAN and G.L. DARMSTADT. “Cost-effec-tiveness analysis of strategies for maternal and neonatalhealth in developing countries”. BMJ 331 (2005): 1107.
ALONSO, J., M. FERRER, B. ROMERA, G. VILAGUT, M.ANGERMEYER, S. BERNET, T.S. BRUGHA et al. “The Euro-pean Study of the Epidemiology of Mental Disorders(ESEMeD/MHEDEA 2000) project: rationale and meth-ods”. Int J Methods Psychiatr Res 11 (2002): 55-67.
ALONSO, J., L. PRIETO and J.M. ANTO. “The Spanish ver-sion of the SF-36 Health Survey (the SF-36 health ques-tionnaire): an instrument for measuring clinical results”.Med Clin (Barc.) 104 (1995): 771-776.
ALONSO, M, F.J. DE ABAJO, J.J. MARTINEZ and D. MONTERO.“Evolución del consumo de antidepresivos en España.Impacto de los inhibidores selectivos de la recaptaciónde serotonina”. Medicina Clinica 108 (1997): 161-166.
ANDREWS, G., C. ISSAKIDIS, K. SANDERSON, J. CORRY andH. LAPSLEY. “Utilising survey data to inform public policy:comparison of the cost-effectiveness of treatment of tenmental disorders”. Br J Psychiatry 184 (2004): 526-533.
—. “Cost-effectiveness of current and optimal treatmentfor schizophrenia”. Br J Psychiatry 183 (2003): 427-435.
ANDREWS, G., K. SANDERSON, J. CORRY and H. LAPSLEY.“Using epidemiological data to model efficiency in re-
ducing the burden of depression”. J Ment Health PolicyEcon 3 (2000): 175-186.
AYUSO-MATEOS, J. L. “Depression: a priority in publichealth”. Med Clin (Barc.) 123 (2004): 181-186.
—. Global burden of unipolar depressive disorders in theyear 2000. Geneva: World Health Organization. GBD2000 Working Paper, 2002.
AYUSO-MATEOS, J. L., L. LASA, J.L. VAZQUEZ-BARQUERO, A.OVIEDO and J.F. DIEZ-MANRIQUE. “Measuring health sta-tus in psychiatric community surveys: internal and exter-nal validity of the Spanish version of the SF-36”. ActaPsychiatr Scand 99 (1999): 26-32.
AYUSO-MATEOS, J. L., J.L. VAZQUEZ-BARQUERO, C. DOWRICK,V. LEHTINEN, O.S. DALGARD, P. CASEY, C. WILKINSON et al.“Depressive disorders in Europe: prevalence figures fromthe ODIN study”. Br J Psychiatry 179 (2001): 308-316.
AZIMI, N. A. and H.G. WELCH. “The effectiveness of cost-effectiveness analysis in containing costs”. J Gen InternMed 13 (1998): 664-669.
BADIA, X. “La medida de la calidad de vida relacionadacon la salud en la evaluación económica”. In J. A. Sac-ristan, X. Badia & J. Rovira (eds.) Farmacoeconomía.Madrid, 1995: 77-99.
BAIR, M. J., R.L. ROBINSON and W KROENKE K KATON.“Depression and pain comorbidity. A literature review.”Arch Intern Med 161 (2003): 2433-2445.
BALTUSSEN, R., K. FLOYD and C. DYE. “Cost-effectivenessanalysis of strategies for tuberculosis control in develop-ing countries”. BMJ 331 (2005): 1364.
BALTUSSEN, R., C. KNAI and M. SHARAN. “Iron fortifica-tion and iron supplementation are cost-effective interven-

90
REDUCING THE BURDEN OF MENTAL ILLNESS IN SPAIN
tions to reduce iron deficiency in four subregions of theworld”. Journal of Nutrition 134 (2004): 2678-2684.
BALTUSSEN, R., M. SYLLA and S.P. MARIOTTI. “Cost-effec-tiveness analysis of cataract surgery: a global and regionalanalysis”. Bull World Health Organ 82 (2004): 338-345.
BALTUSSEN, R. M., R.C. HUTUBESSY, D.B. EVANS and C.J.MURRAY. “Uncertainty in cost-effectiveness analysis.Probabilistic uncertainty analysis and stochastic leaguetables”. Int J Technol Assess Healthcare 18 (2002): 112-119.
BALTUSSEN, R. M., M. SYLLA, K.D. FRICK and S.P.MARIOTTI. “Cost-effectiveness of trachoma control inseven world regions”. Ophthalmic Epidemiol 12 (2005):91-101.
BARENDREGT, J. J., C.A. BAAN and L. BONNEUX. “An indi-rect estimate of the incidence of non-insulin-dependentdiabetes mellitus”. Epidemiology 11 (2000): 274-279.
BARENDREGT, J. J., G.J. VAN OORTMARSSEN, T. VOS and C.J.MURRAY. “A generic model for the assessment of diseaseepidemiology: the computational basis of DisMod II”.Popul Health Metr 1 (2003): 4.
BASU, A. “Cost-effectiveness analysis of pharmacologi-cal treatments in schizophrenia: critical review of resultsand methodological issues”. Schizophr Res 71 (2004):445-462.
BEASLEY, C. M., D.J. WALKER, V.K. SUTTON, K. ALAKA, D.NABER and M. NAMJOSHI. “The effectiveness of olanzapineversus placebo in maintaining the QoL in stabilized pa-tients with schizophrenia”. European Neuropsychophar-macology 13 (2003): S342-S343.
BLACK, D.W. and R. FISHER. “Mortality in DSM-IIIRschizophrenia”. Schizophr Res 7, (1992): 109-116.
BRAZIER, J., T. USHERWOOD, R. HARPER and K. THOMAS.“Deriving a preference-based single index from the UKSF-36 Health Survey”. J Clin Epidemiol 51 (1998):1115-1128.
CANADIAN COORDINATING OFFICE FOR HEALTH TECHNOLOGY
ASSESSMENT. Guidelines for economic evaluation of phar-maceuticals. Ottawa: Canadian Coordinating Office forHealth Technology Assessment, 1994.
CHISHOLM, D. “Choosing cost-effective interventions inpsychiatry: results from the CHOICE programme of theWorld Health Organization”. World Psychiatry 4 (2005a):37-44.
—. “Cost-effectiveness of first-line antiepilectic drugtreatments in the developing world: a population-levelanalysis”. Epilepsia 46, no. 5 (2005b): 751-759.
CHISHOLM, D., O. GUREJE, S. SALDIVIA, M. VILLALON, R.WICKREMASINGHE, N. MENDIS, J.L. AYUSO-MATEOS and S.SAXENA. “Schizophrenia treatment in the developingworld: An inter-regional and multi-national cost-effective-ness analysis” (submitted).
CHISHOLM, D., J. REHM, M. VAN OMMEREN and M.MONTEIRO. “Reducing the global burden of hazardous al-cohol use: a comparative cost-effectiveness analysis”. JStud Alcohol 65 (2004a): 782-793.
CHISHOLM, D., K. SANDERSON, J.L. AYUSO-MATEOS and S.SAXENA. “Reducing the global burden of depression: po-pulation-level analysis of intervention cost-effectiveness in14 world regions”. Br J Psychiatry 184 (2004b): 393-403.
CHISHOLM, D., M. VAN OMMEREN, J.L. AYUSO-MATEOS andS. SAXENA. “Cost-effectiveness of clinical interventionsfor reducing the global burden of bipolar disorder”. Br JPsychiatry 187 (2005): 559-567.
COMMISSION ON MACROECONOMICS AND HEALTH. Macroeco-nomics and health: Investing in health for economic de-velopment. Report of the Commission on Macroeconom-ics and Health: Executive Summary. Geneva: WorldHealth Organization, 2001
DARMSTADT, G. L., Z.A. BHUTTA, S. COUSENS, T. ADAM, N.WALKER and L. DE BERNIS. “Evidence-based, cost-effec-tive interventions: how many newborn babies can wesave?” Lancet 365 (2005): 977-988.
DI MICHELE, V. and F. BOLINO. “The natural course ofschizophrenia and psychopathological predictors of out-come. A community-based cohort study”. Psychopathol-ogy 37 (2004): 98-104.
DIXON, J. and H.G. WELCH. “Priority setting: lessons fromOregon”. Lancet 337 (1991): 891-894.
DOUBILET, P., M.C. WEINSTEIN and B.J. MCNEIL. “Use andmisuse of the term “cost-effective” in medicine”. N EnglJ Med 314 (1986): 253-256.
DOWRICK, C., G. DUNN, J.L. AYUSO-MATEOS, O.S. DALGARD,H. PAGE, V. LEHTINEN, P. CASEY, C. WILKINSON, J.L.VAZQUEZ-BARQUERO and G. WILKINSON. “Problem solvingtreatment and group psychoeducation for depression:multicentre randomised controlled trial. Outcomes ofDepression International Network (ODIN) Group”. BMJ321 (2000): 1450-1454.
91
REFERENCES
DRUMMOND, M. F., W.S. RICHARDSON, B.J. O’BRIEN, M.LEVINE and D. HEYLAND. Users’ guides to the medical lit-erature XIII. “How to use an article on economic analysisof clinical practice. A. Are the results of the study valid?Evidence-Based Medicine Working Group”. JAMA 277(1997): 1552-1557.
DZIEKAN, G., D. CHISHOLM, B. JOHNS, J. ROVIRA and Y.J.HUTIN. “The cost-effectiveness of policies for the safe andappropriate use of injection in healthcare settings”. BullWorld Health Organ 81 (2003): 277-285.
EDDY, D. M. Clinical decision-making: from theory to prac-tice. “Applying cost-effectiveness analysis. The insidestory”. JAMA 268 (1992a): 2575-2582.
—.Clinical decision-making: from theory to practice.“Cost-effectiveness analysis. A conversation with my fa-ther”. JAMA 267, no. 1 (1992b): 669-1675.
—. Clinical decision-making: from theory to practice.“Cost-effectiveness analysis. Is it up to the task?” JAMA267 (1992c): 3342-3348.
—. Clinical decision-making: from theory to practice.“Cost-effectiveness analysis. Will it be accepted?” JAMA268 (1992d): 132-136.
EDEJER, T. T., M. AIKINS, R. BLACK, L. WOLFSON, R.HUTUBESSY and D.B. EVANS. “Cost-effectiveness analysisof strategies for child health in developing countries”.BMJ 331 (2005): 1177.
ENGER, C., L. WEATHERBY, R.F. REYNOLDS, D.B. GLASSER
and A.M. WALKER. “Serious cardiovascular events andmortality among patients with schizophrenia”. J NervMent Dis 192 (2004): 19-27.
EVANS, D. B., T.T. EDEJER, T. ADAM and S.S. LIM. “Meth-ods to assess the costs and health effects of interven-tions for improving health in developing countries”. BMJ331 (2005a): 1137-1140.
EVANS, D. B., T. ADAM, T.T. EDEJER, S.S. LIM, A. CASSELS
and T.G. EVANS. “Time to reassess strategies for improv-ing health in developing countries”. BMJ 331 (2005b):1133-1136.
EVANS, D. B., S.S. LIM, T. ADAM and T.T. EDEJER. “Evalu-ation of current strategies and future priorities for im-proving health in developing countries”. BMJ 331,(2005c): 1457-1461.
FERRI, C., D. CHISHOLM, M. VAN OMMEREN and M. PRINCE.“Resource utilization for neuropsychiatric disorders in
developing countries: a multinational Delphi consensusstudy”. Soc Psychiatry Psychiatr Epidemiol 39 (2004):218-227.
GAITE, L., J.L. VAZQUEZ-BARQUERO, C. BORRA, J. BALLESTE-ROS, A. SCHENE, B. WELCHER, G. THORNICROFT, T. BECKER,M. RUGGERI and A. HERRAN. “QoL in patients with schizo-phrenia in five European countries: the EPSILON study”.Acta Psychiatr Scand 105 (2002): 283-292.
GAMINDE, I. and J.M. CABASÉS. “Measuring Valuations forhealth States amongst the General Population in Navarre(Spain)”. In X. Badia, M. Herdman, & A. Seguara (eds.)Proceedings of the EuroQol Plenary Meeting. Barcelona,3-6 October 1995. Barcelona, 1996: 113-122.
GANEV, K. “Long-term trends of symptoms and disabilityin schizophrenia and related disorders”. Soc PsychiatryPsychiatr Epidemiol 35 (2000): 389-395.
GROOT, M.T., R. BALTUSSEN, C.A. UYL-DE GROOT, B.O.ANDERSON and G.N. HORTOBAGYI. “Costs and health ef-fects of breast cancer interventions in epidemiologicallydifferent regions of Africa, North America, and Asia”.Breast J 12, suppl. 1 (2006): S81-S90.
GUREJE, O., W. MILES, N. KEKS, D. GRAINGER, T. LAMBERT,J. MCGRATH, P. TRAN et al. “Olanzapine vs risperidone inthe management of schizophrenia: a randomized double-blind trial in Australia and New Zealand”. Schizophr Res61, (2003): 303-314.
HÄFNER, H., W. LOFFLER, K. MAURER, M. HAMBRECHT andH.W. AN DER HEIDEN. “Depression, negative symptoms,social stagnation and social decline in the early courseof schizophrenia”. Acta Psychiatr Scand 100 (1999):105-118.
HÄFNER, H., K. MAURER, W. LOFFLER, H.W. AN DER HEIDEN,M. HAMBRECHT and F. SCHULTZE-LUTTER. “Modeling theearly course of schizophrenia”. Schizophr Bull 29(2003): 325-340.
HARO, J. M., E.T. EDGELL, P.B. JONES, J. ALONSO, S.GAVART, K.J. GREGOR, P. WRIGHT and M. KNAPP. “The Eu-ropean Schizophrenia Outpatient Health Outcomes(SOHO) study: rationale, methods and recruitment”. ActaPsychiatr Scand 107 (2003): 222-232.
HARO, J. M., E.T. EDGELL, D. NOVICK, J. ALONSO, L.KENNEDY, P.B. JONES, M. RATCLIFFE and A. BREIER. “Ef-fectiveness of antipsychotic treatment for schizophrenia:6-month results of the Pan-European SchizophreniaOutpatient Health Outcomes (SOHO) study”. ActaPsychiatr Scand 111 (2005): 220-231.
92
REDUCING THE BURDEN OF MENTAL ILLNESS IN SPAIN
HARO, J. M., L. SALVADOR-CARULLA, J. CABASES, V. MADOZ
and J.L. VAZQUEZ-BARQUERO. “Utilization of mental healthservices and costs of patients with schizophrenia in threeareas of Spain”. Br J Psychiatry 173 (1998): 334-340.
HARRIS, E. C. and B. BARRACLOUGH. “Excess mortality ofmental disorder”. Br J Psychiatry 173 (1998): 11-53.
HARRISON, G., K. HOPPER, T. CRAIG, E. LASKA, C. SIEGEL,J. WANDERLING, K.C. DUBE, K. GANEV, R. GIEL and W. AN
DER HEIDEN. “Recovery from psychotic illness: a 15- and25-year international follow-up study”. Br J Psychiatry178 (2001): 506-517.
HELLEWELL, J. S. “Patients’ subjective experiences ofantipsychotics: clinical relevance”. CNS Drugs 16(2002): 457-471.
HERTLING, I., M. PHILIPP, A. DVORAK, T. GLASER, O. MAST,M. BENEKE, K. RAMSKOGLER, G. SALETU-ZYHLARZ, H.WALTER and O.M. LESCH. “Flupenthixol versus risperi-done: subjective QoL as an important factor for compli-ance in chronic schizophrenic patients”. Neuropsycho-biology 47 (2003): 37-46.
HILLMAN, A. L., J.M. EISENBERG, M.V. PAULY, B.S. BLOOM,H. GLICK, B. KINOSIAN and J.S. SCHWARTZ. “Avoiding biasin the conduct and reporting of cost-effectiveness re-search sponsored by pharmaceutical companies”. N EnglJ Med 324 (1991): 1362-1365.
HOFER, A., G. KEMMLER, U. EDER, M. EDLINGER, M. HUM-MER and W.W. FLEISCHHACKER. “QoL in schizophrenia: theimpact of psychopathology, attitude toward medication,and side effects”. J Clin Psychiatry 65 (2004): 932-939.
HOGAN, D. R., R. BALTUSSEN, C. HAYASHI, J.A. LAUER andJ.A. SALOMON. “Cost-effectiveness analysis of strategiesto combat HIV/AIDS in developing countries”. BMJ 331(2005): 1431-1437.
HOLLIS, C. “Adult outcomes of child- and adolescent-on-set schizophrenia: diagnostic stability and predictive va-lidity”. Am J Psychiatry 157 (2000): 1652-1659.
HOPPER, K. and J. WANDERLING. “Revisiting the devel-oped versus developing country distinction in courseand outcome in schizophrenia: results from ISoS, theWHO collaborative followup project”. InternationalStudy of Schizophrenia Schizophr Bull. 26 (2000):835-846.
HOTOPF, M., G. LEWIS and C. NORMAND. “Are SSRIs a cost-effective alternative to tricyclics?” Br J Psychiatry 168(1996): 404-409.
HUNTER, R.H., C.B. JOY, E. KENNEDY, S.M. GILBODY andF. SONG. Risperidone versus typical antipsychotic medi-cation for schizophrenia Cochrane Database Syst. Rev.,CD000440, 2003.
HUTUBESSY, R., D. CHISHOLM, D. and T.T. EDEJER. “Gen-eralized cost-effectiveness analysis for national-level pri-ority-setting in the health sector”. Cost Eff Resour Alloc1 (2003): 8.
HUTUBESSY, R.C., R.M. BALTUSSEN, D.B. EVANS, J.J.BARENDREGT and C.J. MURRAY. “Stochastic league tables:communicating cost-effectiveness results to decision-makers”. Health Econ 10 (2001): 473-477.
HUTUBESSY, R.C., R.M. BALTUSSEN, T.T. TORRES-EDEJER
and D.B. EVANS. “Generalised cost-effectiveness analy-sis: an aid to decision-making in health.” Appl HealthEcon Health Policy 1 (2002): 89-95.
HUTUBESSY, R.C., L.M. BENDIB and D.B. EVANS. “Criticalissues in the economic evaluation of interventions againstcommunicable diseases”. Acta Trop 78 (2001): 191-206.
IGLESIAS GARCÍA, C. “Evolución de la incidencia adminis-trativa de esquizofrenia en Asturias”. Anales de Psiquia-tría 17 (2001): 87-93.
INSKIP, H.M., E.C. HARRIS and B. BARRACLOUGH. “Life-time risk of suicide for affective disorder, alcoholism andschizophrenia”. Br J Psychiatry 172 (1998): 35-37.
JABLENSKY, A., N. SARTORIUS, G. ERNBERG, M. ANKER, A.KORTEN, J.E. COOPER, R. DAY and A. BERTELSEN. “Schizo-phrenia: manifestations, incidence and course in differ-ent cultures. A World Health Organization ten-countrystudy”. Psychol Med Monogr (Suppl) 20 (1992): 1-97.
JAMISON, D.T., W.H. MOSLEY, A.R. MEASHAM and J.L.BOBADILLA. Disease control priorities in developing coun-tries. New York: Oxford University Press, 1993.
JOHNS, B., R. BALTUSSEN and R. HUTUBESSY. “Programmecosts in the economic evaluation of health interventions”.Cost Eff Resour Alloc 1 (2003): 1.
JOINT STRATEGY GROUP OF THE GOVERNMENT AND THE AS-SOCIATION OF THE BRITISH PHARMACEUTICAL INDUSTRY.Guidelines on good practice in the conduct of economicevaluation of medicines. London: Association of the Brit-ish Pharmaceutical Industry, 1994.
KASSIRER, J.P. and M. ANGELL. “The journal’s policy oncost-effectiveness analyses”. N Engl J Med 331 (1994):669-670.

93
REFERENCES
KELLY, C., R.G. MCCREADIE, T. MACEWAN and S. CAREY.“Nithsdale schizophrenia surveys. 17. Fifteen year re-view”. Br J Psychiatry 172 (1998): 513-517.
KNAPP, M. “Schizophrenia costs and treatment cost-effec-tiveness”. Acta Psychiatr Scand Suppl (2000): 15-18.
KNAPP, M., D. CHISHOLM, M. LEESE, F. AMADDEO, M.TANSELLA, A. SCHENE, G. THORNICROFT, J.L. VAZQUEZ-BARQUERO, H.C. KNUDSEN and BECKER, T. “Compar-ing patterns and costs of schizophrenia care in fiveEuropean countries: the EPSILON study. EuropeanPsychiatric Services: Inputs Linked to Outcome Do-mains and Needs”. Acta Psychiatr Scand 105 (2002):42-54.
KRUIJSHAAR, M.E., J.J. BARENDREGT and N. HOEYMANS.“The use of models in the estimation of disease epide-miology”. Bull World Health Organ 80 (2002): 622-628.
KRUIJSHAAR, M.E., J.J. BARENDREGT and L.V. VAN DE POLL-FRANSE. “Estimating the prevalence of breast cancer us-ing a disease model: data problems and trends”. PopulHealth Metr 1 (2003): 5.
LAMBERT, M. and D. NABER. “Current issues in schizo-phrenia: overview of patient acceptability, functioningcapacity and QoL”. CNS Drugs 18 Suppl 2 (2004):5-17.
LAUER, J.A., K. ROHRICH, H. WIRTH, C. CHARETTE, S.GRIBBLE and C.J. MURRAY. “PopMod: a longitudinal popu-lation model with two interacting disease states”. CostEff Resour Alloc 1 (2003): 6.
LAY, B., B. BLANZ, M. HARTMANN and M.H. SCHMIDT. “Thepsychosocial outcome of adolescent-onset schizophre-nia: a 12-year followup”. Schizophr Bull 26 (2000):801-816.
LEPLEGE, A. “Some problems with cost-benefit analysisin healthcare”. J Clin Ethics 3 (1992): 108-110.
LEUCHT, S., G. PITSCHEL-WALZ, D. ABRAHAM and W.KISSLING. “Efficacy and extrapyramidal side-effects ofthe new antipsychotics olanzapine, quetiapine, risp-eridone, and sertindole compared to conventionalantipsychotics and placebo. A meta-analysis ofrandomized controlled trials”. Schizophr Res 35(1999): 51-68.
LOEBEL, A., C. SIU and ROMANO, S. “Improvement inprosocial functioning after a switch to ziprasidone treat-ment”. CNS Spectr 9 (2004): 357-364.
MAGNUS, A., V. CARR, C. MIHALOPOULOS, R. CARTER andT. VOS. “Assessing cost-effectiveness of drug interven-tions for schizophrenia”. Aust N Z J Psychiatry 39(2005): 44-54.
MARSHALL, M., A. GRAY, A. LOCKWOOD and R. GREEN. Casemanagement for people with severe mental disordersCochrane Database Syst. Rev. CD000050, 2000.
MARSHALL, M. AND A. LOCKWOOD. Assertive communitytreatment for people with severe mental disorders.Cochrane Database Syst. Rev. CD001089, 2000.
MATA, I., M. BEPERET, V. MADOZ AND GRUPO PSICOST.“Prevalencia e incidencia de la esquizofrenia en Nava-rra.” Anales del Sistema Sanitario de Navarra Suplemen-tos, 23, (2000):29-36.
MATHERS C, C. STEIN, D. M. MA FAT, C. RAO, M. INOUE, N.TOMIJIMA, C. BERNARD, A.D. LOPEZ and C.J.L. MURRAY.Global Burden of Disease 2000: Version 2 methods andresults. Geneva: WHO, Global Programme on Evidencefor Health Policy Discussion Paper, 2002.
MEHTA, S. and C. SHAHPAR. “The health benefits to inter-ventions to reduce indoor air pollution from solid fuel use:a cost-effectiveness analysis”. Energy for SustainableDevelopment VIII (2004): 53-59.
MELTZER, H.Y. “Suicidality in schizophrenia: a review ofthe evidence for risk factors and treatment options”. CurrPsychiatry Rep 4 (2002): 279-283.
MILES, C.P. “Conditions predisposing to suicide: a re-view”. J Nerv Ment Dis 164 (1977): 231-246.
MILLER, C.H. and W.W. FLEISCHHACKER. “Managingantipsychotic-induced acute and chronic akathisia”. DrugSaf 22 (2000): 73-81.
MOJTABAI, R., D. MALASPINA and E. SUSSER. “The con-cept of population prevention: application to schizophre-nia”. Schizophr Bull 29 (2003): 791-801.
MOREL, C.M., J.A. LAUER and D.B. EVANS. “Cost-effec-tiveness analysis of strategies to combat malaria in de-veloping countries”. BMJ 331 (2005): 1299.
MORENO KÜSTNER, B., F. TORRES GONZÁLEZ and C. ROSA-LES VARO. “Prevalencia tratada de esquizofrenia y tras-tornos afines”. In El registro de casos de esquizofreniade Granada. Madrid, 2005.
MURRAY, C.J.L. and A. LOPEZ. The Global Burden of Dis-ease A comprehensive assessment of mortality and dis-

94
REDUCING THE BURDEN OF MENTAL ILLNESS IN SPAIN
ability from diseases, injuries and risk factors in 1990and projected to 2020. Cambridge: Harvard School ofPublic Health, 1996.
—. “Alternative projections of mortality and disability bycause, 1990-220”. Lancet 349 (1997): 1498-1504.
MURRAY, C.J., D.B. EVANS, A. ACHARYA and R.M. BALTUSSEN.“Development of WHO guidelines on generalized cost-ef-fectiveness analysis”. Health Econ 9 (2000): 235-251.
MURRAY, C.J., J.A. LAUER, R.C. HUTUBESSY, L. NIESSEN,N. TOMIJIMA, A. RODGERS, C.M. LAWES and D.B. EVANS.“Effectiveness and costs of interventions to lower systolicblood pressure and cholesterol: a global and regionalanalysis on reduction of cardiovascular-disease risk”.Lancet 361 (2003): 717-725.
NABER, D., S. MORITZ, M. LAMBERT, F.G. PAJONK, R.HOLZBACH, R. MASS and B. ANDRESEN. “Improvement ofschizophrenic patients’ subjective well-being under atypi-cal antipsychotic drugs”. Schizophr Res 50 (2001):79-88.
NABER, D., M. RIEDEL, A. KLIMKE, E.U. VORBACH, M. LAM-BERT, K.U. KUHN, S. BENDER et al. “Randomized doubleblind comparison of olanzapine vs. clozapine on subjec-tive well-being and clinical outcome in patients withschizophrenia”. Acta Psychiatr Scand 111 (2005):106-115.
NASRALLAH, H.A., I. DUCHESNE, A. MEHNERT, C. JANAGAP
and M. EERDEKENS. “Health-related QoL in patients withschizophrenia during treatment with long-acting, inject-able risperidone”. J Clin Psychiatry 65 (2004): 531-536.
O’BRIEN, B.J., D. HEYLAND, W.S. RICHARDSON, M. LEVINE
and M.F. DRUMMOND. “Users’ guides to the medical lit-erature. XIII. How to use an article on economic analysisof clinical practice. B. What are the results and will theyhelp me in caring for my patients? Evidence-Based Medi-cine Working Group”. JAMA 277 (1997): 1802-1806.
OFISALUD. El coste social de los trastornos de salud men-tal en España. 1998.
OHAYON, M.M. “Prevalence of DSM-IV diagnostic criteriaof insomnia: distinguishing insomnia related to mentaldisorders from sleep disorders”. J Psychiatr Res 31(1997): 333-346.
PAALMAN, M., H. BEKEDAM, L. HAWKEN and D.A. NYHEIM.“A critical review of priority setting in the health sector:the methodology of the 1993 World Development Re-port”. Health Policy Plan 13 (1998): 13-31.
PALMER, C.S., E. BRUNNER, L.G. RUIZ-FLORES, F. PAEZ-AGRAZ and D.A. REVICKI. “A cost-effectiveness clinicaldecision analysis model for treatment of schizophrenia”.Arch Med Res 33 (2002): 572-580.
PATEL, V., D. CHISHOLM, S. RABE-HESKETH, F. DIAS-SEXENA,G. ANDREW and A. MANN. “Efficacy and cost-effectivenessof drug and psychological treatments for common mentaldisorders in general healthcare in Goa, India: a ran-domised, controlled trial”. Lancet 361 (2003): 33-39.
POMPILI, M., A. RUBERTO, P. GIRARDI and R. TATARELLI.“Suicide in schizophrenia. What are we going to do aboutit?”. Ann Ist Super Sanita 40 (2004): 463-473.
PRIETO, L., J.A. SACRISTAN, J.A. HORMAECHEA and J.C.GOMEZ. “EuroQoL-5D (a generic health-related QoL meas-ure): Psychometric validation in a sample of schizo-phrenic patients”. European Neuropsychopharmacology12 (2002): S300.
PRIETO, L., J.A. SACRISTAN, C. RUBIO, J.L. PINTO and J.ROVIRA. “El análisis coste-efectividad en la evaluacióneconómica de las intervenciones sanitarias”. MedicinaClinica (in press).
PYNE, J.M., G. SULLIVAN, R. KAPLAN and D.K. WILLIAMS.“Comparing the sensitivity of generic effectiveness meas-ures with symptom improvement in persons with schizo-phrenia”. Med Care 41 (2003): 208-217.
RESNICK, S.G., R.A. ROSENHECK and A.F. LEHMAN. “Anexploratory analysis of correlates of recovery”. PsychiatrServ 55 (2004): 540-547.
RITSNER, M., A. PONIZOVSKY, J. ENDICOTT, Y. NECHAMKIN,B. RAUCHVERGER, H. SILVER and I. MODAI. “The impact ofside-effects of antipsychotic agents on life satisfactionof schizophrenia patients: a naturalistic study”. EurNeuropsychopharmacol 12 (2002): 31-38.
RUGGERI, M., G. BISOFFI, L. FONTECEDRO and R. WARNER.“Subjective and objective dimensions of QoL in psychi-atric patients: a factor analytical approach: The SouthVerona Outcome Project 4”. Br J Psychiatry 178 (2001):268-275.
RUGGERI, M., A. LASALVIA, M. TANSELLA., C. BONETTO, M.ABATE, G. THORNICROFT, L. ALLEVI and P. OGNIBENE. “Het-erogeneity of outcomes in schizophrenia. 3-year follow-up of treated prevalent cases”. Br J Psychiatry 184(2004): 48-57.
RUSSELL, L.B., M.R. GOLD, J.E. SIEGEL, N. DANIELS andM.C. WEINSTEIN. “The role of cost-effectiveness analysis

95
REFERENCES
in health and medicine. Panel on Cost-Effectiveness inHealth and Medicine”. JAMA 276 (1996): 1172-1177.
SACRISTAN, J.A., J.C. GOMEZ and L. SALVADOR-CARULLA.“Cost-effectiveness analysis of olanzapine versus haloperi-dol in the treatment of schizophrenia++ in Spain”. ActasLuso Esp Neurol Psiquiatr Cienc Afines 25 (1997): 225-234.
SALDIVIA BORQUEZ S., F. TORRES, GONZALEZ and J.M.CABASES HITA. “Estimation of mental healthcare costunits for patients with schizophrenia”. Actas EspPsiquiatr 33 (2005): 280-285.
SALEEM, P., J.P. OLIE and H. LOO. “Social functioningand QoL in the schizophrenic patient: advantages ofamisulpride”. Int Clin Psychopharmacol 17 (2002): 1-8.
SALVADOR-CARULLA, L., J.M. HARO and J.L. AYUSO-MATEOS.“A framework for evidence-based mental healthcare andpolicy”. Acta Psychiatr Scand Suppl (2006): 5-11.
SALVADOR-CARULLA, L., J.M. HARO, J. CABASES, V. MADOZ,J.A. SACRISTAN and J.L. VAZQUEZ-BARQUERO. “Service uti-lization and costs of first-onset schizophrenia in twowidely differing health service areas in North-East Spain.PSICOST Group”. Acta Psychiatr Scand 100 (1999):335-343.
SAMELE, C., J. VAN OS, K. MCKENZIE, A. WRIGHT, C.GILVARRY, C. MANLEY, T. TATTAN and R. MURRAY. “Doessocioeconomic status predict course and outcome in pa-tients with psychosis?”. Soc Psychiatry PsychiatrEpidemiol 36 (2001): 573-581.
SERNYAK, M.J., R. DESAI, M. STOLAR and R. ROSENHECK.“Impact of clozapine on completed suicide”. Am J Psy-chiatry 158 (2001): 931-937.
SERRANO-BLANCO, A., E. GABARRON, I. GARCIA-BAYO, M.SOLER-VILA, E. CARAMES, M.T. PENARRUBIA-MARIA, A.PINTO-MEZA and J.M. HARO. “Effectiveness and cost-ef-fectiveness of antidepressant treatment in primary health-care: A six-month randomised study comparing fluoxetineto imipramine”. J Affect Disord 91 (2006): 153-163.
SHIBUYA, K., C. CIECIERSKI, E. GUINDON, D.W. BETTCHER,D.B. EVANS and C.J. MURRAY. “WHO Framework Conven-tion on Tobacco Control: development of an evidence basedglobal public health treaty”. BMJ 327 (2003): 154-157.
SIEGEL, J.E., M.C. WEINSTEIN, L.B. RUSSELL and M.R.GOLD. “Recommendations for reporting cost-effectivenessanalyses. Panel on Cost-Effectiveness in Health andMedicine”. JAMA 276 (1996): 1339-1341.
SIMON G.E., W.J. KATON and M. VONKORFF. “Cost-effec-tiveness of a collaborative care program for primary carepatients with persistent depression”. Am J Psychiatry158 (2001): 1638-1644.
SOIKOS. Base de Datos de Costes Unitarios. 2001.
STEINBERG, E.P. “Cost-effectiveness analyses”. N Engl JMed 332 (1995): 123-125.
TAN TORRES, T., R.M. BALTUSSEN and T. ADAM. Makingchoices in health: WHO guide to cost-effectiveness analy-sis. Geneva: World Health Organization, 2003.
TENGS, T.O., M.F. ADAMS, J.S. PLISKIN, D.G. SAFRAN, J.E.SIEGEL, M.C. WEINSTEIN and J.D. GRAHAM. “Five-hundredlife-saving interventions and their cost-effectiveness”.Risk Anal 15 (1995): 369-390.
TORRANCE, G.W. and D. FEENY. “Utilities and quality-ad-justed life years”. Int J Technol Assess Healthcare 5(1989): 559-575.
TSUANG, M.T. and R.F. WOOLSON. “Mortality in patientswith schizophrenia, mania, depression and surgical con-ditions. A comparison with general population mortality”.Br J Psychiatry 130 (1977): 162-166.
UDVARHELYI, I.S., G.A. COLDITZ, A. RAI and A.M. EPSTEIN.“Cost-effectiveness and cost-benefit analyses in themedical literature. Are the methods being used cor-rectly?”. Ann Intern Med 116 (1992): 238-244.
UNITED NATIONS. United Nations Millenium Declaration.New York: United Nations, 2000.
USTUN, T.B., J.L. AYUSO-MATEOS, S. CHATTERJI, C.MATHERS and C.J. MURRAY. “Global burden of depressivedisorders in the year 2000”. Br J Psychiatry 184 (2004):386-392.
USTUN, T.B., J. REHM, S. CHATTERJI, S. SAXENA, R. TROT-TER, R. ROOM and J. BICKENBACH. “Multiple-informantranking of the disabling effects of different health condi-tions in 14 countries. WHO/NIH Joint Project CAR StudyGroup”. Lancet 354 (1999): 111-115.
VAZQUEZ-BARQUERO, J.L., M.J. CUESTA NUÑEZ, M. DE
LAVARGA, S. HERRERA CASTANEDO, L. GAITE and A. ARENAL.“The Cantabria first episode schizophrenia study: a sum-mary of general findings”. Acta Psychiatr Scand 91(1995): 156-162.
VAZQUEZ-POLO, F.J., M. NEGRIN, J.M. CABASES, E. SANCHEZ,J.M. HAROY, L. SALVADOR-CARULLA. “An analysis of the

96
REDUCING THE BURDEN OF MENTAL ILLNESS IN SPAIN
costs of treating schizophrenia in Spain: a hierarchicalbayesian approach”. J Ment Health Policy Econ 8(2005): 153-165.
VOS, T., M.M. HABY, A. MAGNUS, C. MIHALOPOULOS, G.ANDREWS and R. CARTER. “Assessing cost-effectivenessin mental health: helping policy-makers prioritize andplan health services”. Aust N Z J Psychiatry 39 (2005):701-712.
WARNER, K.E. and R.C. HUTTON. “Cost-benefit and cost-effectiveness analysis in healthcare. Growth and compo-sition of the literature”. Med Care 18 (1980): 1069-1084.
WEINSTEIN, M.C., J.E. SIEGEL, M.R. GOLD, M.S. KAMLET
and L.B. RUSSELL. “Recommendations of the Panel onCost-effectiveness in Health and Medicine”. JAMA 276(1996): 1253-1258.
WEINSTEIN, M.C. and W.B. STASON. “Foundations of cost-effectiveness analysis for health and medical practices”.N Engl J Med 296 (1977): 716-721.
WILLIAMS, A. “EuroQol- a new facility for the measurementof health-related QoL”. Health Policy 16 (1990): 199-208.
WORLD BANK. World development report: Investing inHealth. New York: Oxford University Press, 1993.
WORLD HEALTH ORGANIZATION. The ICD-10 Classificationof Mental and Behavioural Disorders: Clinical Descrip-tions and Diagnostic Guidelines. Geneva: World HealthOrganization, 1992.
—. The World Health Report 2001: Mental Health: NewUnderstanding, New Hope. Geneva: World Health Organi-zation, 2001.
—. The World Health Report 2002: Reducing risks, promot-ing healthy life. Geneva: World Health Organization, 2002.
ZHANG, P.L., J.M. SANTOS, J. NEWCOMER, B.A. PELFREY,M.C. JOHNSON and G.A. DE ERAUSQUIN. “Impact of atypi-cal antipsychotics on QoL, self-report of symptom sever-ity, and demand of services in chronically psychotic pa-tients”. Schizophr Res 71 (2004): 137-144.
97
List of Figures
Figure 3.1: Cost-effectiveness of interventions ................................................................................. 50
Figure 3.2: Uncertainty analysis results - cluster graph .................................................................... 51
Figure 3.3: Uncertainty analysis results - stochastic league table ...................................................... 51
Figure 4.1: Model for identifying research needs through the analysis of the burden of disease .......... 54
Figure 6.1: Condition transition model used by DISMOD .................................................................. 70
Figure 6.2: Estimated prevalence for the Spanish population in 2000 by age .................................... 71
Figure 7.1: Sensitivity analysis results ............................................................................................. 81
Figure 7.2: Uncertainty analysis results - cluster graph .................................................................... 82
Figure 7.3: Uncertainty analysis results - stochastic league table ...................................................... 82


99
List of Tables
Table 1: Types of decisions where a cost-effectiveness analysis is relevant .................................... 18
Table 2: Nine possible results of comparing two interventions in terms of cost and effectiveness .... 19
Table 2.1: Levels of health in the general population by age range ................................................... 39
Table 2.2: Disability weights for the depressive episode .................................................................. 39
Table 2.3: EQ-5D scores (baseline and after 6 months of tracking) .................................................. 45
Table 3.1: Burden of disease outcome for depression in Spain. Men ................................................ 47
Table 3.2: Burden of disease outcome for depression in Spain. Women............................................ 47
Table 3.3: Distribution of the burden of disease of depressive episodes according to levelof severity. Men ............................................................................................................ 48
Table 3.4: Distribution of the burden of disease of depressive episodes according to levelof severity. Women ........................................................................................................ 48
Table 3.5: Comparison of depression with lung cancer. Men ............................................................ 49
Table 3.6: Comparison of depression with breast cancer. Women ..................................................... 49
Table 3.7: Efficacy associated with the proposed interventions ........................................................ 49
Table 3.8: Costs per treated episode (in euros) ............................................................................... 49
Table 3.9: Total application costs (in euros) ................................................................................... 50
Table 3.10: Incremental cost-effectiveness ratios associated with the proposed interventions(DALYs) ........................................................................................................................ 50
Table 3.11: Cost-effectiveness ratios associated with the proposed interventions (QALYs) .................... 52
Table 5.1: Percentage of subjects diagnosed with schizophrenia with good social-functionalcourse according to scores using the DAS and GAF-D tools following tracking inthe ISoS sample ........................................................................................................... 60
Table 5.2: Increased percentage of «socially active» patients diagnosed as having schizophreniaaccording to the treatment followed after 6 months of monitoring .................................... 61
Table 5.3: Percentage of subjects diagnosed with schizophrenia who are employed .......................... 63
Table 5.4: Improvement in the QoL score (EQ-5D tool, 0 [worst] to 100 [best]) after 6 months’monitoring in the SOHO study ....................................................................................... 64
Table 5.5: Annual prevalence of schizophrenia and related disorders according to Spanishcase records, 1998 ....................................................................................................... 67
Table 6.1: Assumed distribution for the current scenario ................................................................. 72
Table 6.2: Assumed distribution for interventions with pharmacotherapy based on typicalantipsychotics .............................................................................................................. 72
Table 6.3: Assumed distribution for interventions with pharmacotherapy based on atypicalantipsychotics .............................................................................................................. 73
Table 6.4: EQ-5D scores (baseline and after 12 months of tracking) ................................................ 76

100
REDUCING THE BURDEN OF MENTAL ILLNESS IN SPAIN
Table 7.1: Burden of disease outcome for schizophrenia in Spain. Men ........................................... 77
Table 7.2: Burden of disease outcome for schizophrenia in Spain. Women ....................................... 78
Table 7.3: Costs associated with the proposed interventions ............................................................ 78
Table 7.4: Effectiveness associated with the proposed interventions ................................................ 79
Table 7.5: Cost-effectiveness ratios associated with the proposed interventions ................................ 80
Table 7.6: Incremental cost-effectiveness ratios associated with the proposed interventions .............. 80
Table 7.7: Cost-effectiveness ratios associated with the proposed interventions (QALYs) .................... 83


Economía y SociedadInformes 2008
Economía y Sociedad
Reducing the Burden of M
ental Illness in SpainInform
es 2008
José Luis Ayuso-MateosPedro Gutiérrez Recacha
Josep Maria HaroLuis Salvador Carulla
Francisco José Vázquez PoloMiguel Ángel Negrín Hernández
Daniel Chisholm
Gran Vía, 1248001 BilbaoEspañaTel.: +34 94 487 52 52Fax: +34 94 424 46 21
Paseo de Recoletos, 1028001 MadridEspañaTel.: +34 91 374 54 00Fax: +34 91 374 85 22
Reducing the Burden of Mental Illnessin SpainPopulation-Level Impactand Cost-Effectiveness of Treatmentsin Depression and Schizophrenia