in chianti (inchianti) study - connecting repositories · mireia urpi-sarda, phd,* stefania...
TRANSCRIPT

1
Low levels of a urinary biomarker of dietary polyphenol are associated with
substantial cognition decline over a three-year period in older adults: the Invecchiare
in Chianti (InCHIANTI) Study
Montserrat Rabassa, MsC,* Antonio Cherubini, MD, PhD,
† Raul Zamora-Ros, PhD,
‡
Mireia Urpi-Sarda, PhD,* Stefania Bandinelli, MD,
§ Luigi Ferrucci, MD, PhD,
# Cristina
Andres-Lacueva, PhD*
From the *Nutrition and Food Science Department, Biomarkers & Nutrimetabolomics Lab,
XaRTA, INSA, Pharmacy School, University of Barcelona, Barcelona, Spain; †Geriatrics &
Emergency Care, Italian National Research Centres on Aging (INRCA), Ancona, Italy; ‡Biomarkers group (BMA), Nutrition and Metabolism Section (NME), International
Agency for Research on Cancer (IARC), Lyon, France; §
Geriatric Rehabilitation Unit,
Azienda Sanitaria Firenze, Florence, Italy; #Longitudinal Studies Section, Clinical Research
Branch, National Institute on Aging, NIH, Baltimore, Maryland, United States.
Address correspondence to Cristina Andres-Lacueva, Nutrition and Food Science
Department, Biomarkers & Nutrimetabolomics Lab, XaRTA, INSA, Pharmacy School,
University of Barcelona, Barcelona, Spain. E-mail address: [email protected].
Abbreviated title: Total polyphenols and cognition decline
Key words: urinary polyphenols, dietary polyphenols, biomarker, cognition decline,
epidemiology.
ABSTRACT
Objectives: To investigate the association of total urinary polyphenols (TUP) and total
dietary polyphenols (TDP) with cognitive decline in an older population.
Design: The Invecchiare in Chianti (InCHIANTI) study, a cohort study with a 3-year of
follow-up. Setting: tuscany, italy. Participants: Non-demented adults aged 65 and older
(N=652). Measurements: TUP and TDP concentrations were analysed at baseline using
the Folin-Ciocalteu assay and a validated food frequency questionnaire, respectively.
Cognition was assessed using the Mini-Mental State Examination (MMSE) and Trail
Making Test (TMT) at baseline and after three years of follow-up. A substantial cognitive
decline was defined as a reduction in the MMSE score of 3 or more points and as an
increase of at least 29 seconds on the TMT A and 68 seconds on the TMT B (these
thresholds represent the worst 10% of the distribution of decline) or as test discontinued
due to multiple mistakes in TMT A and B at follow-up. Results: Higher TUP levels were
associated with lower risk of substantial cognitive decline on the MMSE (odds ratio [OR]
comparing extreme tertiles = 0.53; 95% confidence interval [CI] = 0.34–0.85; P-trend =
0.008) and on the TMT-A (OR = 0.52; 95 % CI = 0.28–0.96; P-trend = 0.03), but not on
TMT-B in a logistic regression model that adjusted for baseline cognitive score and
potential confounding factors. TDP did not affect the developing substantial cognitive
decline in both tests. Conclusion: High concentrations of polyphenols, a nutritional
biomarker of polyphenol intake, were associated with a lower risk of substantial cognitive
decline in the older population studied over a three-year period, suggesting a protective
effect against cognitive impairment.

2
INTRODUCTION
Cognitive decline in older persons encompasses a number of different conditions, from a
physiological age-associated reduction of cognitive functions that occurs in almost every
aging individual, the cognitive impairment that often accompanies a global deterioration of
health and comorbidity, up to the accelerated trajectory of cognitive decline that eventually
leads to mild cognitive impairment and dementia.1,2
There is increasing literature suggesting that dietary factors,3 and in particular long-chain
omega-3 fatty acids, low saturated-fat intake and high vegetable intake, are related to
cognitive performance in older subjects.4 Over the last few years, there has been much
scientific and public health interest in polyphenols5 due to their potential beneficial effects
against chronic diseases, particularly cardiovascular diseases, type 2 diabetes and some
cancers, and overall mortality.6-11
These secondary plant metabolites are natural bioactive
compounds, which have been identified in foods and beverages.12
Several epidemiological
studies have suggested that polyphenol-rich diets are positively associated with a better
cognitive function.13,14
The neuroprotective activity of dietary polyphenols might be due to
their antioxidant and anti-inflammatory properties.15
The protective effects of polyphenols against human diseases depend on the quantity
consumed and their bioavailability, which largely differs both between compounds and
between subjects (inter-individual variation), and within subjects (intra-individual
variation).16
In this context, a nutritional biomarker of total dietary polyphenols is essential
to provide an accurate assessment of polyphenol exposure in order to evaluate their
protective effects.17
Total urinary polyphenol (TUP) concentration determined by the Folin-
Ciocalteu assay, preferably analysed in 24-h urine samples,18
is considered an objective
biomarker of total dietary polyphenol intake (TDP),17,18
and a proxy measure of dietary
fruit and vegetable intake.19
To the best of our knowledge, there is only one recent cross-
sectional study showing that high TUP concentrations, expressed by urinary creatinine,
were associated with better scores in immediate verbal memory in older subjects at high
vascular risk.20
We aimed at expanding these findings in a longitudinal perspective by
studying the effect of baseline TUP concentrations, expressed by 24-h volume, and TDP,
and the risk of developing cognitive decline over a three-year period in older participants
free of dementia at baseline who were enrolled in the InCHIANTI (Invecchiare in Chianti,
Aging in the Chianti region) study.
METHODS
Study population
The InCHIANTI (www.inchiantistudy.net) is an ongoing prospective community-based
study designed to evaluate risk factors affecting the loss of mobility in the older population.
It was conducted in Bagno in Ripoli and Greve in Chianti, two Italian towns adjacent to the
city of Florence (Tuscany, Italy). Further details of the rationale and the study design have
been described elsewhere.21
The study protocol was approved by the Italian National
Research Council of Aging Ethical Committee, and all participants provided an informed
participation consent.
Data were collected at baseline and three years after enrolment. Baseline visits occurred
between 1998 and 2000, and three-year assessments took place between 2001 and 2003.
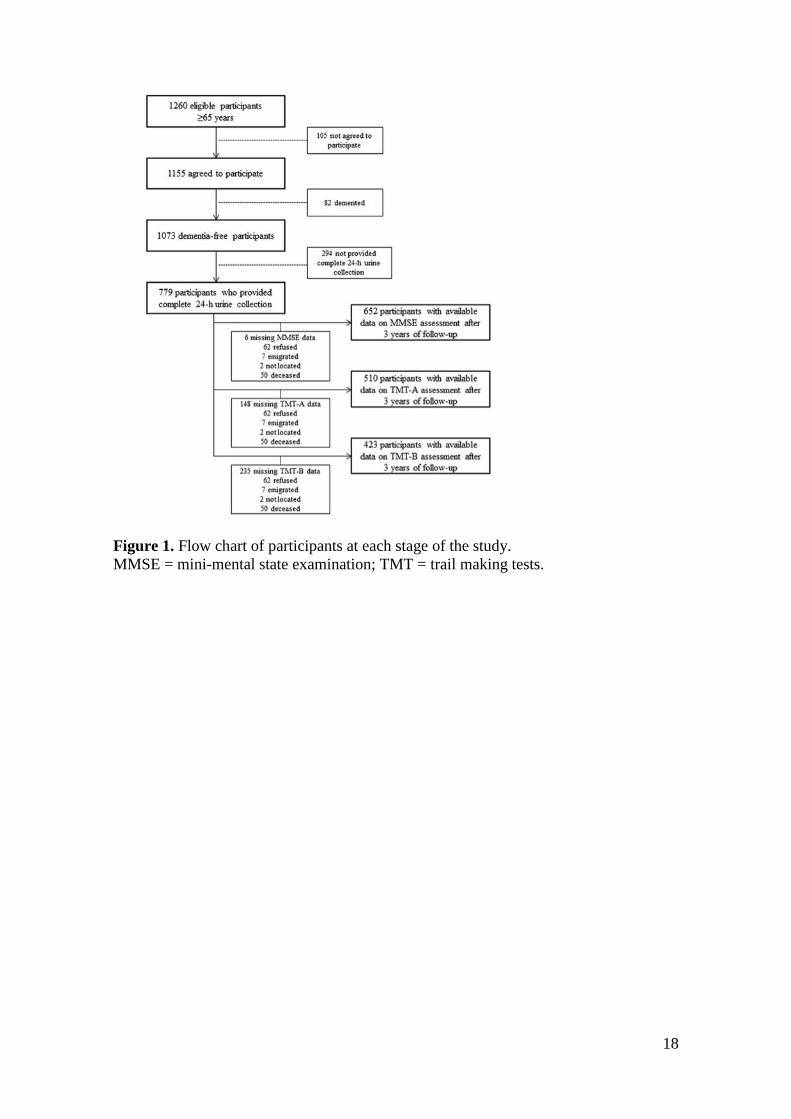
The study randomly sampled 1260 men and women aged 65 years and older, of whom
1155 agreed to participate (participation rate = 91.6%). Of these, we excluded 82
participants (7.1%) who were diagnosed with dementia syndrome at baseline by

3
geriatricians and psychologists with expertise in cognitive impairment. The final sample for
the current analysis included 652 dementia-free adults aged 65 years or older who provided
complete 24-h urine collection and had completed cognitive assessment after three years of
follow-up. Follow-up data for Trails A and B were available for 510 and 423 participants,
respectively (Figure 1).
Total polyphenols exposure
Twenty-four hour urine samples were collected at baseline. Urine samples were drawn,
processed and stored at –80ºC until analysis. Total urinary polyphenols (TUP) were
analysed by F-C assay, after solid-phase extraction as described previously.18,19
TUP
concentrations were expressed as mg gallic acid equivalents (GAE)/d.
Food intake (g/day) was assessed using the Italian version of the food frequency
questionnaire developed and validated in the European Prospective Study into Cancer and
Nutrition (EPIC) study.22
Briefly, a self-administered quantitative dietary questionnaire,
including 236 food items and structured by courses within a meal characteristic of Italian
dietary habits, was used. Portion sizes were estimated using natural units, household
measures and grammage, or with the aid of a set of photographs. Energy (kcal/d) intake
was calculated using an Italian food composition database created for the EPIC study.23
TDPs were estimated using our food composition database on polyphenols.11
It was
compiled from the three most updated U.S. Department of Agriculture databases
(flavonoids, isoflavones, and proanthocyanidins)24-26
and the Phenol-Explorer database.27
TDP intake was calculated as the sum of flavonoids (anthocyanidins, flavonols, flavanones,
flavones, flavanols [including flavan-3-ol monomers, theaflavins and proanthocyanidins]
and isoflavones), phenolic acids, lignans, stilbenes and other polyphenols, and was
expressed as aglycone equivalents (mg/day),27
after the conversion of polyphenol glycoside
and ester contents into aglycone contents on the basis of their respective molecular weights.
Cognitive tests
The mini-mental state examination (MMSE) is a validated method to assess global
cognitive function, widely used in both clinical practice and research, and is an effective
screening tool for cognitive impairment in older, community-dwelling, hospitalized and
institutionalized adults.28,29
MMSE is an 11-question test that evaluates five areas of
cognitive function: orientation, registration, attention and calculation, recall, and language.
Scores for the MMSE range from 0 to 30, with higher scores indicating better cognitive
function. The trail making tests (TMT) is a neuropsychological test commonly used in
clinical evaluation for the assessment of cognitive abilities such as visual-conceptual and
visual-motor tracking, sustained attention, and task alternation abilities.30,31
The TMT
consists of two parts administered in sequence: TMT-A and TMT-B. Part A is focused
particularly on attention, whereas Part B is focused on executive function. Worse
performance is indicated by longer times, measured in seconds, to complete the Trails A
and B.
A substantial cognitive decline was defined as a decline in the MMSE score of 3 or more
points from baseline to three years later,28,29
and as an increase of at least 29 seconds on the
TMT-A and 68 seconds on the TMT-B (these thresholds represent the worst 10% of the
distribution of subtracting baseline from three-year follow-up scores in seconds) or the test
discontinued at follow-up, but not at baseline, due to multiple mistakes in TMT-A and
TMT-B.32

4
Other baseline covariates
Trained clinicians ascertained diseases based on information from self-reported physician
diagnoses, drug treatments, medical history, clinical examinations and blood tests. Smoking
status (current, former, and never a smoker), age, sex, education (years of schooling) and
body mass index (kg/m2) were reported or measured. Physical activity was measured using
a modified standard questionnaire33
and was defined as: 1) sedentary (completely inactive
or performing light-intensity physical activity less than <2h/wk.); 2) light physical activity
(light-intensity physical activity of 2–4h/wk.); and 3) moderate to high physical activity
(light-intensity physical activity of at least >4h/wk. or moderate-intensity physical activity
at least 1–2 h/wk.). Specific co-morbidities considered in this analysis were congestive
heart failure, stroke, cancer and diabetes. Renal function was calculated using the
Cockcroft–Gault formula: (140−Age) x Weight x [0.85 if female] / (72 x Serum Creatinine)
and was classified into a dichotomous variable: normal renal function (≥60mL/min) and
impaired renal function (<60mL/min).34
Depressive symptoms were assessed using the
Center for Epidemiological Studies-Depression Scale (CES-D) and were defined as CES-D
of 16 or higher and CES-D lower than 16.35
Total blood cholesterol was measured using an
automated enzymatic method.36
Statistical analysis
Descriptive statistics were used to describe participants’ characteristics, means and standard
deviations (SD) for normal continuous variables, medians and interquartile ranges (IQR)
for variables with asymmetric distribution, and number of participants and percentages for
categorical variables. Baseline characteristics were compared across TUP and TDP tertiles
using age-adjusted generalized linear models. Spearman correlations were used to explore
the relationships between TUP, TDP and the sum of fruit and vegetable intake. Linear
regression models were used to evaluate associations between baseline cognitive
performance (MMSE, TMT-A and TMT-B) and TDP and TUP tertiles. For TMT test
performance, the inverse score was used; thus, a higher score corresponded to a better
result. Logistic regression models were used to calculate odds ratios (ORs) and 95%
confidence intervals (CIs) between TUP and TDP concentrations and substantial cognition
decline. In unadjusted models, we controlled for baseline cognitive score only (Model A).
In multivariable models, we adjusted for variables that have been identified as potential
confounders: sex, age, education, body mass index, total energy intake, physical activity,
baseline cognitive score, impaired renal function, smoking status, congestive heart failure,
cancer, stroke, diabetes, depressive symptoms and total blood cholesterol (Model B). TUPs
were analysed as tertiles of the whole cohort according to the following cut-off points:
126.4 and 175.5 mg GAE/d urine. TDPs were also categorized as tertiles of the whole
cohort according to the following cut-off points: 514.2 and 648.4 mg/d aglycones. Tests for
linear trend were performed by considering the median of each tertile as an ordinal
variable. TUPs and TDPs were also analysed as a log2-transformed continuous variables
since they were not normally distributed. Interactions between TDP and TUP
concentrations and sex, age, BMI, education and smoking status were tested by including
product terms in fully adjusted logistic regression models. There was no evidence of
colinearity. In sensitivity analyses, we assessed models for TDP excluding participants in
the top or the bottom 1% of the distribution of the ratio of reported total energy intake to
estimated energy requirement to minimize the potential effect of over- and under-reporters.

5
All statistical tests were two-tailed and were performed using the SPSS package program,
version 20.0 (SPSS, Chicago, IL). The significance level was p<0.05.
RESULTS
The main characteristics of the study population according to tertiles of TUP and TDP,
adjusted for age, are summarized in Table 1. The study included 361 women (55.4%) and
291 men (44.6%) with a mean age of 73 years. From the lowest to the highest TUP tertiles,
participants were younger and more likely to be men. The percentage of participants who
experienced substantial cognitive decline on TMT-A over the three-year follow-up, and of
those who at baseline had depressive symptoms and cancer progressively decreased with
increasing TUP tertiles. While the inverse associations between TUP tertiles and substantial
cognitive decline and change in cognitive score on MMSE were borderline significant.
Moreover, from the lowest to the highest TUP tertiles, participants had a higher energy
intake. There were no significant differences across the tertiles of TUP in BMI, education,
smoking status, physical activity, fruit and vegetable consumption, total cholesterol,
congestive heart failure and stroke. From the lowest to the highest tertiles of TDP,
participants were younger, with a lower proportion of women, less often current and former
smokers, had a higher education, physical activity, energy dietary intake, dietary fruit and
vegetable consumption, and had lower total cholesterol. Participants with a substantial
cognitive function decline after three-years of follow-up were older and more likely to be
women, had a lower educational achievement and physical activity level, and a higher
prevalence of stroke and congestive heart failure than those without cognitive decline.
Participants excluded from this study (n=503) were significantly older (P<0.001), took
more medications (P=0.04), had lower physical activity (P<0.001), and had more often
renal impairment (P=0.006) than those included, whereas there were no significant
differences in sex and smoking status (results not shown). TUP were significantly
correlated with the intake of fruit and vegetables (rho=0.141; P<0.001) and TDP
(rho=0.131; P<0.001).
In linear regression models adjusted for potential confounding factors, TUP levels were
positively associated with the MMSE (β = 0.076; SE = 0.243, P = 0.042) and the TMT-A
(β = 0.086; SE = 5.174, P = 0.016), but not with the TMT-B (β = 0.014; SE = 6.835, P =
0.73). No associations between TDP intake and any of the cognitive tests at baseline were
observed.
In logistic regression models adjusting for baseline cognitive scores and compared to
participants in the lowest TUP tertile, those in the highest TUP tertile were significantly
less likely to experience substantial cognitive decline both when assessed by the MMSE
(OR = 0.53; 95% CI = 0.35–0.80; P-trend = 0.003) and the TMT-A (OR = 0.50; 95% CI =
0.28–0.89; P-trend = 0.02) (Table 2, Model A). This association remained statistically
significant after full adjustment for potential confounders both for the MMSE (highest vs.
lowest tertile OR = 0.53; 95% CI = 0.34–0.85; P-trend = 0.008) and the TMT-A (OR =
0.52; 95% CI = 0.28–0.96; P-trend = 0.03). No significant association between TUP
concentrations and TMT-B was observed (Table 2, Model B). In fully adjusted models
using MMSE, TMT-A and TMT-B tests, no statistically significant interactions were
detected for sex, age, BMI, education and smoking status.
In multivariable logistic models adjusted for all confounders, no statistically significant
associations were found between TDP and substantial cognitive decline risk using the
6
MMSE (highest vs. lowest tertile OR = 1.08; 95% CI = 0.65–1.78; P-trend = 0.84), the
TMT-A (OR = 0.63; 95% CI = 0.32–1.25; P-trend = 0.17) and the TMT-B (OR = 1.16;
95% CI = 0.63–2.14; P-trend = 0.77) (Appendix Table S1, Model B). Again, we found no
significant interactions between MMSE, TMT-A or TMT-B and sex, age, BMI, education,
and smoking status.
Sensitivity analyses were performed by excluding from the analysis participants in the top
or the bottom 1% of the distribution of the ratio of total energy intake for TDP. The odds
ratios for the sensitivity analyses were nearly identical to the results based on the whole
cohort (data not shown).
DISCUSSION
In this population-based study of non-demented older people, high concentrations of TUP
were associated with an approximate 47 and 48% reduction of the risk of substantial
cognitive decline in global cognitive function (tested using the MMSE) and in attention
(measured using the TMT-A) over a three-year period, respectively, but not with the TMT-
B, which is mainly focused on measuring executive function. No significant association
was found between TDP and any cognitive test, as was also observed with all-cause
mortality in a previous InCHIANTI study.11
This may be due to the difficulty in assessing
TDP intake. While a part of polyphenol intake, TUP also accounts for the bioavailability of
polyphenols16
and may therefore be a more precise measure of true exposure due to the
large variability between and within polyphenol absorption and metabolism.17
In a cross-sectional study, total polyphenols expressed by urinary creatinine normalization
were linearly associated with better scores in immediate verbal memory in older adults at
high cardiovascular risk.20
In the middle-aged SU.VI.MAX cohort, high total polyphenol
intake, estimated using six repeated 24h dietary recalls, was associated with better language
and verbal memory after a follow-up of 13 years.14
Similar to our results between TUP or
TDP and TMT-B, no significant associations were observed between TDP and executive
functioning in the SU.VI.MAX study14
. Furthermore, in other prospective studies, the
intake of flavonoids was associated with a better cognitive evolution in dementia-free older
adults13
and a lower risk of Alzheimer’s disease, the most common form of dementia.37,38
In
another prospective study, the consumption of fruit and vegetables, and thus antioxidant
nutrients (vitamin E and C), was associated with better verbal memory.39
In the present study, higher levels of TUP at baseline also had a better cognitive
performance as in the PREDIMED study.20
However, no association was observed with
TDP. As far as we know, no cross-sectional studies have focused on the relationship
between TDP and cognitive function. In a small subsample of post-menopausal women
from the PROSPECT study, which is one of the Dutch cohorts included in the EPIC study,
higher intakes of lignans, but not isoflavones, were associated with higher MMSE scores at
enrolment.40
Whereas, in the Lothian Birth Cohort 1936, flavonoid intake was not
associated with any of the cognitive tests performed after adjusting for confounding factors
at the age of 70 years old.41
The potential mechanisms of the protective effects of polyphenols on cognitive functions
may be linked to their antioxidant and anti-inflammatory properties. It is known that
polyphenols reduce neuronal damage and death from oxidative reactions by inhibiting the
generation of reactive oxygen species, lipid peroxidation, apoptosis, protein oxidation,
7
metal chelation and damage to cellular signaling.15,42-46
Potential actions of polyphenols
may be mediated by the direct interactions within ERK and PI3-kinase/Akt signalling
pathways, which have been associated with the maintenance of the number and quality of
synaptic connections in key brain regions.47
Additional mechanisms are related to the
inhibition of neuronal apoptosis activated by neurotoxic species or the disruption of
amyloid β aggregation and effects on amyloid precursor protein processing through the
inhibition of β-secretase and/or activation of α-secretase.47
Our study has several strengths. First of all, to the best of our knowledge, this is the first
prospective study to investigate the association between total polyphenols and substantial
cognitive decline in an older population. Moreover, urinary polyphenols expressed by 24-h
volume are an objective biomarker of total phenolic intake18
and a proxy biomarker of fruit
and vegetable consumption.19
The main advantage of a nutritional biomarker over a dietary
biomarker is that it is a more precise and more proximal measure than dietary assessment.48
Currently, the adapted F-C assay in urine samples is considered a valid biomarker for total
polyphenol intake and is a rapid, economic and easy method to apply to large-scale
epidemiological studies. TUP expressed as 24-h volume is considered the gold standard to
assess urinary excretion.18
Then cognitive functions were assessed using the MMSE – the
most widely used instrument for measuring the course of cognitive change in an older adult
over time28,29
– and TMT-A and TMT-B, which are also commonly used in the assessment
of psychomotor speed, visuospatial scanning, and executive ability.30,31
Finally, our logistic
regression models were adjusted for the most important confounding variables related to
cognitive decline, such as: sociodemographic characteristics, health behaviours and chronic
diseases.
However, our study also has some limitations. First, the InCHIANTI study was performed
in community dwelling older subjects living in two sites of the Tuscany region (Italy);
therefore the sample might not be representative of the general Italian population. Second,
cognitive decline is a heterogeneous condition and in our study its underlying cause was not
assessed. Third, our results may be influenced by measurement errors in the dietary
questionnaires. Furthermore, the present study population is ≥65 years old, and therefore,
they may be less reliable in recalling food intake than younger subjects. However, the food
frequency dietary questionnaire was country-specific and previously validated for some
polyphenol-rich foods, such as fruits, vegetables, tea, coffee and wine, in a similar
population,22
and, moreover, those participants with dementia syndrome at baseline were
excluded. In addition, dietary consumption of polyphenols may be underestimated, since
the food composition tables for polyphenols were not totally completed. However, for our
study an extensive common database was used.11,18
In conclusion, we found that in non-demented older adults higher TUP concentrations were
associated with a lower risk of substantial cognitive decline over a three-year period after
adjusting for potential confounders. No significant association was found using TDP. Our
findings suggest a protective effect of total polyphenols and, indirectly, diets rich in
polyphenols, against cognitive decline risk in older adults. Further epidemiological studies
and clinical trials are warranted to clarify the potential preventive role of polyphenols and
their underlying mechanisms. The identification of factors that reduce or delay cognitive
decline is essential to improve the autonomy and quality of life of older people.

8
ACKNOWLEDGMENTS
Conflict of interest: None of the authors reported any conflicts of interest. All authors had
access to the data and a role in writing the manuscript.
The InCHIANTI study is supported in part by the Italian Ministry of Health and by the
United States National Institute on Aging (NIA). The authors are grateful for the support
granted by the Spanish government grants from Ministry of Economy and competitiveness
(MINECO) and cofounded by FEDER (Fondo Europeo de Desarrollo Regional):
AGL2009-13906-C02-01, the CONSOLIDER-INGENIO 2010 program, FUN-C-Food
(CSD2007-063), as well as
PI13/01172 Project (Plan N de I+D+I 2013-2016) by ISCII-Subdirección General de
Evaluación y Fomento de la Investigación. We also thank the award of 2014SGR1566 from
the Generalitat de Catalunya’s Agency AGAUR. Partially funded by the International Nut
and Dried Fruit Council Foundation (INC) in collaboration with the Bosch I Gimpera
Foundation (FBG307906). M.R. thanks the training abroad MAPFRE Grant. A.C. thanks
the PIE-BKC, Campus of International Excellence (CEI) program of the Spanish Ministry
of Education, Culture and Sport. M.U.-S. would like to thank the “Ramón y Cajal” program
(RYC-2011-09677) from MINECO and the Fondo Social Europeo.

9
Conflict of Interest Disclosures: None of the authors reported any conflicts of interest.
Elements of
Financial/Personal
Conflicts
* CA-L LF AC MR, RZ-R, MU-
S; SB
Yes No Yes No Yes No Yes No
Employment or Affiliation X X X X
Grants/Funds X X X X
Honoraria X X X X
Speaker Forum X X X X
Consultant X X X X
Stocks X X X X
Royalties X X X X
Expert Testimony X X X X
Board Member X X X X
Patents X X X X
Personal Relationship X X X X
*Authors can be listed by abbreviations of their names.
For “yes” x mark(s): give brief explanation below:
Author contributions: MR, AC and CA-L designed the research. MR, MU-S and CA-L
performed the samples analyses. MR and RZ-R conducted the statistical analysis. MR
drafted the manuscript and AC and RZ-R provided critical revision. SB and LF conceived
of the study, participated in its design and coordination. All authors read and approved the
final manuscript.
Sponsor’s role: none.
10
REFERENCES
1. Albert MS. Changes in cognition. Neurobiol Aging 2011;32 Suppl 1:S58-63.
2. Albert MS, DeKosky ST, Dickson D et al. The diagnosis of mild cognitive impairment
due to Alzheimer's disease: recommendations from the National Institute on Aging-
Alzheimer's Association workgroups on diagnostic guidelines for Alzheimer's disease.
Alzheimers Dement 2011;7:270-279.
3. Gillette Guyonnet S, Abellan Van Kan G, Andrieu S et al. IANA task force on nutrition
and cognitive decline with aging. J Nutr Health Aging 2007;11:132-152.
4. Daviglus ML, Bell CC, Berrettini W et al. National Institutes of Health State-of-the-
Science Conference statement: preventing alzheimer disease and cognitive decline. Ann
Intern Med 2010;153:176-181.
5. Albarracin SL, Stab B, Casas Z et al. Effects of natural antioxidants in
neurodegenerative disease. Nutr Neurosci 2012;15:1-9.
6. Cassidy A, Mukamal KJ, Liu L et al. High anthocyanin intake is associated with a
reduced risk of myocardial infarction in young and middle-aged women. Circulation
2013;127:188-196.
7. van Dam RM, Naidoo N, Landberg R. Dietary flavonoids and the development of type 2
diabetes and cardiovascular diseases: review of recent findings. Curr Opin Lipidol
2013;24:25-33.
8. Geybels MS, Verhage BAJ, Arts IC et al. Dietary Flavonoid Intake, Black Tea
Consumption, and Risk of Overall and Advanced Stage Prostate Cancer. Am J Epidemiol
2013;177:1388-1398.
9. Zamora-Ros R, Jimenez C, Cleries R et al. Dietary flavonoid and lignan intake and
mortality in a Spanish cohort. Epidemiology 2013;24:726-733.
10. Zamora-Ros R, Forouhi NG, Sharp SJ et al. The Association Between Dietary
Flavonoid and Lignan Intakes and Incident Type 2 Diabetes in European Populations: The
EPIC-InterAct Study. Diabetes Care 2013; 36:3961-3970.
11. Zamora-Ros R, Rabassa M, Cherubini A et al. High concentrations of a urinary
biomarker of polyphenol intake are associated with decreased mortality in older adults. J
Nutr 2013;143:1445-1450.
12. Perez-Jimenez J, Fezeu L, Touvier M et al. Dietary intake of 337 polyphenols in
French adults. Am J Clin Nutr 2011;93:1220-1228.
13. Letenneur L, Proust-Lima C, Le Gouge A et al. Flavonoid intake and cognitive decline
over a 10-year period. Am J Epidemiol 2007;165:1364-1371.
14. Kesse-Guyot E, Fezeu L, Andreeva VA et al. Total and specific polyphenol intakes in
midlife are associated with cognitive function measured 13 years later. J Nutr 2012;142:76-
83.
15. Vauzour D. Dietary polyphenols as modulators of brain functions: biological actions
and molecular mechanisms underpinning their beneficial effects. Oxid Med Cell Longev
2012;2012:914273.
16. Landete JM. Updated knowledge about polyphenols: functions, bioavailability,
metabolism, and health. Crit Rev Food Sci 2012;52:936-948.
17. Zamora-Ros R, Rabassa M, Llorach R et al. Application of Dietary Phenolic
Biomarkers in Epidemiology: Past, Present, and Future. J Agric Food Chem 2012;60:6648-
6657.
11
18. Zamora-Ros R, Rabassa M, Cherubini A et al. Comparison of 24-h volume and
creatinine-corrected total urinary polyphenol as a biomarker of total dietary polyphenols in
the Invecchiare InCHIANTI study. Anal Chim Acta 2011;704:110-115.
19. Medina-Remon A, Barrionuevo-Gonzalez A, Zamora-Ros R et al. Rapid Folin-
Ciocalteu method using microtiter 96-well plate cartridges for solid phase extraction to
assess urinary total phenolic compounds, as a biomarker of total polyphenols intake. Anal
Chim Acta 2009;634:54-60.
20. Valls-Pedret C, Lamuela-Raventos RM, Medina-Remon A et al. Polyphenol-rich foods
in the Mediterranean diet are associated with better cognitive function in elderly subjects at
high cardiovascular risk. J Alzheimers Dis 2012;29:773-782.
21. Ferrucci L, Bandinelli S, Benvenuti E et al. Subsystems contributing to the decline in
ability to walk: bridging the gap between epidemiology and geriatric practice in the
InCHIANTI study. J Am Geriatr Soc 2000;48:1618-1625.
22. Pisani P, Faggiano F, Krogh V et al. Relative validity and reproducibility of a food
frequency dietary questionnaire for use in the Italian EPIC centres. Int J Epidemiol 1997;26
Suppl 1:S152-160.
23. Salvini S. A food composition database for epidemiological studies in Italy. Cancer
Lett 1997;114:299-300.
24. U.S. Department of Agriculture, Agricultural Research Service. 2011. USDA Database
for the Flavonoid Content of Selected Foods, Release 3. Nutrient Data Laboratory.
25. U.S. Department of Agriculture, Agricultural Research Service. 2008. USDA Database
for the Isoflavone Content of Selected Foods, Release 2.0. Nutrient Data Laboratory.
26. U.S. Department of Agriculture, Agricultural Research Service. 2004. USDA Database
for the Proanthocyanidin Content of Selected Foods. Nutrient Data Laboratory.
27. Neveu V, Perez-Jimenez J, Vos F et al. Phenol-Explorer: an online comprehensive
database on polyphenol contents in foods. Database (Oxford) 2010;2010:bap024.
28. Mitchell AJ. A meta-analysis of the accuracy of the mini-mental state examination in
the detection of dementia and mild cognitive impairment. J Psychiatr Res 2009;43:411-431.
29. Folstein MF, Folstein SE, McHugh PR. "Mini-mental state". A practical method for
grading the cognitive state of patients for the clinician. J Psychiatr Res 1975;12:189-198.
30. Reitan RM. Validity of the Trail Making Test as an indicator of organic brain damage.
Percept Motor Skills 1958;8:271-276.
31. Reitan RM. Trail Making Test: Manual for Administration and Scoring. Reitan
Neuropsychology Laboratory; Tuscon, AZ: 1992.
32. Llewellyn DJ, Lang IA, Langa KM et al. Vitamin D and risk of cognitive decline in
elderly persons. Arch Intern Med 2010;170:1135-1141.
33. Ainsworth BE, Haskell WL, Leon AS et al. Compendium of physical activities:
classification of energy costs of human physical activities. Med Sci Sports Exerc
1993;25:71-80.
34. Cockcroft DW, Gault MH. Prediction of creatinine clearance from serum creatinine.
Nephron 1976;16:31-41.
35. Radloff LS. The center for epidemiologic studies depression scale a self report
depression scale for research in the general population. Applied Psychological
Measurement 1977;1(3):385-401.
36. Friedewald WT, Levy RI, Fredrickson DS. Estimation of the concentration of low-
density lipoprotein cholesterol in plasma, without use of the preparative ultracentrifuge.
Clinical Chemistry 1972;18(6):499-502.
12
37. Engelhart MJ, Geerlings MI, Ruitenberg A et al. Dietary intake of antioxidants and risk
of Alzheimer disease. JAMA 2002;287(24):3223-9.
38. Beking K, Vieira A. Flavonoid intake and disability-adjusted life years due to
Alzheimer's and related dementias: a population-based study involving twenty-three
developed countries. Public health nutrition 2010;13(9):1403-9.
39. Peneau S, Galan P, Jeandel C et al. Fruit and vegetable intake and cognitive function in
the SU.VI.MAX 2 prospective study. American Journal of Clinical Nutrition
2011;94(5):1295-303.
40. Franco OH, Burger H, Lebrun CEI, et al. Higher dietary intake of lignans is associated
with better cognitive performance in postmenopausal women. J Nutr 2005;135(5):1190-5.
41. Butchart C, Kyle J, McNeill G, et al. Flavonoid intake in relation to cognitive function
in later life in the Lothian Birth Cohort 1936. Br J Nutr 2011;106(1):141-8.
42. Rossi L, Mazzitelli S, Arciello M et al. Benefits from dietary polyphenols for brain
aging and Alzheimer's disease. Neurochemical Research 2008;33(12):2390-400.
43. Joseph J, Cole G, Head E et al. Nutrition, brain aging, and neurodegeneration. Journal
of Neuroscience 2009;29(41):12795-801.
44. Gonzalez-Gallego J, Garcia-Mediavilla MV, Sanchez-Campos S et al. Fruit
polyphenols, immunity and inflammation. British Journal of Nutrition 2010;104 Suppl
3:S15-27.
45. Spencer JP, Vafeiadou K, Williams RJ et al. Neuroinflammation: modulation by
flavonoids and mechanisms of action. Molecular Aspects of Medicine 2012;33(1):83-97.
46. Schaffer S, Asseburg H, Kuntz S et al. Effects of polyphenols on brain ageing and
Alzheimer's disease: focus on mitochondria. Molecular Neurobiology 2012;46(1):161-78.
47. Williams RJ, Spencer JP. Flavonoids, cognition, and dementia: actions, mechanisms,
and potential therapeutic utility for Alzheimer disease. Free Radical Biology and Medicine
2012;52(1):35-45.
48. Jenab M, Slimani N, Bictash M et al. Biomarkers in nutritional epidemiology:
applications, needs and new horizons. Human Genetics 2009;125(5-6):507-25.

13
GRAPHICS
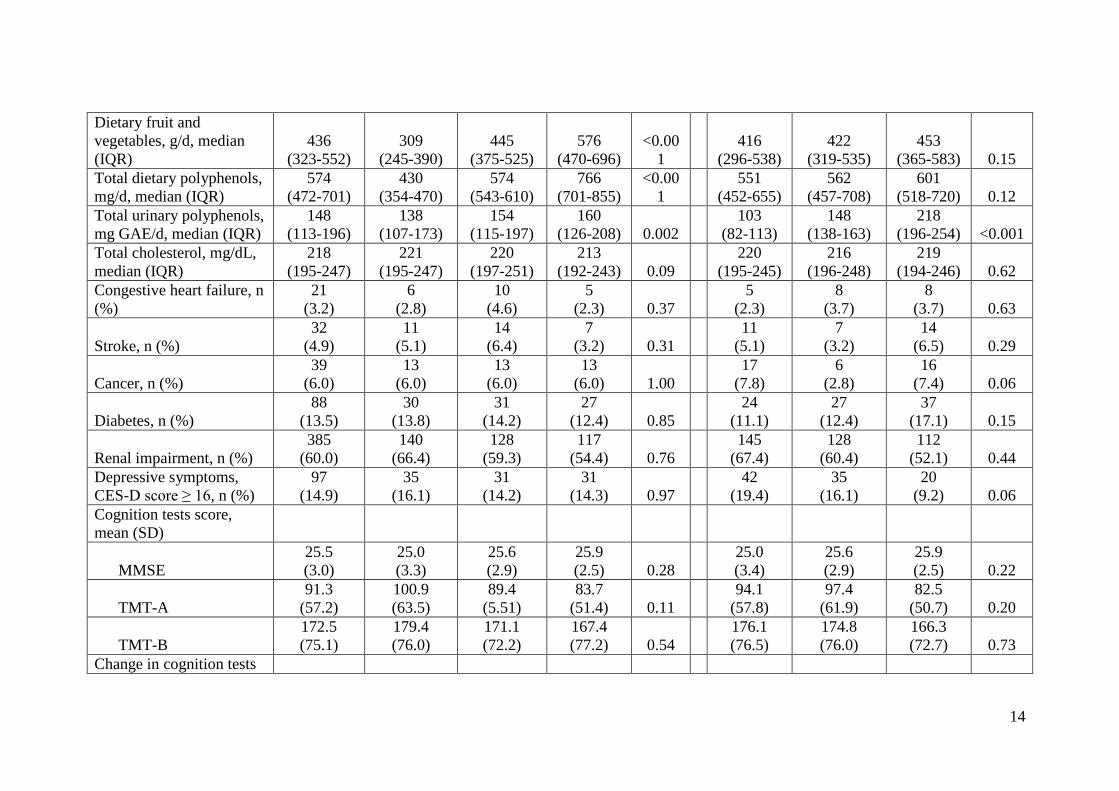
Table 1. Characteristics of the study population according to tertiles of total urinary polyphenols (TUP) and total dietary polyphenols (TDP)
Characteristic All
(N=652)
TDP TUP
Tertile 1
(n=217)
Tertile 2
(n=218)
Tertile 3
(n=217)
P-
valuea
Tertile 1
(n=217)
Tertile 2
(n=218)
Tertile 3
(n=217)
P-
valuea
Age, mean (SD)
73.4
(6.4)
75.0
(7.2)
73.1
(6.0)
72.2
(5.6)
<0.00
1
74.8
(6.9)
73.8
(6.5)
71.8
(5.3) <0.001
Female, n (%)
361
(55.4)
148
(68.2)
120
(55.0)
93
(42.9)
<0.00
1
137
(63.1)
119
(54.6)
105
(48.4) 0.03
BMI, kg/m2, mean (SD)
27.6
(4.0)
27.6
(4.2)
27.5
(3.9)
27.6
(3.7) 0.85
27.2
(4.0)
27.6
(4.0)
28.0
(3.8) 0.35
Education, years, mean
(SD)
5.6
(3.2)
5.0
(3.0)
5.7
(3.4)
6.0
(3.2) 0.07
5.2
(3.0)
5.7
(3.8)
5.8
(2.9) 0.54
Physical activity, n (%)
0.003
0.53
Sedentary
106
(16.3)
49
(22.7)
36
(16.5)
21
(9.8)
45
(20.8)
32
(14.8)
29
(13.4)
Light
291
(44.8)
106
(49.1)
92
(42.2)
93
(43.3)
96
(44.4)
101
(46.8)
94
(43.3)
Moderate to high
252
(38.8)
61
(28.2)
90
(41.3)
101
(47.0)
75
(34.7)
83
(38.4)
94
(43.3)
Smoking status, n (%)
0.04
0.33
Never smoker
387
(59.4)
147
(67.7)
130
(59.6)
110
(50.7)
138
(63.6)
137
(62.8)
112
(51.6)
Former smoker
175
(26.8)
46
(21.2)
53
(24.3)
76
(35.0)
45
(20.7)
53
(24.3)
77
(35.5)
Current smoker
90
(13.8)
24
(11.1)
35
(16.1)
31
(14.3)
34
(15.7)
28
(12.8)
28
(12.9)
Energy intake, kcal/d,
mean (SD)
1921
(549)
1608
(437)
1918
(456)
2237
(558)
<0.00
1
1830
(534)
1909
(532)
2024
(566) 0.02
14
Dietary fruit and
vegetables, g/d, median
(IQR)
436
(323-552)
309
(245-390)
445
(375-525)
576
(470-696)
<0.00
1
416
(296-538)
422
(319-535)
453
(365-583) 0.15
Total dietary polyphenols,
mg/d, median (IQR)
574
(472-701)
430
(354-470)
574
(543-610)
766
(701-855)
<0.00
1
551
(452-655)
562
(457-708)
601
(518-720) 0.12
Total urinary polyphenols,
mg GAE/d, median (IQR)
148
(113-196)
138
(107-173)
154
(115-197)
160
(126-208) 0.002
103
(82-113)
148
(138-163)
218
(196-254) <0.001
Total cholesterol, mg/dL,
median (IQR)
218
(195-247)
221
(195-247)
220
(197-251)
213
(192-243) 0.09
220
(195-245)
216
(196-248)
219
(194-246) 0.62
Congestive heart failure, n
(%)
21
(3.2)
6
(2.8)
10
(4.6)
5
(2.3) 0.37
5
(2.3)
8
(3.7)
8
(3.7) 0.63
Stroke, n (%)
32
(4.9)
11
(5.1)
14
(6.4)
7
(3.2) 0.31
11
(5.1)
7
(3.2)
14
(6.5) 0.29
Cancer, n (%)
39
(6.0)
13
(6.0)
13
(6.0)
13
(6.0) 1.00
17
(7.8)
6
(2.8)
16
(7.4) 0.06
Diabetes, n (%)
88
(13.5)
30
(13.8)
31
(14.2)
27
(12.4) 0.85
24
(11.1)
27
(12.4)
37
(17.1) 0.15
Renal impairment, n (%)
385
(60.0)
140
(66.4)
128
(59.3)
117
(54.4) 0.76
145
(67.4)
128
(60.4)
112
(52.1) 0.44
Depressive symptoms,
CES-D score ≥ 16, n (%)
97
(14.9)
35
(16.1)
31
(14.2)
31
(14.3) 0.97
42
(19.4)
35
(16.1)
20
(9.2) 0.06
Cognition tests score,
mean (SD)
MMSE
25.5
(3.0)
25.0
(3.3)
25.6
(2.9)
25.9
(2.5) 0.28
25.0
(3.4)
25.6
(2.9)
25.9
(2.5) 0.22
TMT-A
91.3
(57.2)
100.9
(63.5)
89.4
(5.51)
83.7
(51.4) 0.11
94.1
(57.8)
97.4
(61.9)
82.5
(50.7) 0.20
TMT-B
172.5
(75.1)
179.4
(76.0)
171.1
(72.2)
167.4
(77.2) 0.54
176.1
(76.5)
174.8
(76.0)
166.3
(72.7) 0.73
Change in cognition tests

15
scores, mean (SD)
MMSE
-0.6
(3.7)
-0.9
(4.2)
-0.5
(3.2)
-0.3
(3.5) 0.74
-0.9
(3.7)
-0.9
(4.3)
0.0
(2.8) 0.09
TMT-A
-8.5
(41.1)
-14.8
(45.1)
-5.0
(41.8)
-6.4
(35.9) 0.07
-3.7
(38.3)
-13.5
(48.5)
-8.3
(35.4) 0.12
TMT-B
-8.6
(58.3)
-14.4
(58.7)
0.4
(57.4)
-11.7
(58.6) 0.26
-8.0
(58.2)
-2.6
(50.3)
-14.5
(64.8) 0.48
Substantial cognitive
decline, n (%)b
MMSE
203
(31.1)
68
(31.3)
73
(33.5)
62
(28.6) 0.57
80
(36.9)
71
(32.6)
52
(24.0) 0.07
TMT-A
103
(20.2)
42
(24.7)
36
(21.2)
25
(14.7) 0.24
46
(27.1)
33
(19.4)
24
(14.1) 0.04
TMT-B
221
(52.2)
73
(51.8)
78
(55.3)
70
(49.6) 0.57
74
(52.5)
76
(53.9)
71
(50.4) 0.95 aGeneralized linear models were adjusted for age.
bSubstantial cognitive decline was defined as ≥ 3 points on the MMSE from baseline to three years later and as the worst 10% of the distribution
of subtracting baseline from three year follow-up scores in seconds or test discontinued at follow-up for the Trails A and B.
SD = standard deviation; IQR = interquartile range; BMI = body mass index; CES-D = center for epidemiologic studies depression scale; MMSE
= mini-mental state examination; TMT = trail making tests.

16
Table 2. Logistic regression models describing the association between total urinary polyphenols (TUP) tertiles and three-year substantial
cognitive decline in older subjects
MMSEa
TMT-Aa
TMT-Ba
Cut-off No. of
cases
OR
(95% CI) Cut-off
No. of
cases
OR
(95% CI) Cut-off
No. of
cases
OR
(95% CI)
mg GAE/d n
mg GAE/d n
mg GAE/d n
Model Ab
Tertile 1 <126.4 80
1
(reference)
<133.2 46 1
(reference)
<135.8 74 1
(reference)
Tertile 2 126.4-
175.5 71
0.82
(0.55-1.21)
133.2-
183.7 33
0.56
(0.32-0.97)
135.8-
186.8 76
0.99
(0.60-1.64)
Tertile 3 >175.5 52 0.53
(0.35-0.80)
>183.7 24 0.50
(0.28-0.89)
>186.8 71 0.90
(0.54-1.49)
P-trendc
0.003
0.02
0.67
Continuous
(log2)
203 0.69
(0.52-0.92)
103 0.60
(0.41-0.90)
221 1.03
(0.71-1.50)
Model Bd
Tertile 1 <126.4 80
1
(reference)
<133.2 46
1
(reference)
<135.8 74
1
(reference)]
Tertile 2
126.4-
175.5
71
0.79
(0.51-1.22)
133.2-
183.7
33
0.55
(0.31-0.99)
135.8-
186.8
76
1.08
(0.63-1.84)
Tertile 3 >175.5 52 0.53
(0.34-0.85)
>183.7 24 0.52
(0.28-0.96)
>186.8 71 0.95
(0.56-1.62)
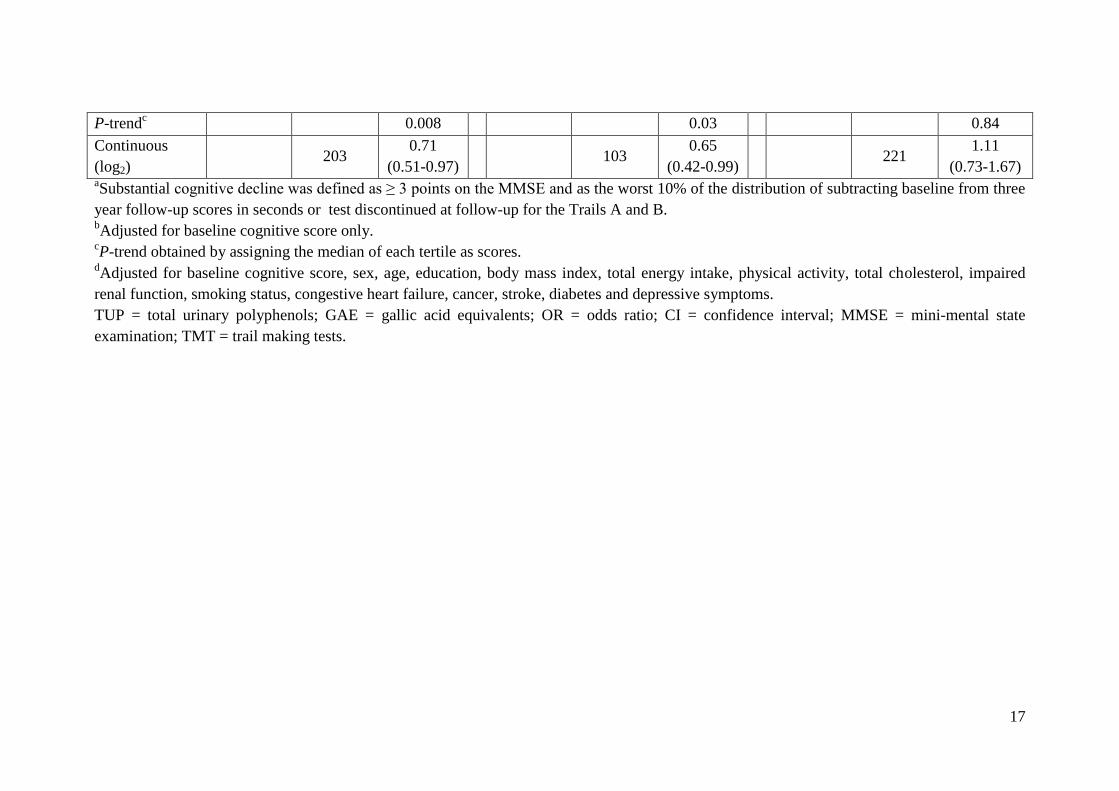
17
P-trendc
0.008
0.03
0.84
Continuous
(log2)
203 0.71
(0.51-0.97)
103 0.65
(0.42-0.99)
221 1.11
(0.73-1.67) aSubstantial cognitive decline was defined as ≥ 3 points on the MMSE and as the worst 10% of the distribution of subtracting baseline from three
year follow-up scores in seconds or test discontinued at follow-up for the Trails A and B. bAdjusted for baseline cognitive score only.
cP-trend obtained by assigning the median of each tertile as scores.
dAdjusted for baseline cognitive score, sex, age, education, body mass index, total energy intake, physical activity, total cholesterol, impaired
renal function, smoking status, congestive heart failure, cancer, stroke, diabetes and depressive symptoms.
TUP = total urinary polyphenols; GAE = gallic acid equivalents; OR = odds ratio; CI = confidence interval; MMSE = mini-mental state
examination; TMT = trail making tests.
18
Figure 1. Flow chart of participants at each stage of the study.
MMSE = mini-mental state examination; TMT = trail making tests.
19
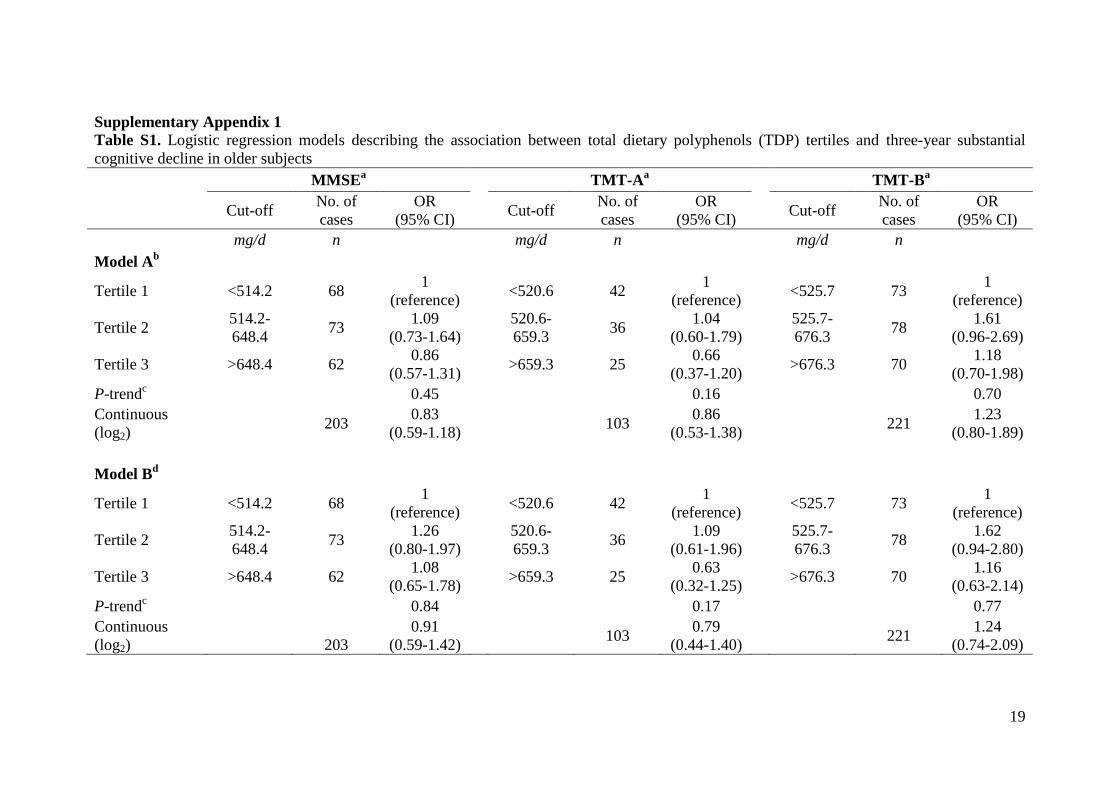
Supplementary Appendix 1
Table S1. Logistic regression models describing the association between total dietary polyphenols (TDP) tertiles and three-year substantial
cognitive decline in older subjects
MMSEa
TMT-Aa
TMT-Ba
Cut-off No. of
cases
OR
(95% CI) Cut-off
No. of
cases
OR
(95% CI) Cut-off
No. of
cases
OR
(95% CI)
mg/d n
mg/d n
mg/d n
Model Ab
Tertile 1 <514.2 68
1
(reference)
<520.6 42 1
(reference)
<525.7 73 1
(reference)
Tertile 2 514.2-
648.4 73
1.09
(0.73-1.64)
520.6-
659.3 36
1.04
(0.60-1.79)
525.7-
676.3 78
1.61
(0.96-2.69)
Tertile 3 >648.4 62 0.86
(0.57-1.31)
>659.3 25 0.66
(0.37-1.20)
>676.3 70 1.18
(0.70-1.98)
P-trendc
0.45
0.16
0.70
Continuous
(log2)
203 0.83
(0.59-1.18)
103 0.86
(0.53-1.38)
221 1.23
(0.80-1.89)
Model Bd
Tertile 1 <514.2 68
1
(reference)
<520.6 42 1
(reference)
<525.7 73 1
(reference)
Tertile 2 514.2-
648.4 73
1.26
(0.80-1.97)
520.6-
659.3 36
1.09
(0.61-1.96)
525.7-
676.3 78
1.62
(0.94-2.80)
Tertile 3 >648.4 62 1.08
(0.65-1.78)
>659.3 25 0.63
(0.32-1.25)
>676.3 70 1.16
(0.63-2.14)
P-trendc
0.84
0.17
0.77
Continuous
(log2)
203
0.91
(0.59-1.42)
103 0.79
(0.44-1.40)
221 1.24
(0.74-2.09)

20
aSubstantial cognitive decline was defined as ≥ 3 points on the MMSE and as the worst 10% of the distribution of subtracting baseline from three
year follow-up scores in seconds or test discontinued at follow-up for the Trails A and B. bAdjusted for baseline cognitive score only.
cP-trend obtained by assigning the median of each tertile as scores.
dAdjusted for baseline cognitive score, sex, age, education, body mass index, total energy intake, physical activity, total cholesterol, impaired
renal function, smoking status, congestive heart failure, cancer, stroke, diabetes and depressive symptoms.
TDP = total dietary polyphenols; OR = odds ratio; CI = confidence interval; MMSE = mini-mental state examination; TMT = trail making tests.